Article

COS Attenuates AFB1-Induced Liver Injury in Medaka through Inhibition of Histopathological Damage and Oxidative Stress

1
College of Food Sciences and Technology, Shanghai Ocean University, Shanghai 201306, China
2
Shanghai Engineering Research Center of Aquatic Product Processing & Preservation, Shanghai 201306, China
3
Laboratory of Quality and Safety Risk Assessment for Aquatic Product on Storage and Preservation, Ministry of Agriculture and Rural Affairs, Shanghai 201306, China
*
Author to whom correspondence should be addressed.
Sustainability 2023, 15(6), 5418; https://doi.org/10.3390/su15065418
Submission received: 27 February 2023 / Revised: 11 March 2023 / Accepted: 14 March 2023 / Published: 18 March 2023
(This article belongs to the Special Issue Sustainable Food Technology for Microbial Safety)

Abstract

:
Aflatoxin B1 (AFB1) –induced liver damage may be treated with chitosan oligosaccharide (COS), a small-molecular–weight oligosaccharide with excellent bioactivity and antioxidant potential. Hepatotoxicity induced by AFB1 single acute exposure (ASAE) has been theoretically established but the mechanism of toxicity in aquatic models has been less studied. In this paper, a model of liver injury in Japanese medaka (Oryzias latipes) after ASAE for 72 h and a model of liver injury healing after ASAE following a COS intervention for 72 h were developed. The different effects of ASAE and COS interventions for ASAE were analyzed at the phenotypic and genetic levels. The results showed that AFB1 reduced body weight and hepatopancreatic somatic indices (HSI) in medaka. Moreover, AFB1–induced histopathological damage and oxidative stress injury were concentration–dependent but the symptoms of damage were attenuated to some extent by the addition of the intervention drug COS, and the intervention effect of high concentrations of COS was almost identical to silymarin (SIL). Using the RNA–Seq technique, COS reduces the number of differentially expressed genes (DEGs) brought about by AFB1. Among the genes associated with tumors, hepatocellular carcinoma and hepatitis aurka, thbs1, serpine1, fabp7, and dusp5 were also validated by Q-PCR with corresponding trends. In conclusion, AFB1 can cause liver injury in medaka and COS has a therapeutic effect, and these impacted genes have the potential to become therapeutic targets for COS intervention in AFB1–induced liver disease.

1. Introduction

The fungi Aspergillus flavus and Aspergillus parasiticus are the principal producers of aflatoxin, which is widely spread in the soil and frequently contaminates crops including rice, corn, and peanuts [1,2]. Aflatoxin contamination is generally difficult to regulate due to its excellent thermal stability as well as its ability to maintain stable characteristics in both acidic and neutral solutions [2]. Aflatoxins include aflatoxin B1, B2, G1, G2, M1, and M2. AFB1 is one of the most dangerous aflatoxins and is now recognized as a class I carcinogen [3]. The primary biological risks associated with AFB1 are carcinogenesis, immunotoxicity, DNA mutation, and significant hepatotoxicity [4]. AFB1 does not directly cause cancer; instead, it only does so in vivo through a series of conversion processes that result in liver immunotoxicity and the generation of cytokines [5], which in turn causes hepatocyte death. The carcinogenic chemicals are only indirectly created by a sequence of in vivo reactions, such as CYP1A2’s conversion of AFB1 to AFBO [6,7], or, with Aflatoxin B1–8, 9–epoxide (AFBO), which has a high capacity for oxidation and can cause a significant increase in the body’s production of reactive oxygen species (ROS) [8]. Large–scale ROS generation may disrupt the dynamic equilibrium of the redox system, resulting in oxidative stress, and, in rare cases, assault cells, resulting in cell damage and an amount of apoptosis [9,10].
A naturally occurring oligosaccharide called chitosan oligosaccharide (COS) is frequently employed in anti-tumor, anti–inflammatory, anti–obesity, and antioxidant applications [11,12,13]. COS can effectively function as an anti-inflammatory and antioxidant in damaged liver tissue by inhibiting cytoplasmic division and reducing reactive oxygen species (ROS). Moreover, it can successfully alter the detrimental tissue changes occurring in the liver, reducing hepatocyte apoptosis [14,15]. This implies that COS may be a possible therapeutic drug for the management of acute liver injury caused by AFB1. However, to fully comprehend the role of COS in AFB1-induced acute liver injury and its underlying molecular pathways, more study is necessary.
Some small aquatic models, including medaka, have developed into ideal models with many advantages in experimental investigations due to the requirement that biological models be easier to reproduce and more productive, to improve the reliability of experimental data. In addition, AFB1 is also easily contaminated in aquatic feeds, increasing the potential for aquatic organisms to be exposed to AFB1 [16]. Furthermore, marine products are of great importance in human nutrition. In this article, we used the freshwater Japanese medaka as our study subject and used the ASAE model to conduct a preliminary analysis of the acute liver injury brought on by COS intervention with AFB1. Silymarin (SIL), a natural hepatoprotective drug [17,18], was included in this study for comparative purposes of the COS’s protective effects against AFB1. The correlation between genetic variation and phenotype can be classified as direct, indirect, and mixed effects of variation [19]. So in the meantime, we examined RNA–Seq data to find potential target genes for AFB1–induced acute liver injury and to establish a foundation for future research into a liver disease cure based on the development of severe phenotypic damage.

2. Materials and Methods

2.1. Chemicals

Aflatoxin B1 (≥99%) was purchased from Shanghai Acmec Biochemical Co., Ltd. (Shanghai, China), dimethyl sulfoxide (DMSO) was purchased from Sangon Biotech Co., Ltd. (Shanghai, China), chitosan oligosaccharide (COS) was purchased from Shandong Weikang Biomedical Technology Co., Ltd. (Linyi, China), and silymarin (SIL) was purchased from Tianshili Pharmaceutical Co., Ltd.(Tianjin, China). Assay kits for the measurements of aspartate aminotransferase (AST), serum alanine aminotransferase (ALT), superoxide dismutase (SOD), catalase (CAT), reduced glutathione (GSH), and malondialdehyde (MDA) were purchased from Nanjing Jiancheng Bioengineering Institute (Nanjing, China). Assay kits were purchased for the total RNA extraction, PowerUP SYBR Green Master Mix (Thermo Fisher Scientific, Waltham, MA, USA), and HiScript III-RT SuperMix for qPCR (Vazyme, Nanjing, China).

2.2. Animals

Medaka (wild–type, HdrR strains), fed three times daily on a basal diet, were kept at 26 °C on a 14 h light/10 h dark cycle [20]. In addition, dissolved oxygen (6 mg/L) and pH (6.5–7.0) were controlled in fresh water in the culture. The use of medaka was approved by the Committee for Laboratory Animal Research at Shanghai Ocean University.

2.3. Experimental Design

Before the experiment, an appropriate number of four–month–old medaka were acclimated in several glass tanks for two weeks and then randomly divided into eight glass tanks. For toxicity experiments, the experimental fish were randomly divided into 8 different groups of 60 fish each: ASAE group (normal feeding three times daily), blank group (CK)—4% DMSO injection of 10 μL, only once; AFB1 low concentration (LA) group—0.25 g/L AFB1 intraperitoneal injection of 10 μL, only once; AFB1 high concentration (HA) group—1 g/L AFB1 intraperitoneal injection of 10 μL, only once (AFB1 dissolved in 4% DMSO). COS intervention ASAE group, blank control group (CK)—4% DMSO injection of 10μL, only once, normal feeding three times daily; positive drug control group (SIL)—1 g/L AFB1 intraperitoneal injection of 10 μL, only once, 0.5% silymarin in the basal diet, fed three times daily (three days before and three days after the injection); COS high concentration group (HCOS)—1 g/L AFB1 intraperitoneal injection of 10 μL, only once, 0.6% COS in the basal diet, fed three times daily (three days before and three days after the injection); COS low concentration group (LCOS)—1g/L AFB1 intraperitoneal injection of 10 μL, only once, 0.3% COS in the basal diet, fed three times daily (three days before and three days after the injection); model control group (AFB1)—1g/L AFB1 intraperitoneal injection of 10 μL, only once, normal feeding three times daily. The experimental concentration of AFB1 was determined based on references and pre–experimental results [21,22].
The normal growth of the medaka was unaffected by the DMSO concentration. To measure toxicological endpoints, all groups of medaka were exposed for 72 h before being captured and dissected. To prevent contaminants in the aquatic environment from having a negative impact on the experiment, each fish was carefully rinsed with Milli–Q water before being dissected. Four fish from each tank were chosen at random to have their livers removed for liver histopathology analysis, ten fish for biochemical analysis, and ten fish for RNA–Seq analysis. Before performing the biochemical and RNA-Seq analysis, the livers were kept at −80 °C.

2.4. Hepatic Pathological Examination

The livers of the CK and the experimental group of medaka were removed after being treated in 4% paraformaldehyde for 24 h. The liver tissues were dehydrated with various ethanols, embedded in paraffin, sectioned at 4–μm thickness, and then stained with hematoxylin and eosin (H&E). The morphology of liver tissue was observed at 40× and photographed with a Nikon DS–Ri2 camera under an upright microscope (Nikon, Tokyo, Japan).

2.5. Determination of Biochemical Indicators in Liver

The tissues were accurately weighed and the volume was added to pre-cooled saline at a ratio of 1:10, processed in a high–speed grinder, centrifuged at 2500 rpm for 10 min, and the supernatant was taken for dilution and enzyme activity was measured using a commercial kit (Nanjing Jiancheng, Bioengineering Institute, Nanjing, China). In addition, protein content was assessed by Coomassie blue staining. Three parallel measurements were set for each index. We mainly tested the following indicators: aspartate aminotransferase (AST), serum alanine aminotransferase (ALT), superoxide dismutase (SOD), catalase (CAT), reduced glutathione (GSH), and malondialdehyde (MDA).

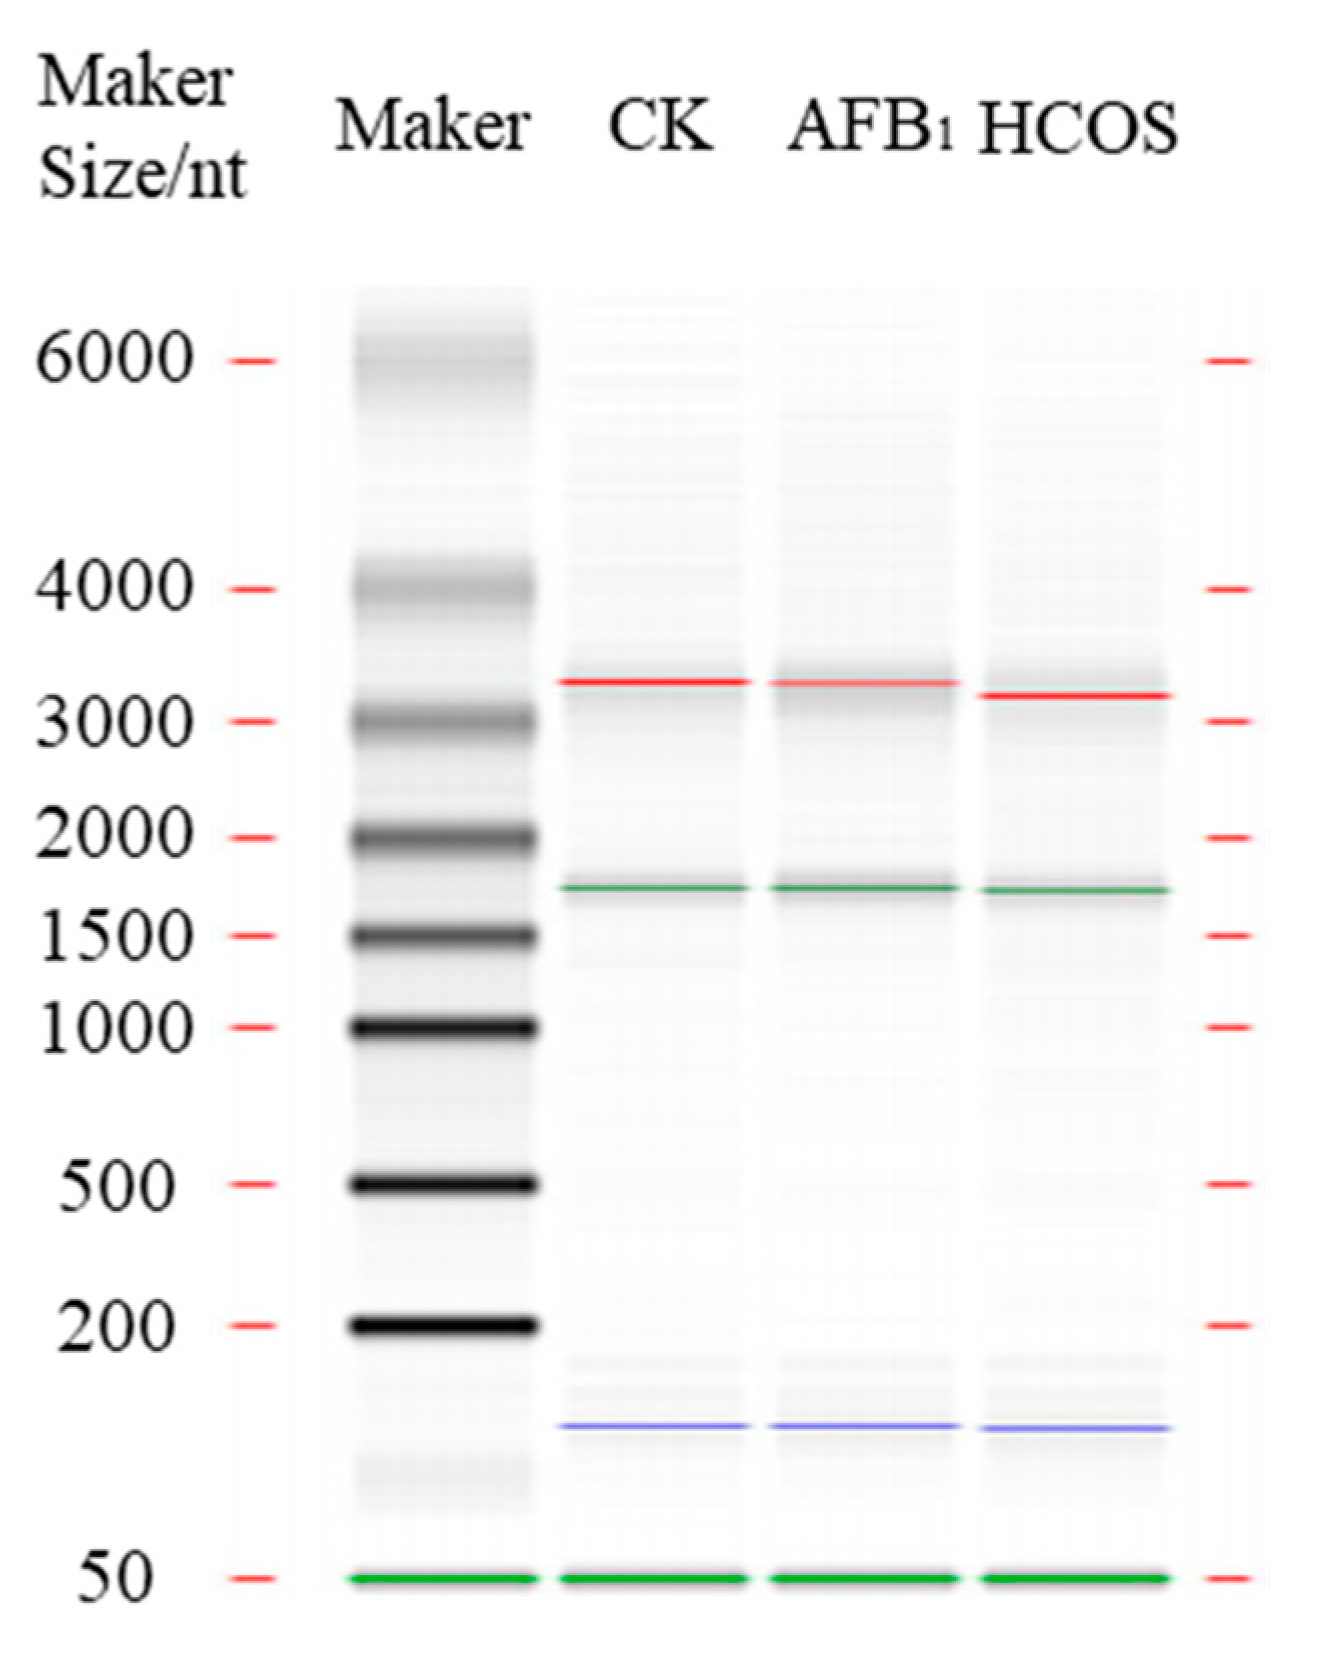
2.6. Illumina RNA Sequencing

Total RNA in medaka’s liver was extracted using the MagMAXTM mir VanaTM Total RNA Isolation Kit following the specification (Thermo ScientificTM KingFisherTM FlexTM, Espoo, Finland). Total RNA in each liver sample was quantified and qualified by Agilent 2100/2200 Bioanalyzer (Agilent Technologies, Palo Alto, CA, USA), NanoDrop (Thermo Fisher Scientific Inc., Waltham, MA, USA). One microgram of total RNA was used for the following library preparations. Illumina RNA sequencing experiments were performed using three parallel samples. Sequencing library construction and Illumina sequencing were performed at AZENTA.

2.7. Real-Time Quantitative PCR Analysis

To verify the reliability of the expression profiles observed in the RNA−Seq data, five genes were selected for real-time quantitative PCR (Q−PCR) analysis using the same experimental samples as in the RNA−Seq experiments. Total RNA was extracted using a King Fisher Flex automated nucleic acid extractor and a companion kit and was reverse transcribed after RNA electrophoresis to determine RNA quality. Primers designed by Primer 5 with β−Actin as internal reference are shown in Table 1, and relative expression was calculated according to the 2−△△ct relative quantification formula.

2.8. Statistical Analysis

All experimental data were analyzed by GraphPad Prism 8.0 (GraphPad Software, La Jolla, CA, USA), SPSS 26 (IBM, New York, NY, USA), and Origin 8.0 software (Origin Inc., Northampton, MA, USA). Analysis of variance (ANOVA) was performed followed by Tukey’s test with a confidence interval of 95% (p ≤ 0.05).

3. Results

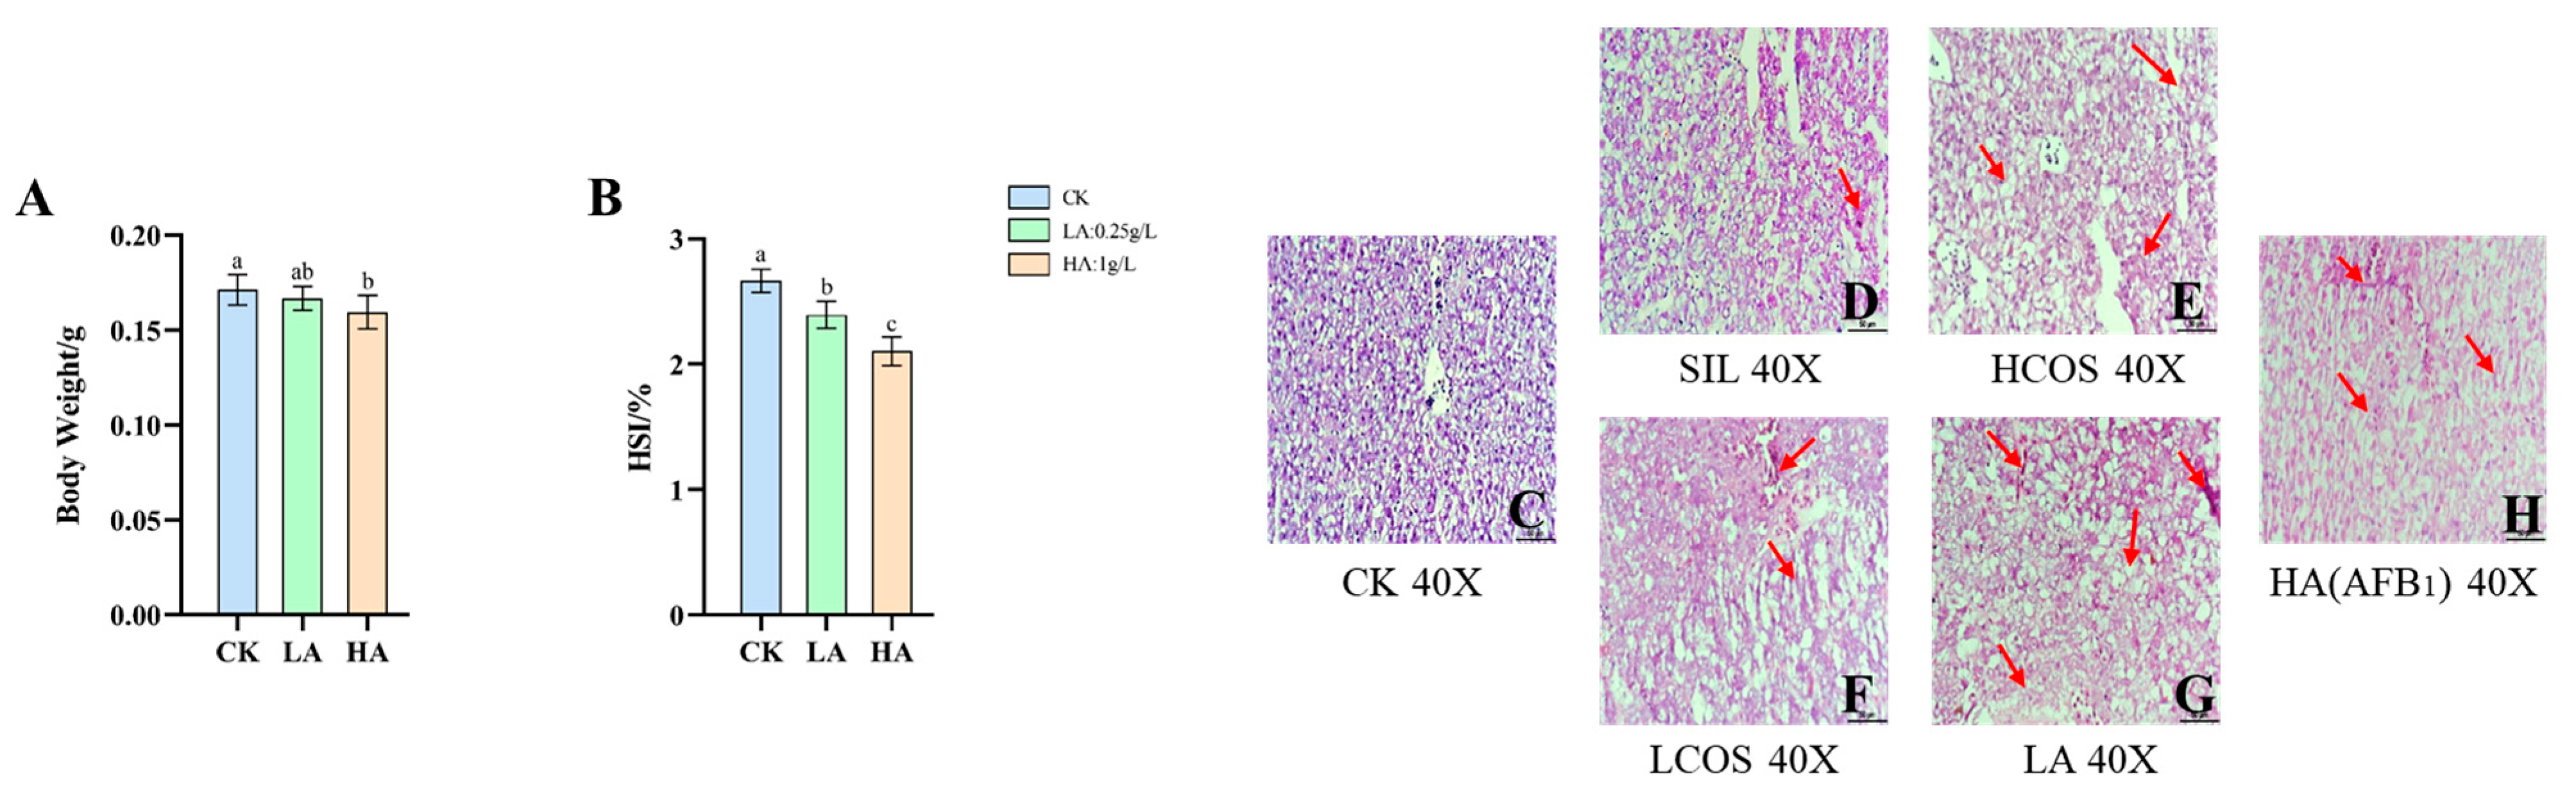
3.1. Body Weight and HSI Changes in Medaka

Figure 1A shows that after ASAE, the body weight of the medaka decreased as the AFB1 concentration increased, with significant differences between the CK and HA groups (p < 0.05). The hepatopancreas somatic indices, (HSI) = liver weight (g) × 100/body weight (g), were calculated and plotted (Figure 1B). Figure 1B shows that after ASAE, the HSI of medaka decreases as the AFB1 concentration increases, and there is a significant difference between the CK and LA groups (p < 0.05), an extremely significant difference between the CK and HA groups (p < 0.001), and a significant difference between the LA and HA groups (p < 0.05).

3.2. Histopathological Changes of Liver Tissue in Medaka

Representative histopathological examinations for each group are shown in Figure 1C–H. The CK group had a normal liver structure with clear nuclei and homogeneous cytoplasm (Figure 1C); the model group showed varying degrees of pathological changes in the liver of the medaka; the LA group showed cytoplasmic laxity, nuclear atrophy of hepatocytes, and vacuolation of hepatocytes (Figure 1G); the HA (AFB1) group (Figure 1H) showed marked hepatocellular edema and congestion; and the local lesions showed moderate punctate necrotic degeneration and more severe inflammatory cell infiltration with hepatocyte fibrosis and central venous congestion (Figure 1H). LCOS (Figure 1F) and HCOS (Figure 1E) showed different degrees of improvement in hepatic congestion and hepatocellular fibrotic tissue proliferation compared to the AFB1 (Figure 1H) group. Among them, the local edema congestion and lesions were significantly reduced in the HCOS and SIL groups (Figure 1D), while the improvement of hepatocyte vacuolization was better in the SIL group.

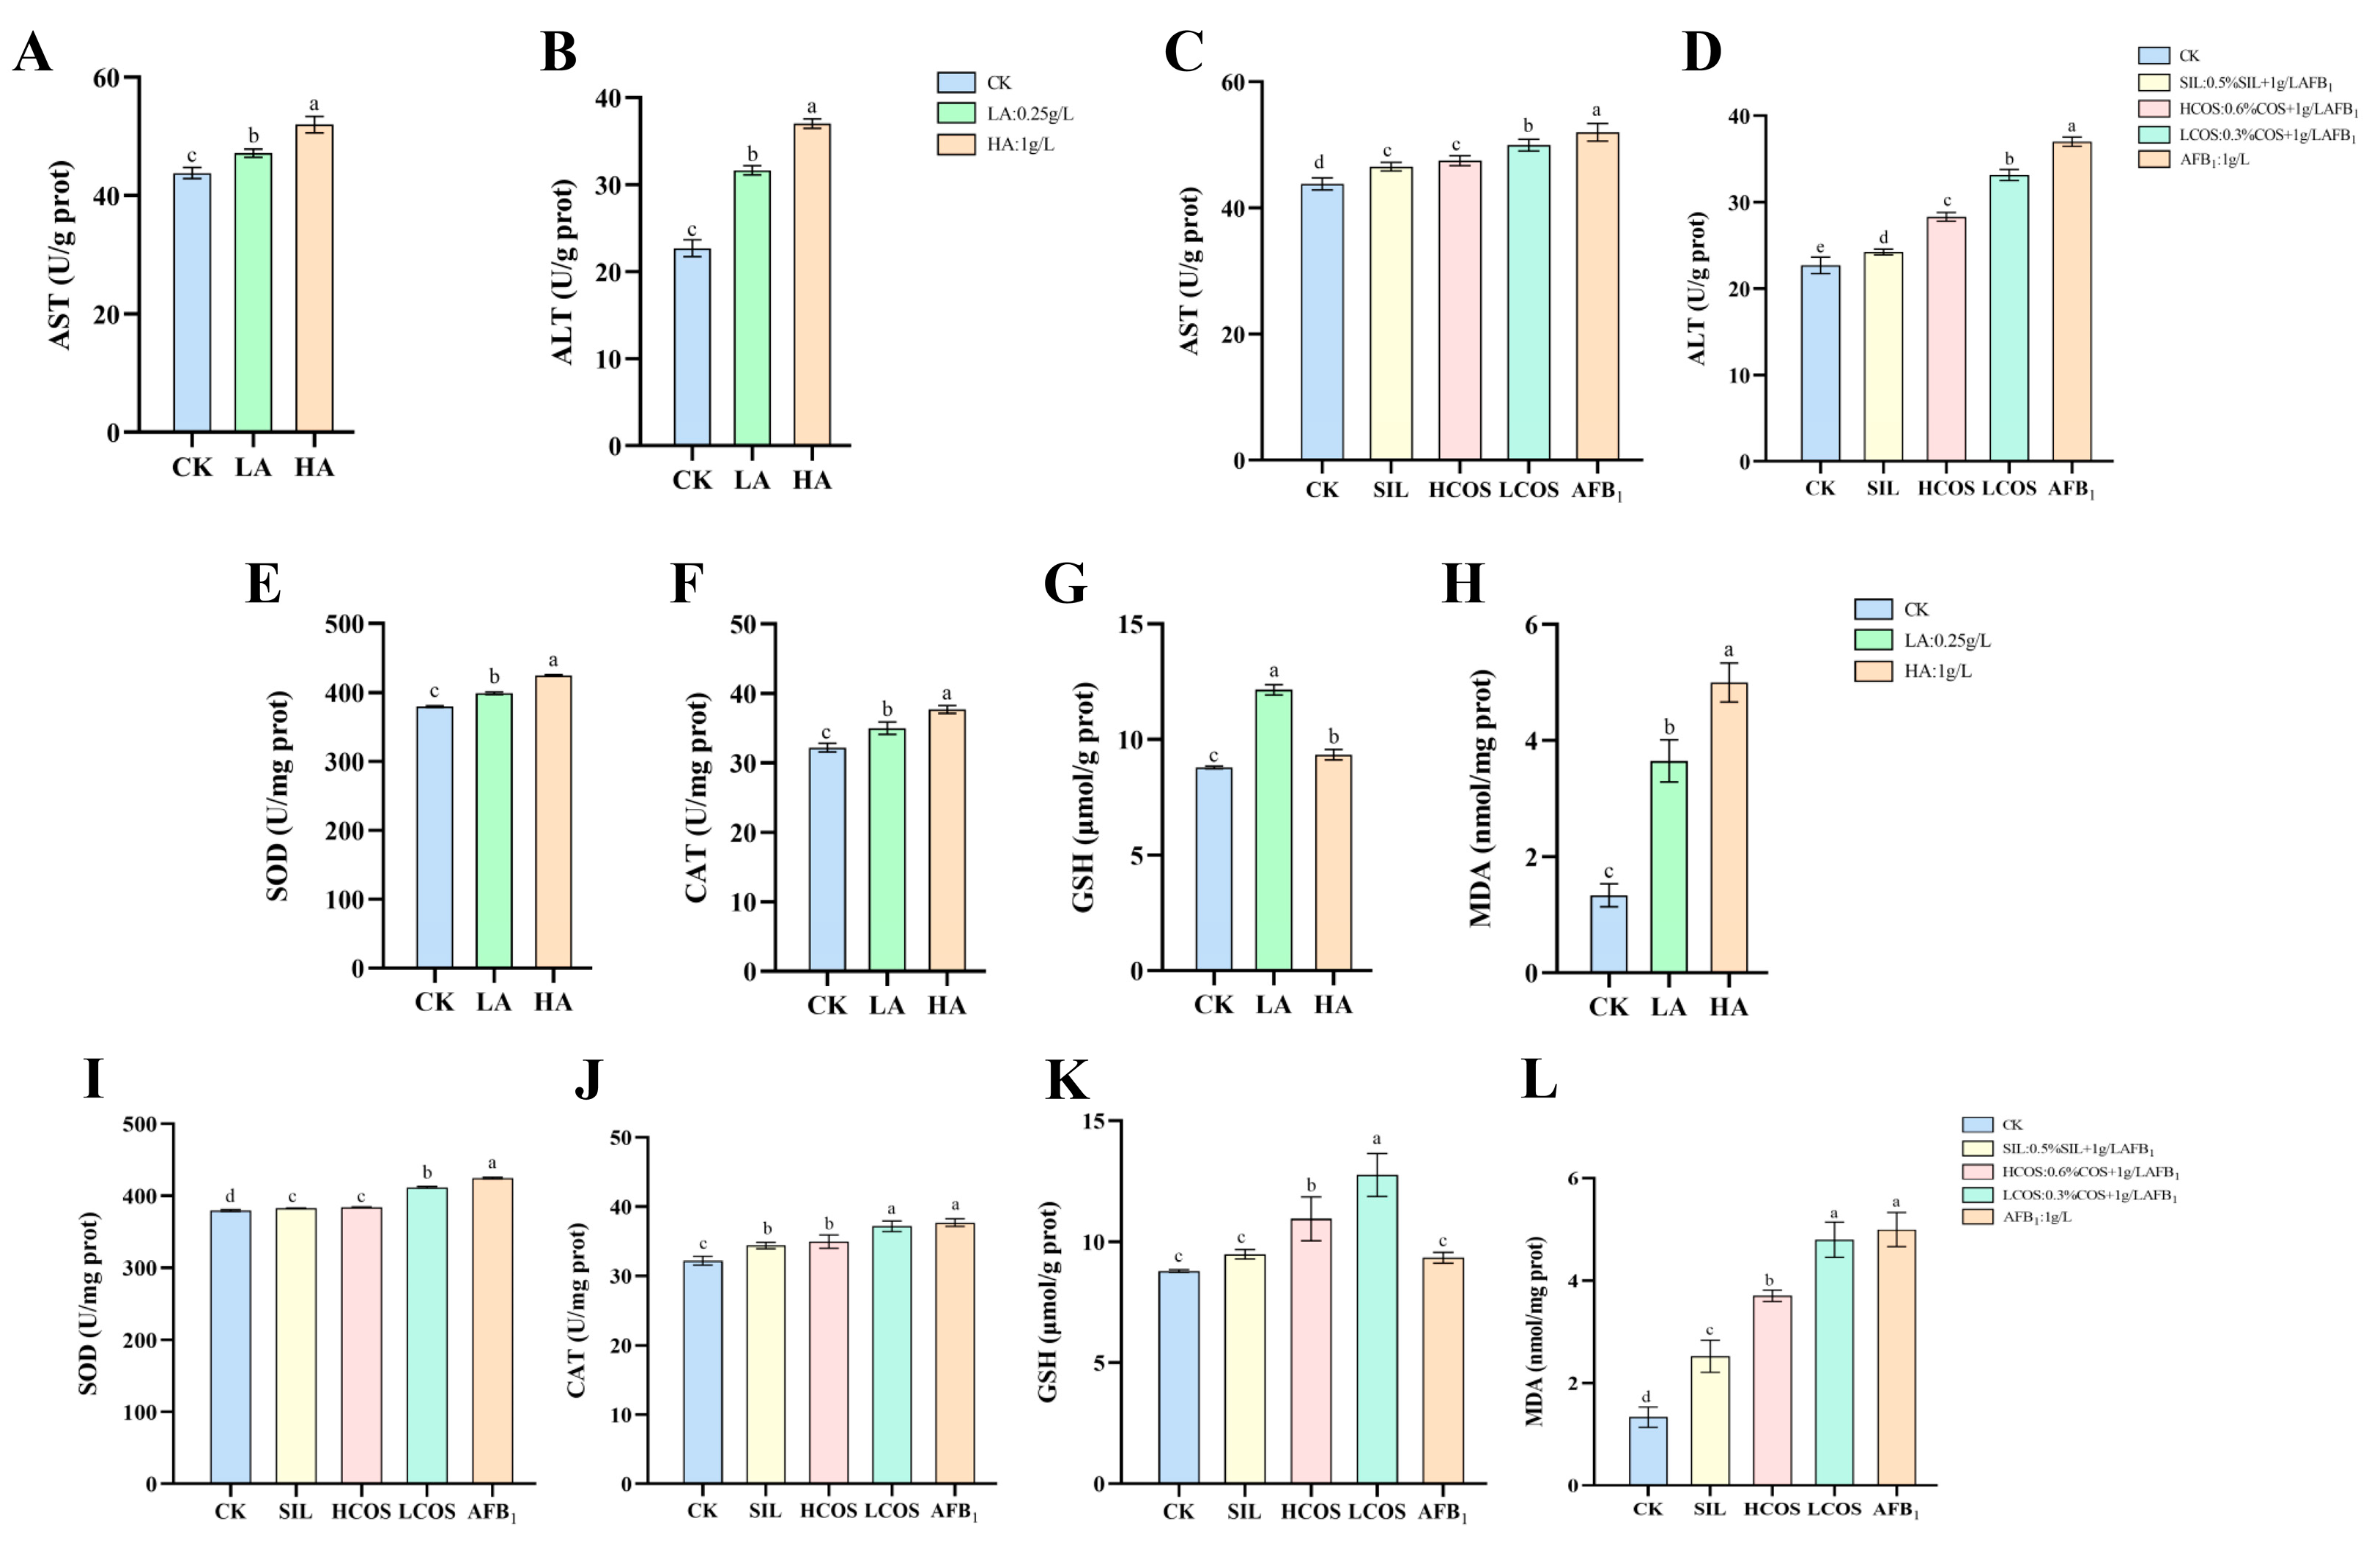
3.3. AFB1-Induced Liver Function Impairment

The transaminases ALT and AST are frequently used to assess liver injury. The ASAE group, Figure 2A,B, shows that both the AST and ALT activity increased after ASAE to varying degrees and this rise was positively correlated with the concentration of AFB1 injection, with significant differences between each group (p < 0.001). The COS intervention in the ASAE group, Figure 2C,D, shows that there was some inhibition of both AST and ALT activity with COS intervention, and it also indicated a better benign intervention in the HCOS group, almost close to the positive control SIL group but still significantly different from the activity in the CK group (p < 0.001).

3.4. AFB1-Induced Oxidative Stress in Liver

In the ASAE group, as shown in Figure 2E–H, the enzymatic activities of SOD, CAT, and the contents of GSH and MDA related to oxidative reactions were significantly increased in the LA group, and in the HA group, the activities of SOD, CAT, and the content of MDA were still increasing. However, the content of GSH was inhibited at the high concentration of AFB1, which may be related to the damage to the antioxidant system. Significant differences were found in each group (p < 0.001). In the COS intervention in the ASAE group, Figure 2I–L demonstrates that the COS intervention effect is evident. When compared to the results of the ASAE group, we can deduce that the higher the concentration of COS, the better the effect on intervening AFB1–induced liver damage, and in the enzyme activity assay of SOD and CAT it is apparent that the effect of high concentrations of COS is no longer significantly different from that of the positive control, which indicates that COS already has a certain protective effect on the liver.

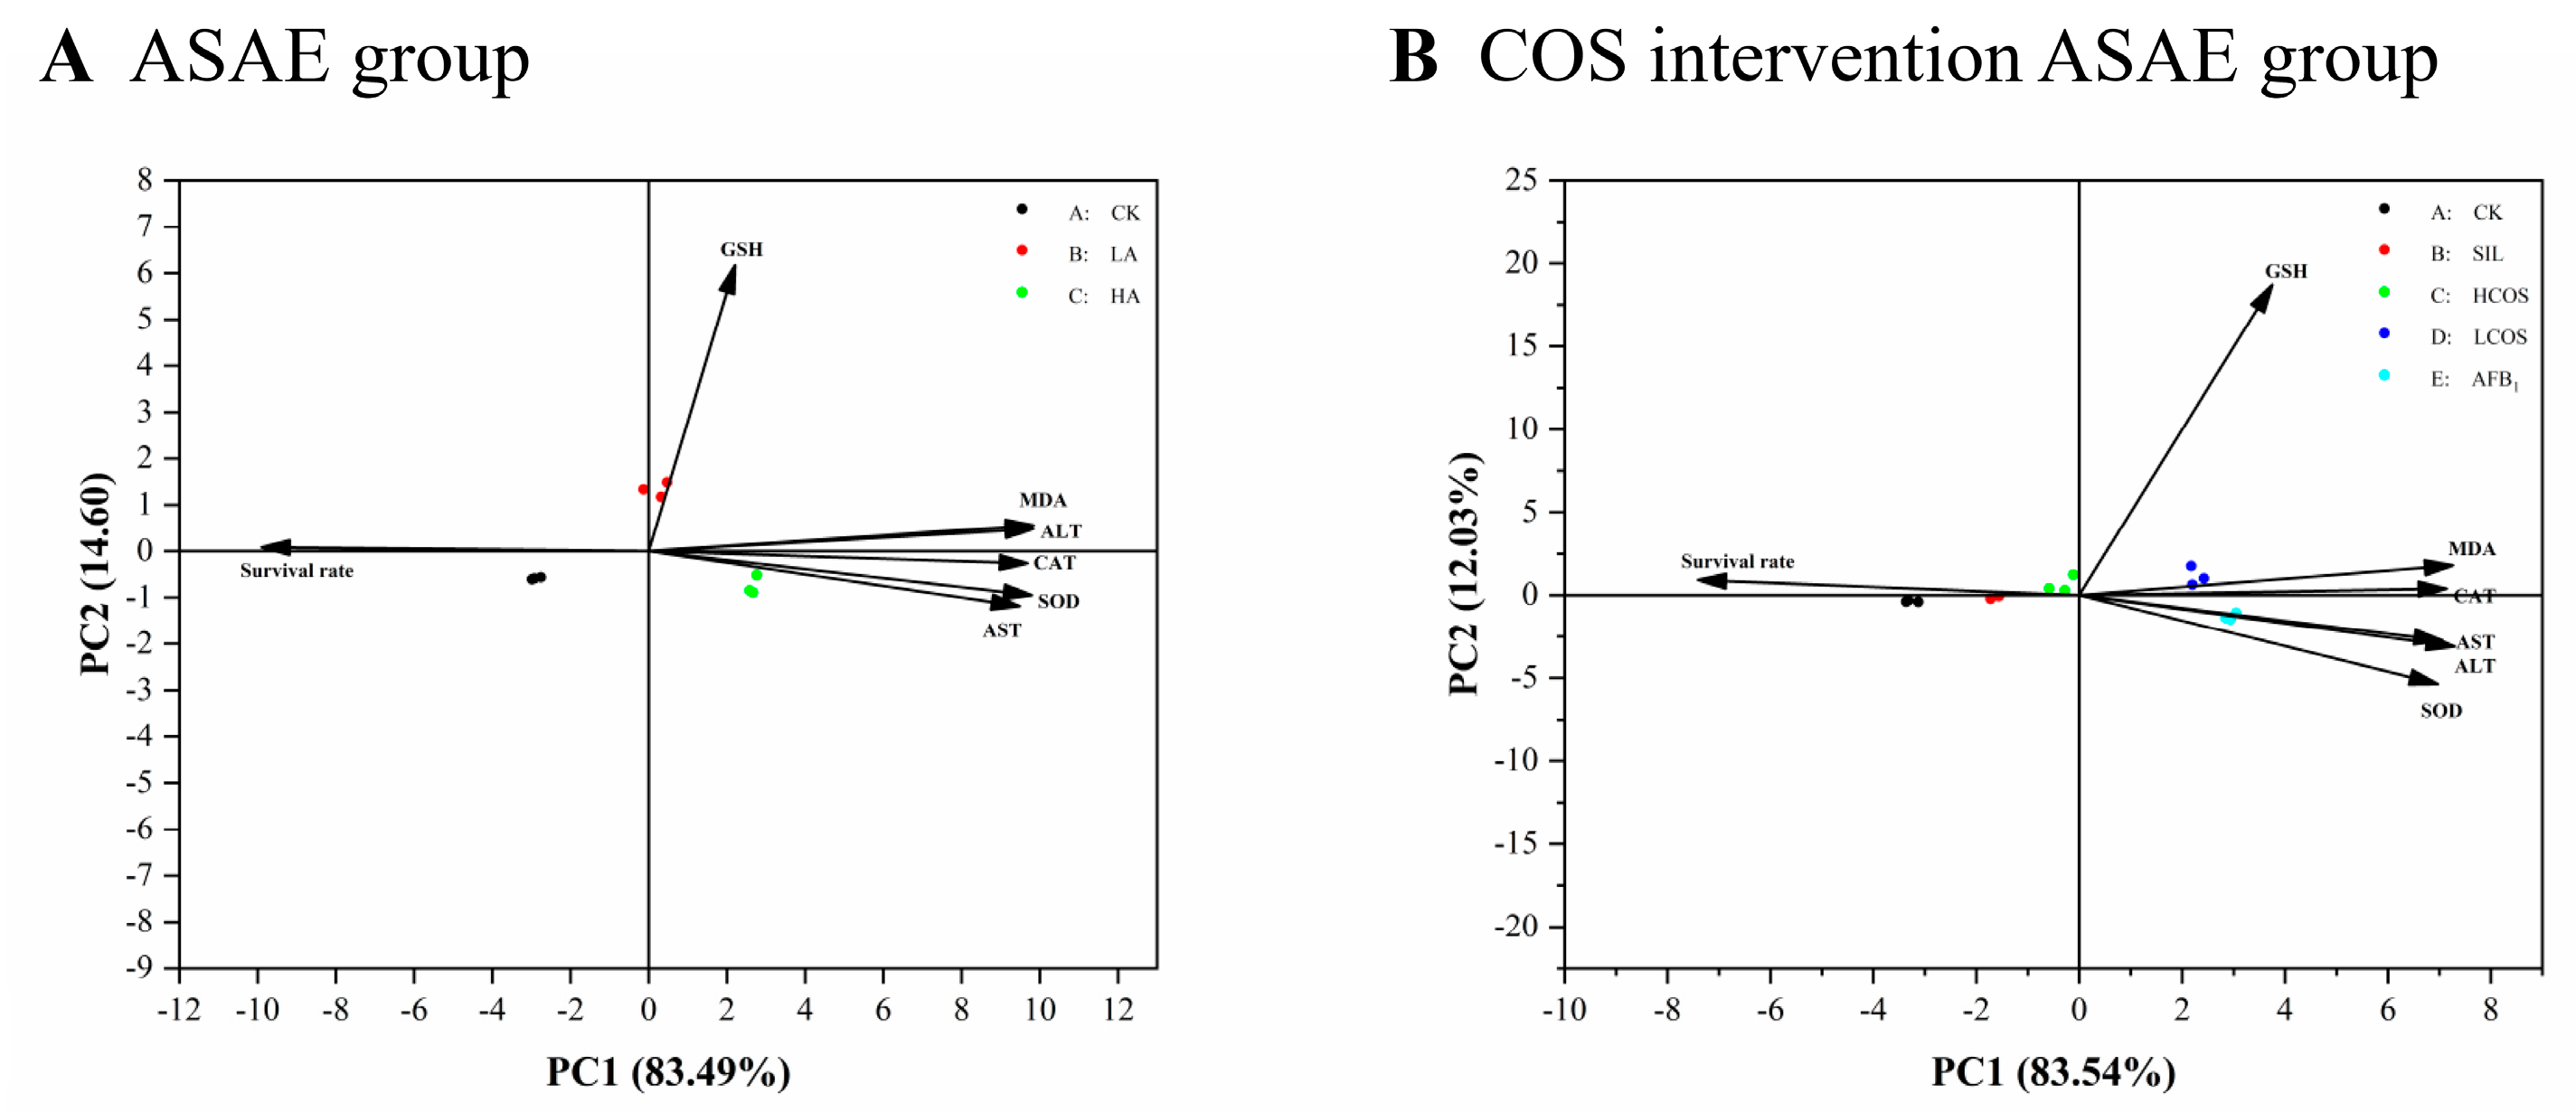
3.5. Principal Component Analysis of Enzyme Activity

The principal component analysis showed that 98.09% of the overall variation in the ASAE group (Figure 3A) was explained by two principal components throughout the experiment, with PC1 accounting for 83.49% of the overall variation. Low and high concentrations basically induced most of the changes in enzyme activities and contents, including AST, ALT, SOD, CAT, GSH, and MDA, with GSH mainly induced by the low concentrations. In total, 95.57% of the overall variation in the ASAE group with COS intervention (Figure 3B) was explained by two principal components, with PC1 accounting for 83.54% of the overall variation. Low COS intervention and AFB1 were the main factors for changes in AST, ALT, SOD, CAT, GSH, and MDA, and SIL and high COS interventions positively influenced the survival rate.

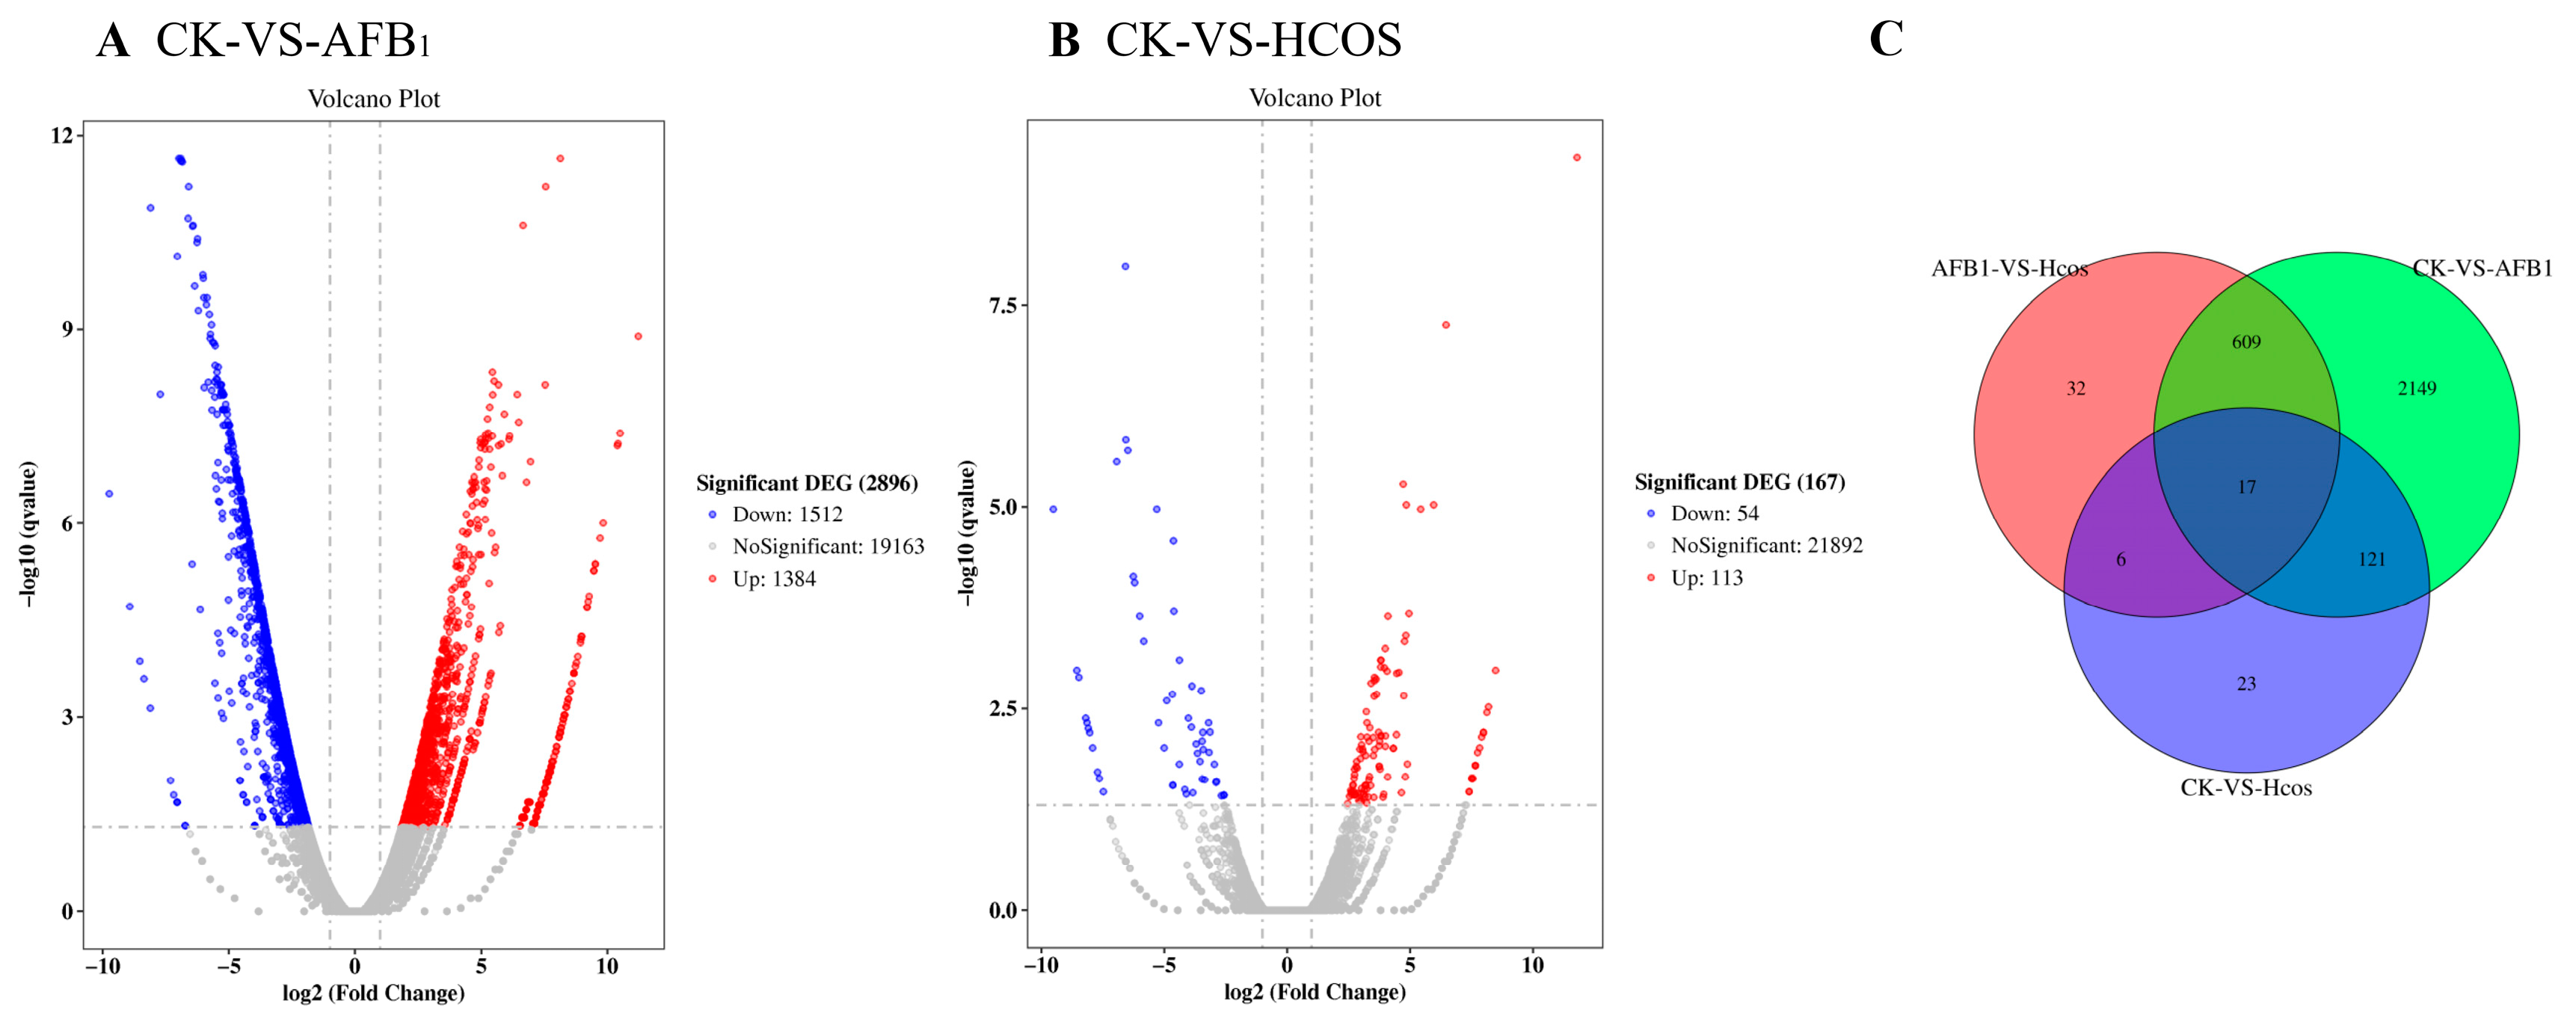
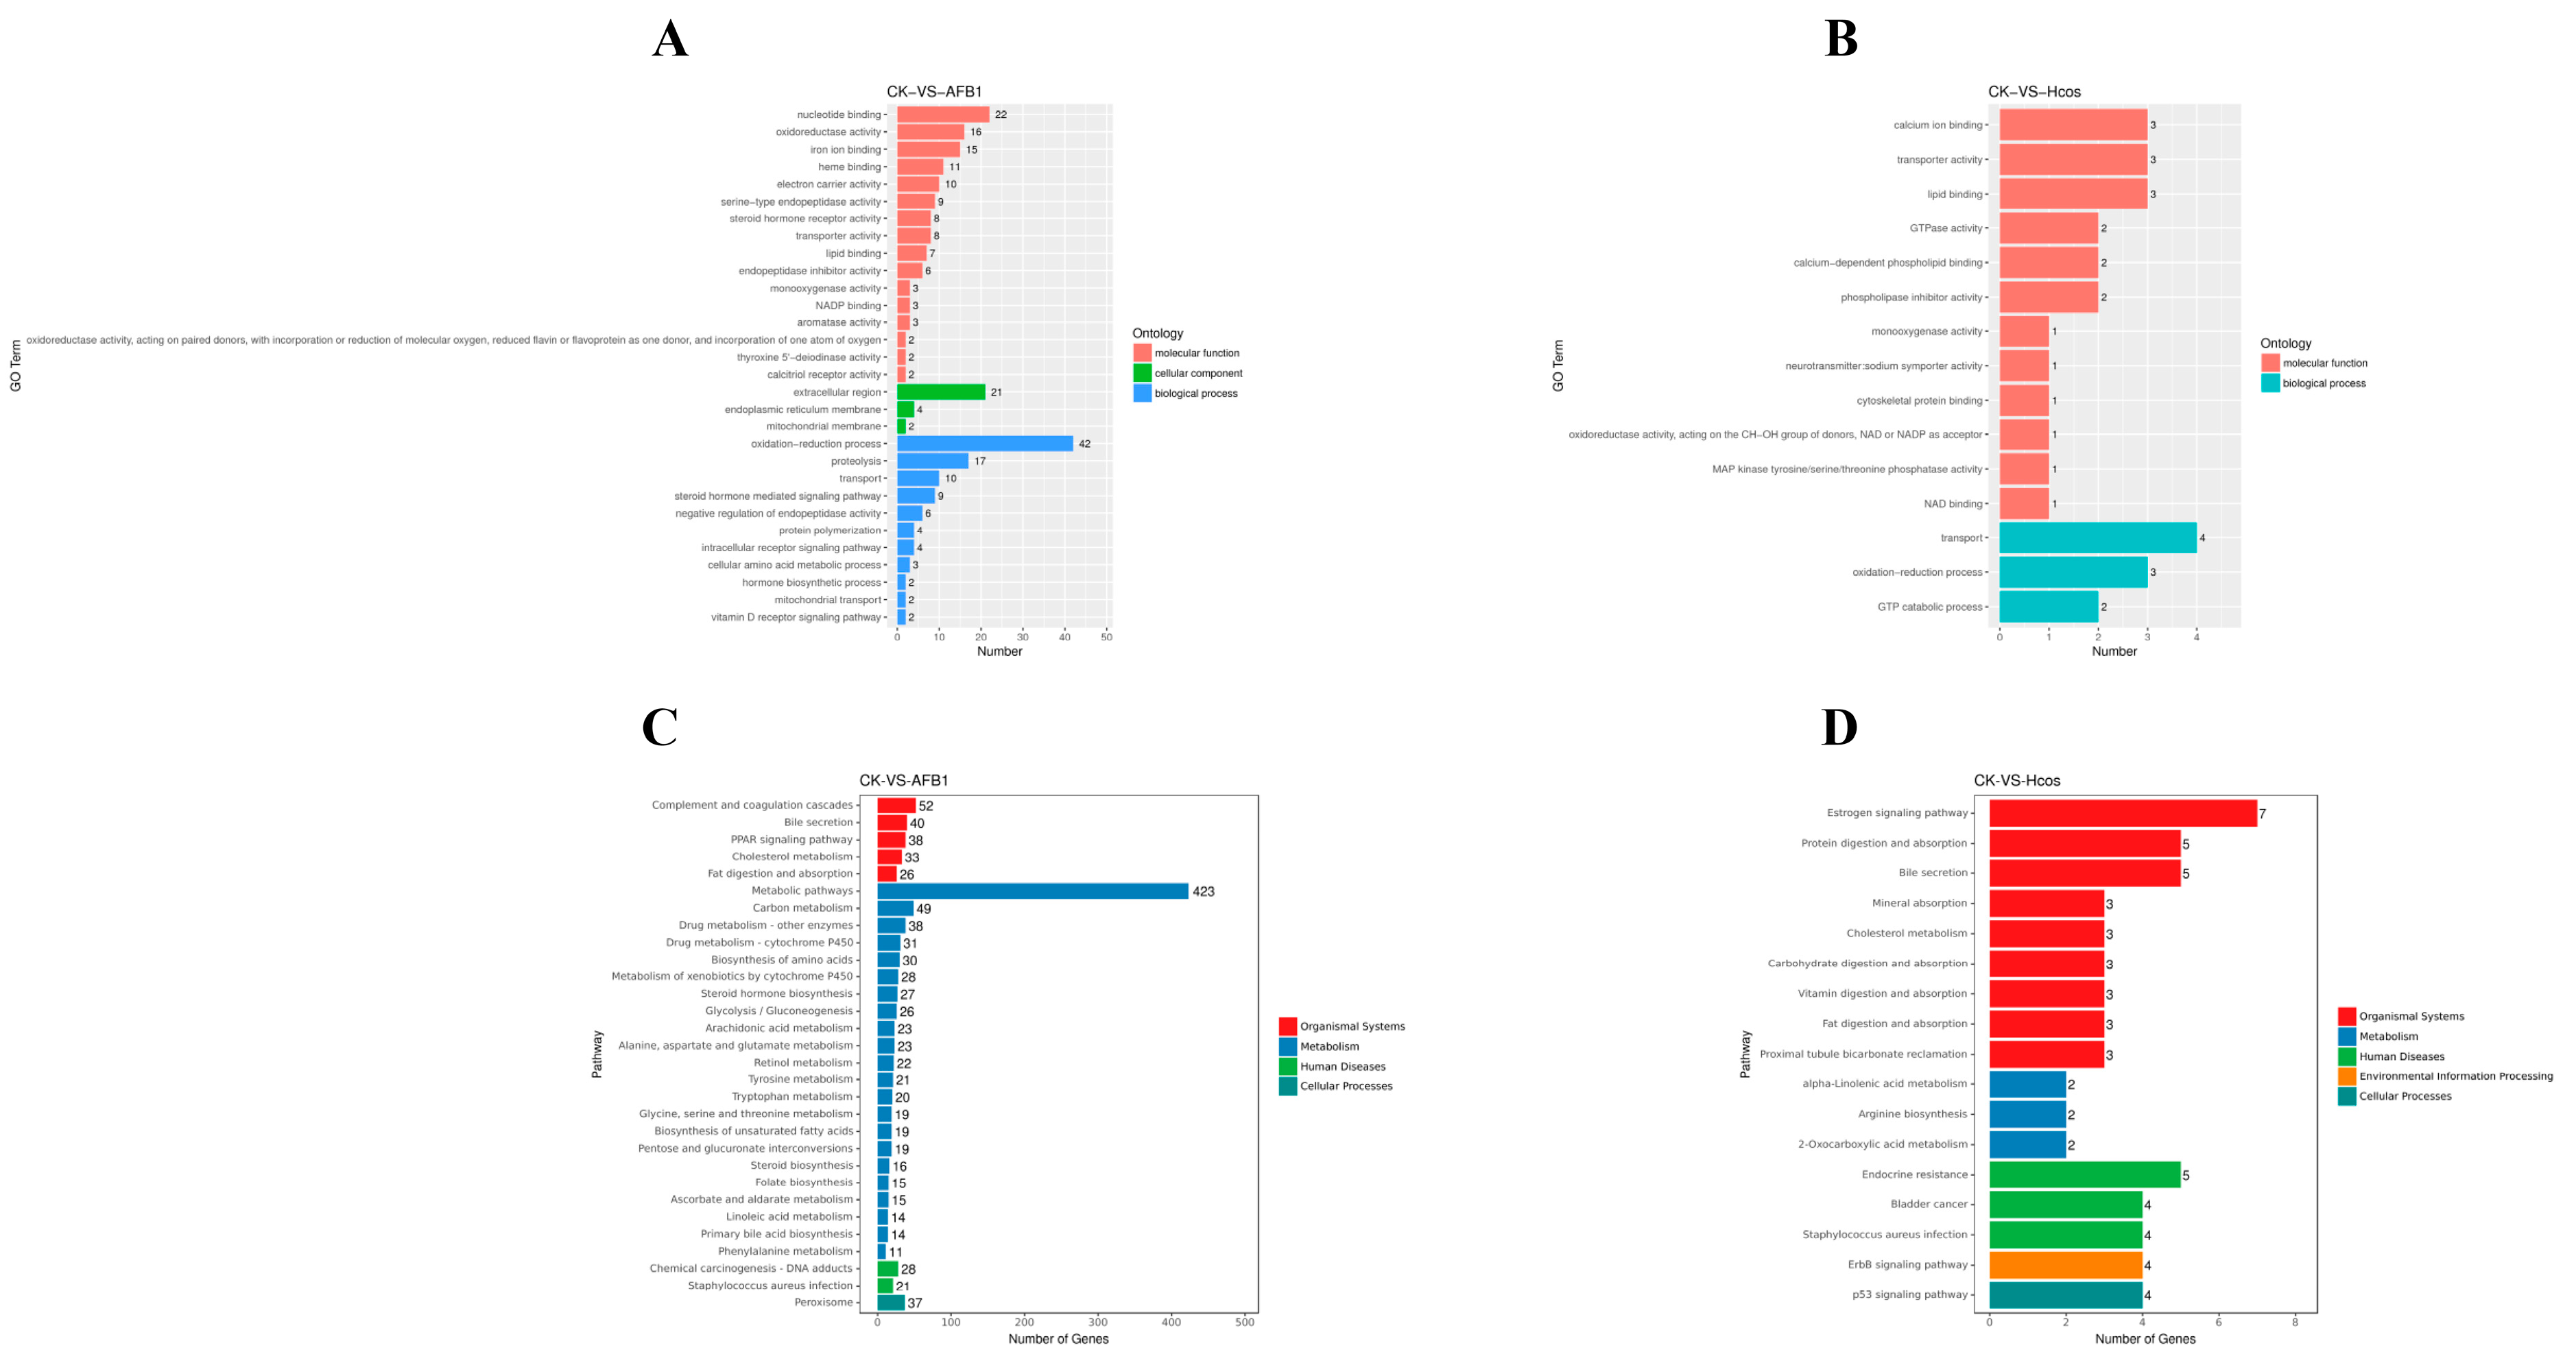
3.6. Expression and Functional Analysis of Differential Genes

In this study, we used the RNA−Seq method to assess the differentially expressed genes (DEGs) between the AFB1 group, the HCOS group, and the CK group and mapped the differential gene volcanoes (Figure 4A,B). The results of the assay were screened according to the differential significance criteria (FDR ≤ 0.05 and |log2FC| ≥ 1), and the up– and down–regulation of gene significant differential expression were counted. The differential gene volcano plot showed that there were 2896 DEGs in the AFB1 and CK groups, of which 1512 genes were down–regulated and 1384 genes were up–regulated; there were 167 DEGs in the HCOS and CK groups, of which 54 genes were down–regulated and 113 genes were up–regulated. From this data, it can be seen that the toxic effect of AFB1 considerably raises the number of DEGs and the number of DEGs decreased following the high concentration of COS intervention. Figure 4C shows the amount of DEGs common to each group as well as the total number of DEGs for a better analysis.
To compare the differences in the functions of the differential genes between the three groups, we performed the GO enrichment analysis. The GO enrichment analysis method used in this study was GO seq. The differential gene GO enrichment histogram is shown in Figure 5A,B. Based on the results of this analysis, it can be visualized that these genes are mainly enriched in biological processes and molecular functions. We also performed a differential gene KEGG enrichment analysis to look into the biological roles of various genes that cooperate within the organism. These genes are primarily enriched in the following four different kinds of biological metabolic pathways, as seen in Figure 5C,D, including organismal systems, metabolism, human diseases, and cellular processes.

3.7. Quantitative Validation

RNA integrity was verified by electrophoresis experiments using a fully automated nucleic acid electrophoresis analyzer, as shown in Figure 6. Among the DEGs, aurka, thbs1, serpine1, fabp7, and dusp5 were randomly selected for quantitative validation of predicted differential genes based on transcriptome sequencing data. The validation results are shown in Table 2. The genes sequenced by Q–PCR for transcriptome sequencing showed the same trend in different model groups.

4. Discussion

In this paper, we found that the damage to the liver caused by AFB1 increased with its concentration. The body weight of the medaka decreased with increasing AFB1 concentration, especially in the high concentration group (p < 0.05), and the hepatopancreas somatic indices showed a tendency to decrease, which may be related to AFB1–induced liver atrophy and hepatocyte apoptosis [23,24], thus negatively affecting liver function and body weight. Besides that, it has been discovered that AFB1 might cause organisms to consume less food, which can alter how well nutrients are absorbed because it impairs the body’s capacity to metabolize new foods [25].
In the pathological observation of the liver tissue of the medaka, we visualized by H&E staining that the concentration of AFB1 directly affects the degree of hepatocyte damage and that morphological damage to the liver is difficult to recover spontaneously within a short period, which is consistent with the results obtained in the previous literature on AFB1–induced liver damage [5,26].
Several enzyme activities impacting liver function were altered following ASAE in this study. According to the data, AST and ALT levels were concentration–dependent, with higher concentrations of COS interventions dramatically lowering AST and ALT activities. In fact, the high concentration of COS interventions was almost as potent as the liver protector SIL. AST and ALT are frequently used tests to determine whether the liver injury has occurred [27], it is obvious that AFB1 caused irreversible damage to the liver function of the medaka after intraperitoneal injection, and the results of this experiment are similar to those of other papers on AFB1–induced liver injury [28].
Another hepatotoxic mechanism of AFB1 is the triggering of a disruption of the oxidative stress response, which occurs when there is an imbalance in the production and elimination of reactive oxygen species (ROS) [29]. To maintain the balanced fish form, a well–developed antioxidant defense system is required to scavenge excess ROS [30] (e.g., SOD, CAT, GSH, and MDA), and changes in the activity of antioxidant enzymes, such as the content of GSH/MDA, are often used as early indicators of oxidative stress [31]. SOD and CAT are key enzymes in the antioxidant defense system [32]. Experimental data showed that both SOD and CAT activities increased after ASAE, suggesting that AFB1 activated the antioxidant defense system of the medaka after injection and that there was appropriate relief after COS intervention, which was determined by the concentration level of COS. The content of GSH was increased at lower concentrations of AFB1, and at high concentrations of AFB1, unexpected inhibition occurred in contrast to low concentrations of AFB1, probably due to the disruption of the antioxidant defense system already [33,34], and COS also interfered with AFB1–induced changes in the content of GSH. MDA is the final lipid peroxidation product, which can indirectly reflect the extent of free radical damage to the liver [35]. Based on the results of MDA measurements, we can see that both low and high concentrations of AFB1 significantly elevated the content of MDA relative to the blank group (p < 0.001) and that treatment with COS reduced the level of MDA appropriately. The abnormally large increase in MDA content is consistent with the findings of previous articles on the effect of AFB1 on lipid peroxidation [36]. According to principal component analysis, large concentrations of AFB1 generally boosted enzyme activity, and abnormally increased enzyme activity was adversely linked with survival rate. However, high concentrations of COS and the positive drug SIL contributed to the elevated survival rate.
The gene data obtained by RNA–Seq technique for each group revealed that the number of DEGs significantly increased after AFB1 intraperitoneal injection in each group but decreased after COS intervention, in which we randomly selected five genes with significant differences: aurka, thbs1, serpine1, fabp7, and dusp5. These genes were consistently affected and linked to liver damage. Aurka encodes a serine/threonine kinase that is crucial for the cell cycle since it serves with centrosome segregation, maturation, and the establishment of the two levels of the spindle, ensuring proper chromosome segregation in mitosis and ensuring cytoplasmic divisions are completed [37]. According to previous research, aurka can directly control the hepatocytes and macrophages in the liver to control liver regeneration. Our results indicate that aurka is abnormally amplified and overexpressed following exposure to AFB1, which may be connected to its function as a kinase that either directly or indirectly activates or inactivates a range of oncogenic proteins, hence encouraging the growth of liver tumors. Thbs1 also plays an important role in tumor progression and metastasis which was found to be highly expressed in the aggressive phenotype of melanoma and invasive ductal carcinoma [38,39]. Due to the fact that thbs1 contains multiple domains and is involved in various protein interactions, its relevant functions in tumors are complex [40]. Moreover, the abnormal elevation of thbs1 may also be associated with the formation of fatty liver [41], so we can reasonably speculate that AFB1 exposure may, to some extent, also induce the development of fatty liver in medaka. Serpine1 promotes tumor progression and angiogenesis by activating the VEGFR–2 signaling pathway, and its expression was positively correlated with the quantity of multiple immune cells infiltrating the tissue [42,43], which is consistent with the observations that AFB1 causes changes in enzyme activity earlier and that serpine1 promotes tumor angiogenesis. Serpine1’s elevated expression in the context of AFB1 exposure further suggests that carcinogenesis is partially triggered. Through controlling phagocytic activity and cytokine production, Fabp7 plays a role in the development of hepatitis and hepatocellular cancer. One study found that the lack of fabp7 impaired the phagocytosis of apoptotic cells [44]. The results of control RNA-Seq and Q–PCR studies revealed that AFB1 directly inhibited fabp7 gene expression, which in turn induced acute liver injury in the medaka. Dusp5 expression is elevated in hepatocytes via the PERK–CHOP pathway and may lead to hepatocyte death through inhibition of extracellular–signal–regulated kinase (ERK), which was verified by histopathological changes in the liver at high concentrations of AFB1, and the related literature has reported an elevated expression of dusp5 in all livers subjected to an acute injury [45].

5. Conclusions

In conclusion, COS can interfere with AFB1-induced acute liver injury in medaka. In this study, we investigated the effects of different concentrations of AFB1-induced acute liver damage and the intervention effects of different concentrations of COS. RNA–Seq and Q–PCR identified the aurka, thbs1, serpine1, fabp7, and dusp5 genes as potential targets for COS treatment of AFB1–induced liver disease but their effectiveness needs to be further investigated. The effect of COS intervention at high concentrations in this study was even comparable to the effect of SIL. In addition, the experimental results of this study give us a preliminary understanding of the mechanism of AFB1 on acute liver injury in fish and the intervention effect of COS but there are some limitations (single assessment time point, the most suitable COS concentration), and even more in–depth studies in other organisms are needed.

Author Contributions

Methodology, investigation, data curation, analysis, writing: H.S.; visualization: H.S. and L.C.; funding, writing—review and editing: Z.Z. and Y.Z. Conceptualization, validation, writing—review and editing, supervision, and project administration: J.O. All authors have read and agreed to the published version of the manuscript.

Funding

This research was funded by the Program of Shanghai Academic Research Leader (21XD1401200) and the National Natural Science Foundation of China (No. 31972188).

Institutional Review Board Statement

The study was conducted in accordance with the Declaration of Helsinki and approved by the Shanghai Ocean University Animal Care and Use Committee with approval number SHOU-2021-118.

Informed Consent Statement

Informed consent was obtained from all subjects involved in the study.

Data Availability Statement

The data presented in the study are deposited in the NCBI repository, accession number repository, and accession number BioProject ID PRJNA938584.

Conflicts of Interest

The authors declare no conflict of interest.

References

  1. Liu, Y.; Wu, F. Global burden of aflatoxin-induced hepatocellular carcinoma: A risk assessment. Environ. Health Perspect. 2010, 118, 818–824. [Google Scholar] [CrossRef] [Green Version]
  2. Rushing, B.R.; Selim, M.I. Aflatoxin B1: A review on metabolism, toxicity, occurrence in food, occupational exposure, and detoxification methods. Food Chem. Toxicol. 2019, 124, 81–100. [Google Scholar] [CrossRef] [PubMed]
  3. Ferencík, M.; Ebringer, L. Modulatory effects of selenium and zinc on the immune system. Folia Microbiol. 2003, 48, 417–426. [Google Scholar] [CrossRef] [PubMed]
  4. Hussein, H.S.; Brasel, J.M. Toxicity, metabolism, and impact of mycotoxins on humans and animals. Toxicology 2001, 167, 101–134. [Google Scholar] [CrossRef] [PubMed]
  5. Zhang, L.Y.; Zhan, D.L.; Chen, Y.Y.; Wang, W.H.; He, C.Y.; Lin, Y.; Lin, Y.C.; Lin, Z.N. Aflatoxin B1 enhances pyroptosis of hepatocytes and activation of Kupffer cells to promote liver inflammatory injury via dephosphorylation of cyclooxygenase-2: An in vitro, ex vivo and in vivo study. Arch. Toxicol. 2019, 93, 3305–3320. [Google Scholar] [CrossRef]
  6. Zhang, N.Y.; Qi, M.; Zhao, L.; Zhu, M.K.; Guo, J.; Liu, J.; Gu, C.Q.; Rajput, S.A.; Krumm, C.S.; Qi, D.S.; et al. Curcumin Prevents Aflatoxin B₁ Hepatoxicity by Inhibition of Cytochrome P450 Isozymes in Chick Liver. Toxins 2016, 8, 327. [Google Scholar] [CrossRef] [PubMed] [Green Version]
  7. Neal, G.E.; Eaton, D.L.; Judah, D.J.; Verma, A. Metabolism and toxicity of aflatoxins M1 and B1 in human-derived in vitro systems. Toxicol. Appl. Pharmacol. 1998, 151, 152–158. [Google Scholar] [CrossRef]
  8. Guengerich, F.P.; Johnson, W.W.; Shimada, T.; Ueng, Y.F.; Langouet, S. Mutagenesis, Activation and detoxication of aflatoxin B1. Mutat. Res. 1998, 402, 121–128. [Google Scholar] [CrossRef]
  9. Qu, M.; Xu, K.; Li, Y.; Wong, G.; Wang, D. Using acs-22 mutant Caenorhabditis elegans to detect the toxicity of nanopolystyrene particles. Sci. Total Environ. 2018, 643, 119–126. [Google Scholar] [CrossRef]
  10. Tang, J.; Ni, X.; Zhou, Z.; Wang, L.; Lin, S. Acute microplastic exposure raises stress response and suppresses detoxification and immune capacities in the scleractinian coral Pocillopora damicornis. Environ. Pollut. 2018, 243, 66–74. [Google Scholar] [CrossRef]
  11. Naveed, M.; Phil, L.; Sohail, M.; Hasnat, M.; Baig, M.; Ihsan, A.U.; Shumzaid, M.; Kakar, M.U.; Mehmood Khan, T.; Akabar, M.D.; et al. Chitosan oligosaccharide (COS): An overview. Int. J. Biol. Macromol. 2019, 129, 827–843. [Google Scholar] [CrossRef]
  12. Liu, X.; Xia, W.; Jiang, Q.; Yu, P.; Yue, L. Chitosan oligosaccharide-N-chlorokojic acid mannich base polymer as a potential antibacterial material. Carbohydr. Polym. 2018, 182, 225–234. [Google Scholar] [CrossRef] [PubMed]
  13. Xie, C.; Wu, X.; Long, C.; Wang, Q.; Fan, Z.; Li, S.; Yin, Y. Chitosan oligosaccharide affects antioxidant defense capacity and placental amino acids transport of sows. BMC Vet. Res. 2016, 12, 243. [Google Scholar] [CrossRef] [Green Version]
  14. Saleh, H.; El-Shorbagy, H.M. Chitosan protects liver against ischemia-reperfusion injury via regulating Bcl-2/Bax, TNF-α and TGF-β expression. Int. J. Biol. Macromol. 2020, 164, 1565–1574. [Google Scholar] [CrossRef]
  15. Karagozlu, M.Z.; Karadeniz, F.; Kim, S.K. Anti-HIV activities of novel synthetic peptide conjugated chitosan oligomers. Int. J. Biol. Macromol. 2014, 66, 260–266. [Google Scholar] [CrossRef] [PubMed]
  16. Arana, S.; Alves, V.A.; Sabino, M.; Tabata, Y.A.; Nonogaki, S.; Zaidan-Dagli, M.L.; Hernandez-Blazquez, F.J. Immunohistochemical evidence for myofibroblast-like cells associated with liver injury induced by aflatoxin B1 in rainbow trout (Oncorhynchus mykiss). J. Comp. Pathol. 2014, 150, 258–265. [Google Scholar] [CrossRef]
  17. Federico, A.; Dallio, M.; Loguercio, C. Silymarin/Silybin and Chronic Liver Disease: A Marriage of Many Years. Molecules 2017, 22, 191. [Google Scholar] [CrossRef] [Green Version]
  18. Tighe, S.P.; Akhtar, D.; Iqbal, U.; Ahmed, A. Chronic Liver Disease and Silymarin: A Biochemical and Clinical Review. J. Clin. Transl. Hepatol. 2020, 8, 454–458. [Google Scholar] [CrossRef] [PubMed]
  19. Young, A.I.; Benonisdottir, S.; Przeworski, M.; Kong, A. Deconstructing the sources of genotype-phenotype associations in humans. Science 2019, 365, 1396–1400. [Google Scholar] [CrossRef]
  20. Sun, B.; Gui, L.; Liu, R.; Hong, Y.; Li, M. Medaka oct4 is essential for gastrulation, central nervous system development and angiogenesis. Gene 2020, 733, 144270. [Google Scholar] [CrossRef]
  21. Troxel, C.M.; Buhler, D.R.; Hendricks, J.D.; Bailey, G.S. CYP1A induction by beta-naphthoflavone, Aroclor 1254, and 2,3,7,8-tetrachlorodibenzo-p-dioxin and its influence on aflatoxin B1 metabolism and DNA adduction in zebrafish. Toxicol. Appl. Pharmacol. 1997, 146, 69–78. [Google Scholar] [CrossRef] [PubMed]
  22. Lu, J.W.; Yang, W.Y.; Lin, Y.M.; Jin, S.L.; Yuh, C.H. Hepatitis B virus X antigen and aflatoxin B1 synergistically cause hepatitis, steatosis and liver hyperplasia in transgenic zebrafish. Acta Histochem. 2013, 115, 728–739. [Google Scholar] [CrossRef] [PubMed]
  23. Liu, X.; Kumar Mishra, S.; Wang, T.; Xu, Z.; Zhao, X.; Wang, Y.; Yin, H.; Fan, X.; Zeng, B.; Yang, M.; et al. AFB1 Induced Transcriptional Regulation Related to Apoptosis and Lipid Metabolism in Liver of Chicken. Toxins 2020, 12, 290. [Google Scholar] [CrossRef]
  24. Cheng, Y.C.; Wu, T.S.; Huang, Y.T.; Chang, Y.; Yang, J.J.; Yu, F.Y.; Liu, B.H. Aflatoxin B1 interferes with embryonic liver development: Involvement of p53 signaling and apoptosis in zebrafish. Toxicology 2021, 458, 152844. [Google Scholar] [CrossRef]
  25. Jindal, N.; Mahipal, S.K.; Mahajan, N.K. Toxicity of aflatoxin B1 in broiler chicks and its reduction by activated charcoal. Res. Vet. Sci. 1994, 56, 37–40. [Google Scholar] [CrossRef]
  26. Li, S.; Muhammad, I.; Yu, H.; Sun, X.; Zhang, X. Detection of Aflatoxin adducts as potential markers and the role of curcumin in alleviating AFB1-induced liver damage in chickens. Ecotoxicol. Environ. Saf. 2019, 176, 137–145. [Google Scholar] [CrossRef] [PubMed]
  27. Yan, J.; Chen, L.; Zhang, L.; Zhang, Z.; Zhao, Y.; Wang, Y.; Ou, J. New Insights Into the Persistent Effects of Acute Exposure to AFB(1) on Rat Liver. Front. Microbiol. 2022, 13, 911757. [Google Scholar] [CrossRef] [PubMed]
  28. Yasmeen, R.; Zahid, B.; Alyas, S.; Akhtar, R.; Zahra, N.; Kouser, S.; Hashmi, A.S.; Athar, M.; Tayyab, M.; Anjum, A.A. Ameliorative effects of Lactobacillus against Aflatoxin B1. Braz. J. Biol. 2021, 84, e250517. [Google Scholar] [CrossRef] [PubMed]
  29. Zhang, Z.; Zhang, Q.; Li, M.; Xu, J.; Wang, J.; Li, M.; Wei, L.; Lv, Q.; Chen, X.; Wang, Y.; et al. SeMet attenuates AFB1-induced intestinal injury in rabbits by activating the Nrf2 pathway. Ecotoxicol. Environ. Saf. 2022, 239, 113640. [Google Scholar] [CrossRef]
  30. Livingstone, D.R. Contaminant-stimulated reactive oxygen species production and oxidative damage in aquatic organisms. Mar. Pollut. Bull. 2001, 42, 656–666. [Google Scholar] [CrossRef] [PubMed]
  31. Egea, J.; Fabregat, I.; Frapart, Y.M.; Ghezzi, P.; Görlach, A.; Kietzmann, T.; Kubaichuk, K.; Knaus, U.G.; Lopez, M.G.; Olaso-Gonzalez, G.; et al. Corrigendum to “European contribution to the study of ROS: A summary of the findings and prospects for the future from the COST action BM1203 (EU-ROS)” [Redox Biol. 13 (2017) 94-162]. Redox Biol. 2018, 14, 694–696. [Google Scholar] [CrossRef] [PubMed] [Green Version]
  32. Dorantes-Aranda, J.J.; Seger, A.; Mardones, J.I.; Nichols, P.D.; Hallegraeff, G.M. Progress in Understanding Algal Bloom-Mediated Fish Kills: The Role of Superoxide Radicals, Phycotoxins and Fatty Acids. PloS ONE 2015, 10, e0133549. [Google Scholar] [CrossRef] [PubMed] [Green Version]
  33. Li, Y.; Liu, Z.; Li, M.; Jiang, Q.; Wu, D.; Huang, Y.; Jiao, Y.; Zhang, M.; Zhao, Y. Effects of nanoplastics on antioxidant and immune enzyme activities and related gene expression in juvenile Macrobrachium nipponense. J. Hazard. Mater. 2020, 398, 122990. [Google Scholar] [CrossRef]
  34. Xu, L.; Yu, Y.; Sang, R.; Li, J.; Ge, B.; Zhang, X. Protective Effects of Taraxasterol against Ethanol-Induced Liver Injury by Regulating CYP2E1/Nrf2/HO-1 and NF-κB Signaling Pathways in Mice. Oxidative Med. Cell. Longev. 2018, 2018, 8284107. [Google Scholar] [CrossRef] [PubMed] [Green Version]
  35. Bao, W.; Li, K.; Rong, S.; Yao, P.; Hao, L.; Ying, C.; Zhang, X.; Nussler, A.; Liu, L. Curcumin alleviates ethanol-induced hepatocytes oxidative damage involving heme oxygenase-1 induction. J. Ethnopharmacol. 2010, 128, 549–553. [Google Scholar] [CrossRef]
  36. Li, S.; Liu, R.; Xia, S.; Wei, G.; Ishfaq, M.; Zhang, Y.; Zhang, X. Protective role of curcumin on aflatoxin B1-induced TLR4/RIPK pathway mediated-necroptosis and inflammation in chicken liver. Ecotoxicol. Environ. Saf. 2022, 233, 113319. [Google Scholar] [CrossRef] [PubMed]
  37. Yin, Y.; Kong, D.; He, K.; Xia, Q. Aurora kinase A regulates liver regeneration through macrophages polarization and Wnt/β-catenin signalling. Liver Int. 2022, 42, 468–478. [Google Scholar] [CrossRef]
  38. Horiguchi, H.; Yamagata, S.; Rong Qian, Z.; Kagawa, S.; Sakashita, N. Thrombospondin-1 is highly expressed in desmoplastic components of invasive ductal carcinoma of the breast and associated with lymph node metastasis. J. Med. Investig. JMI 2013, 60, 91–96. [Google Scholar] [CrossRef] [Green Version]
  39. Jayachandran, A.; Anaka, M.; Prithviraj, P.; Hudson, C.; McKeown, S.J.; Lo, P.H.; Vella, L.J.; Goding, C.R.; Cebon, J.; Behren, A. Thrombospondin 1 promotes an aggressive phenotype through epithelial-to-mesenchymal transition in human melanoma. Oncotarget 2014, 5, 5782–5797. [Google Scholar] [CrossRef] [Green Version]
  40. Jeanne, A.; Schneider, C.; Martiny, L.; Dedieu, S. Original insights on thrombospondin-1-related antireceptor strategies in cancer. Front. Pharmacol. 2015, 6, 252. [Google Scholar] [CrossRef] [Green Version]
  41. Li, M.; Liu, L.; Kang, Y.; Huang, S.; Xiao, Y. Circulating THBS1: A Risk Factor for Nonalcoholic Fatty Liver Disease in Obese Children. Ann. Nutr. Metab. 2023, 79, 16–28. [Google Scholar] [CrossRef]
  42. Liu, R.J.; Xu, Z.P.; Li, S.Y.; Yu, J.J.; Feng, N.H.; Xu, B.; Chen, M. BAP1-Related ceRNA (NEAT1/miR-10a-5p/SERPINE1) Promotes Proliferation and Migration of Kidney Cancer Cells. Front. Oncol. 2022, 12, 852515. [Google Scholar] [CrossRef] [PubMed]
  43. Teng, F.; Zhang, J.X.; Chen, Y.; Shen, X.D.; Su, C.; Guo, Y.J.; Wang, P.H.; Shi, C.C.; Lei, M.; Cao, Y.O.; et al. LncRNA NKX2-1-AS1 promotes tumor progression and angiogenesis via upregulation of SERPINE1 expression and activation of the VEGFR-2 signaling pathway in gastric cancer. Mol. Oncol. 2021, 15, 1234–1255. [Google Scholar] [CrossRef]
  44. Miyazaki, H.; Sawada, T.; Kiyohira, M.; Yu, Z.; Nakamura, K.; Yasumoto, Y.; Kagawa, Y.; Ebrahimi, M.; Islam, A.; Sharifi, K.; et al. Fatty acid binding protein 7 regulates phagocytosis and cytokine production in Kupffer cells during liver injury. Am. J. Pathol. 2014, 184, 2505–2515. [Google Scholar] [CrossRef] [PubMed]
  45. Jo, H.J.; Yang, J.W.; Park, J.H.; Choi, E.S.; Lim, C.S.; Lee, S.; Han, C.Y. Endoplasmic Reticulum Stress Increases DUSP5 Expression via PERK-CHOP Pathway Leading to Hepatocyte Death. Int. J. Mol. Sci. 2019, 20, 369. [Google Scholar] [CrossRef] [PubMed] [Green Version]
Figure 1. Changes in (A) body weight, (B) HSI, CK, LA, and HA—weight and HSI at 72 h after ASAE. The data are expressed as mean ± standard deviation. Different lowercase letters indicate significant differences among treatments (p < 0.05). (CH): Liver pathological morphology after ASAE and COS intervention for ASAE in medaka (HE, × 40) CK, SIL, HCOS, LCOS, LA, and HA (AFB1) (Autopsy of medaka after 72 h).
Sustainability 15 05418 g001
Figure 2. Effect of AFB1 on liver function indicators of medaka: (A,C) Aspartate aminotransferase (AST), (B,D) Alanine aminotransferase (ALT). Effect of COS intervention with AFB1 on oxidative stress in the liver of medaka: (E,I) Hepatic superoxide dismutase (SOD), (F,J) hepatic catalase (CAT), (G,K) reduced glutathione (GSH), and (H,L) hepatic malondialdehyde (MDA) (liver tissue samples of medaka after 72 h). CK: 4% DMSO injection of 10 μL; LA: 0.25 g/L AFB1 intraperitoneal injection of 10 μL; HA(AFB1): 1 g/L AFB1 intraperitoneal injection of 10 μL; HCOS: 1 g/L AFB1 intraperitoneal injection of 10 μL, 0.6% COS in the basal diet; LCOS: 1 g/L AFB1 intraperitoneal injection of 10 μL, 0.3% COS in the basal diet.
Sustainability 15 05418 g002
Figure 3. Biplot originating from principal component analysis (PCA) integrating biochemical indicators (AST, ALT, SOD, CAT, GSH, MDA) and three/five different treatments. (A) ASAE group, (B) COS intervention ASAE group.
Sustainability 15 05418 g003
Figure 4. Volcanoes of differential genes: (A) CK-VS-AFB1, (B) CK-VS-HCOS. Red dots of significantly differential genes indicate up–regulation, blue dots indicate down–regulation, horizontal coordinates represent gene expression fold changes in different samples, and vertical coordinates represent the statistical significance of the differences in gene expression changes. Venn diagram: (C). There were special DEGs in the different analyses of each group (FDR ≤ 0.05 and |log2FC| ≥ 1).
Sustainability 15 05418 g004
Figure 5. GO enrichment histogram: (A) CK–VS–AFB1, (B) CK–VS–HCOS. The vertical coordinate is the enriched GO term and the horizontal coordinate is the number of differential genes in that term. Different colors are used to distinguish biological processes, cellular components, and molecular functions. Significantly enriched KEGG annotated classification bar graph: (C) CK–VS–AFB1, (D) CK–VS–HCOS. The vertical axis indicates the pathway name, and the horizontal axis indicates the number of genes.
Sustainability 15 05418 g005
Figure 6. Electrophoresis diagram of the total RNA automatic nucleic acid Electrophoresis Analyzer.
Sustainability 15 05418 g006
Table 1. Primer information.
GenePrimer Sequence (5′ to 3′)Number of Bases
β-ActinForward: CCAGCCTTCCTTCCTTGGTA
Reverse: GTACCTCCAGACAGCACAGT
20
20
aurkaForward: GCGATGGAGCCTAGAAGACT
Reverse: TGAACTTGGTCTGTCGCTCT
20
20
thbs1Forward: TGTGAGTGCAAGCCAGGATA
Reverse: AGAGTTGGGAAGGTTAGGGC
20
20
serpine1Forward: TCCCTTCAACCCCAAACTGA
Reverse: TCCCCATAGTTGAAGCGGTT
20
20
fabp7Forward: CACCCAGAGCACCTTCAAAA
Reverse: CGTGAACCAACTTGTCTCCG
20
20
dusp5Forward: TTTCCTCTACCTCGGCAGTG
Reverse: TTGAGCAAGGCAGTGATGTG
20
20
Table 2. Validation of Q–PCR and RNA–Seq results for selected genes.
Relative Gene Expression LevelFold Change
CKHCOSAFB1
Q-PCRRNA-SeqQ-PCRRNA-Seq
aurka16.76 ± 0.0943.29 ± 0.7618.00 ± 0.28188.04 ± 0.89
thbs115.61 ± 0.2114.34 ± 0.4824.71 ± 0.70101.73 ± 1.08
serpine117.44 ± 0.1923.30 ± 0.2661.77 ± 0.67282.11 ± 0.37
fabp110.08 ± 0.010.08 ± 0.010.01 ± 0.010.03 ± 0.01
dusp515.57 ± 0.2516.34 ± 0.5617.35 ± 0.0686.71 ± 0.60
Mean ± SD.
Disclaimer/Publisher’s Note: The statements, opinions and data contained in all publications are solely those of the individual author(s) and contributor(s) and not of MDPI and/or the editor(s). MDPI and/or the editor(s) disclaim responsibility for any injury to people or property resulting from any ideas, methods, instructions or products referred to in the content.

