

Walking Together Indicator (WTI): Understanding and Measuring World Inequality


Abstract
1. Introduction
2. Related Work
2.1. Socio-Economic Inequality: Well-Being and Welfare
2.2. Global Development and Sustainable Future
2.3. Income Inequality and beyond
3. Methodology and Approach
3.1. Indicators and Categories
- Input indicators are well-known, extensively discussed in literature and adopted in practice;
- Input indicators are publicly available;
- Input indicators have a clear semantic. Each indicator should provide a measure of one single concrete aspect. Therefore, composite indicators are not considered;
- The number of considered indicators should be minimised to foster transparency and clarity. Indeed, a larger number of indicators does not provide necessarily more knowledge or a more exhaustive support for analysis.
- In the limits of the possible, selected indicators should have a minimum overlapping, meaning they should focus on different aspects.
3.2. Metrics
3.3. Approximations
4. Understanding and Measuring World Inequality: WTI
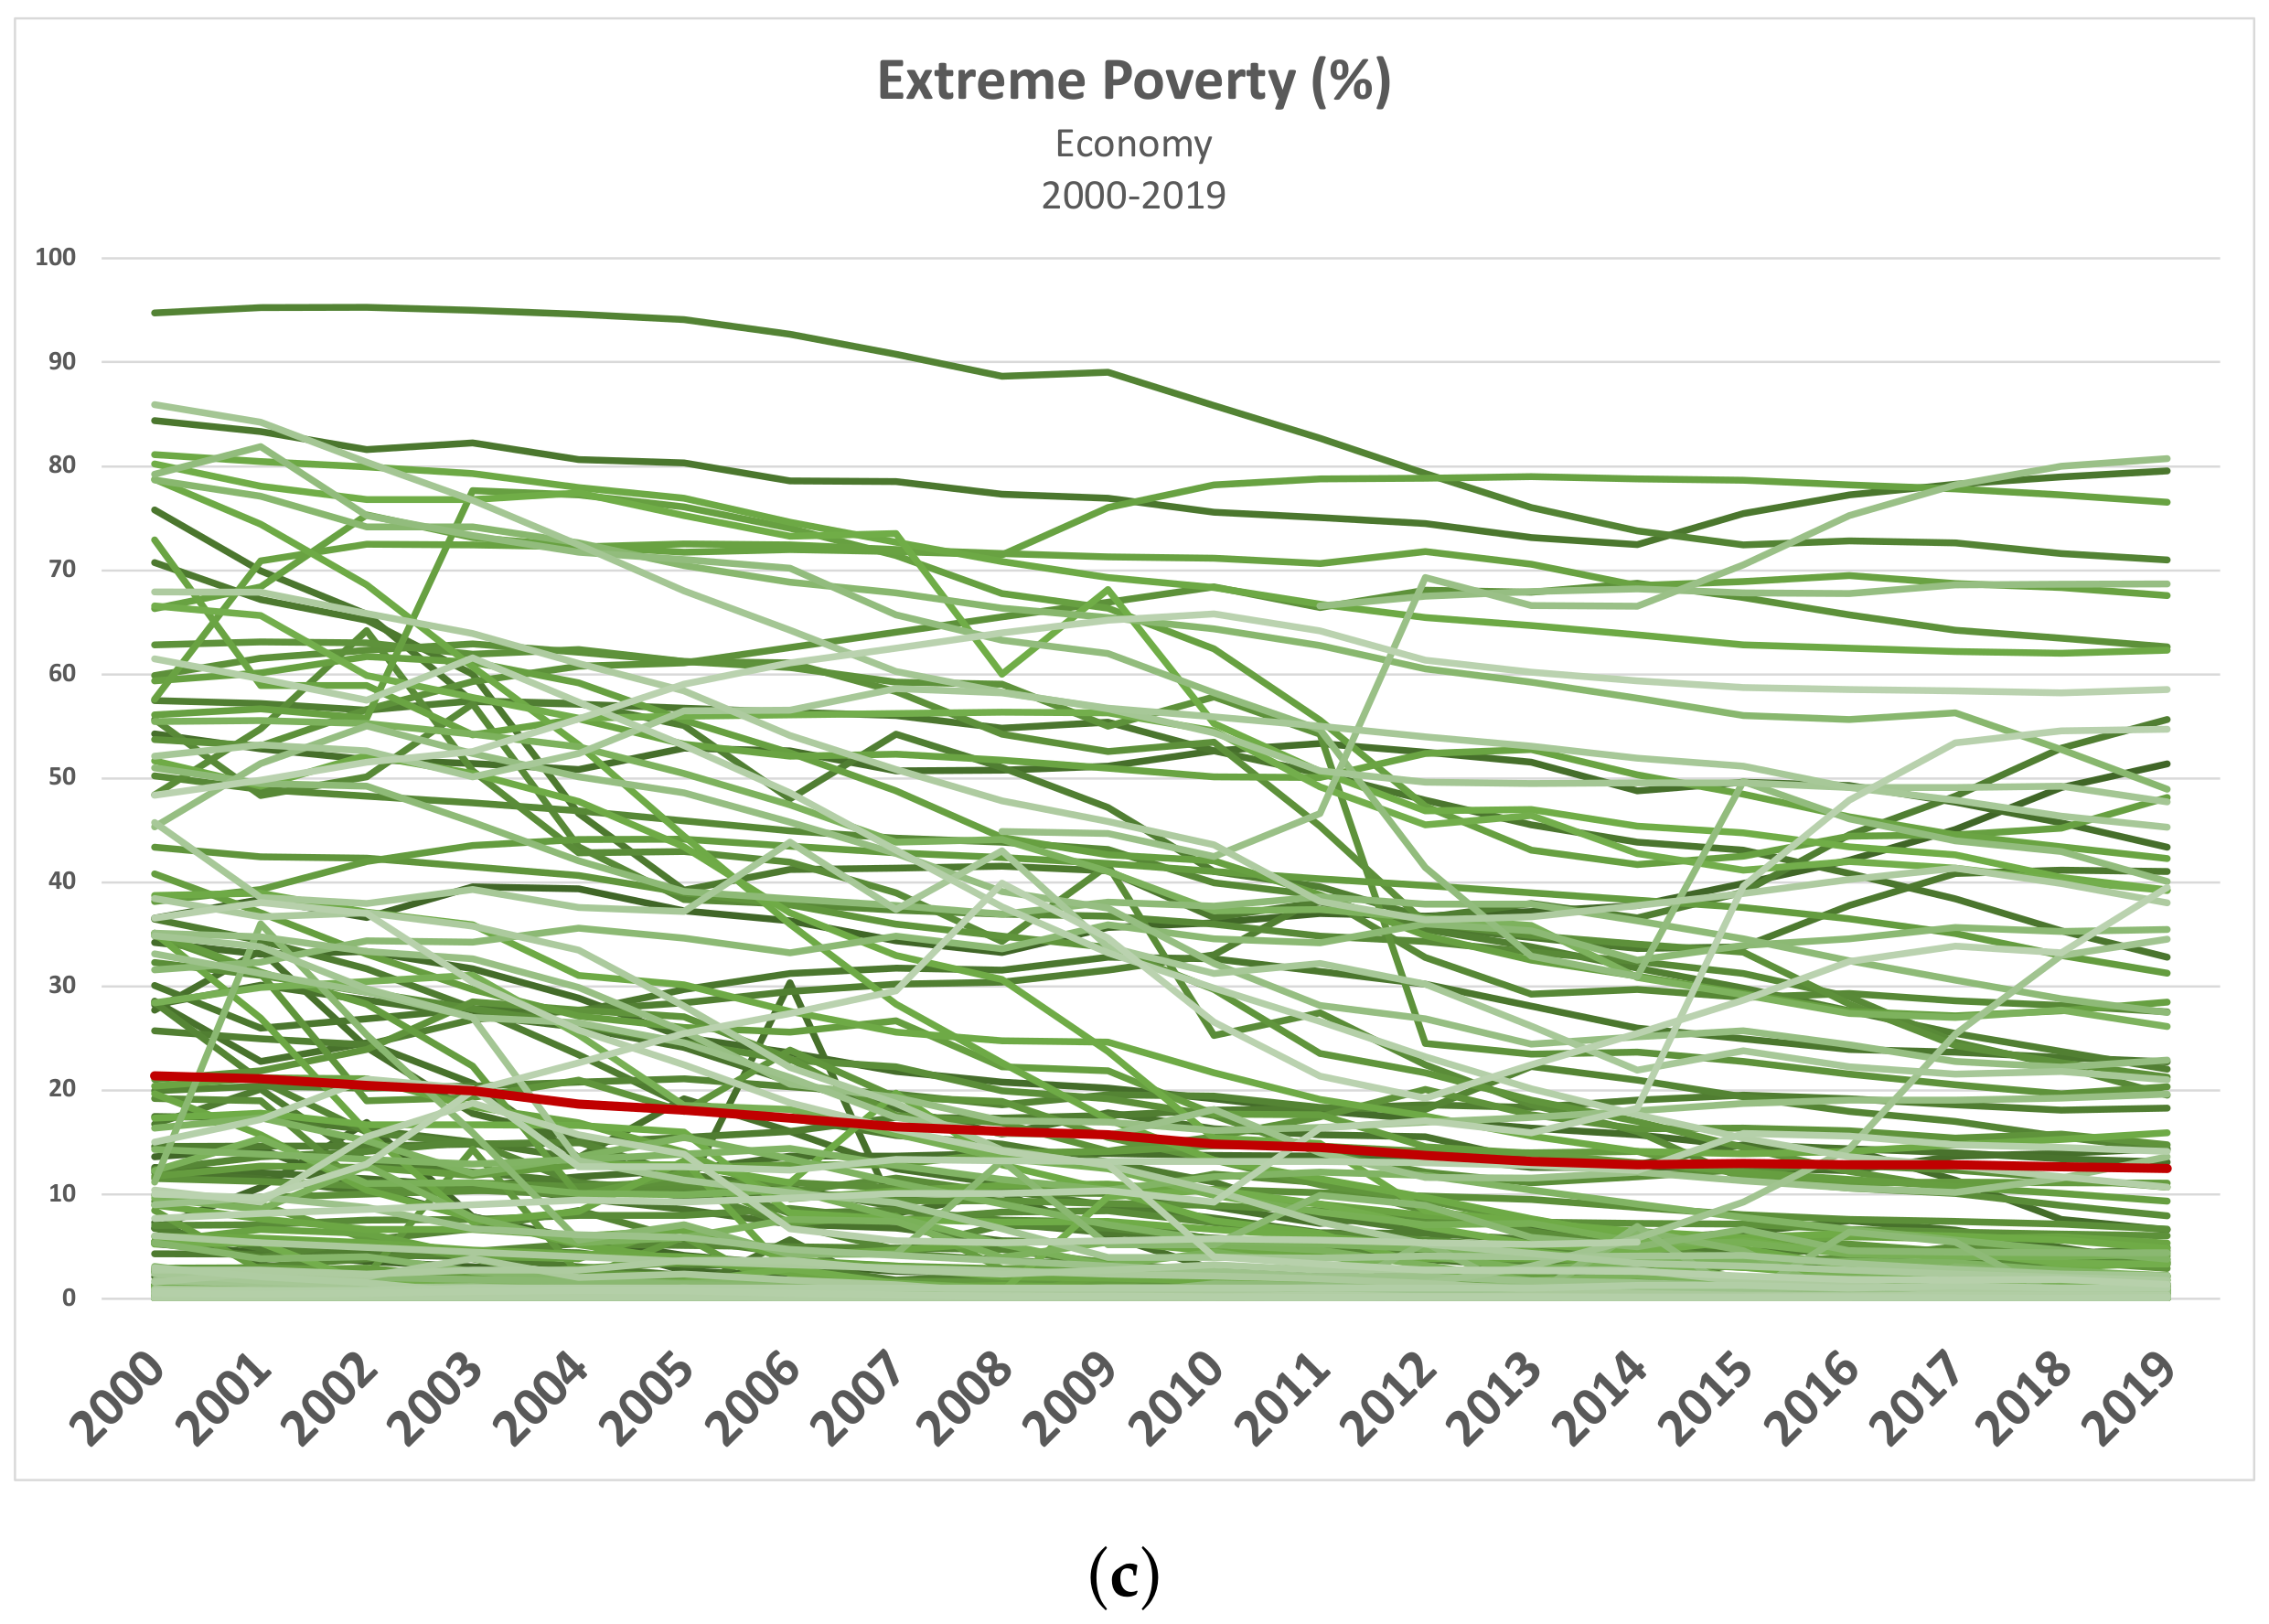
4.1. Economy
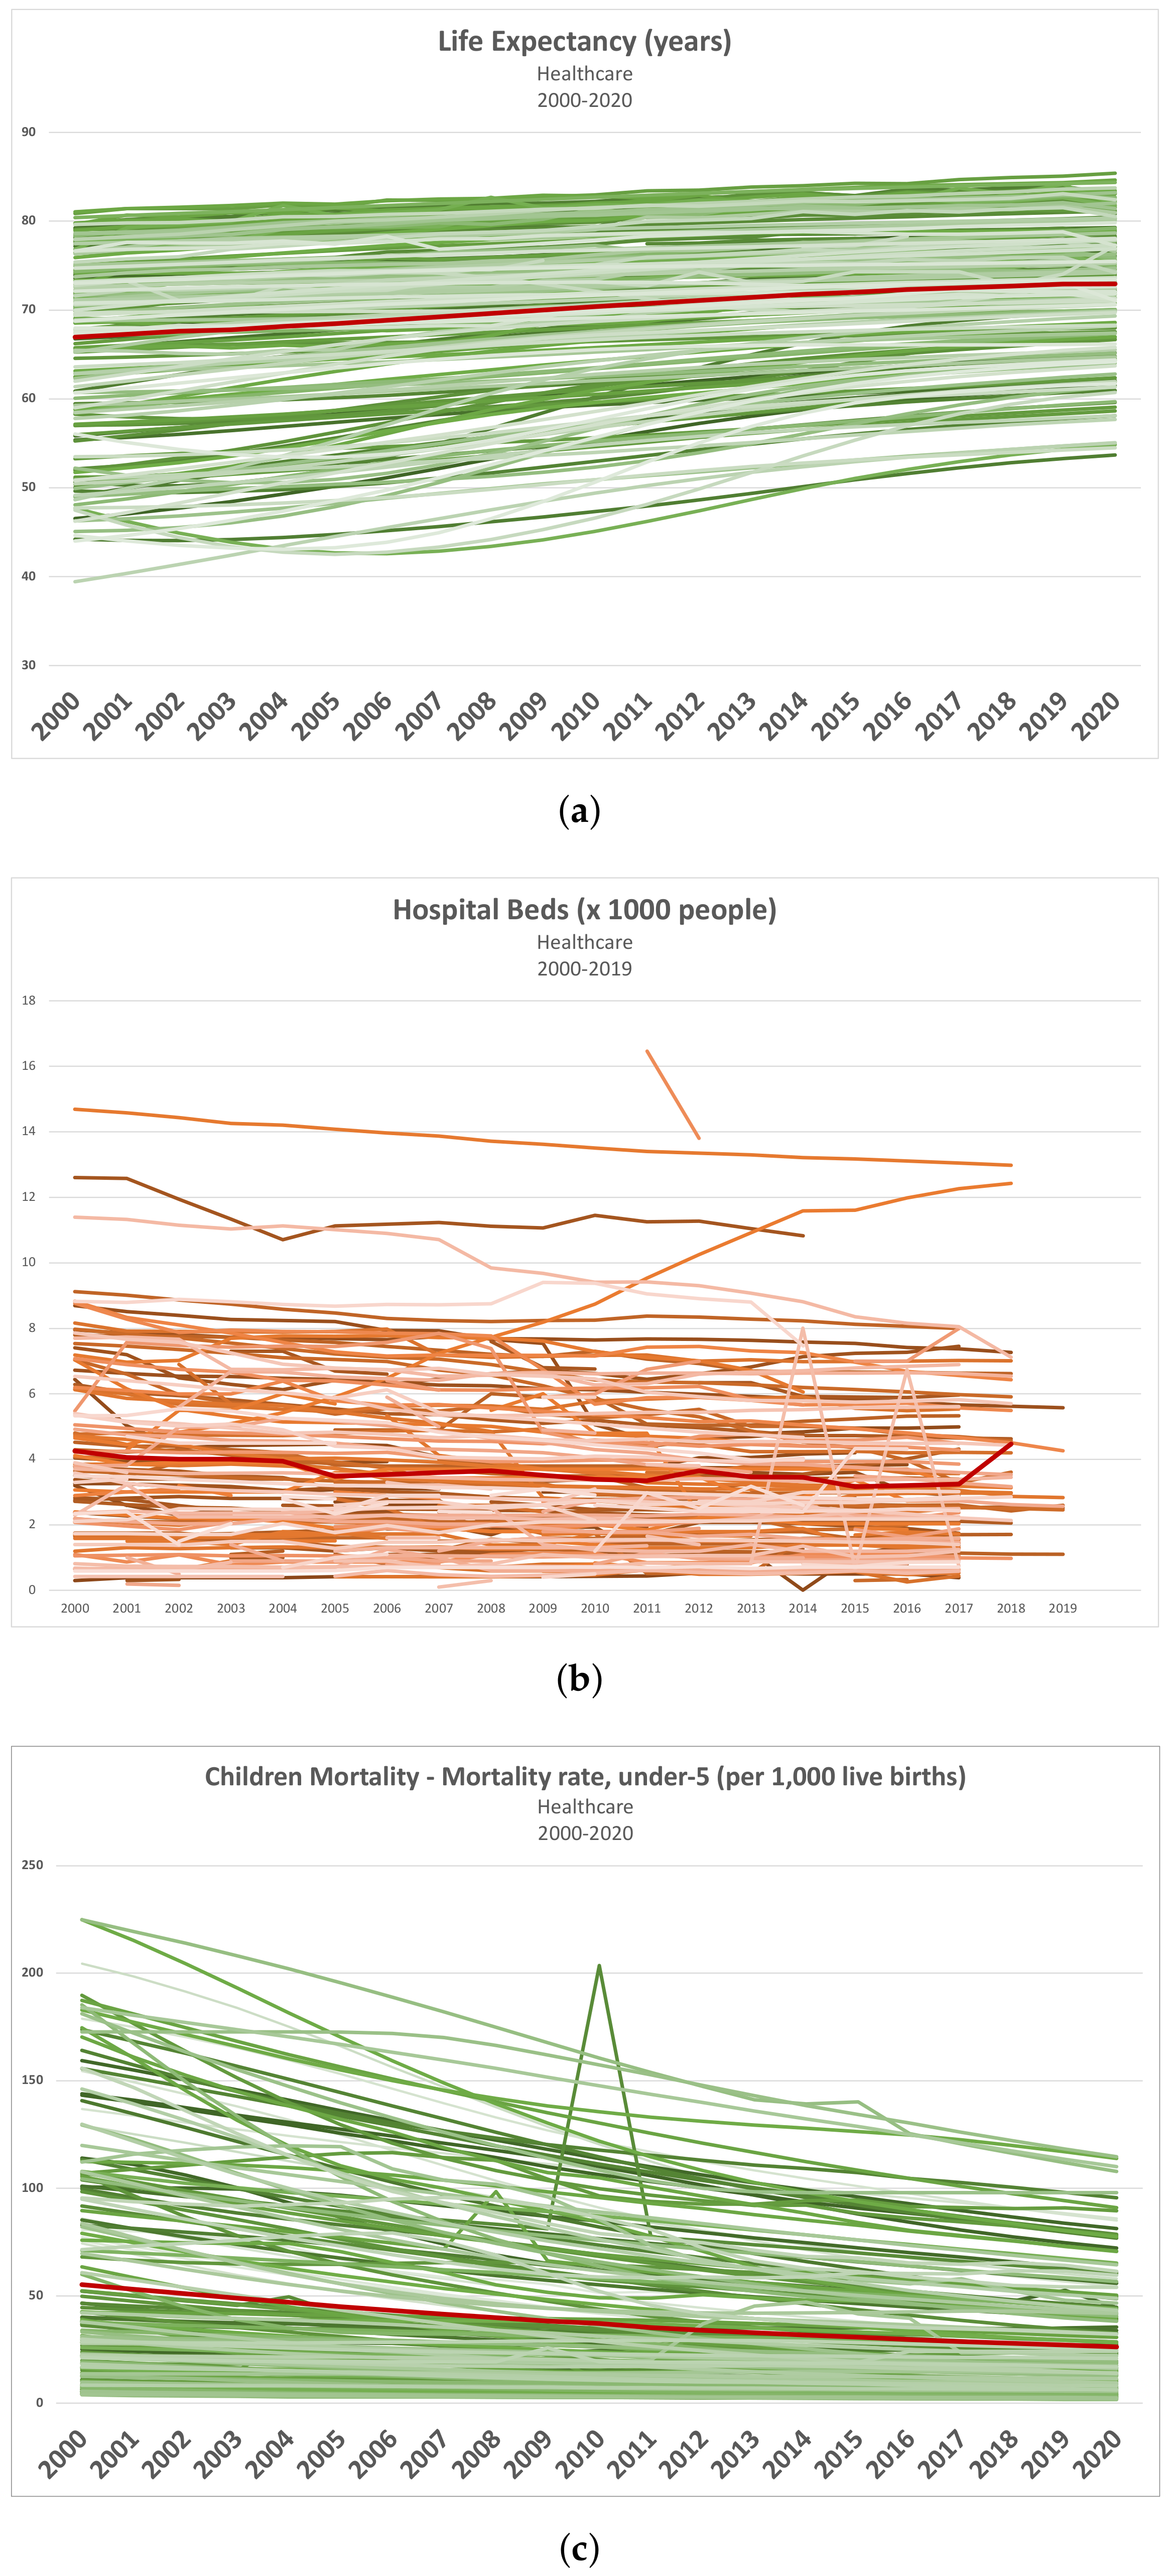
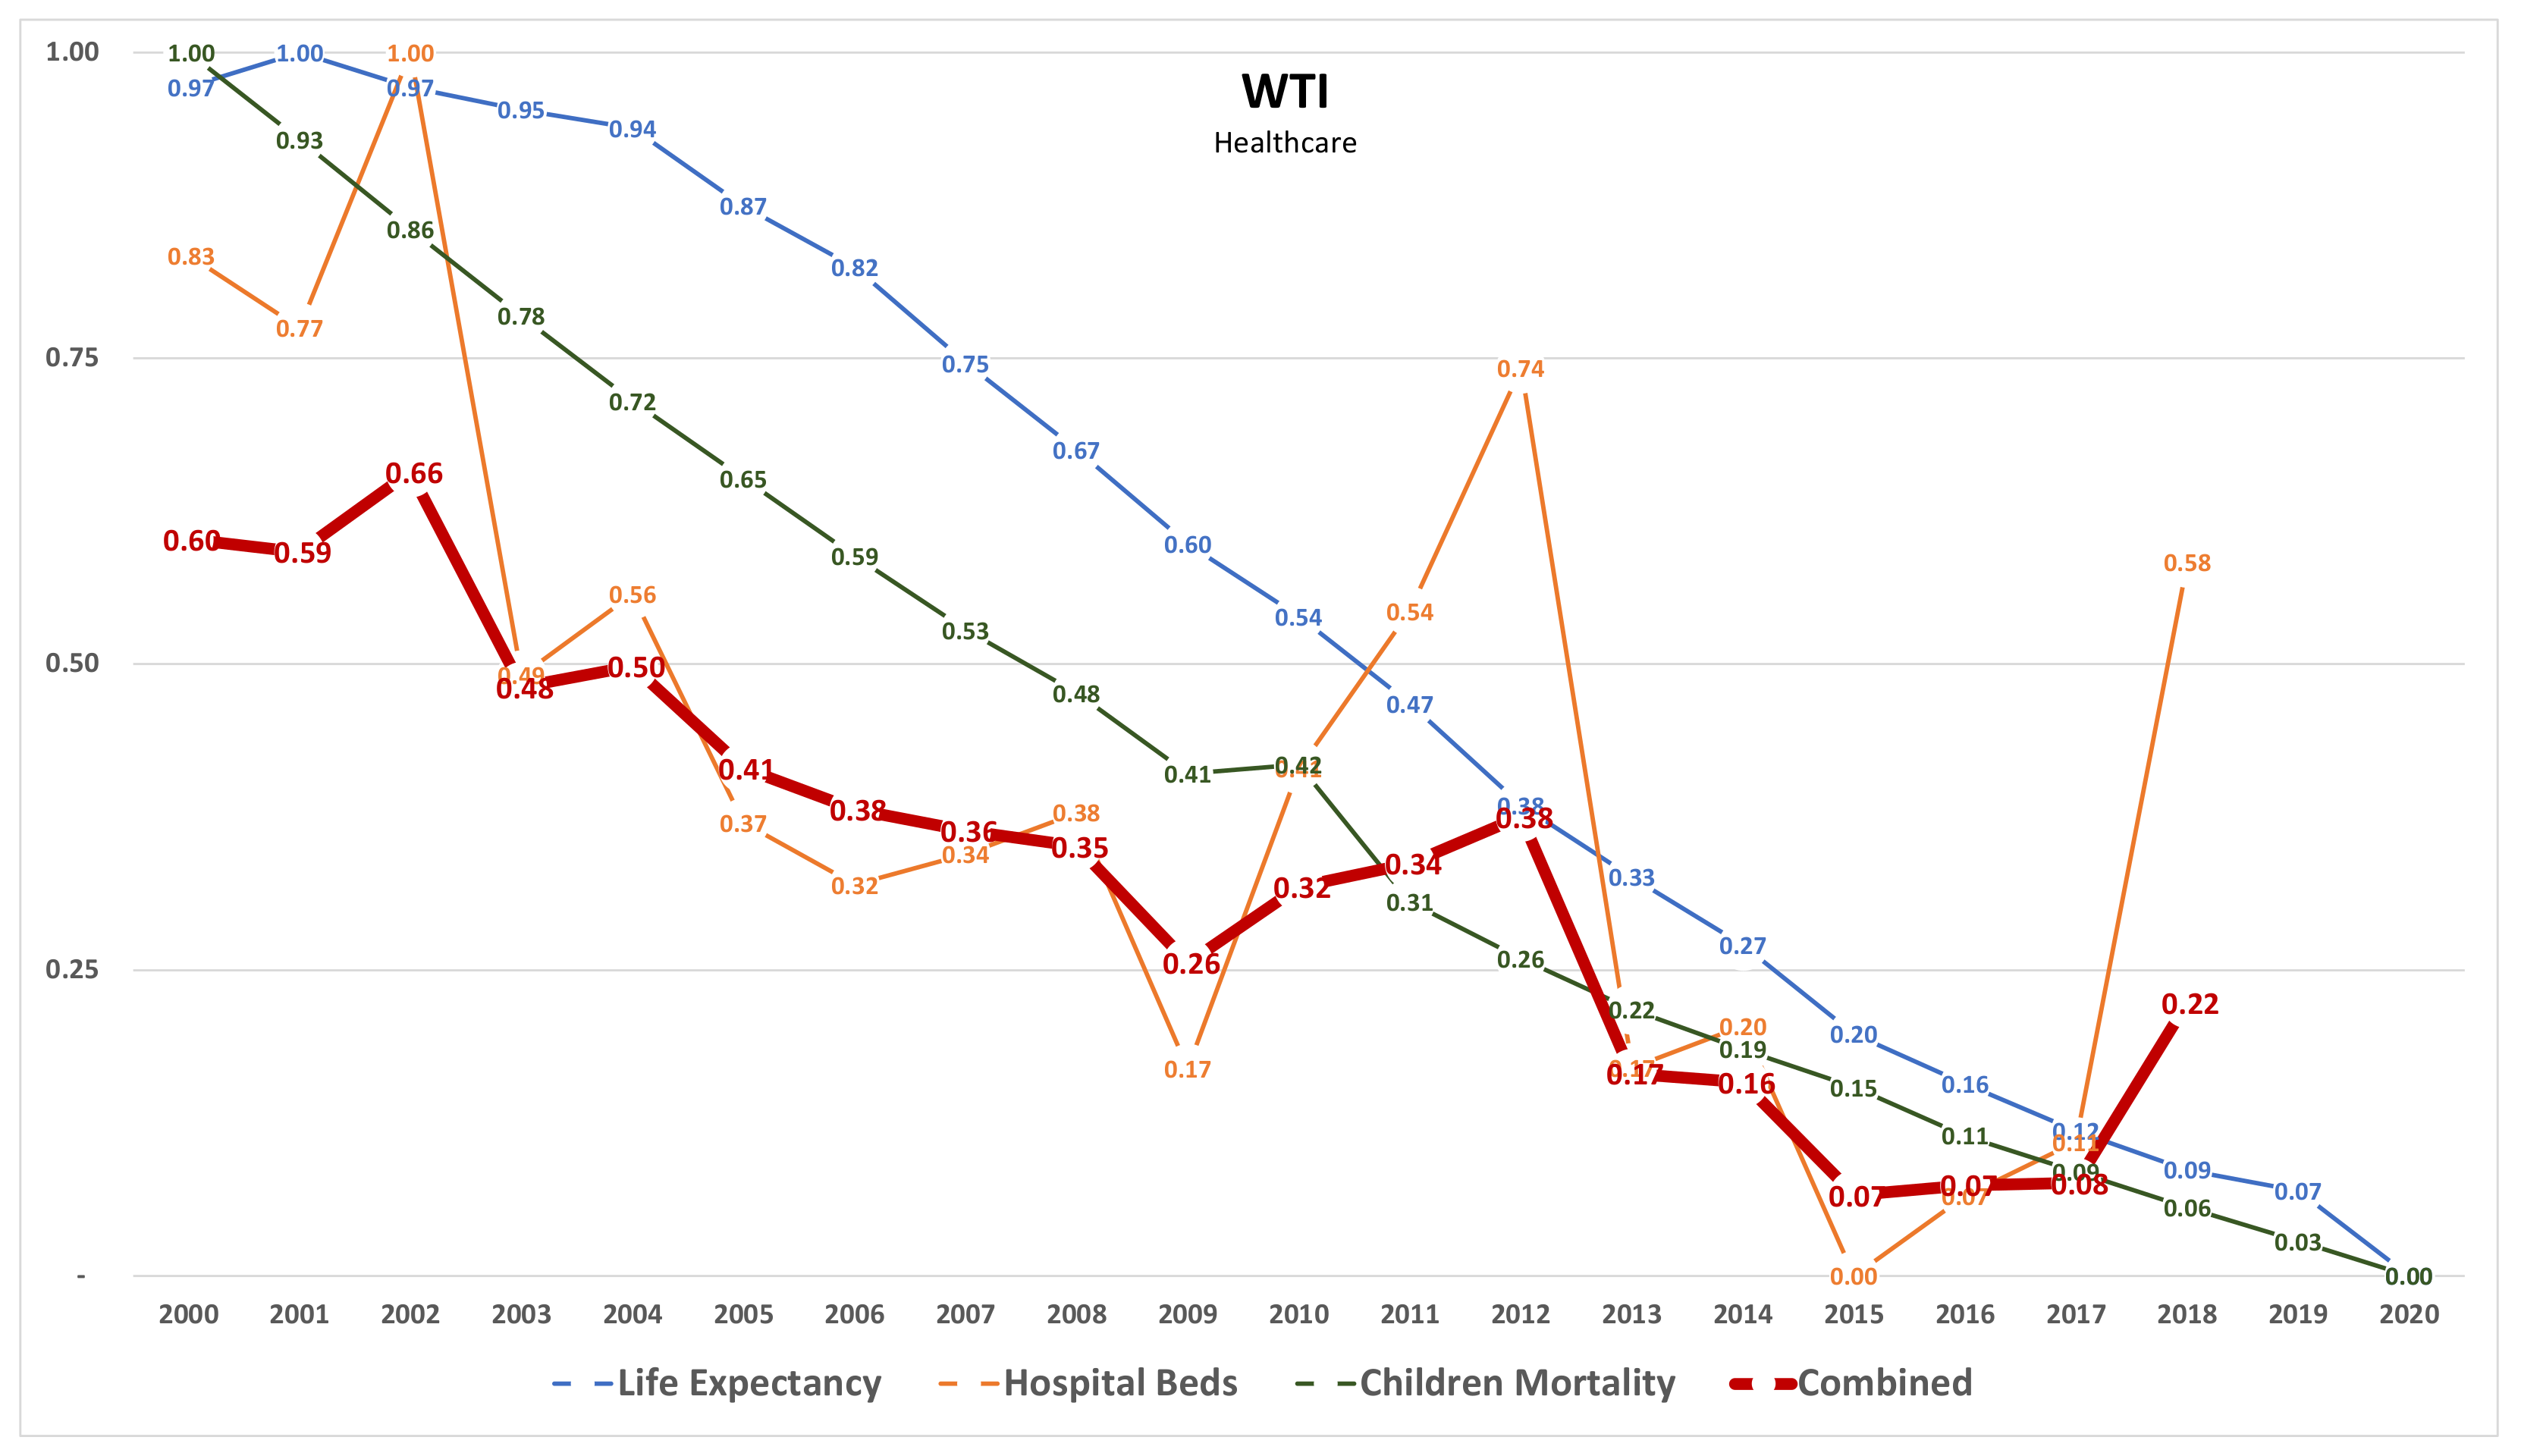
4.2. Healthcare
4.3. Resource
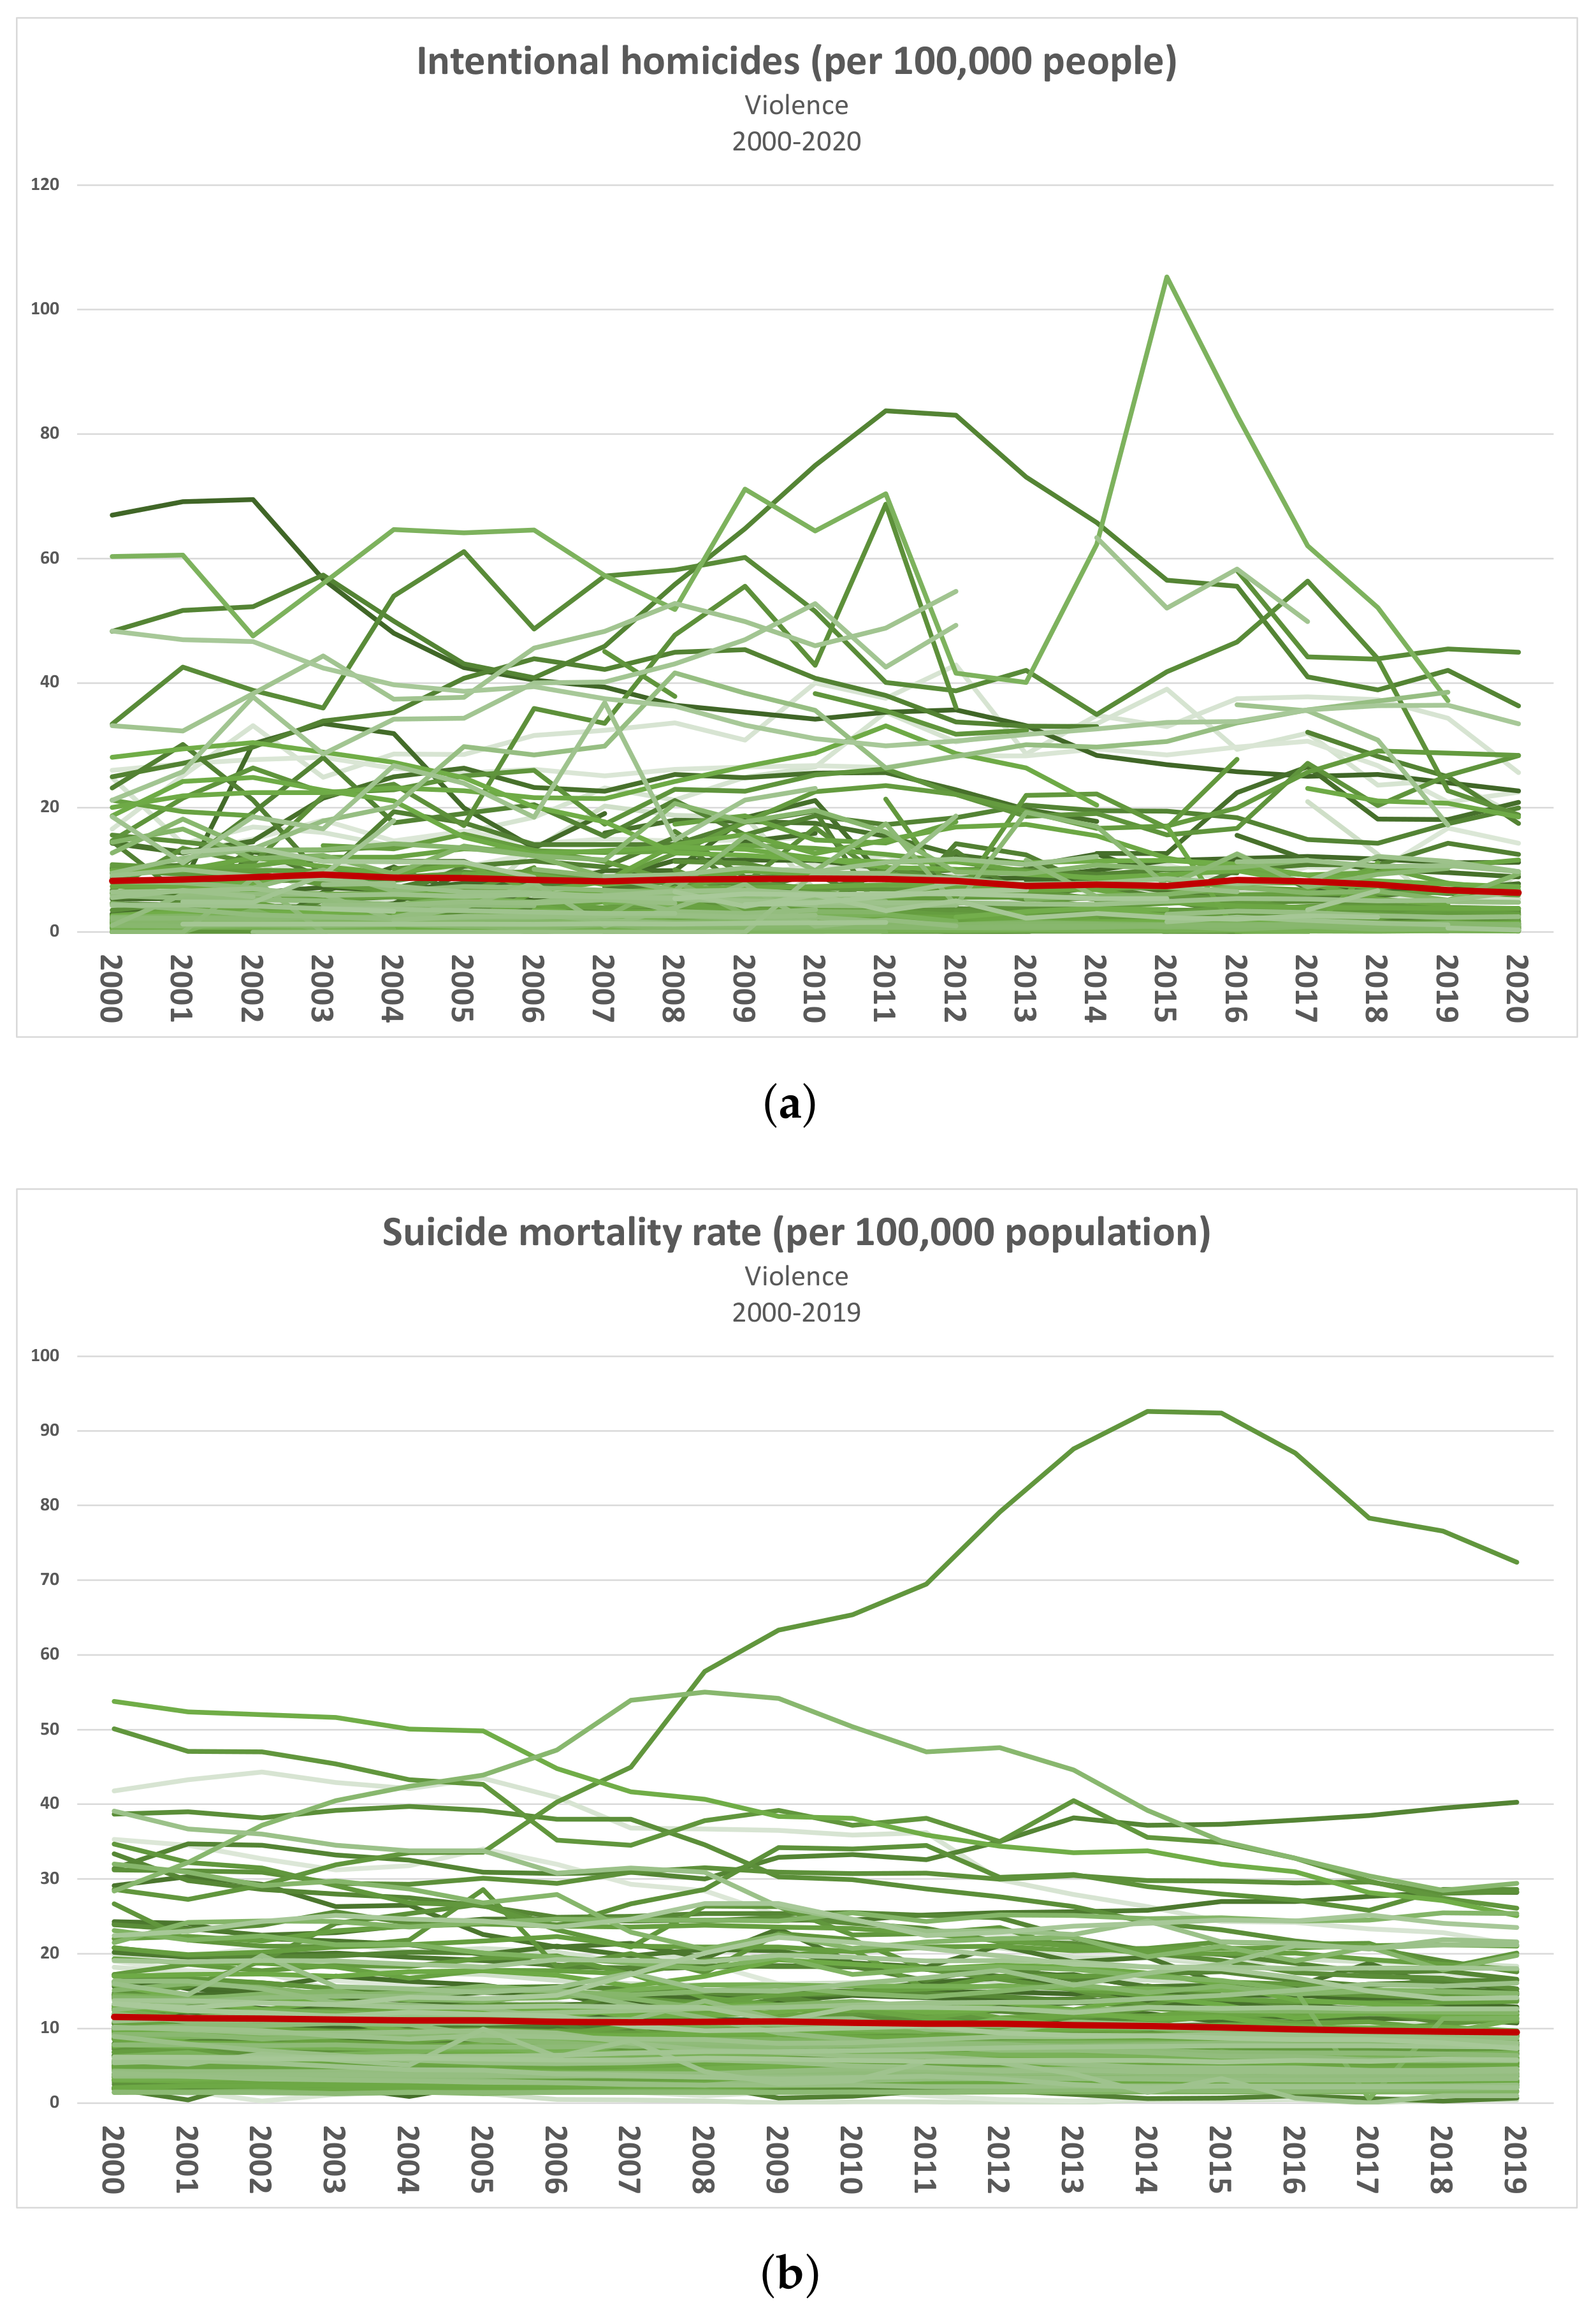
4.4. Violence
5. Discussion and Recent Lessons
5.1. One Single Significant Anomaly
5.2. Lessons from COVID-19
6. Conclusions and Future Work
Funding
Informed Consent Statement
Data Availability Statement
Acknowledgments
Conflicts of Interest
References
- Mackenbach, J.P.; Kunst, A.E. Measuring the magnitude of socio-economic inequalities in health: An overview of available measures illustrated with two examples from Europe. Soc. Sci. Med. 1997, 44, 757–771. [Google Scholar] [CrossRef] [PubMed]
- Barner, J.R.; Okech, D.; Camp, M.A. Socio-economic inequality, human trafficking, and the global slave trade. Societies 2014, 4, 148–160. [Google Scholar] [CrossRef]
- Ghosh, S.; Doğan, B.; Can, M.; Shah, M.I.; Apergis, N. Does economic structure matter for ıncome ınequality? Qual. Quant. 2022. [Google Scholar] [CrossRef]
- Soubbotina, T.P.; Sheram, K. Beyond Economic Growth: Meeting the Challenges of Global Development; World Bank Publications: Washington, DC, USA, 2000. [Google Scholar]
- Hopwood, B.; Mellor, M.; O’Brien, G. Sustainable development: Mapping different approaches. Sustain. Dev. 2005, 13, 38–52. [Google Scholar] [CrossRef]
- Abashidze, A.K.; Inshakova, A.O.; Solntsev, A.M.; Gugunskiy, D.A. Socio-economic inequality as a barrier on the path of sustainable development: “institutional traps” and perspectives of overcoming them. Int. J. Sociol. Soc. Policy 2020, 41, 62–75. [Google Scholar] [CrossRef]
- Bennis, W.G.; Nanus, B.; Bennis, S. Leaders: Strategies for Taking Charge; Harper & Row: New York, NY, USA, 1985; Volume 200. [Google Scholar]
- Gidley, J.M. The Future: A Very SHORT Introduction; Oxford University Press: Oxford, UK, 2017. [Google Scholar]
- Blackwood, D.; Lynch, R.G. The measurement of inequality and poverty: A policy maker’s guide to the literature. World Dev. 1994, 22, 567–578. [Google Scholar] [CrossRef]
- Farris, F.A. The Gini index and measures of inequality. Am. Math. Mon. 2010, 117, 851–864. [Google Scholar] [CrossRef]
- Libório, M.P.; Martinuci, O.d.S.; Ekel, P.I.; Hadad, R.M.; Lyrio, R.d.M.; Bernardes, P. Measuring inequality through a non-compensatory approach. GeoJournal 2022, 87, 4689–4706. [Google Scholar] [CrossRef]
- Van Phan, P.; O’Brien, M. Multidimensional wellbeing inequality in a developing country: A case study of Vietnam. Soc. Indic. Res. 2019, 145, 157–183. [Google Scholar] [CrossRef]
- Thorbecke, E.; Charumilind, C. Economic inequality and its socioeconomic impact. World Dev. 2002, 30, 1477–1495. [Google Scholar] [CrossRef]
- Mackenbach, J.P.; Stirbu, I.; Roskam, A.J.R.; Schaap, M.M.; Menvielle, G.; Leinsalu, M.; Kunst, A.E. Socioeconomic inequalities in health in 22 European countries. N. Engl. J. Med. 2008, 358, 2468–2481. [Google Scholar] [CrossRef]
- Van de Poel, E.; Hosseinpoor, A.R.; Speybroeck, N.; Van Ourti, T.; Vega, J. Socioeconomic inequality in malnutrition in developing countries. Bull. World Health Organ. 2008, 86, 282–291. [Google Scholar] [CrossRef]
- Huppert, F.A. The state of wellbeing science. Concepts, Measures, Interventions, and Policies; John Wiley & Sons: Hoboken, NJ, USA, 2014. [Google Scholar]
- Schneider, S.M. Income inequality and subjective wellbeing: Trends, challenges, and research directions. J. Happiness Stud. 2016, 17, 1719–1739. [Google Scholar] [CrossRef]
- Decancq, K.; Fleurbaey, M.; Schokkaert, E. Inequality, income, and well-being. In Handbook of Income Distribution; Elsevier: Amsterdam, The Netherlands, 2015; Volume 2, pp. 67–140. [Google Scholar]
- Western, M.; Tomaszewski, W. Subjective wellbeing, objective wellbeing and inequality in Australia. PloS ONE 2016, 11, e0163345. [Google Scholar] [CrossRef]
- Greve, B. What is welfare? Cent. Eur. J. Public Policy 2008, 2, 50–73. [Google Scholar]
- Kakwani, N. Inequality, welfare and poverty: Three interrelated phenomena. In Handbook of Income Inequality Measurement; Springer: Berlin/Heidelberg, Germany, 1999; pp. 599–634. [Google Scholar]
- Antràs, P.; De Gortari, A.; Itskhoki, O. Globalization, inequality and welfare. J. Int. Econ. 2017, 108, 387–412. [Google Scholar] [CrossRef]
- Kakwani, N. Income inequality, welfare and poverty in a developing economy with applications to Sri Lanka. Soc. Choice Welf. 1988, 5, 199–222. [Google Scholar] [CrossRef]
- Lewis, G.W.; Ulph, D.T. Poverty, inequality and welfare. Econ. J. 1988, 98, 117–131. [Google Scholar] [CrossRef]
- Dutta, B. Inequality, poverty and welfare. Handb. Soc. Choice Welf. 2002, 1, 597–633. [Google Scholar]
- Pyatt, G. Measuring welfare, poverty and inequality. Econ. J. 1987, 97, 459–467. [Google Scholar] [CrossRef]
- Fritzell, J.; Lundberg, O. Health, inequalities, welfare and resources. In Health Inequalities and Welfare Resources; The Policy Press: Bristol, UK, 2006; pp. 1–18. [Google Scholar]
- Bergqvist, K.; Yngwe, M.Å.; Lundberg, O. Understanding the role of welfare state characteristics for health and inequalities—An analytical review. BMC Public Health 2013, 13, 1234. [Google Scholar] [CrossRef] [PubMed]
- Bambra, C. Health inequalities and welfare state regimes: Theoretical insights on a public health ‘puzzle’. J. Epidemiol. Community Health 2011, 65, 740–745. [Google Scholar] [CrossRef] [PubMed]
- Alkire, S. Dimensions of human development. World Dev. 2002, 30, 181–205. [Google Scholar] [CrossRef]
- Birdsall, N. Rising inequality in the new global economy. Int. J. Dev. Issues 2006, 5, 1–9. [Google Scholar]
- Galbraith, J.K. Global inequality and global macroeconomics. J. Policy Model. 2007, 29, 587–607. [Google Scholar] [CrossRef]
- Hughes, B.B.; Johnston, P.D. Sustainable futures: Policies for global development. Futures 2005, 37, 813–831. [Google Scholar] [CrossRef]
- Forster, M.J. The world commission on environment and development. Environ. Policy Law 1985, 14, 22–35. [Google Scholar]
- Freistein, K.; Mahlert, B. The potential for tackling inequality in the Sustainable Development Goals. Third World Q. 2016, 37, 2139–2155. [Google Scholar] [CrossRef]
- Doyle, M.W.; Stiglitz, J.E. Eliminating extreme inequality: A sustainable development goal, 2015–2030. Ethics Int. Aff. 2014, 28, 5–13. [Google Scholar] [CrossRef]
- Piketty, T. Income inequality in France, 1901–1998. J. Political Econ. 2003, 111, 1004–1042. [Google Scholar] [CrossRef]
- Piketty, T.; Saez, E. Income inequality in the United States, 1913–1998. Q. J. Econ. 2003, 118, 1–41. [Google Scholar] [CrossRef]
- Ravallion, M. Income inequality in the developing world. Science 2014, 344, 851–855. [Google Scholar] [CrossRef]
- Wilkinson, R.G.; Pickett, K.E. Income inequality and social dysfunction. Annu. Rev. Sociol. 2009, 35, 493–511. [Google Scholar] [CrossRef]
- Dabla-Norris, M.E.; Kochhar, M.K.; Suphaphiphat, M.N.; Ricka, M.F.; Tsounta, M.E. Causes and Consequences of Income Inequality: A Global Perspective; International Monetary Fund: Washington, DC, USA, 2015. [Google Scholar]
- Solt, F. Standardizing the world income inequality database. Soc. Sci. Q. 2009, 90, 231–242. [Google Scholar] [CrossRef]
- OECD. Handbook on Constructing Composite Indicators: Methodology and User Guide; OECD Publishing: Paris, France, 2008. [Google Scholar]
- The World Bank—GDP Per Capita (Current US$). Available online: https://data.worldbank.org/indicator/NY.GDP.PCAP.CD (accessed on 9 May 2022).
- The World Bank—Unemployment, Total (% of Total Labor Force). Available online: https://data.worldbank.org/indicator/SL.UEM.TOTL.ZS (accessed on 10 May 2022).
- Roser, M.; Ortiz-Ospina, E. Global Extreme Poverty. Our World in Data. Available online: https://ourworldindata.org/extreme-poverty (accessed on 10 May 2022).
- The World Bank—Life Expectancy at Birth, Total (Years). Available online: https://data.worldbank.org/indicator/SP.DYN.LE00.IN (accessed on 10 May 2022).
- The World Bank—Hospital Beds (per 1000 People). Available online: https://data.worldbank.org/indicator/SH.MED.BEDS.ZS (accessed on 10 May 2022).
- The World Bank—Mortality Rate, under-5 (per 1000 Live Births). Available online: https://data.worldbank.org/indicator/SH.DYN.MORT (accessed on 10 May 2022).
- The World Bank—Military Expenditure (% of GDP). Available online: https://data.worldbank.org/indicator/MS.MIL.XPND.GD.ZS (accessed on 10 May 2022).
- The World Bank—Government Expenditure on Education, Total (% of GDP). Available online: https://data.worldbank.org/indicator/SE.XPD.TOTL.GD.ZS (accessed on 10 May 2022).
- The World Bank—Intentional Homicides (per 100,000 People). Available online: https://data.worldbank.org/indicator/VC.IHR.PSRC.P5 (accessed on 10 May 2022).
- The World Bank—Suicide Mortality Rate (per 100,000 Population). Available online: https://data.worldbank.org/indicator/SH.STA.SUIC.P5 (accessed on 10 May 2022).
- Libório, M.P.; Martinuci, O.d.S.; Laudares, S.; Lyrio, R.d.M.; Machado, A.M.C.; Bernardes, P.; Ekel, P. Measuring intra-urban inequality with structural equation modeling: A theory-grounded indicator. Sustainability 2020, 12, 8610. [Google Scholar] [CrossRef]
- Mazziotta, M.; Pareto, A. Normalization methods for spatio-temporal analysis of environmental performance: Revisiting the Min–Max method. Environmetrics 2022, 33, e2730. [Google Scholar] [CrossRef]
- Ruiz, F.; El Gibari, S.; Cabello, J.M.; Gómez, T. MRP-WSCI: Multiple reference point based weak and strong composite indicators. Omega 2020, 95, 102060. [Google Scholar] [CrossRef]
- Pileggi, S.F. Holistic Resilience Index: Measuring the expected country resilience to pandemic. Qual. Quant. 2022, 56, 4107–4127. [Google Scholar] [CrossRef]
- The VPA Approach—World Health Organization. Available online: https://www.who.int/groups/violence-prevention-alliance/approach (accessed on 10 May 2022).
- Israel, E.; Frenkel, A. Social justice and spatial inequality: Toward a conceptual framework. Prog. Hum. Geogr. 2018, 42, 647–665. [Google Scholar] [CrossRef]
- McAuliffe, G.; Danner, M.; Grothaus, T.; Doyle, L. Social inequality and social justice. Cult. Alert Couns. Compr. Introd. 2008, 45–83. [Google Scholar]
- Brulle, R.J.; Pellow, D.N. Environmental justice. Annu. Rev. Public Health 2006, 27, 103–124. [Google Scholar] [CrossRef] [PubMed]
- Wenz, P. Environmental justice. In Thinking About the Environment; Routledge: Oxfordshire, UK, 2015; pp. 214–220. [Google Scholar]
- Bowen, W. An analytical review of environmental justice research: What do we really know? Environ. Manag. 2002, 29, 3–15. [Google Scholar] [CrossRef]
- Giannetti, B.F.; Agostinho, F.; Almeida, C.; Huisingh, D. A review of limitations of GDP and alternative indices to monitor human wellbeing and to manage eco-system functionality. J. Clean. Prod. 2015, 87, 11–25. [Google Scholar] [CrossRef]
- England, R.W. Measurement of social well-being: Alternatives to gross domestic product. Ecol. Econ. 1998, 25, 89–103. [Google Scholar] [CrossRef]
- Masood, E. Can An Economics Formula Save The Planet? Nature 2022, 611. [Google Scholar]
- Dalstra, J.A.; Kunst, A.E.; Geurts, J.J.; Frenken, F.; Mackenbach, J.P. Trends in socioeconomic health inequalities in the Netherlands, 1981–1999. J. Epidemiol. Community Health 2002, 56, 927–934. [Google Scholar] [CrossRef]
- Pileggi, S.F. Is the World Becoming a Better or a Worse Place? A Data-Driven Analysis. Sustainability 2020, 12, 88. [Google Scholar] [CrossRef]
- Mishra, N.P.; Das, S.S.; Yadav, S.; Khan, W.; Afzal, M.; Alarifi, A.; Ansari, M.T.; Hasnain, M.S.; Nayak, A.K. Global impacts of pre-and post-COVID-19 pandemic: Focus on socio-economic consequences. Sens. Int. 2020, 1, 100042. [Google Scholar] [CrossRef]
- Pileggi, S.F. Life before COVID-19: How was the World actually performing? Qual. Quant. 2021, 55, 1871–1888. [Google Scholar] [CrossRef]
- Fakhruddin, B.S.; Blanchard, K.; Ragupathy, D. Are we there yet? The transition from response to recovery for the COVID-19 pandemic. Prog. Disaster Sci. 2020, 7, 100102. [Google Scholar] [CrossRef]
- Janssen, M.; Van der Voort, H. Agile and adaptive governance in crisis response: Lessons from the COVID-19 pandemic. Int. J. Inf. Manag. 2020, 55, 102180. [Google Scholar] [CrossRef]
- Delardas, O.; Kechagias, K.S.; Pontikos, P.N.; Giannos, P. Socio-Economic Impacts and Challenges of the Coronavirus Pandemic (COVID-19): An Updated Review. Sustainability 2022, 14, 9699. [Google Scholar] [CrossRef]
- Ahmed, F.; Ahmed, N.; Pissarides, C.; Stiglitz, J. Why inequality could spread COVID-19. Lancet Public Health 2020, 5, e240. [Google Scholar] [CrossRef]
- Patel, J.A.; Nielsen, F.; Badiani, A.A.; Assi, S.; Unadkat, V.; Patel, B.; Ravindrane, R.; Wardle, H. Poverty, inequality and COVID-19: The forgotten vulnerable. Public Health 2020, 183, 110. [Google Scholar] [CrossRef]
- Nanda, S. Inequalities and COVID-19 1. In COVID-19; Routledge: Oxfordshire, UK, 2020; pp. 109–123. [Google Scholar]
- Ashford, N.A.; Hall, R.P.; Arango-Quiroga, J.; Metaxas, K.A.; Showalter, A.L. Addressing inequality: The first step beyond COVID-19 and towards sustainability. Sustainability 2020, 12, 5404. [Google Scholar] [CrossRef]
- Zheng, Y.; Walsham, G. Inequality of what? An intersectional approach to digital inequality under Covid-19. Inf. Organ. 2021, 31, 100341. [Google Scholar] [CrossRef]
- Deaton, A. Covid-19 and global income inequality. Technical report, National Bureau of Economic Research. 2021. Available online: https://www.nber.org/system/files/working_papers/w28392/w28392.pdf (accessed on 10 May 2022).
- Wouters, O.J.; Shadlen, K.C.; Salcher-Konrad, M.; Pollard, A.J.; Larson, H.J.; Teerawattananon, Y.; Jit, M. Challenges in ensuring global access to COVID-19 vaccines: Production, affordability, allocation, and deployment. Lancet 2021, 397, 1023–1034. [Google Scholar] [CrossRef]
- Sallam, M. COVID-19 vaccine hesitancy worldwide: A concise systematic review of vaccine acceptance rates. Vaccines 2021, 9, 160. [Google Scholar] [CrossRef]
- Acharya, K.P.; Ghimire, T.R.; Subramanya, S.H. Access to and equitable distribution of COVID-19 vaccine in low-income countries. NPJ Vaccines 2021, 6, 54. [Google Scholar] [CrossRef]


| Indicator | Source | |
|---|---|---|
| Economy | ||
| E.1 | GDP x capita | [44] |
| E.2 | Unemployment Rate | [45] |
| E.3 | Extreme Poverty | Computations based on [46] |
| Healthcare | ||
| H.1 | Life Expectancy | [47] |
| H.2 | Hospital beds (×1000 people) | [48] |
| H.3 | Children Mortality-Mortality rate, under-5 (per 1000 live births) | [49] |
| Resource | ||
| R.1 | Military expenditure (% of GDP) | [50] |
| R.2 | Government expenditure on education, total (% of GDP) | [51] |
| Violence | ||
| V.1 | Intentional homicides (per 100,000 people) | [52] |
| V.2 | Suicide mortality rate (per 100,000 population) | [53] |
Disclaimer/Publisher’s Note: The statements, opinions and data contained in all publications are solely those of the individual author(s) and contributor(s) and not of MDPI and/or the editor(s). MDPI and/or the editor(s) disclaim responsibility for any injury to people or property resulting from any ideas, methods, instructions or products referred to in the content. |
© 2023 by the author. Licensee MDPI, Basel, Switzerland. This article is an open access article distributed under the terms and conditions of the Creative Commons Attribution (CC BY) license (https://creativecommons.org/licenses/by/4.0/).
Share and Cite
Pileggi, S.F. Walking Together Indicator (WTI): Understanding and Measuring World Inequality. Sustainability 2023, 15, 5392. https://doi.org/10.3390/su15065392
Pileggi SF. Walking Together Indicator (WTI): Understanding and Measuring World Inequality. Sustainability. 2023; 15(6):5392. https://doi.org/10.3390/su15065392
Chicago/Turabian StylePileggi, Salvatore Flavio. 2023. "Walking Together Indicator (WTI): Understanding and Measuring World Inequality" Sustainability 15, no. 6: 5392. https://doi.org/10.3390/su15065392
APA StylePileggi, S. F. (2023). Walking Together Indicator (WTI): Understanding and Measuring World Inequality. Sustainability, 15(6), 5392. https://doi.org/10.3390/su15065392