

Reliability and Robustness Assessment of Highway Networks under Multi-Hazard Scenarios: A Case Study in Xinjiang, China
 ,
,
Abstract
1. Introduction
2. Data
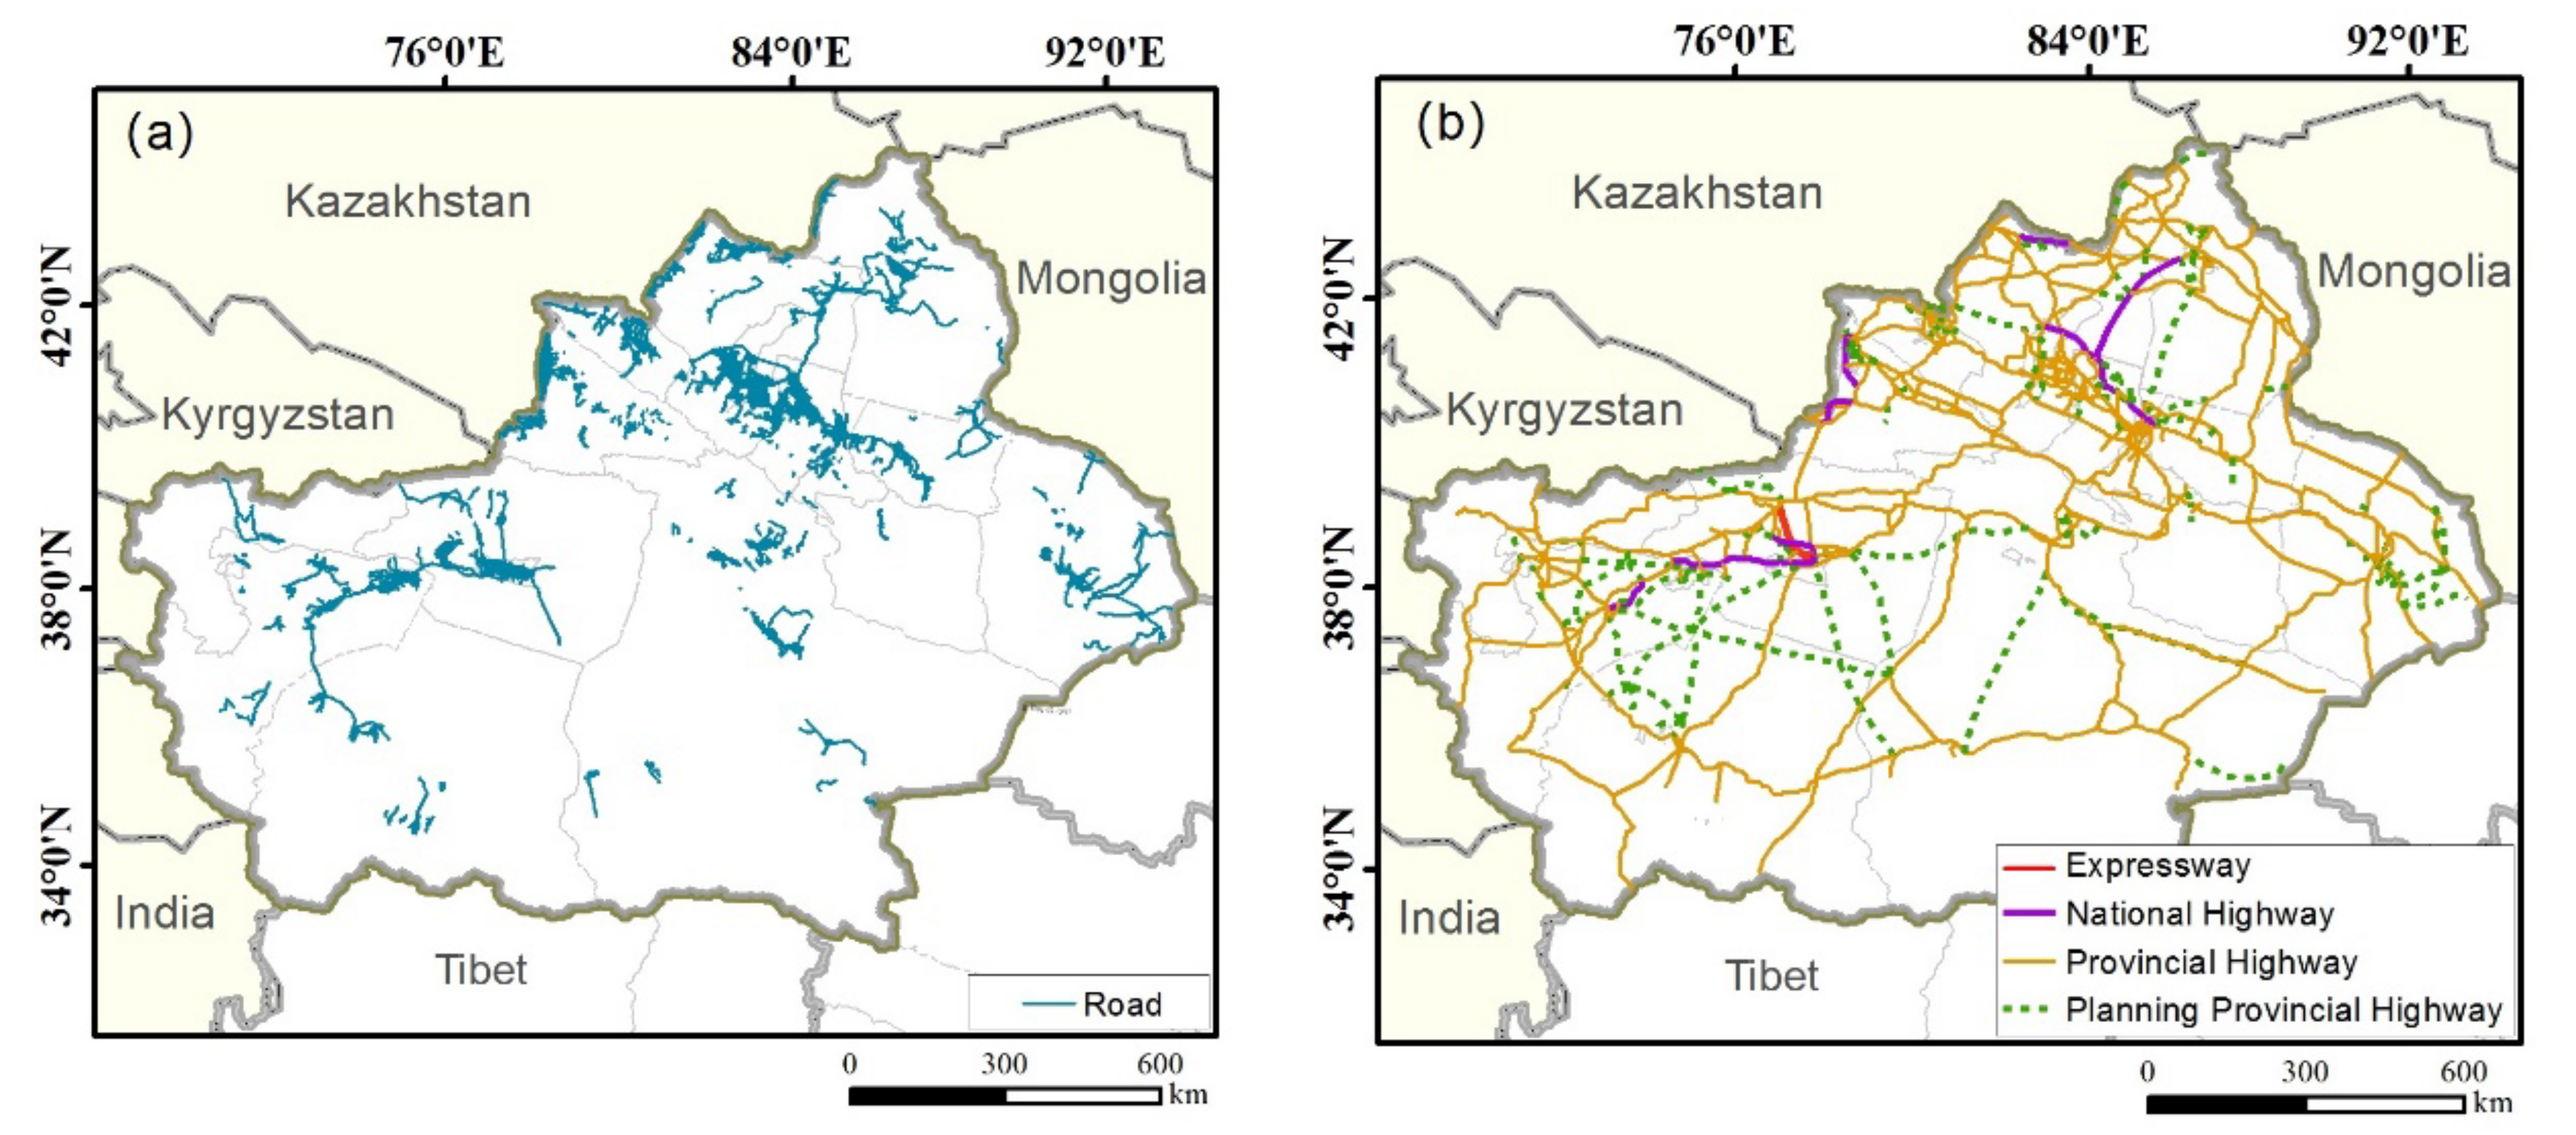
2.1. Highway Data
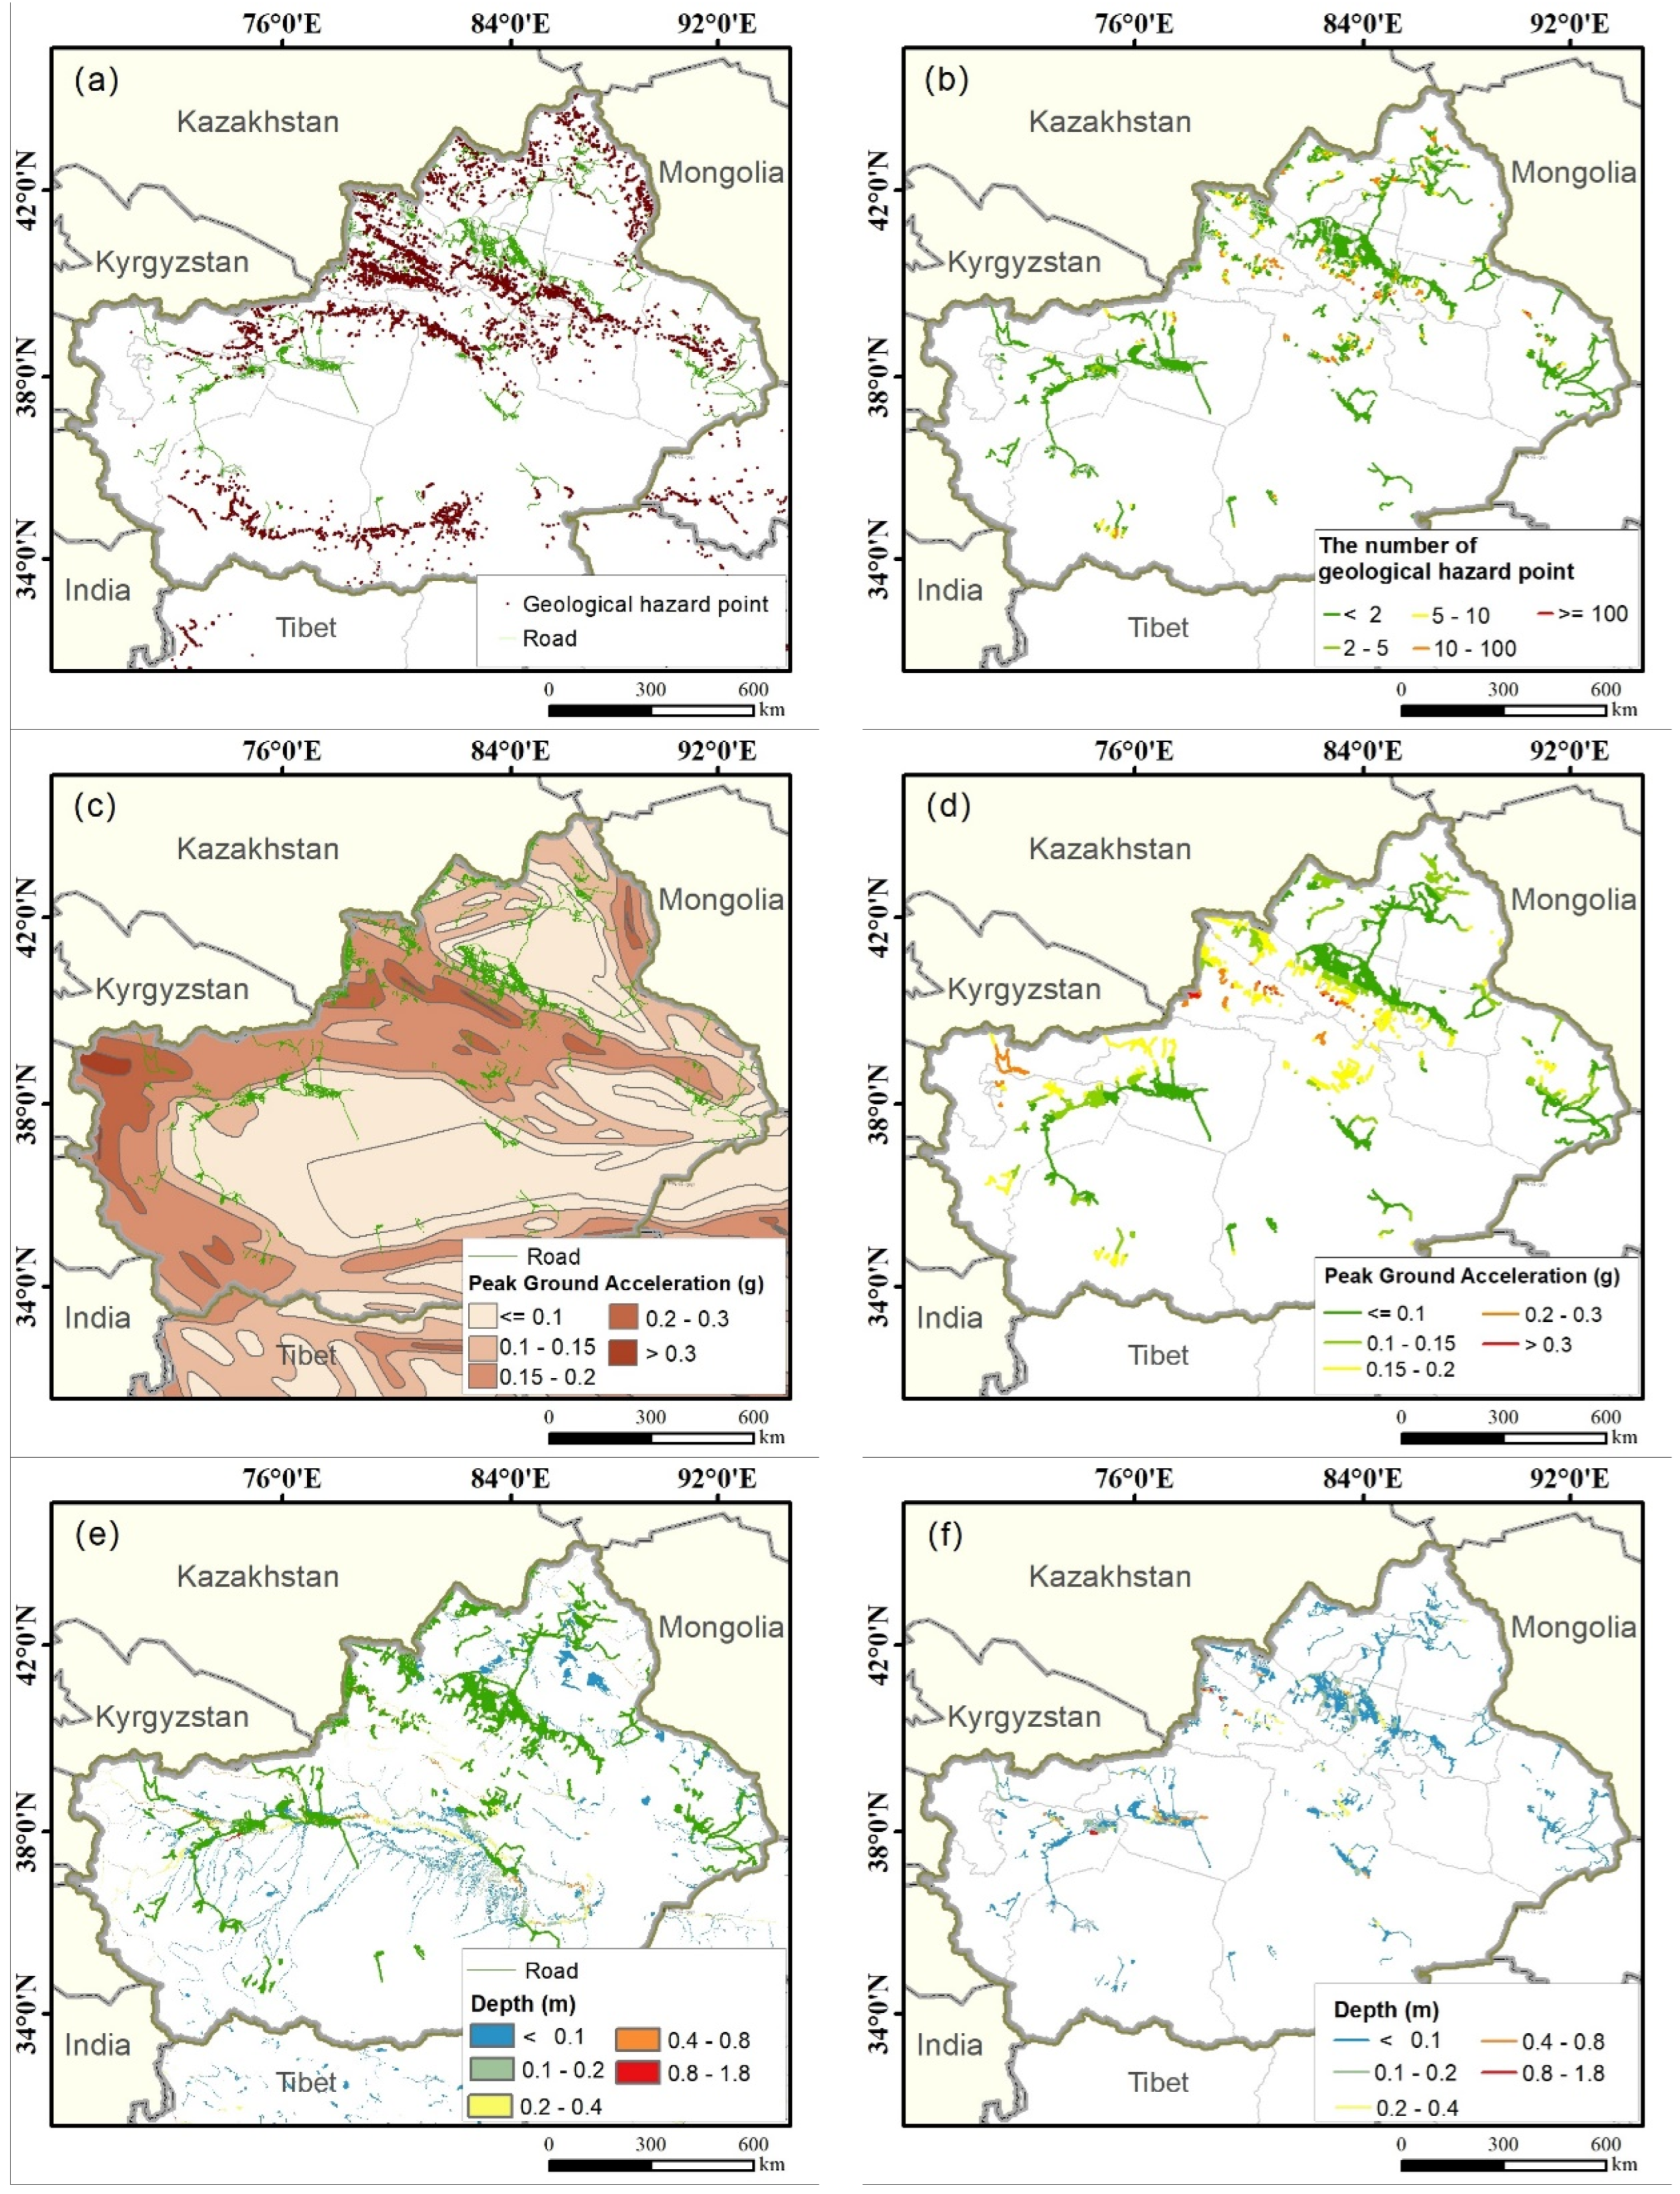
2.2. Natural Hazards
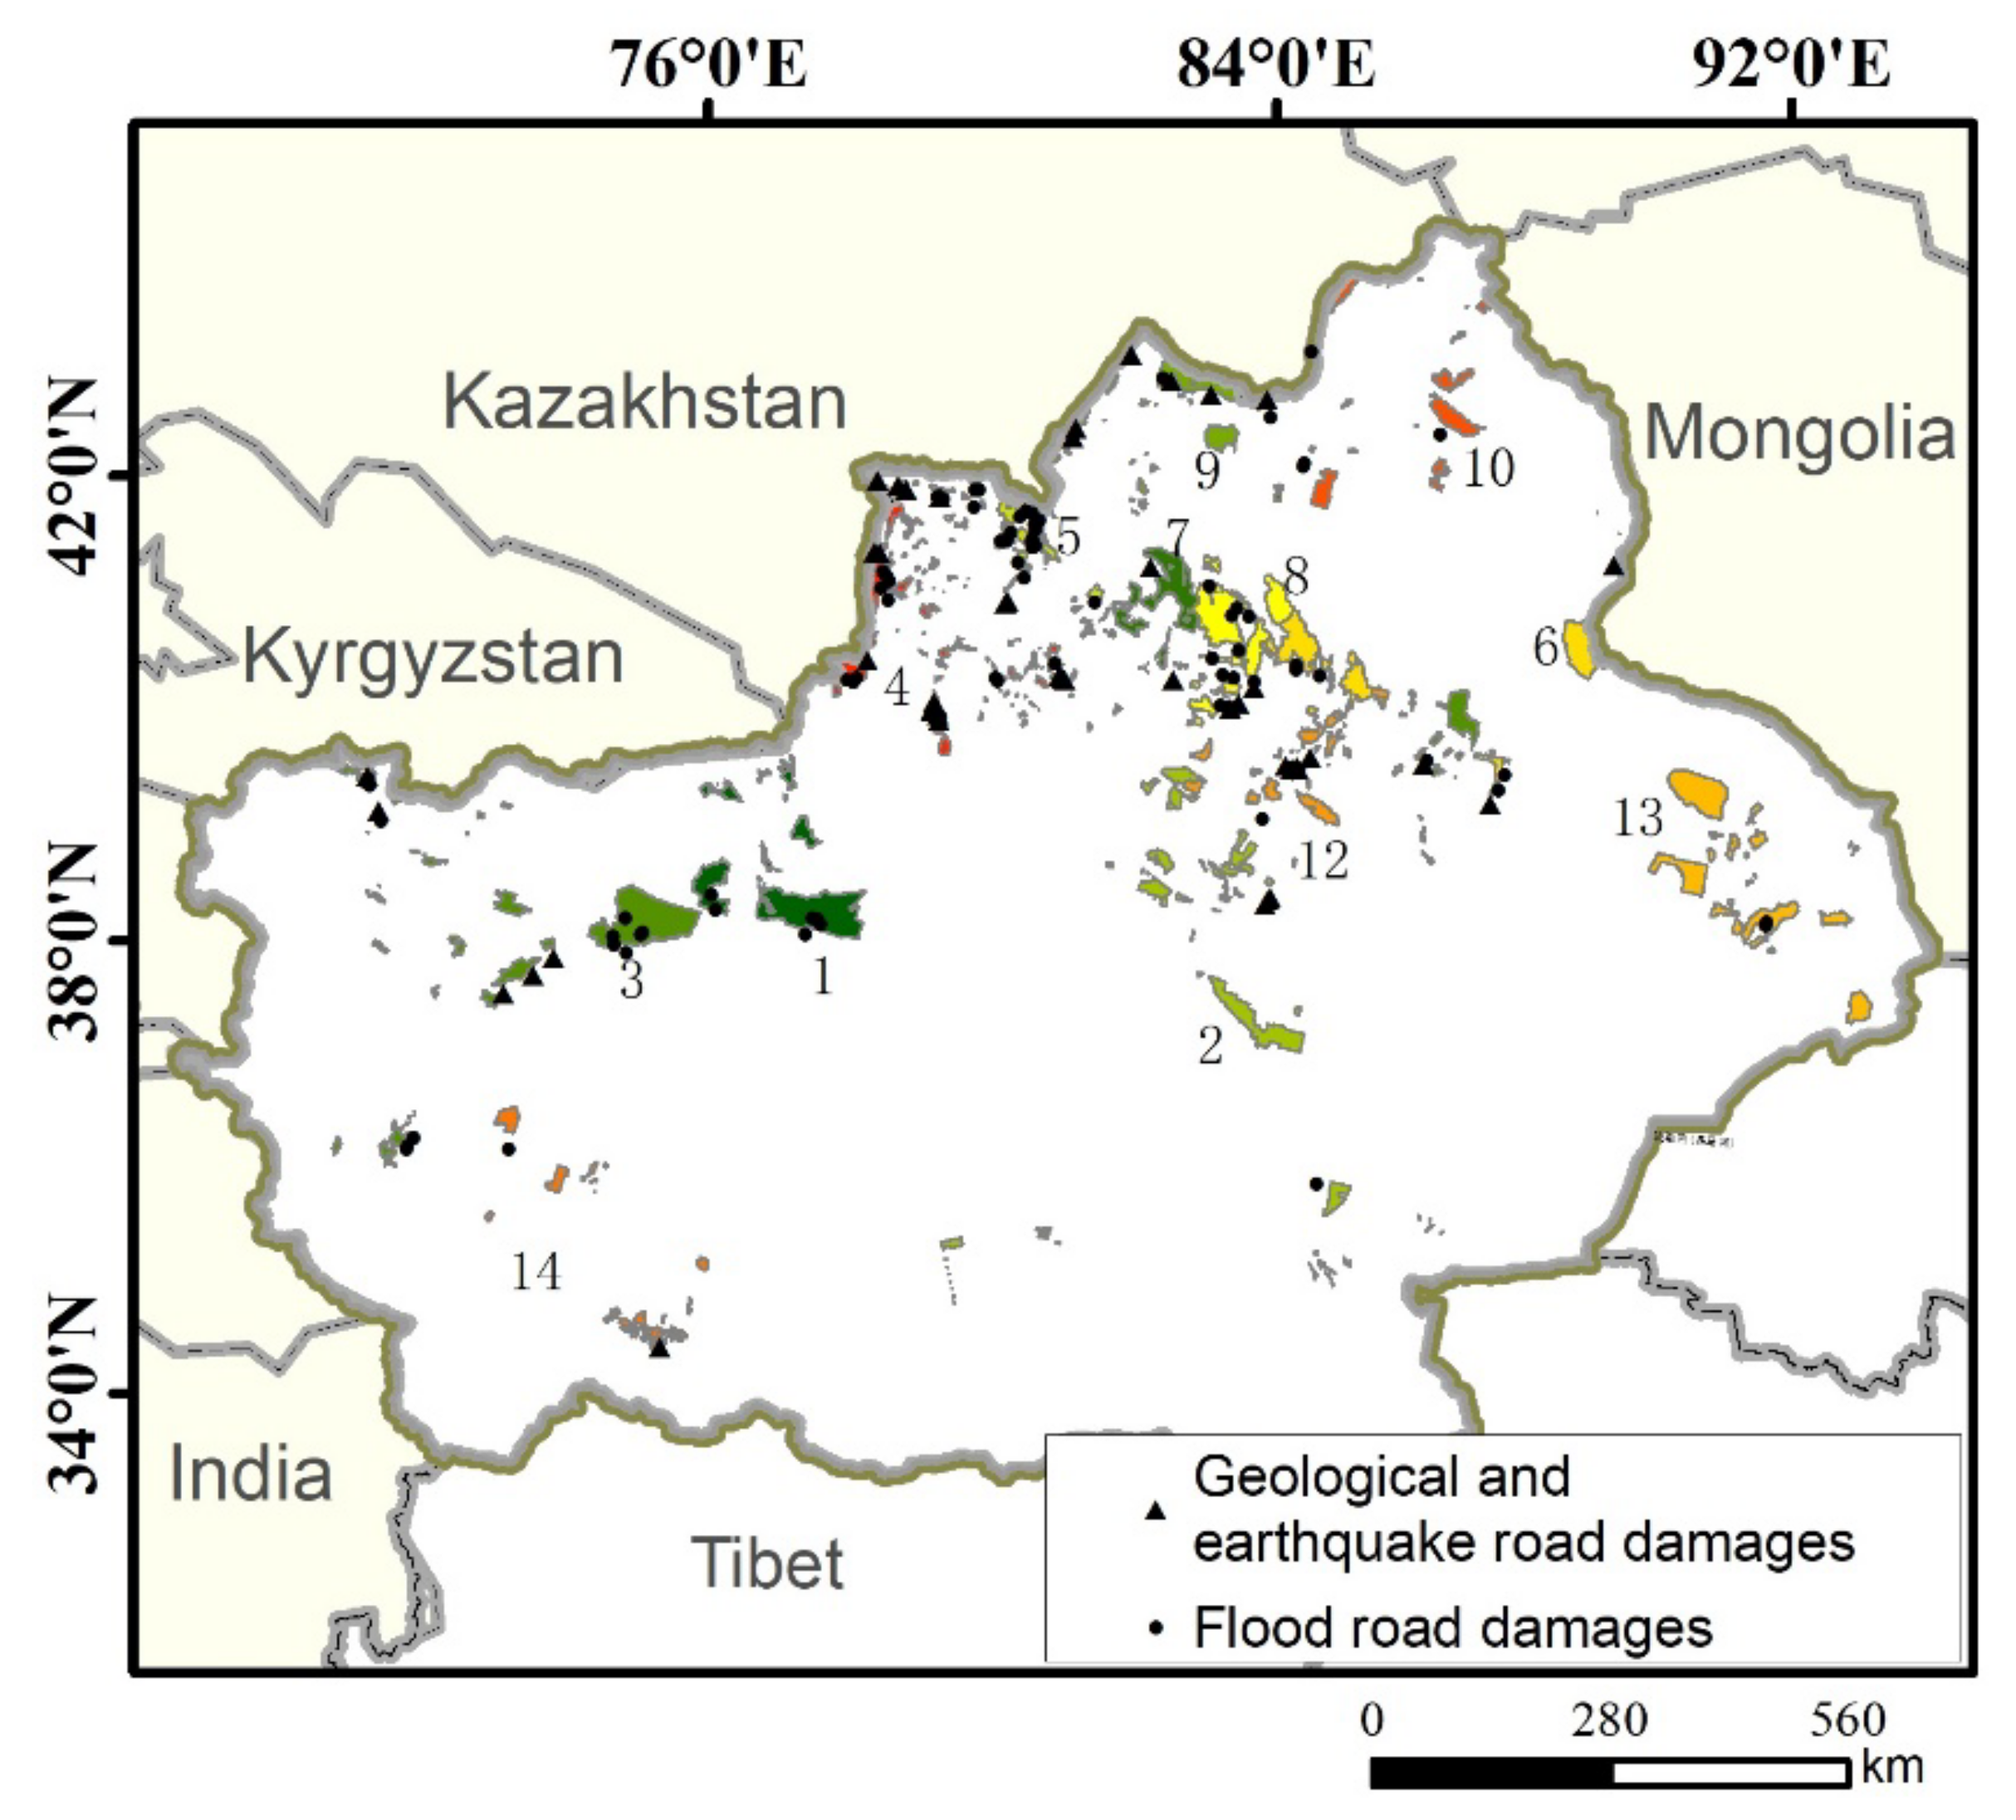
2.3. Historical Highway Damage Data
3. Method
3.1. Exposure Assessment
3.2. Reliability and Robustness Assessment
3.2.1. Reliability and Robustness Connectivity Metric
3.2.2. Reliability and Robustness Travel Time Metric
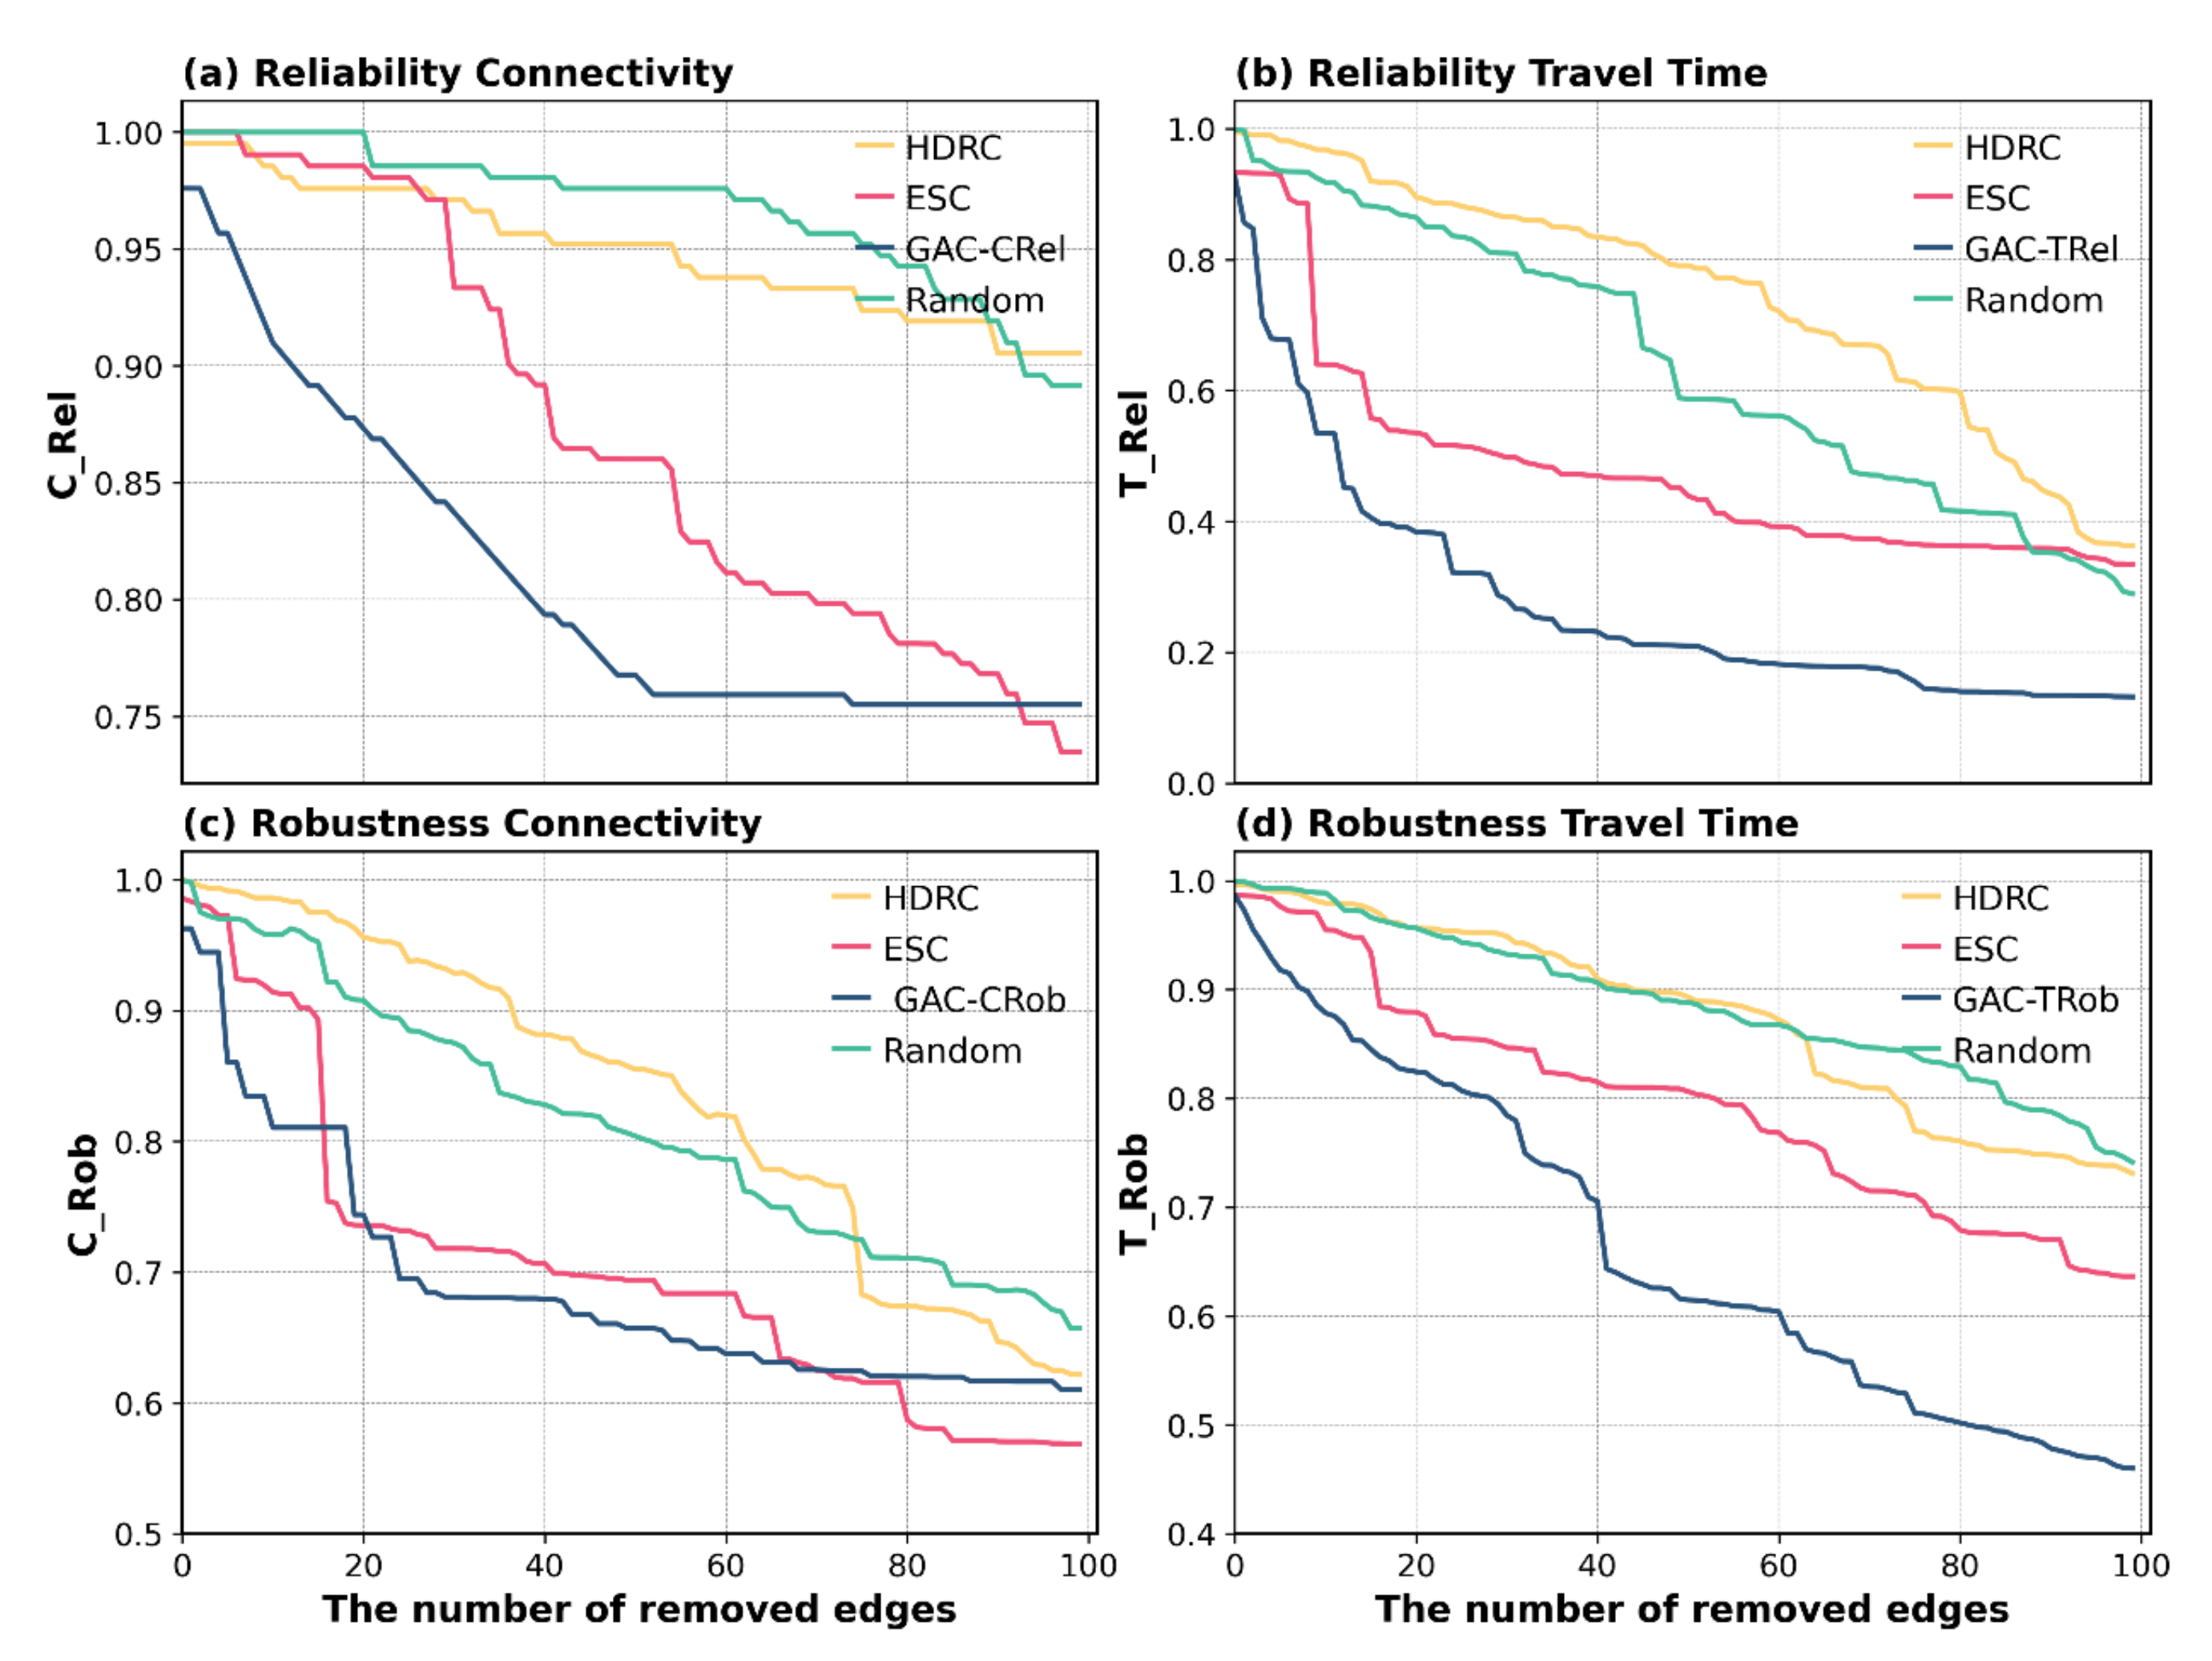
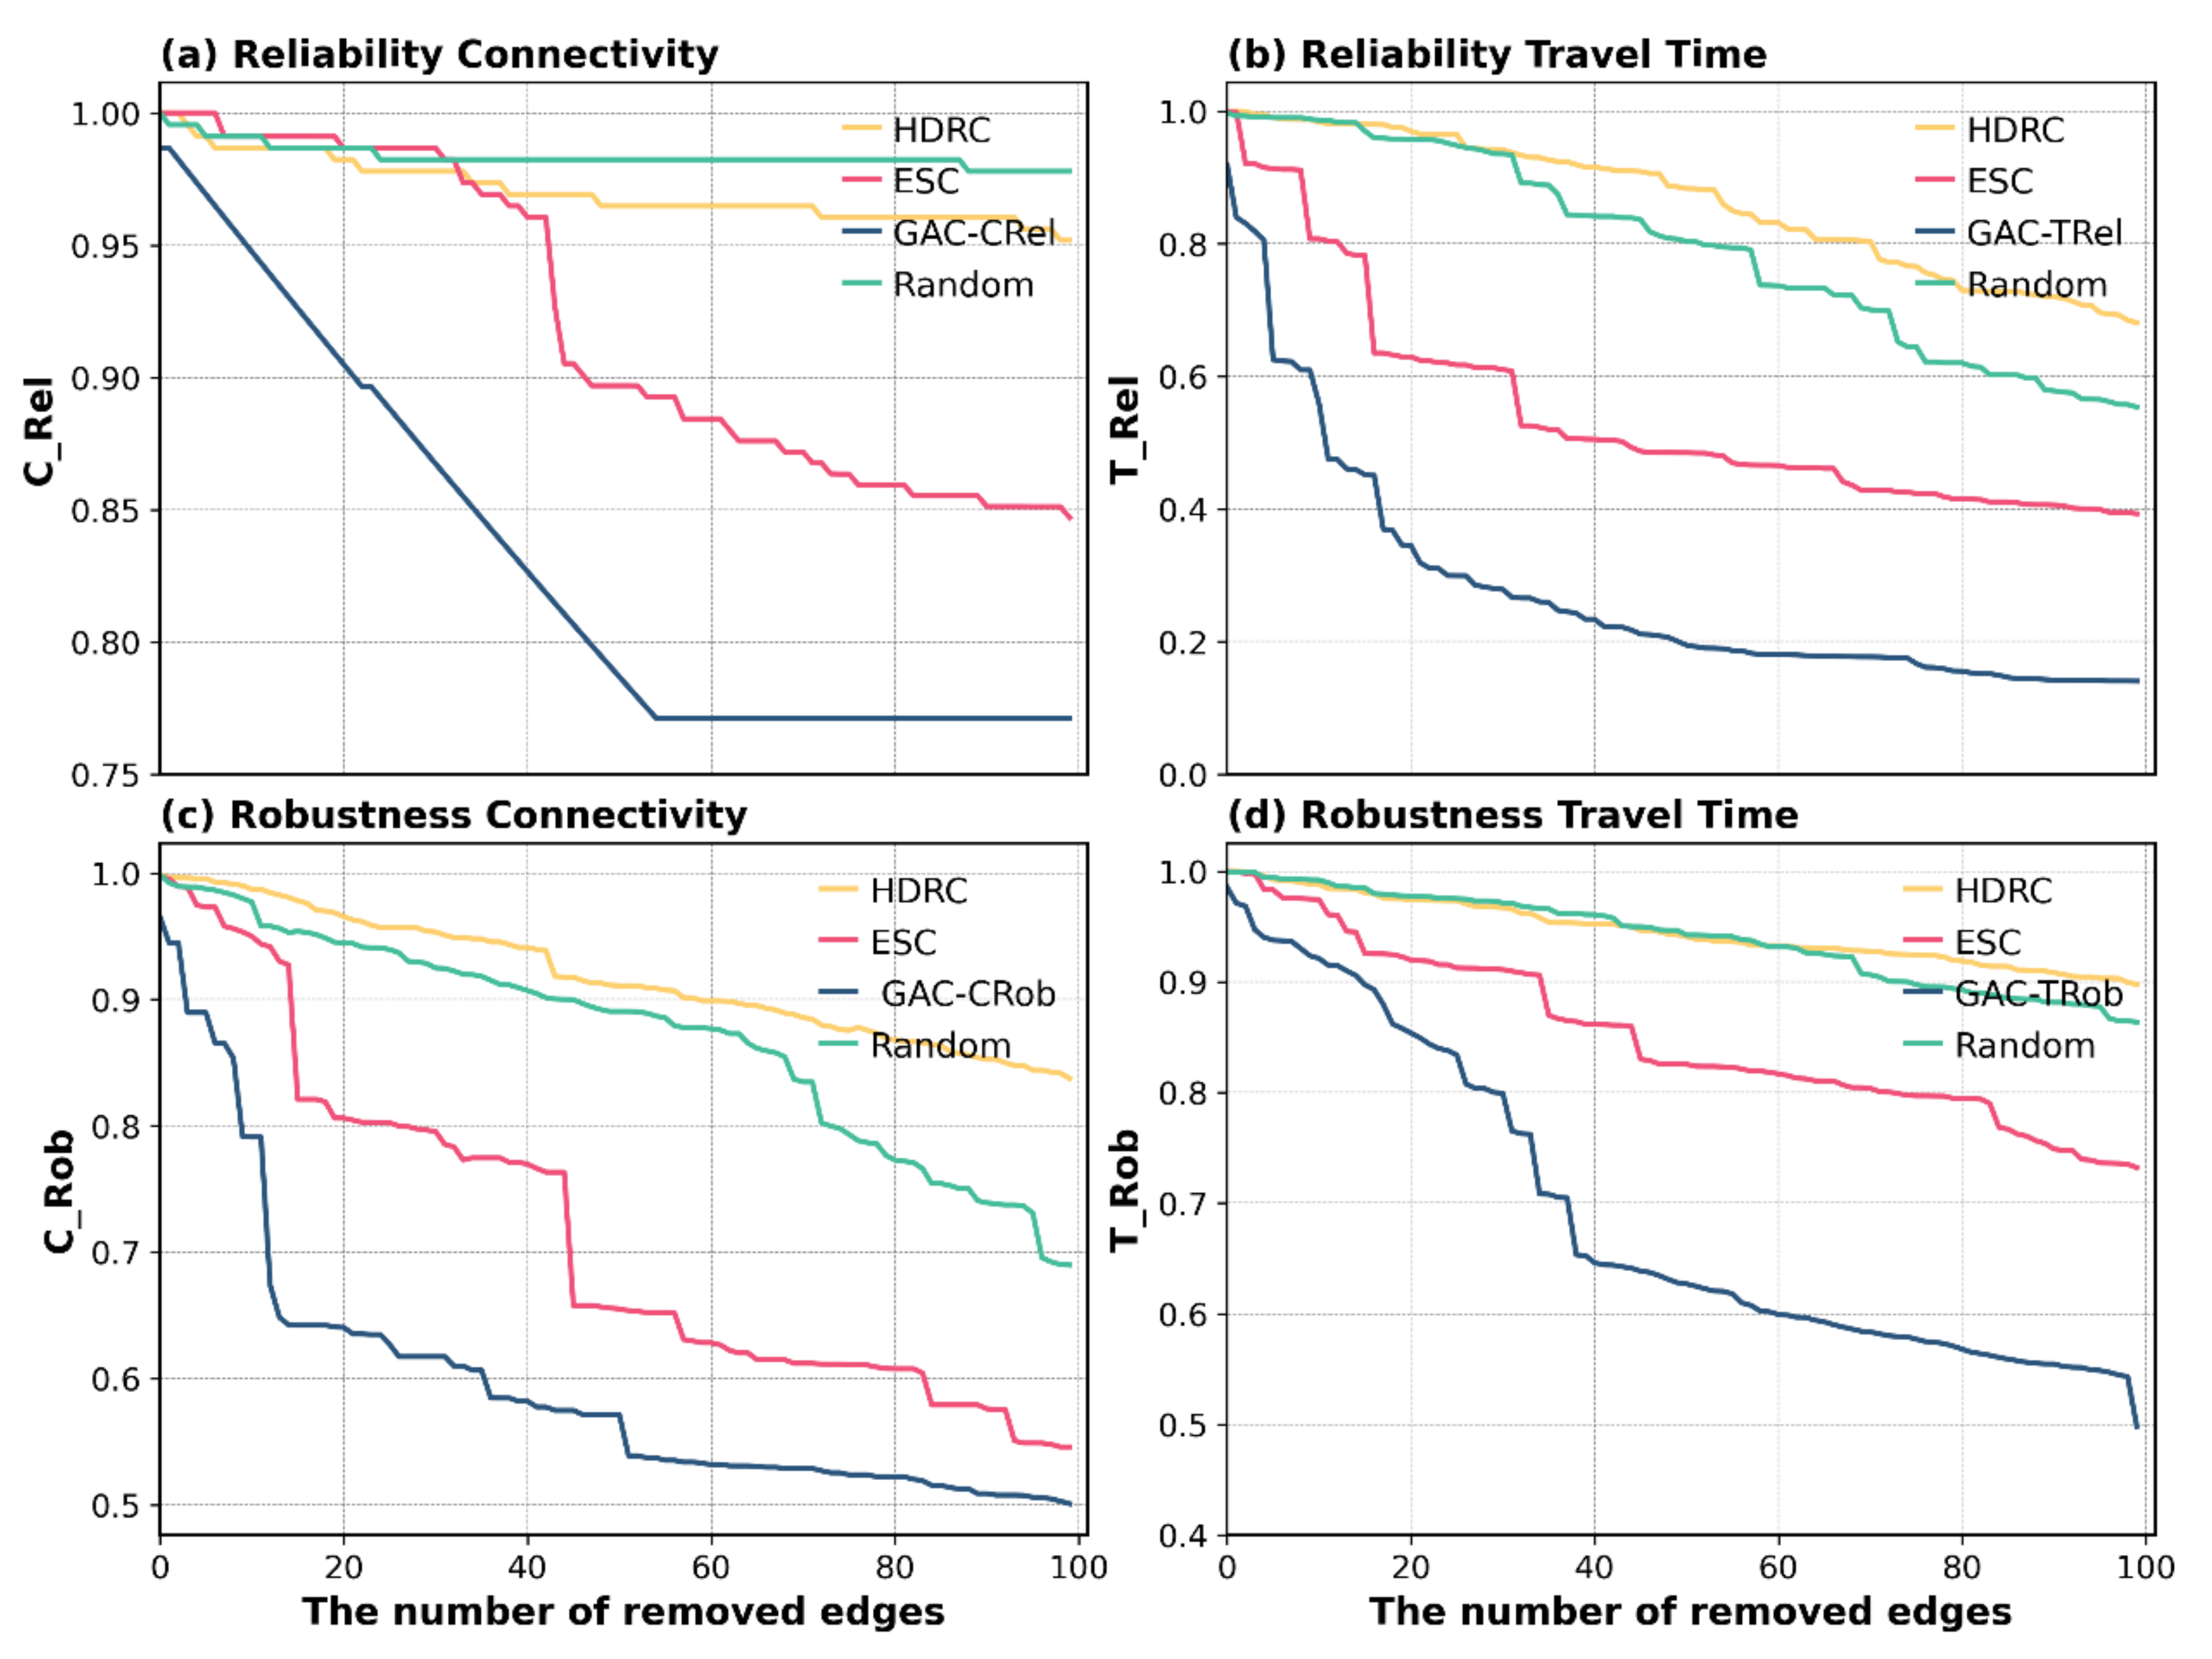
3.2.3. Attack Strategies Definition
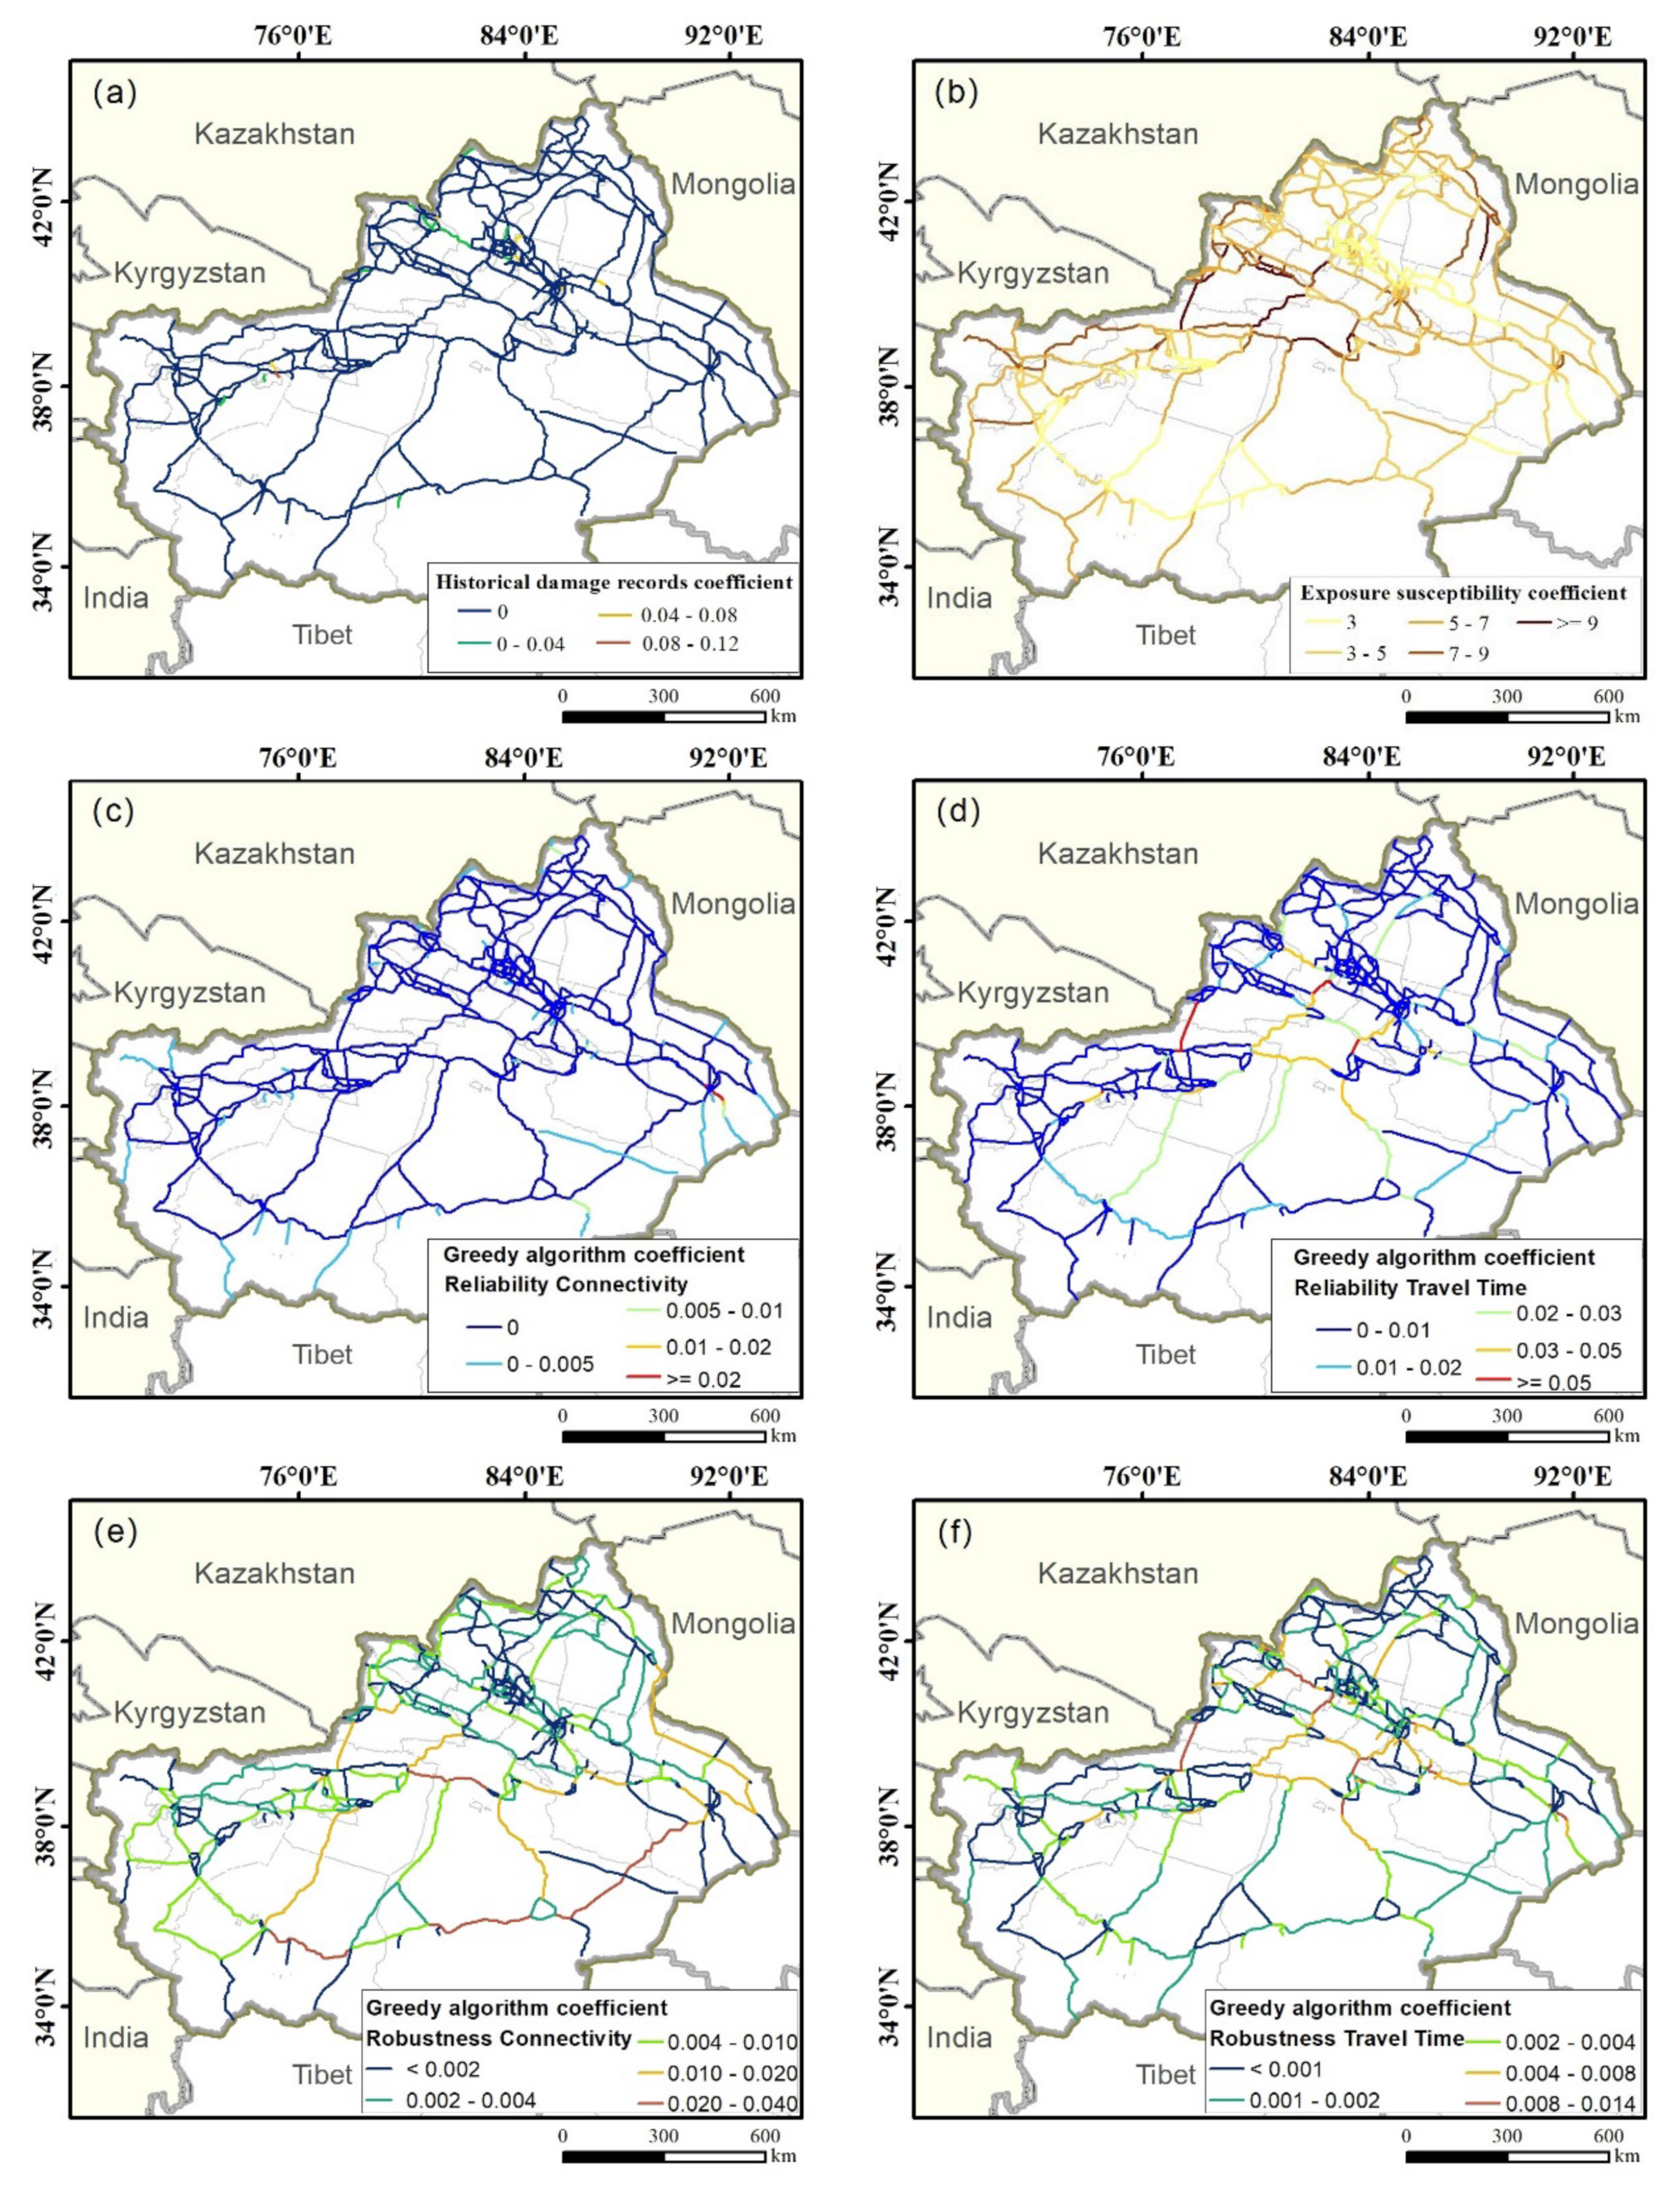
3.2.4. Historical Damage Records Coefficient
3.2.5. Exposure Susceptibility Coefficient
3.2.6. The Greedy Algorithm Coefficient
4. Results
4.1. Exposure Analysis
4.2. Reliability and Robustness Analysis
5. Discussion
6. Conclusions
Author Contributions
Funding
Institutional Review Board Statement
Informed Consent Statement
Data Availability Statement
Conflicts of Interest
References
- Boakye, J.; Guidotti, R.; Gardoni, P.; Murphy, C. The Role of Transportation Infrastructure on the Impact of Natural Hazards on Communities. Reliab. Eng. Syst. Saf. 2022, 219, 108184. [Google Scholar] [CrossRef]
- Gangwal, U.; Siders, A.R.; Horney, J.; Michael, H.A.; Dong, S. Critical Facility Accessibility and Road Criticality Assessment Considering Flood-Induced Partial Failure. Sustain. Resilient Infrastruct. 2023, 8, 337–355. [Google Scholar] [CrossRef]
- Leslie, J. How Climate Change Is Disrupting the Global Supply Chain. Available online: https://www.preventionweb.net/news/how-climate-change-disrupting-global-supply-chain (accessed on 25 February 2023).
- Asian Development Bank. People’ s Republic of China: Providing Emergency Response to Sichuan Earthquake—Technical Assistance Consultant’s Reports. 2008. Available online: https://reliefweb.int/report/china/peoples-republic-china-providing-emergency-response-sichuan-earthquake-technical (accessed on 26 February 2023).
- Central Committee of the Communist Party of China. National Comprehensive Three-Dimensional Transportation Network Planning Outline. Available online: https://transition-china.org/mobilityposts/policy-briefing-english-translation-national-comprehensive-three-dimensional-transportation-network-planning-outline/ (accessed on 26 February 2023).
- Nicolosi, V.; Augeri, M.; D’Apuzzo, M.; Evangelisti, A.; Santilli, D. A Probabilistic Approach to the Evaluation of Seismic Resilience in Road Asset Management. Int. J. Disaster Risk Sci. 2022, 13, 114–124. [Google Scholar] [CrossRef]
- Murray-Tuite, P.M. A Comparison of Transportation Network Resilience under Simulated System Optimum and User Equilibrium Conditions. In Proceedings of the 2006 Winter Simulation Conference, Monterey, CA, USA, 3–6 December 2006; pp. 1398–1405. [Google Scholar] [CrossRef]
- Zhou, Y.; Wang, J.; Yang, H. Resilience of Transportation Systems: Concepts and Comprehensive Review. IEEE Trans. Intell. Transp. Syst. 2019, 20, 4262–4276. [Google Scholar] [CrossRef]
- Sun, Y.; Xu, R. Rail Transit Travel Time Reliability and Estimation of Passenger Route Choice Behavior. Transp. Res. Rec. 2012, 2275, 58–67. [Google Scholar] [CrossRef]
- Kitamura, S.; Otaka, Y.; Ushizawa, K.; Inoue, S.; Sakata, S.; Kondo, K.; Mukaino, M.; Shimizu, E. Reliability and Validity of the Public Transportation Use Assessment Form for Individuals after Stroke. Disabil. Rehabil. 2022. [Google Scholar] [CrossRef]
- Mattsson, L.G.; Jenelius, E. Vulnerability and Resilience of Transport Systems—A Discussion of Recent Research. Transp. Res. Part A Policy Pract. 2015, 81, 16–34. [Google Scholar] [CrossRef]
- Zang, Z.; Xu, X.; Qu, K.; Chen, R.; Chen, A. Travel Time Reliability in Transportation Networks: A Review of Methodological Developments. Transp. Res. Part C Emerg. Technol. 2022, 143, 103866. [Google Scholar] [CrossRef]
- Gu, Y.; Fu, X.; Liu, Z.; Xu, X.; Chen, A. Performance of Transportation Network under Perturbations: Reliability, Vulnerability, and Resilience. Transp. Res. Part E Logist. Transp. Rev. 2020, 133, 101809. [Google Scholar] [CrossRef]
- Jiang, L.; Huang, S. Analyzing Connectivity Reliability and Critical Units for Highway Networks in High-Intensity Seismic Region Using Bayesian Network. J. Infrastruct. Intell. Resil. 2022, 1, 100006. [Google Scholar] [CrossRef]
- Leng, J.Q.; Zhang, Y.P.; Zhang, Q.; Zhao, Y.P. ping Integrated Reliability of Travel Time and Capacity of Urban Road Network under Ice and Snowfall Conditions. J. Cent. South Univ. 2010, 4, 419–424. [Google Scholar]
- Carrion, C.; Levinson, D. Value of Travel Time Reliability: A Review of Current Evidence. Transp. Res. Part A Policy Pract. 2012, 46, 720–741. [Google Scholar] [CrossRef]
- Shams, K.; Asgari, H.; Jin, X. Valuation of Travel Time Reliability in Freight Transportation: A Review and Meta-Analysis of Stated Preference Studies. Transp. Res. Part A Policy Pract. 2017, 102, 228–243. [Google Scholar] [CrossRef]
- De-Los-Santos, A.; Laporte, G.; Mesa, J.A.; Perea, F. Evaluating Passenger Robustness in a Rail Transit Network. Transp. Res. Part C Emerg. Technol. 2012, 20, 34–46. [Google Scholar] [CrossRef]
- Tejedor, A.; Longjas, A.; Zaliapin, I.; Ambroj, S.; Foufoula Georgiou, E. Network Robustness Assessed within a Dual Connectivity Framework: Joint Dynamics of the Active and Idle Networks. Sci. Rep. 2017, 7, 1–10. [Google Scholar] [CrossRef]
- Zhu, W.; Liu, K.; Wang, M.; Yan, X. Enhancing Robustness of Metro Networks Using Strategic Defense. Phys. A Stat. Mech. its Appl. 2018, 503, 1081–1091. [Google Scholar] [CrossRef]
- Bao, Y. The Xinjiang Production and Construction Corps: An Insider’s Perspective. China Int. J. 2020, 18, 161–174. [Google Scholar]
- Statistics Bureau of XPCC.2021 National Economic and Social Development Statistical Bulletin of XPCC. Available online: http://epaper.bingtuannet.com/pc/cont/202203/25/c1016621.html (accessed on 26 February 2023).
- Xinjiang Production and Construction Corps Maintenance Management Center. Analysis Report on Highway Disaster Damage of the Xinjiang Production and Construction Corps over the Years; Maintenance Management Center of XPCC: Urumqi, China, 2022.
- Koks, E.E.; Rozenberg, J.; Zorn, C.; Tariverdi, M.; Vousdoukas, M.; Fraser, S.A.; Hall, J.W.; Hallegatte, S. A Global Multi-Hazard Risk Analysis of Road and Railway Infrastructure Assets. Nat. Commun. 2019, 10, 2677. [Google Scholar] [CrossRef]
- Transport Planning and Research Institute, Ministry of Transport. Xinjiang Production and Construction Corps Comprehensive Three-Dimensional Transportation Network Planning (2021–2050); The Transportation Bureau of XPCC: Urumqi, China, 2022. (In Chinese)
- Sen, P.; Dasgupta, S.; Chatterjee, A.; Sreeram, P.A.; Mukherjee, G.; Manna, S.S. Small-World Properties of the Indian Railway Network. Phys. Rev. E Stat. Physics Plasmas Fluids Relat. Interdiscip. Top. 2003, 67, 036106. [Google Scholar] [CrossRef]
- Resource and Environment Science and Data Center Spatial Distribution Data of Geological Disaster Points. Available online: https://www.resdc.cn/data.aspx?DATAID=290 (accessed on 1 March 2023).
- Ward, P.J.; Jongman, B.; Weiland, F.S.; Bouwman, A.; Van Beek, R.; Bierkens, M.F.P.; Ligtvoet, W.; Winsemius, H.C. Assessing Flood Risk at the Global Scale: Model Setup, Results, and Sensitivity. Environ. Res. Lett. 2013, 8, 044019. [Google Scholar] [CrossRef]
- Winsemius, H.C.; Van Beek, L.P.H.; Jongman, B.; Ward, P.J.; Bouwman, A. A Framework for Global River Flood Risk Assessments. Hydrol. Earth Syst. Sci. 2013, 17, 1871–1892. [Google Scholar] [CrossRef]
- Ministry of Transport of People’s Republic of China. Technical Standard of Highway Engineering. 2014. Available online: https://www.chinesestandard.net/PDF.aspx/JTGB01-2014 (accessed on 26 February 2023).
- China Earthquake Administration (CEA). Seismic Ground Motion Parameters Zonation Map of China. 2015. Available online: https://www.gb18306.net/ (accessed on 26 February 2023). (In Chinese)
- Transport Planning and Research Institute, Ministry of Transport. Research on Safety Emergency System of XPCC Comprehensive Three-Dimensional Traffic Network in the New Era; Transport Planning and Research Institute: Beijing, China, 2023. (In Chinese)
- Newman, M.E.J. Networks: An Introduction. Astron. Nachrichten 2010, 327, 741–743. [Google Scholar]
- Leng, J. Travel Time Reliability of Urban Road Network under Ice and Snowfall Conditions; Harbin Institute of Technology: Harbin, China, 2010. [Google Scholar]
- Zhang, Z.; Schwartz, S.; Wagner, L.; Miller, W. A Greedy Algorithm for Aligning DNA Sequences. J. Comput. Biol. 2000, 7, 203–214. [Google Scholar] [CrossRef]


| Score | Very High | High | Medium | Low | Very Low |
|---|---|---|---|---|---|
| Geological hazards | 5 | 4 | 3 | 2 | 1 |
| Flood | 5 | 4 | 3 | 2 | 1 |
| Seismic | 5 | 4 | 3 | 2 | 1 |
| The Number of Geological Hazard Points | Length/km | Proportion | PGA/g | Length/km | Proportion | Depth/m | Length/km | Proportion |
|---|---|---|---|---|---|---|---|---|
| <2 | 37,661.98 | 89.01% | ≤0.1 | 19,013.49 | 44.94% | <0.1 | 40,476.05 | 95.66% |
| 2–5 | 1891.02 | 4.47% | 0.1–0.15 | 11,270.6 | 26.64% | 0.1–0.2 | 1019.84 | 2.41% |
| 5–10 | 1193.83 | 2.82% | 0.15–0.2 | 10,158.44 | 24.01% | 0.2–0.4 | 488.21 | 1.15% |
| 10–100 | 1516.24 | 3.58% | 0.2–0.3 | 1677.77 | 3.97% | 0.4–0.8 | 222.84 | 0.53% |
| 100 | 47.8 | 0.11% | >0.3 | 190.56 | 0.45% | 0.8–1.8 | 103.92 | 0.25% |
| Road Network Connectivity | Average Independent Paths | Road Network Efficiency | Average Travel Time | |
|---|---|---|---|---|
| The existing arterial highway network | 350,220.00 | 2.10 | 26,439.18 | 12.46 |
| The planned arterial highway network | 505,004.00 | 2.50 | 32,288.23 | 12.32 |
| The ratio of the change | 44.20% | 18.56% | 22.12% | −1.08% |
Disclaimer/Publisher’s Note: The statements, opinions and data contained in all publications are solely those of the individual author(s) and contributor(s) and not of MDPI and/or the editor(s). MDPI and/or the editor(s) disclaim responsibility for any injury to people or property resulting from any ideas, methods, instructions or products referred to in the content. |
© 2023 by the authors. Licensee MDPI, Basel, Switzerland. This article is an open access article distributed under the terms and conditions of the Creative Commons Attribution (CC BY) license (https://creativecommons.org/licenses/by/4.0/).
Share and Cite
Zhu, W.; Wang, S.; Liu, S.; Gao, X.; Zhang, P.; Zhang, L. Reliability and Robustness Assessment of Highway Networks under Multi-Hazard Scenarios: A Case Study in Xinjiang, China. Sustainability 2023, 15, 5379. https://doi.org/10.3390/su15065379
Zhu W, Wang S, Liu S, Gao X, Zhang P, Zhang L. Reliability and Robustness Assessment of Highway Networks under Multi-Hazard Scenarios: A Case Study in Xinjiang, China. Sustainability. 2023; 15(6):5379. https://doi.org/10.3390/su15065379
Chicago/Turabian StyleZhu, Weihua, Shoudong Wang, Shengli Liu, Xueying Gao, Pengchong Zhang, and Lixiao Zhang. 2023. "Reliability and Robustness Assessment of Highway Networks under Multi-Hazard Scenarios: A Case Study in Xinjiang, China" Sustainability 15, no. 6: 5379. https://doi.org/10.3390/su15065379
APA StyleZhu, W., Wang, S., Liu, S., Gao, X., Zhang, P., & Zhang, L. (2023). Reliability and Robustness Assessment of Highway Networks under Multi-Hazard Scenarios: A Case Study in Xinjiang, China. Sustainability, 15(6), 5379. https://doi.org/10.3390/su15065379