Article

Assessment of Petobo Flowslide Induced by Soil Liquefaction during 2018 Palu–Donggala Indonesian Earthquake

1
Graduate School of Engineering Science and Technology, National Yunlin University of Science & Technology (YunTech), Yunlin 64002, Taiwan
2
Department Civil Engineering, Universitas Negeri Semarang (UNNES), Semarang 50229, Indonesia
3
Department Civil & Construction Engineering, National Yunlin University of Science & Technology (YunTech), Yunlin 64002, Taiwan
*
Author to whom correspondence should be addressed.
Sustainability 2023, 15(6), 5371; https://doi.org/10.3390/su15065371
Submission received: 1 February 2023 / Revised: 27 February 2023 / Accepted: 7 March 2023 / Published: 17 March 2023
(This article belongs to the Section Hazards and Sustainability)

Abstract

:
This paper presents the results of the subsurface investigation and liquefaction assessment of the Petobo flowslide, induced by soil liquefaction during the Mw 7.5 Palu–Donggala earthquake of Indonesia on 28 September 2018. The investigations, including drilling, standard penetration tests, electrical resistivity imaging survey, dynamic probing, groundwater table monitoring, etc., were conducted along the main road that passes through the middle of the flowslide area. Liquefaction assessments and flowslide simulations were carried out with three assumed scenarios. Scenario 1 describes the condition if the flowslide were to be retriggered at the cease of sliding due to the same earthquake striking the site. Scenarios 2 and 3 attempt to examine the influence of locally raised groundwater levels due to the infiltration of the Gumbasa irrigation system and widespread paddy fields of the site as a result of soil liquefaction and the flowslide. Subsurface investigations revealed that, within a 30-m depth of the ground, the sliding area generally consists of sandy deposits of SM/SP/SW, except for the toe portion where thick layers of silt (ML) and clay (CL) were found. The results of field testing and liquefaction assessment identify potentially weak and liquefiable zones which enable the construction of a speculated slip surface for the flowslide. Both liquefaction assessment and flowslide simulations verify that soil liquefaction would be triggered during the earthquake as a result of locally raised groundwater tables, and that a gentle slope (≈3°) that provides static shears would lead to long-distance sliding after shaking. Should the locally raised groundwater tables not exist, the results indicate no soil liquefaction and no flowslide.

1. Introduction

A series of long-distance slides of gently sloping ground induced by soil liquefaction occurred in Palu area, Sulawesi, Indonesia, during the Mw 7.5 Palu–Donggala earthquake of 28 September 2018. The slides caused thousands of buildings and infrastructures to collapse, settle, tilt, rotate or drift away [1,2,3,4,5,6,7,8]. The National Agency for Disaster Management [9] also reported that thousands of people had gone missing or lost their lives, which caused the disaster to be classified as the worst in the world in 2018.
Petobo was one of the sites in the Palu bay area that were seriously damaged due to this earthquake, resulting in significant ground movements with a sliding distance of more than 800 m. The sliding caused an area of approximately 1.64 km2 in size of the Petobo village to be swept away [8]. In the last five years, some researchers have revealed the mechanism of the Petobo flowslide. Field reconnaissance was carried out by several researchers, who speculated that the Gumbasa irrigation canal, as well as the wet agricultural land (paddy fields), played an important role during the incident. Additionally, Kusumawardani et al. [8] presented a morphological zonation along Moh Soeharto road, the east–west main road of the Petobo site, describing the observed surface conditions and possible mechanism of the sliding in accordance with the terminologies proposed by Hungr et al. [10]. Previous studies have attempted to reveal the subsurface condition of the site, but results were relatively limited. Kiyota et al. [7] and Mason et al. [11] conducted portable dynamic cone penetration tests (DCPT) and piezocone penetration tests (CPTu), respectively, in their studies. The investigation by Kiyota et al. [7] showed that the stratified soil was less than 5 m deep. Additionally, Mason et al. [11] conducted parallel CPTu outside of the main area affected by liquefaction. The Japan International Cooperation Agency and PT Indra Karya [12] performed some drilling, standard penetration tests (SPT) and Swedish sounding near the crown and toe of the slide. These studies supplemented additional data to describe the condition at the flowslide area.
We developed a hypothesis to prove the contributing factors that resulted in soil liquefaction and caused the huge flowslide during the major earthquake. The contributing factors included the unlined Gumbasa Irrigation Canal and the widespread wet paddy that promoted continuous water leakage and hence raised the groundwater table close to the surface of the site.
Based on this hypothesis, this paper aims to provide a more thorough interpretation of the subsurface material profile along the main road of the Petobo site, in order to assess the liquefaction potential of onsite soils, and to examine the mechanism of the flowslide in relation to the influence of the Gumbasa irrigation canal and wet paddy fields. The UNNES-YunTech team collaborated to conduct a thorough investigation for this study, which started in mid-2019. The investigation program included borehole drillings, SPTs with hammer energy measurement, field permeability testing, groundwater table (GWT) monitoring, dynamic (GCO) probing and electrical resistivity image (ERI) surveying. Moreover, digital elevation model data from the Center of Data and Information Technology of Indonesia [13] were utilized to create pre- and post-slide profiles.
To evaluate the effect of the infiltration of the irrigation system and paddy fields on soil liquefaction and flowslide, three analysis scenarios were adopted by assuming various slope geometries and groundwater conditions. With these scenarios, liquefaction analyses of boreholes as well as flowslide simulations were carried out. By combining the information of onsite probing and sounding, liquefaction assessment provided potential zones of liquefaction, which enabled the construction of a speculated slip surface for the flowslide. Flowslide simulations adopted the slip surface geometry and were performed to examine the phenomena of a flowslide for the analysis scenarios, which would hopefully provide a better understanding of the causes and mechanism of the Petobo slide.

2. Study Site

Palu is the capital city of Central Sulawesi, Indonesia, with a population of more than 300,000 people. The city has an elevation of around 20–80 m above the mean sea level, with an annual rainfall of approximately 1500 mm. According to Risna [14], the morphology of Palu city is generally smooth with a gradient of 0~5% in the bay area and 5~15% along the hillsides.
Figure 1 shows the locations of long-distance slides observed in Palu city and its surroundings due to this earthquake, including Balaroa, Petobo, Jono Oge and South Sibalaya. Balaroa and Petobo slides are located within Palu city border, and Jono Oge and South Sibalaya slides are situated in Sigi regency. The slides in Petobo, Jono Oge and South Sibalaya are adjacent to and below the Gumbasa irrigation canal, as shown in Figure 1, which was mostly unlined but was constantly full of water during and prior to the earthquake [1,7,11].
This paper will focus on the Petobo slide, which is located around 500 m to the south of Mutiara Al Juffire airport, the international airport of Palu city. As can be seen in Figure 1 and Figure 2, the footprint of the sliding area is approximately 1.64 km2, with an elongated shape that extends approximately 2.4 km in the EW direction. The transverse (NS) widths in the eastern and western portions of the area are 1.3 km and 0.65 km, respectively. The general gradient of the pre-slide surface of the sliding footprint was less than approximately 3° dipping towards the west.
Along the crown (east boundary) of the sliding area, the Gumbasa irrigation canal runs from south to north, making a sharp turn to the west, going through the NE portion of the area, and then existing at the north sliding boundary.
To gain a better understanding of the mechanism of the slide, Kusumawardani et al. [8] characterized the morphological zonation of the Petobo site. They divided the site into four major zones: ground slide (GS), liquefaction spread (LS), liquefaction flow (LF), and debris flood (DF). In this paper, we adopt these characterizations and use them as a basis for subsurface investigation and liquefaction assessment along the main road of the Petobo sliding area.

3. Geological Setting

The island of Sulawesi is situated at a triple junction of the Pacific, Indo-Australian and Eurasian plates [15,16]. Its geological history is characterized by subduction, extension, obduction, and collision [17]. The most active fault of the island, the Palu–Koro fault, with a length of around 550 km, traverses through Palu city and divides the island into the Makassar and North Sula regions [18]. The estimated average slip rate of the fault is approximately 34 mm/year [19].
The Palu bay area sits on two rock formations, Celebes Molasse of Sarasin and Sarasin (QTms) and Alluvium and Coastal Deposits (Qap) [20]. The QTms and Qap are of mid-Miocene age and Holocene age, respectively. The QTms consists of weakly consolidated conglomerate, sandstone, mudstone, coral limestone, and marl. Gravel, sand, mud, and coral limestone are included in this formation. The latest geological map of Palu and the surroundings was proposed by Hanifa [21]. Based on the map, the Petobo flowslide area is located at the junction of the formation of an Old Alluvium Fan deposit (Qf2) and the formation of the Alluvial, Flood and Old River Channel deposit (Qal) of the Palu river valley. Kiyota et al. [7] constructed trenches through the scarps of the Petobo slide and found interbedded layers of gravelly, sandy, or silty alluvial deposits. Kiyota et al. [7] also performed chronological dating and found that the alluvial sediments of the sliding area were formed around 1000–2000 years ago.

4. Seismic Motion

The ground shaking of the 2018 Palu–Donggala earthquake was recorded at a few seismic stations, with Mapaga station and Palu station being closer to the locations of flowslide incidents in the Palu bay area. Mapaga station is located at 0.3374° north latitude and 119.898° east longitude, with a distance of 57 km to the north of the epicenter (Figure 1). The peak ground accelerations (PGAs) at this station were recorded as 0.086 g, 0.142 g, and 0.096 g, in the EW, NS, and UD directions, respectively [22].
The Palu station is located at Balaroa of Palu City, with the coordinates of −0.9054° south latitude and 119.8366° east longitude, and around 80 km to the south of the epicenter (Figure 1). The Petobo site is to the southeast of the Palu station with a distance of around 9 km. Based on studies of Thein et al. [15], the depth of bedrock at Palu station is approximately 230 m below the ground. The peak ground accelerations recorded at this station were 0.207 g, 0.280 g, and 0.338 g, respectively, in the EW, NS, and UD directions [22]. Based on suggestions by Kiyota et al. [7], the maximum horizontal vector acceleration at Palu station that considered both the EW and NS components of the shaking was 333 gal (0.34 g), which was therefore adopted in the soil liquefaction assessment of this study.

5. Methods

5.1. Electrical Resistivity Imaging

An electrical resistivity image (ERI) survey was adopted as a non-destructive and non-invasive method to identify the lateral and vertical extents of the type of earthen materials with different resistivity values [23]. The resistivity value of earthen materials at the site is influenced by several factors, including the mineral components, degree of saturation, material density, void or cavity, and pore fluid content, etc. [24]. In this investigation, ERI data were utilized to estimate the lateral soil distribution based on the resistivity value.
Six profiles of the ERI survey were conducted approximately along the main road at the Petobo site (Figure 2) using the combination of Wenner and Schlumberger arrays, with an electrode spacing of 8 m and potential probes at 13 times of the electrode spacing. The Wenner–Schlumberger array was chosen because it provides a better signal strength [25] and a moderate sensitivity to the vertical and lateral structures [26,27]. The Res2DInv software was used to invert the data and obtain the true resistivity of materials [28]. After several iterations, a good fit with a root mean square (RMS) error of less than 10% in terms of the resistivity value could be achieved for each of the measurement points. Finally, two-dimensional (2D) apparent resistivity contours of the survey profile were established by using the inverse distance weighting (IDW) interpolation method.

5.2. Boring and In-Situ Testing

The hammer for standard penetration testing (SPT) should have a mass of 140 pounds (63.5 kg) and a free drop of 30 inches (0.76 m) before hitting the anvil. Various types of hammer and drop systems deliver different hammer energies on drilling rods and the split spoon sampler, and thus cause dissimilar values of the blow count (N-value). Seed et al. [29] suggested that, for liquefaction assessment, the measured SPT blow counts should be corrected to a reference energy ratio (ER) of 60%, with respect to the theoretical value of 473.4 Joules.
To evaluate the ER values for this study, the hammer energy was measured during SPT by installing accelerometers and strain gauges on the drilling rods. Through the integration of recorded accelerations and strains over time, the stress wave velocities and axial forces could be obtained, respectively, which enabled the computation of the energy delivered for each of the hammer drops [30,31]. In this study, we adopted the SPT Analyzer, a device from Pile Dynamics, Inc. (Cleveland, OH, USA), for the evaluation of ER values, and hence the normalized SPT blowcounts of 60% (N60), for the subsequent liquefaction assessment of the Petobo site.
During February 2020, we constructed five boreholes (BH-1–BH-5) along the main road (Moh Soeharto) of the Petobo site, as seen in Figure 2. The advance depth of the boreholes varied between 20 m and 24 m. SPTs were conducted at 1.5 m depth intervals. In BH-1, BH-2, and BH-3, the hammer energy for each of the SPT blowcounts was measured, with ER values of 70.9%, 70.4%, and 64.8%, respectively. For BH-4, BH-5, and LP-3, however, an average ER value of 68.7% was adopted. The borehole LP-3 with an SPTs interval of 1 m was constructed by the Japan International Cooperation Agency and PT Indra Karya [12] and was considered in this study.
Dynamic (GCO) probing is commonly used in Hong Kong for assessing the quality of compaction and the depth of hard layers [32]. The device comprises a sectional rod fitted with a cone tip at the end and is driven manually into the ground by a 10 kg dead weight dropping at a constant distance. During the probing, the number of blowcounts per 100 mm penetration (GCO-N value) is recorded.
The GCO probing test and additional data from other sources, including the results of Swedish sounding from the Japan International Cooperation Agency and PT Indra Karya [12], DCPT from Kiyota et al. [7], and CPTu from Mason et al. [11], were used as additional data to interpret soil stratification. The location of all the tests performed is presented in Figure 2.

5.3. Groundwater Level Monitoring

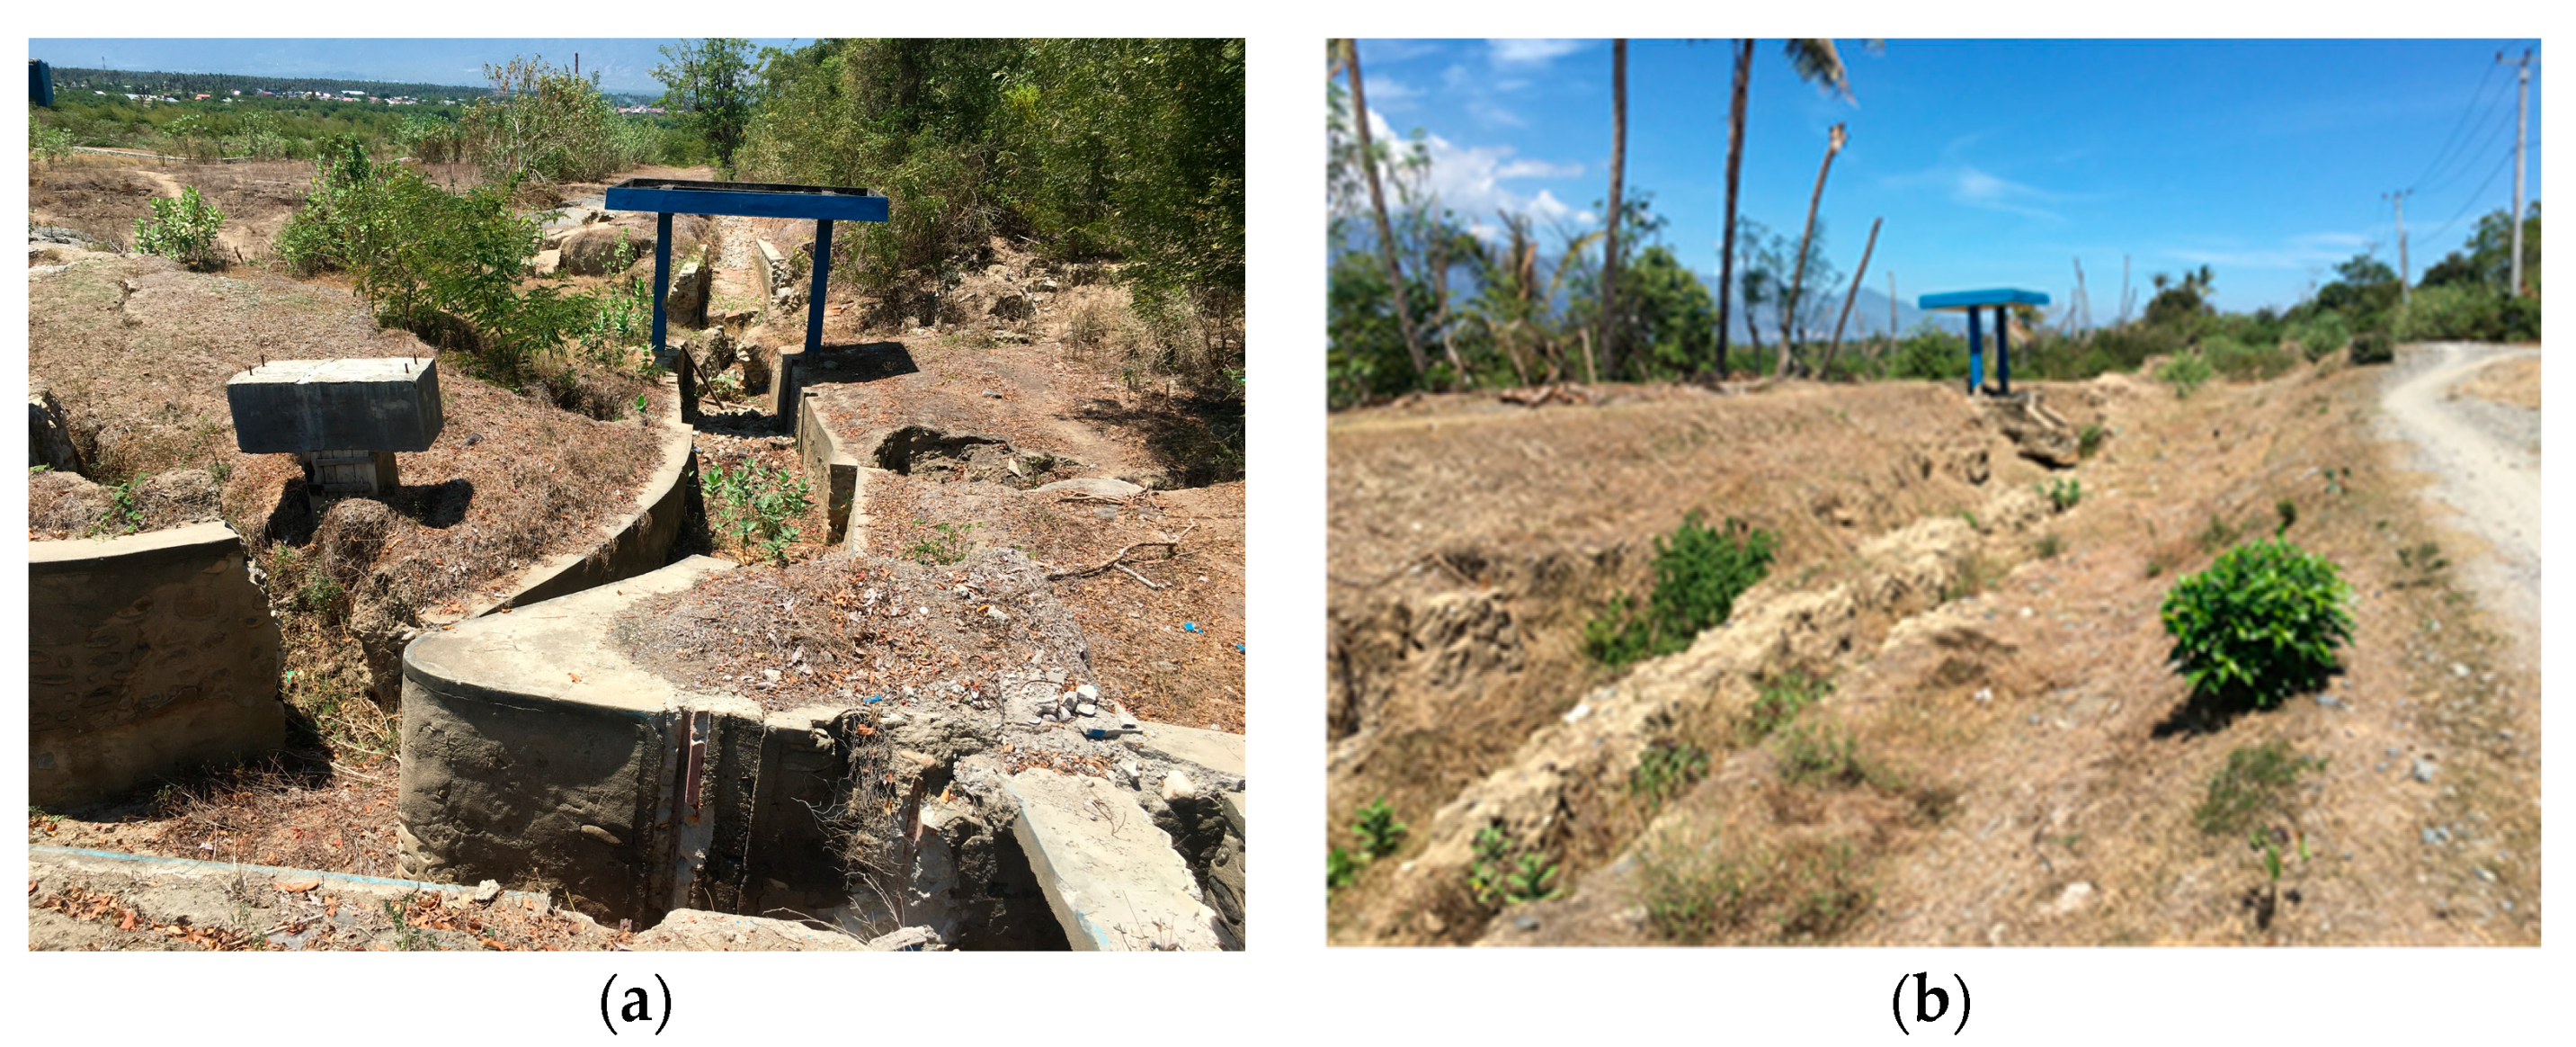
To verify the seasonal effect, groundwater monitoring was conducted periodically after the drilling for a period of one year. The onsite monitoring activities were started in early 2020, which was more than one and a half years after the sliding incident occurred. The Gumbasa irrigation system was destroyed and was no longer in use after the sliding (Figure 3), so the local people who survived the earthquake were relocated and the widespread paddy fields were abandoned. Accordingly, the monitoring results of this study represent a groundwater condition with no influence from the anthropogenic factors that led to the infiltration of water and hence the rise in local groundwater level at the Petobo site.

5.4. Scenarios for Assesment and Simulation

Due to the effects of the Gumbasa irrigation system as well as the widespread wet-paddy fields that would have influenced the groundwater of the region, the infiltration and raising of the local groundwater table, in association with the earthquake shaking, thus become important issues with regard to the soil liquefaction and subsequent flowslide of the site [1,2]. In order to envisage the potential effect of the groundwater table and slope geometry on the sliding, three analysis scenarios are assumed. Table 1 shows the analysis scenarios adopted for liquefaction assessment and flowslide simulations in this study.
Scenario 1 represents a situation with post-slide slope geometry and high groundwater level, adopted to evaluate the potential re-initiation of liquefaction or sliding if the same earthquake hits the site again. Scenario 2 is used for pre-slide slope geometry and a high groundwater table at the time this earthquake and sliding incident occurred, to assess the soil liquefaction and flowslide of the Petobo site due to the shaking, in consideration of the influence of the Gumbasa irrigation canal and wet paddy fields on locally raised groundwater table. Scenario 3 represents the condition of pre-slide slope geometry and a low groundwater table with the aim to examine the liquefaction and flowslide of the site due to earthquake shaking without the influence of the Gumbasa irrigation canal and wet paddy fields. These scenarios have been considered in the liquefaction assessment and numerical simulations of this study.

5.5. Liquefaction Assessment

The factor of safety against liquefaction (FL) is defined as the fraction of the cyclic resistance ratio (CRR) to the cyclic stress ratio (CSR), i.e., FL = CRR/CSR. The CRR denotes the resistance of soil and the CSR indicates the cyclic shear stress introduced by earthquake shaking, both of which are normalized by the initial effective stress at the depth of concern. Generally, FL is calculated at consecutive depths of a deposit, to a maximum depth of computation of around 20 m where soil liquefaction would most likely occur. With the computed FL profile of a borehole, we are able to identify the depth zones where soil liquefaction would be possible. If the FL profiles of a series of boreholes along an analysis cross-section are available, the identified liquefaction zones of the boreholes can provide a basis for the construction of a potential sliding surface in the cross-section for a given scenario of earthquake shaking and groundwater conditions.
Several methods of analysis for soil liquefaction are available, for which the SPT-N-based simplified empirical approach appears to be most commonly used in academia and industry. In this study, we considered the Seed/NCEER [33] and JRA [34] methods based on the SPT-N approach for the liquefaction assessment of the Petobo site.
The Seed/NCEER method was first introduced by Seed and Idriss [35]. The method has been modified several times in the past (e.g., [29,36,37,38]). The current version of the method was updated by the NCEER and NSF workshops of 1996 and 1998 [33].
Unlike Seed/NCEER, the JRA method considers gravelly soils in the liquefaction evaluation. The JRA method was first introduced in 1990 [38], where the cyclic resistance of soils was developed based on the results of the laboratory testing of in situ samples. In the updated version of the method, the cyclic resistance of gravelly soils was established based on the limited laboratory results of frozen samples [34].
In liquefaction analysis, the CSR evaluation is based on the groundwater table during the earthquake (GWT), for effective stress calculation and normalized cyclic stress due to shaking. In CRR evaluation, the groundwater table during drilling (GWT0) should be used for the correction of effective overburden and the SPT-N1 value, as suggested by Chang et al. [39]. In accordance, two groundwater tables have been considered, and the terms GWT and GWT0 are adopted in this study.

5.6. Flowslide Simulation

The liquefaction assessment discussed above would indicate conditions of soil liquefaction in the deposit during earthquake shaking. It would not be able to provide this information, however, if the flowslide was triggered as well as the process of sliding. To gain a better understanding of the 2018 Petobo flowslide, the numerical software, LS-Rapid, was adopted for the simulation of the various analysis scenarios discussed previously.
LS-Rapid, a piece of flowslide simulation software, was initially proposed by Sassa [40] and then updated in 2004 [41]. LS-Rapid is capable of investigating the sliding behavior of slopes subjected to earthquake shaking or rainfall infiltration, which considers the triggering factors to be seismic inertia force or excess porewater pressure, as well as the strength reduction of materials and the dilation effect of sliding mass [42]. The deformation and the displacement of sliding mass are analyzed and computed with respect to time. The software also has the ability to simulate rapid and long-travelling flowslides. The computation concept of the software is speaks to the determination of where the flowslide might start, and to where the flowslide may develop and cease in a massive region [43]. The LS-Rapid has the feature of strength reduction through deformation and gradual failure.
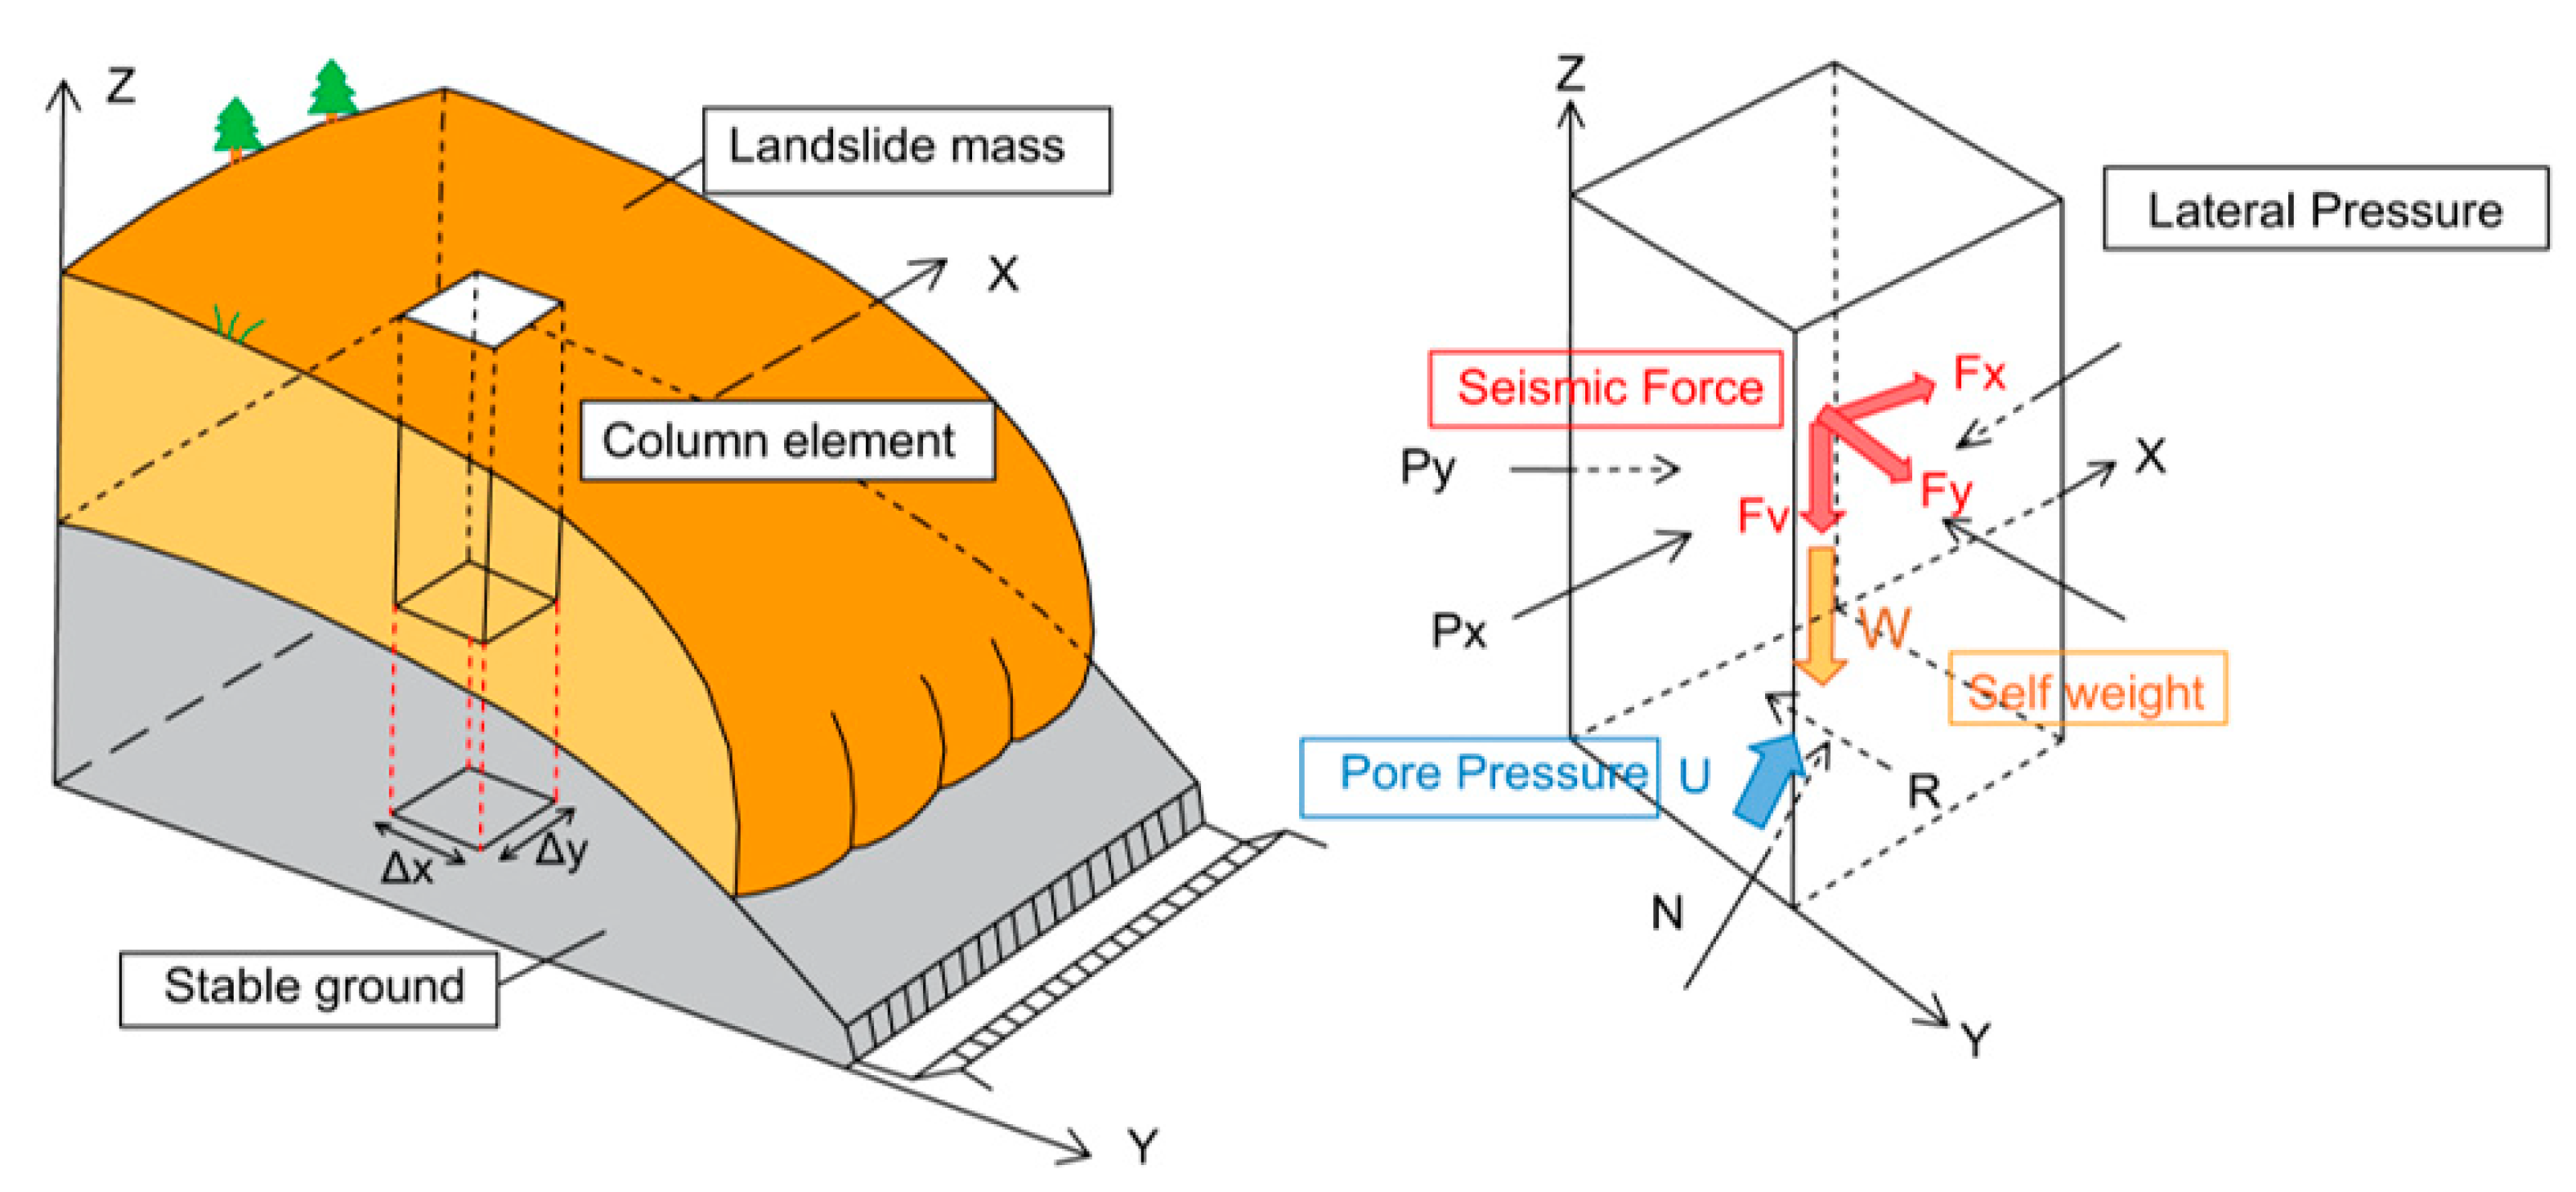
The condition of a moving mass, as adopted in LS-Rapid, is based on Newton’s second law of motion. Accordingly, the forces applied on a typical soil column of a moving mass, as shown in Figure 4, shall satisfy the following equation [42,44]:
( W + F v + F x + F y ) + ( P x x Δ x + P y y Δ y ) + R = m × a
where  W and  m are the weight and mass of the soil column, respectively;  F v F x and  F y the seismic forces;  P x and  P y are the lateral contact forces;  R is the shear resistance at the base; and  a is the acceleration of the soil column.

6. Results

6.1. Groundwater Monitoring

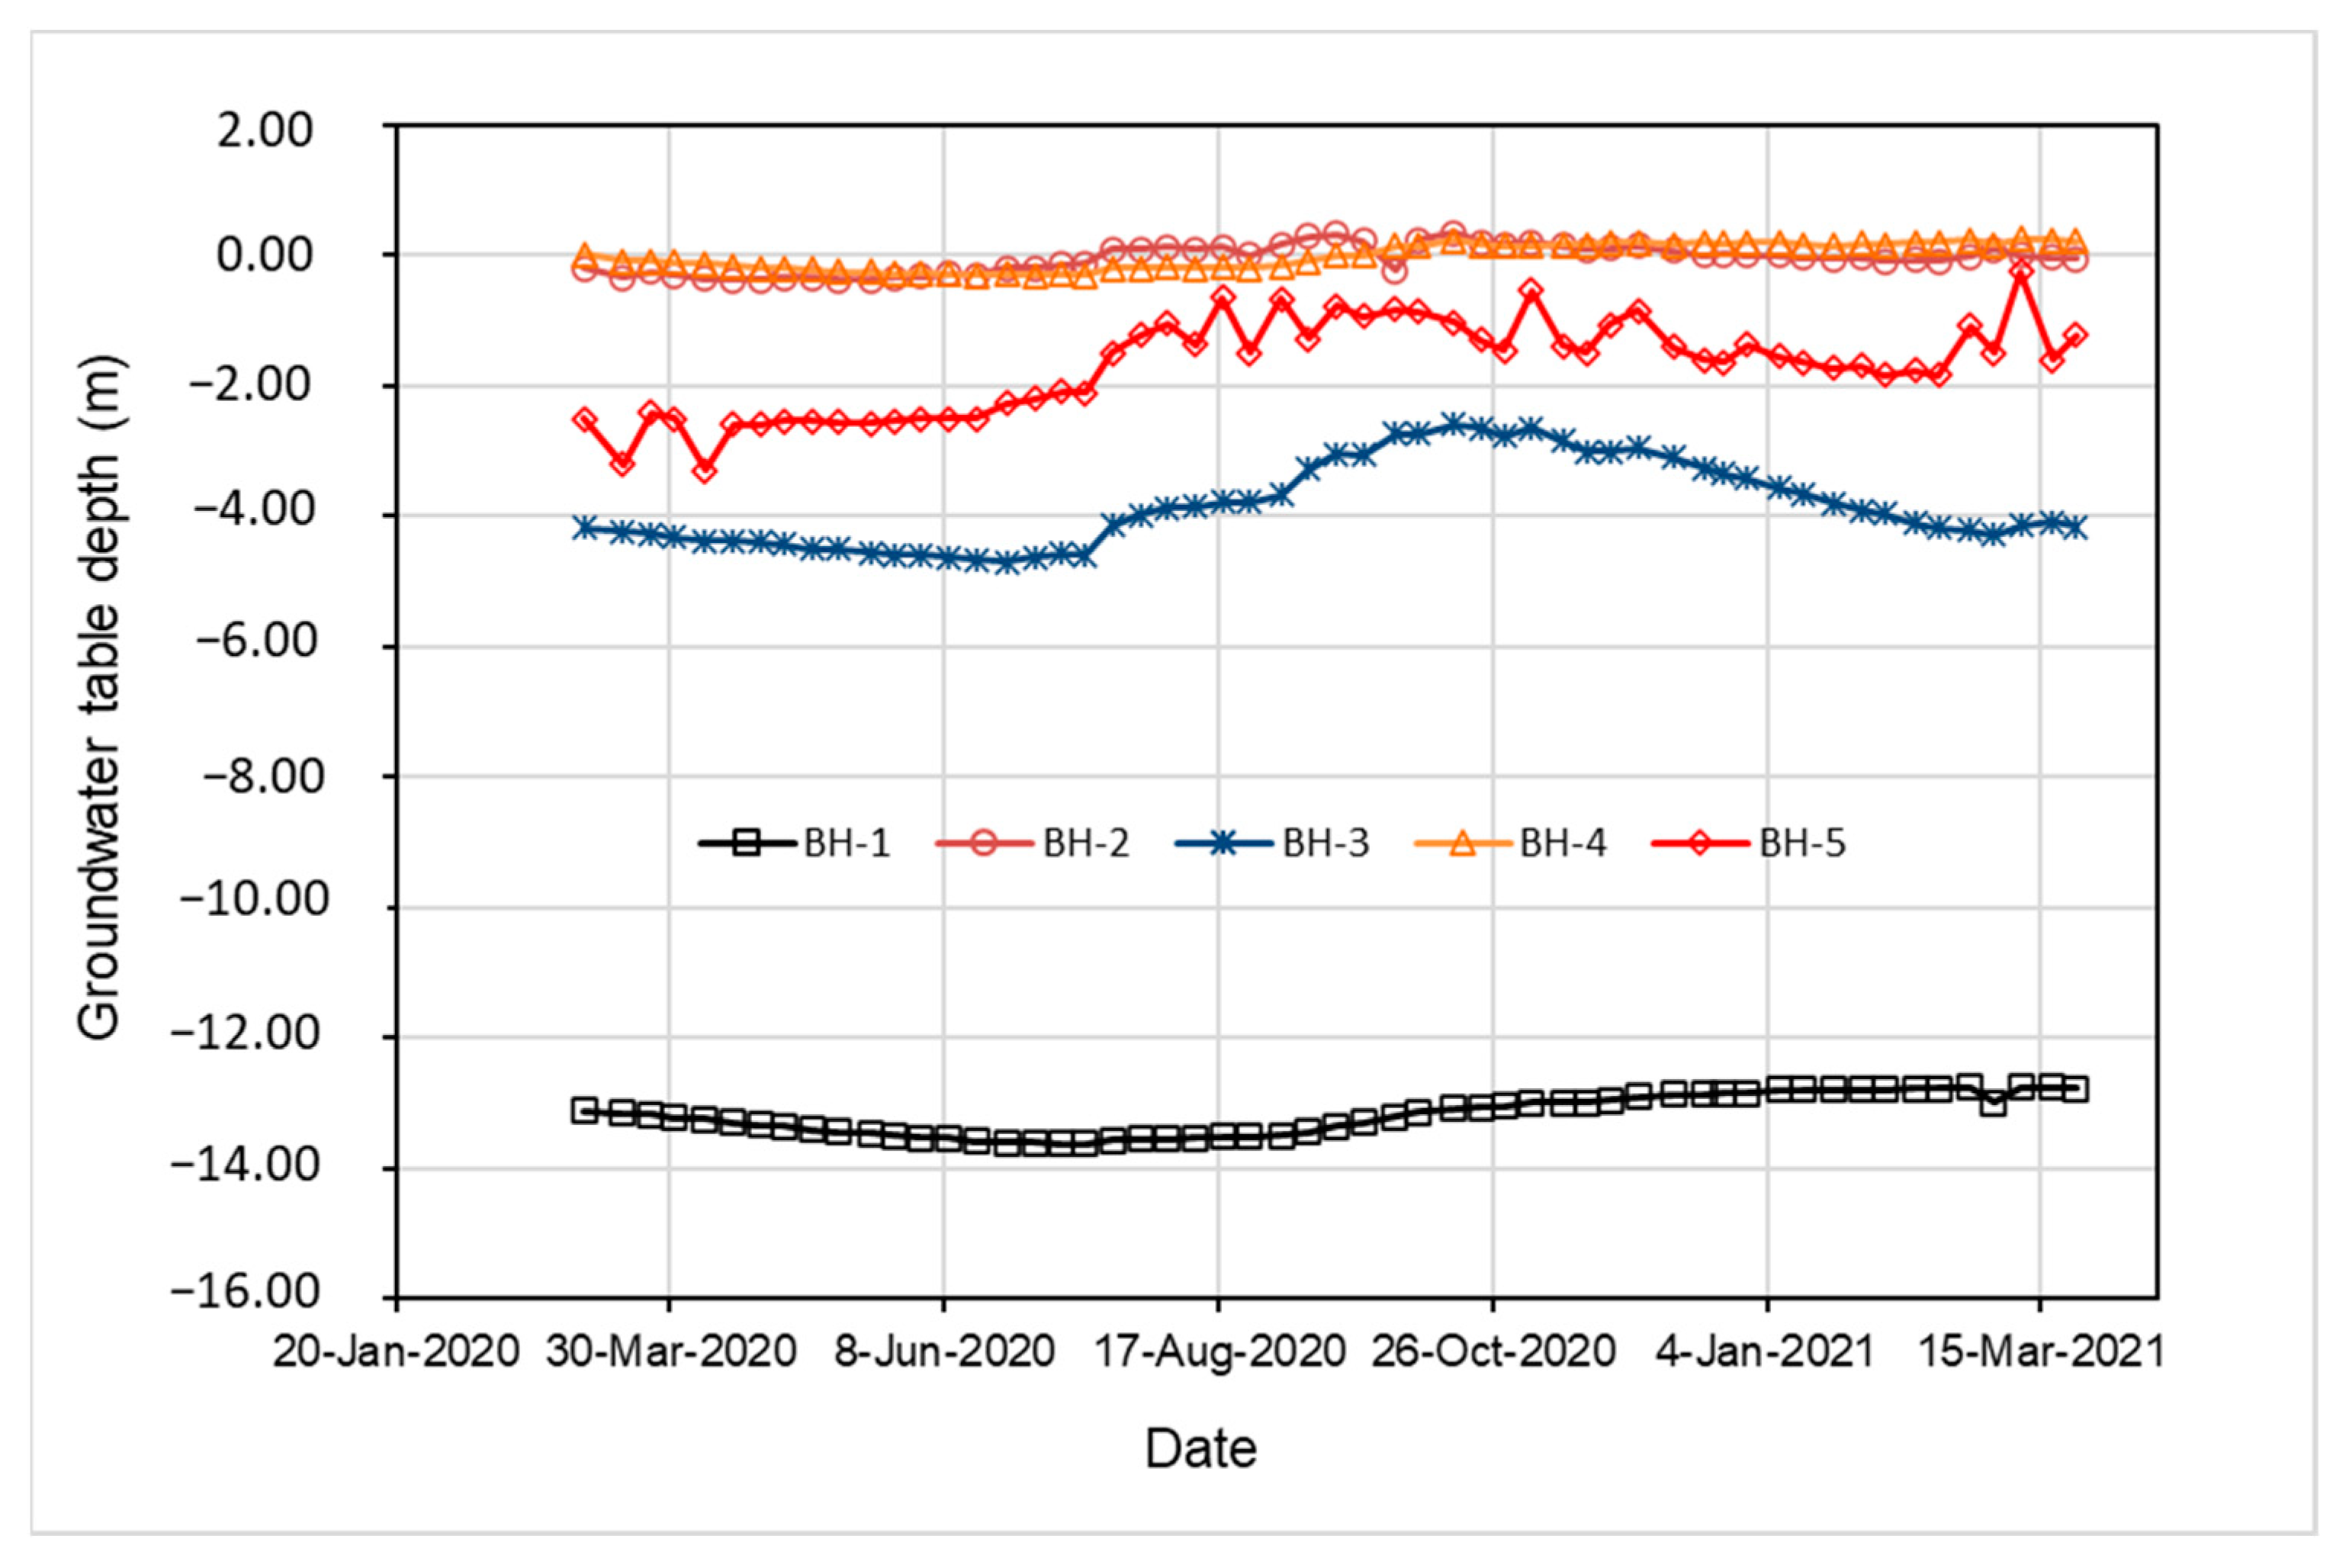
Figure 5 and Table 2 show the results of groundwater monitoring for a period of one year. BH-1 is located beyond the crest and to the east boundary of the sliding footprint (Figure 2). The results indicate that the groundwater level was less influenced by the seasonal effect due to rainfall. However, the depth of the groundwater at this location is significantly lower ( −13 m deep) than at the time of the earthquake, in view of its proximity to the Gumbasa canal and the nearby wet paddy fields which were constantly full of water prior to the sliding [8].
BH-4 and BH-2 are situated at the eastern and middle portions, respectively, of the sliding area (Figure 2). The results of the monitoring show that the groundwater levels are very close to the post-slide ground surface, which was evidenced through the onsite reconnaissance by Kusumawardani et al. [8], showing that ponds and wetlands are often found in these areas. By comparison with its pre-slide geometry, the current elevation at BH-4 (in the eastern portion) is approximately 6 m below the pre-slide level, while the current elevation at BH-2 (in the middle portion) is about the same as its pre-slide level.
BH-5 and BH-3 sit in the western portion of the sliding footprint (Figure 2), which was covered by the debris materials transported from the upstream [8]. The elevations at BH-5 and BH-3 are approximately 2.5 m and 6.5 m, respectively, above the pre-slide ground surface. The results of monitoring indicate that the groundwater levels are obviously flocculated with respect to the seasonal rainfall, with maximum differences in the groundwater level of 2~3 m. The depth of the groundwater table at these monitoring points is only a few meters below the ground as verified by Kiyota et al. [7], implying that the groundwaters were likely to have been very shallow, approximately 1~2 m in depth, in the western (toe) portion of the sliding footprint prior to the earthquake.

6.2. ERI Profiles

The results of electrical resistivity imaging (ERI) and borehole logs are shown in Figure 6, Figure 7 and Figure 8. The images, with RMS errors in resistivity of less than 10%, are presented with all cross-sections facing north. Each ERI section depicts some distinct features of the flowslide mass. As seen in Table 3, four groups of resistivity values were measured and classified as low (<12 ohm-m), moderate–low (12~20 ohm-m), moderate–high (20~60 ohm-m) and high (>60 ohm-m). The resistivity groups were determined by comparing the resistivity categories as proposed by Palacky [45], Meads et al. [46], and Lee et al. [47] with the borehole data. Due to lateral offset in space and accuracy in sounding for the ERI profiles and the associated borehole logs, there might exist some discrepancies in the interpretation of the type of earthen materials that were encountered in the Petobo site.
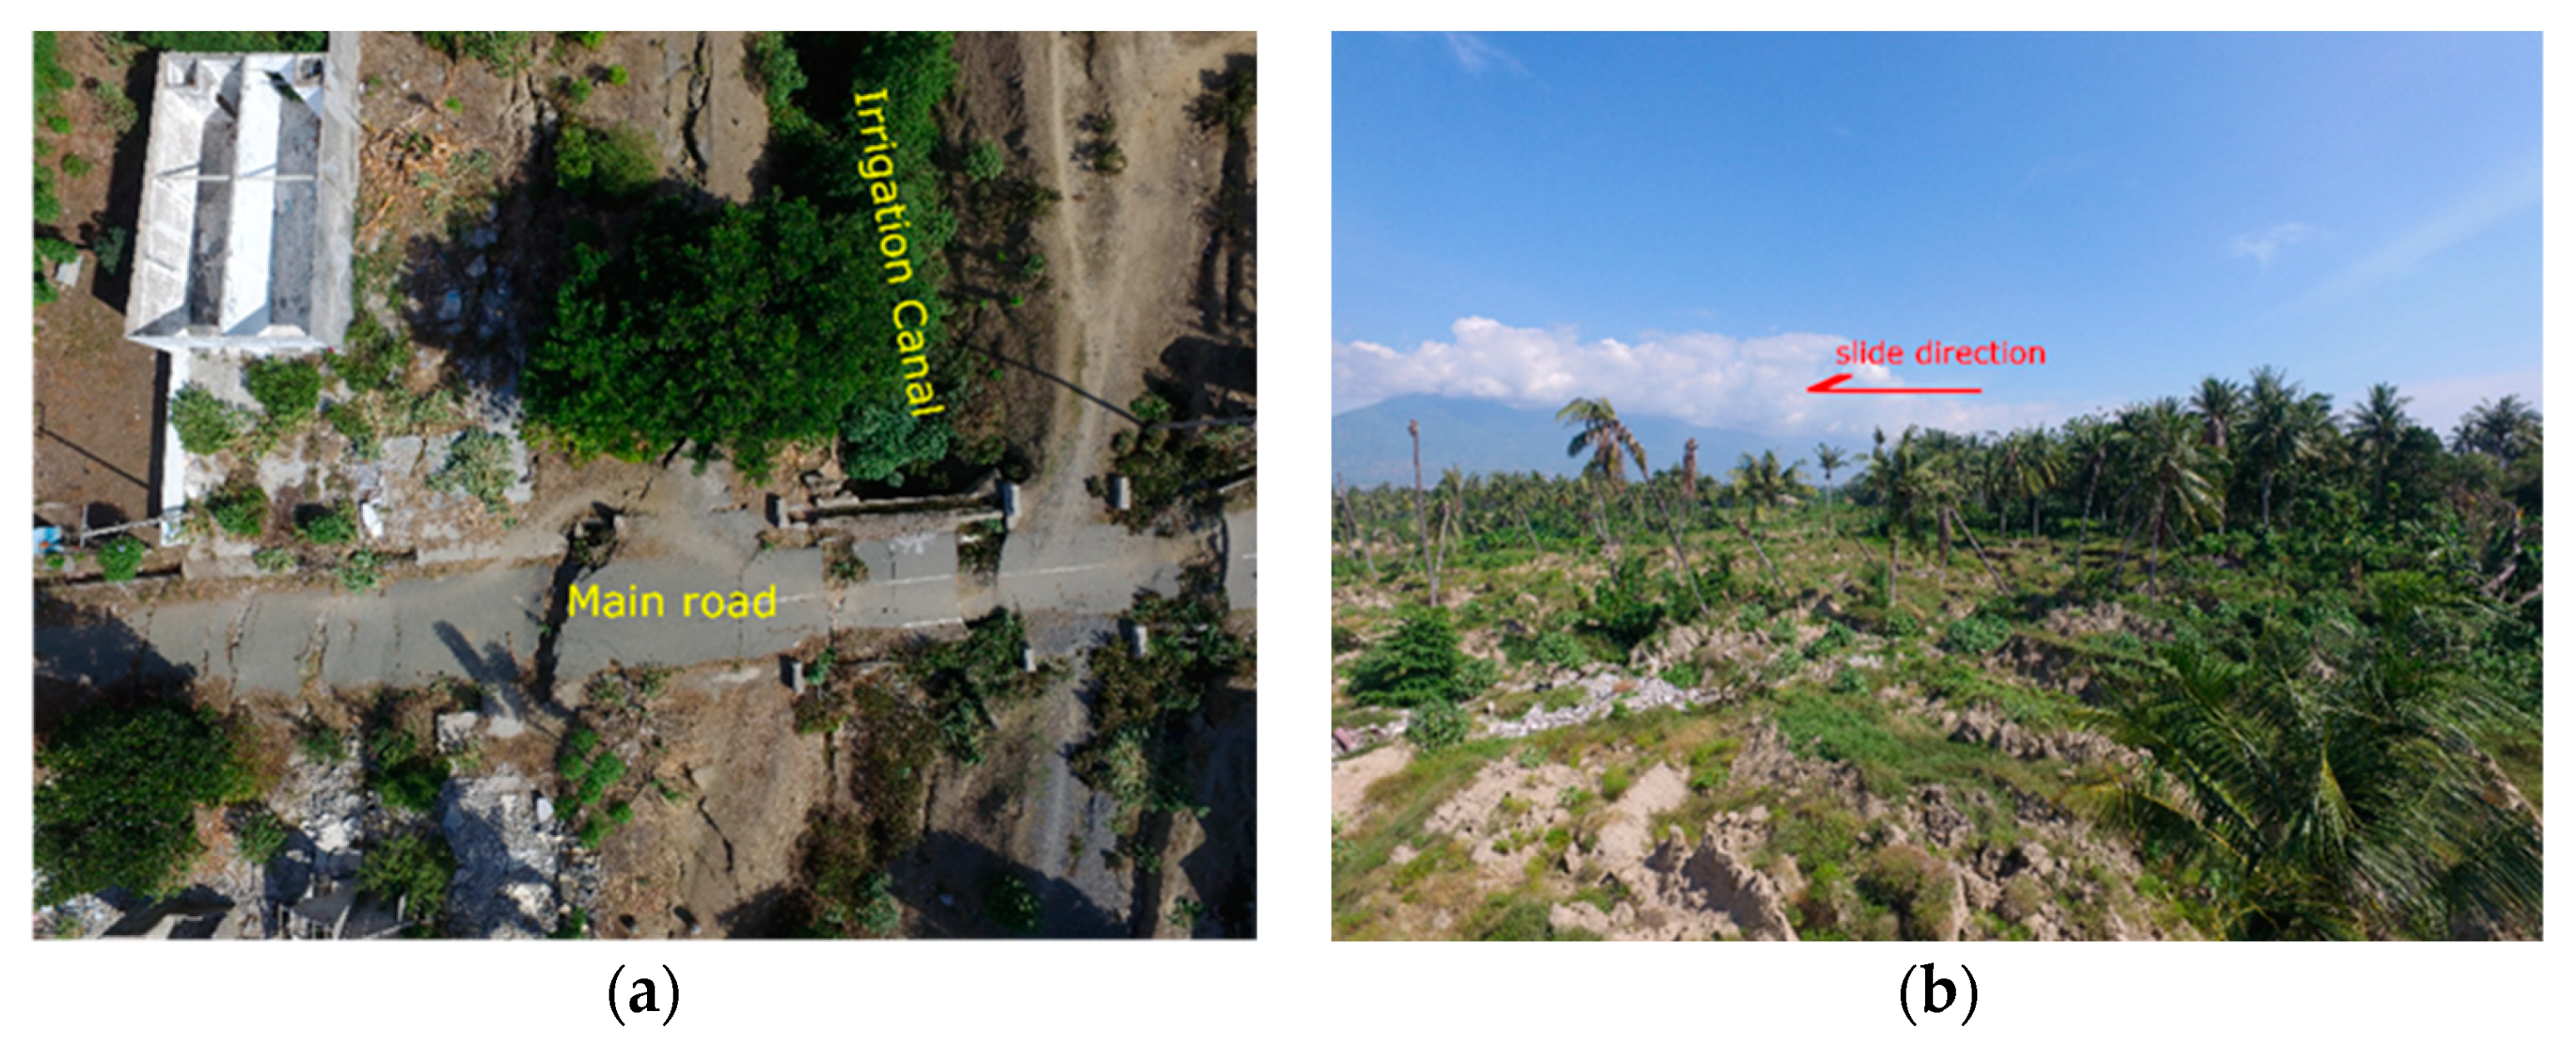
Figure 6 shows the resistivity profiles of EW-C1 and EW-C2, with the boreholes BH-1 and BH-4, respectively. Profile EW-C1 was measured on the ground slide zone (GS) and the liquefaction spread zone (LS-1), as identified by Kusumawardani et al. [8]. Profile EW-C2, a continuation of EW-C1, was measured in the liquefaction flow zone (LF-1). From the profiles, it can be seen that the horizontal offsets of BH-1 and BH-4 are around 29 m and 183 m, respectively. The high resistivity values (>60 Ohm-m) as found in profile EW-C1 correspond to layers of dry sands and gravels. Considering the number of cracks visible on the GS and LS surfaces, as indicated by Kusumawardani et al. [8] and later in Figure 9, this profile clearly presents some disruptions and fractures at a shallower depth of the ground, ground which had been desiccated for a long time since the sliding. Further to the west, profile EW-C2 shows that the shallow ground of the LF zone is covered with gravelly and silty sands of moderate–low to moderate–high resistivity. The surficial layers of the profile are indicative of the liquefied materials that were transported from the upstream side, with relatively uniform distribution and less disruptions across the site.
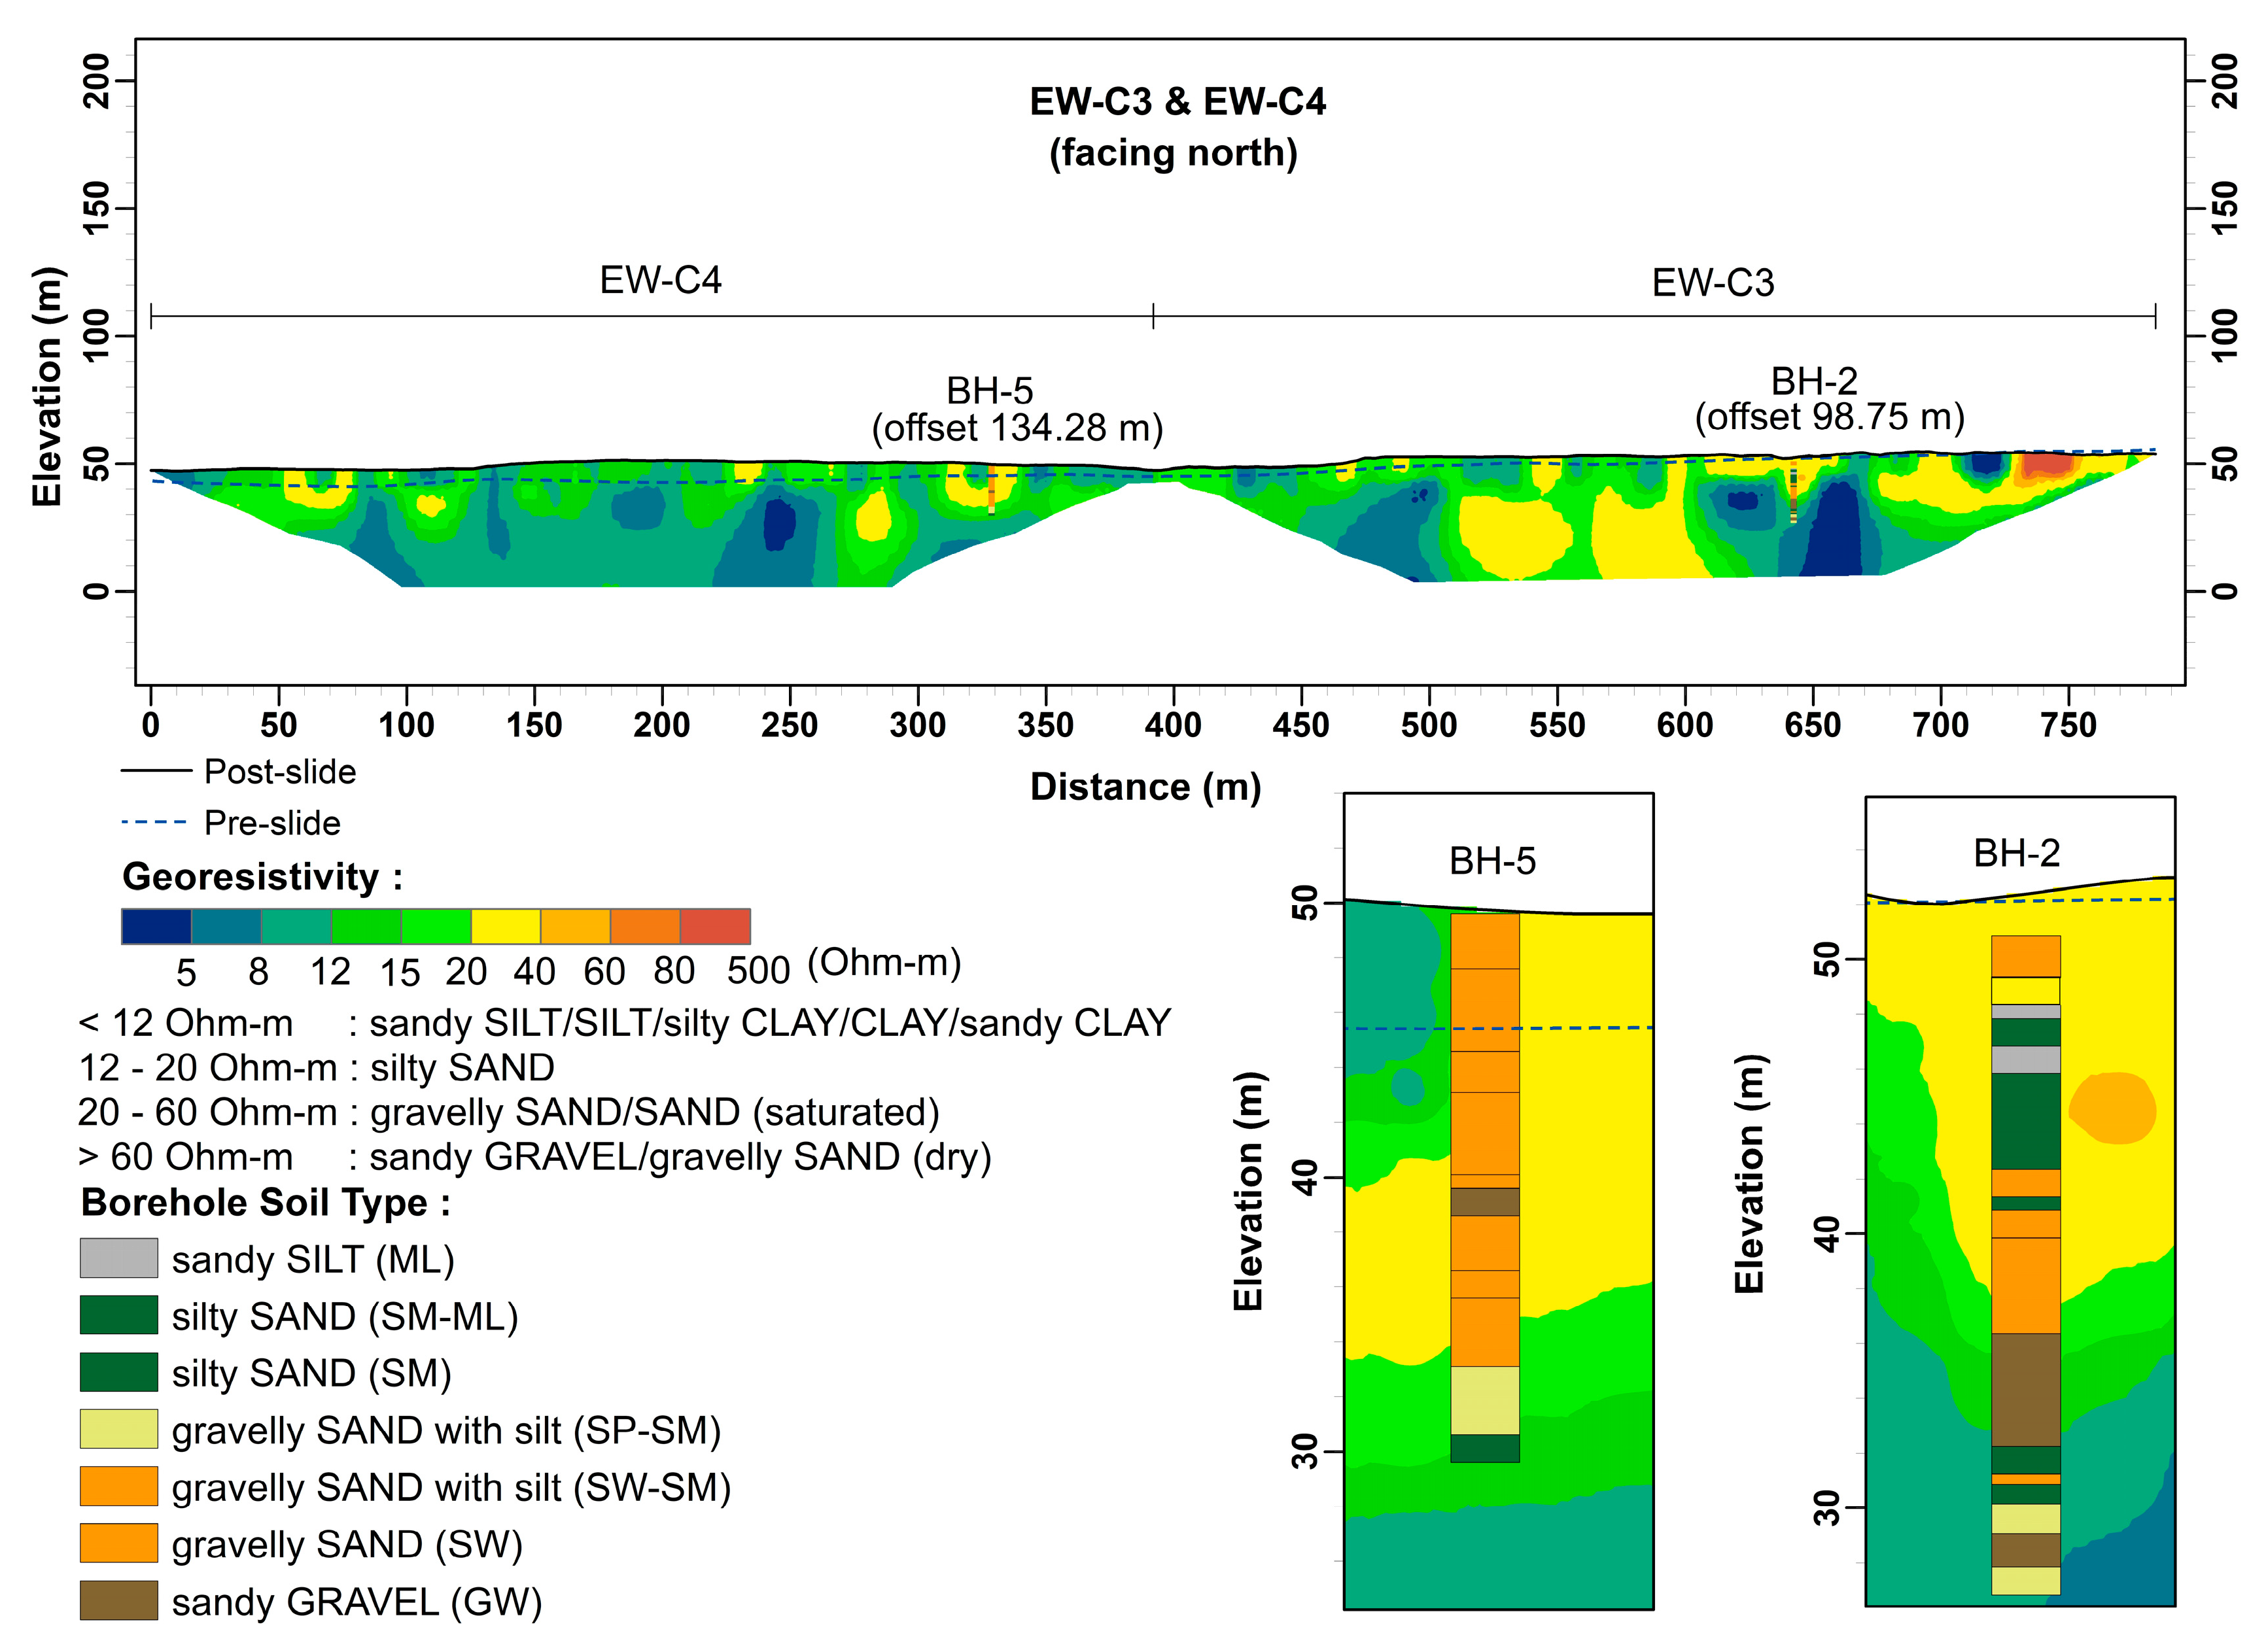
Figure 7 shows the resistivity profiles EW-C3 and EW-C4, with boreholes BH-2 and BH-5, respectively. According to Kusumawardani et al. [8], Profile EW-C3 sits along the junction of the liquefaction flow zone (LF-3) and debris flood zone (DF-1a), while profile EW-C4 is on the debris flood zone (DF-2). From the associated profiles, it can be seen that the horizontal offsets of BH-2 and BH-5 are approximately 99 m and 134 m, respectively. In profile EW-C3, high and moderate–high resistivity values, corresponding to gravelly sands or sandy gravels, are found to the east portion of the profile, probably due to a mixture of the onsite construction debris with the upstream liquefied soils. Profile EW-C4 and the middle portion of profile EW-C3 consist of moderate–low to low resistivity values, indicating that the surface materials of these profiles are most likely silty sands or sandy silts as a result of the liquefied debris from upstream.
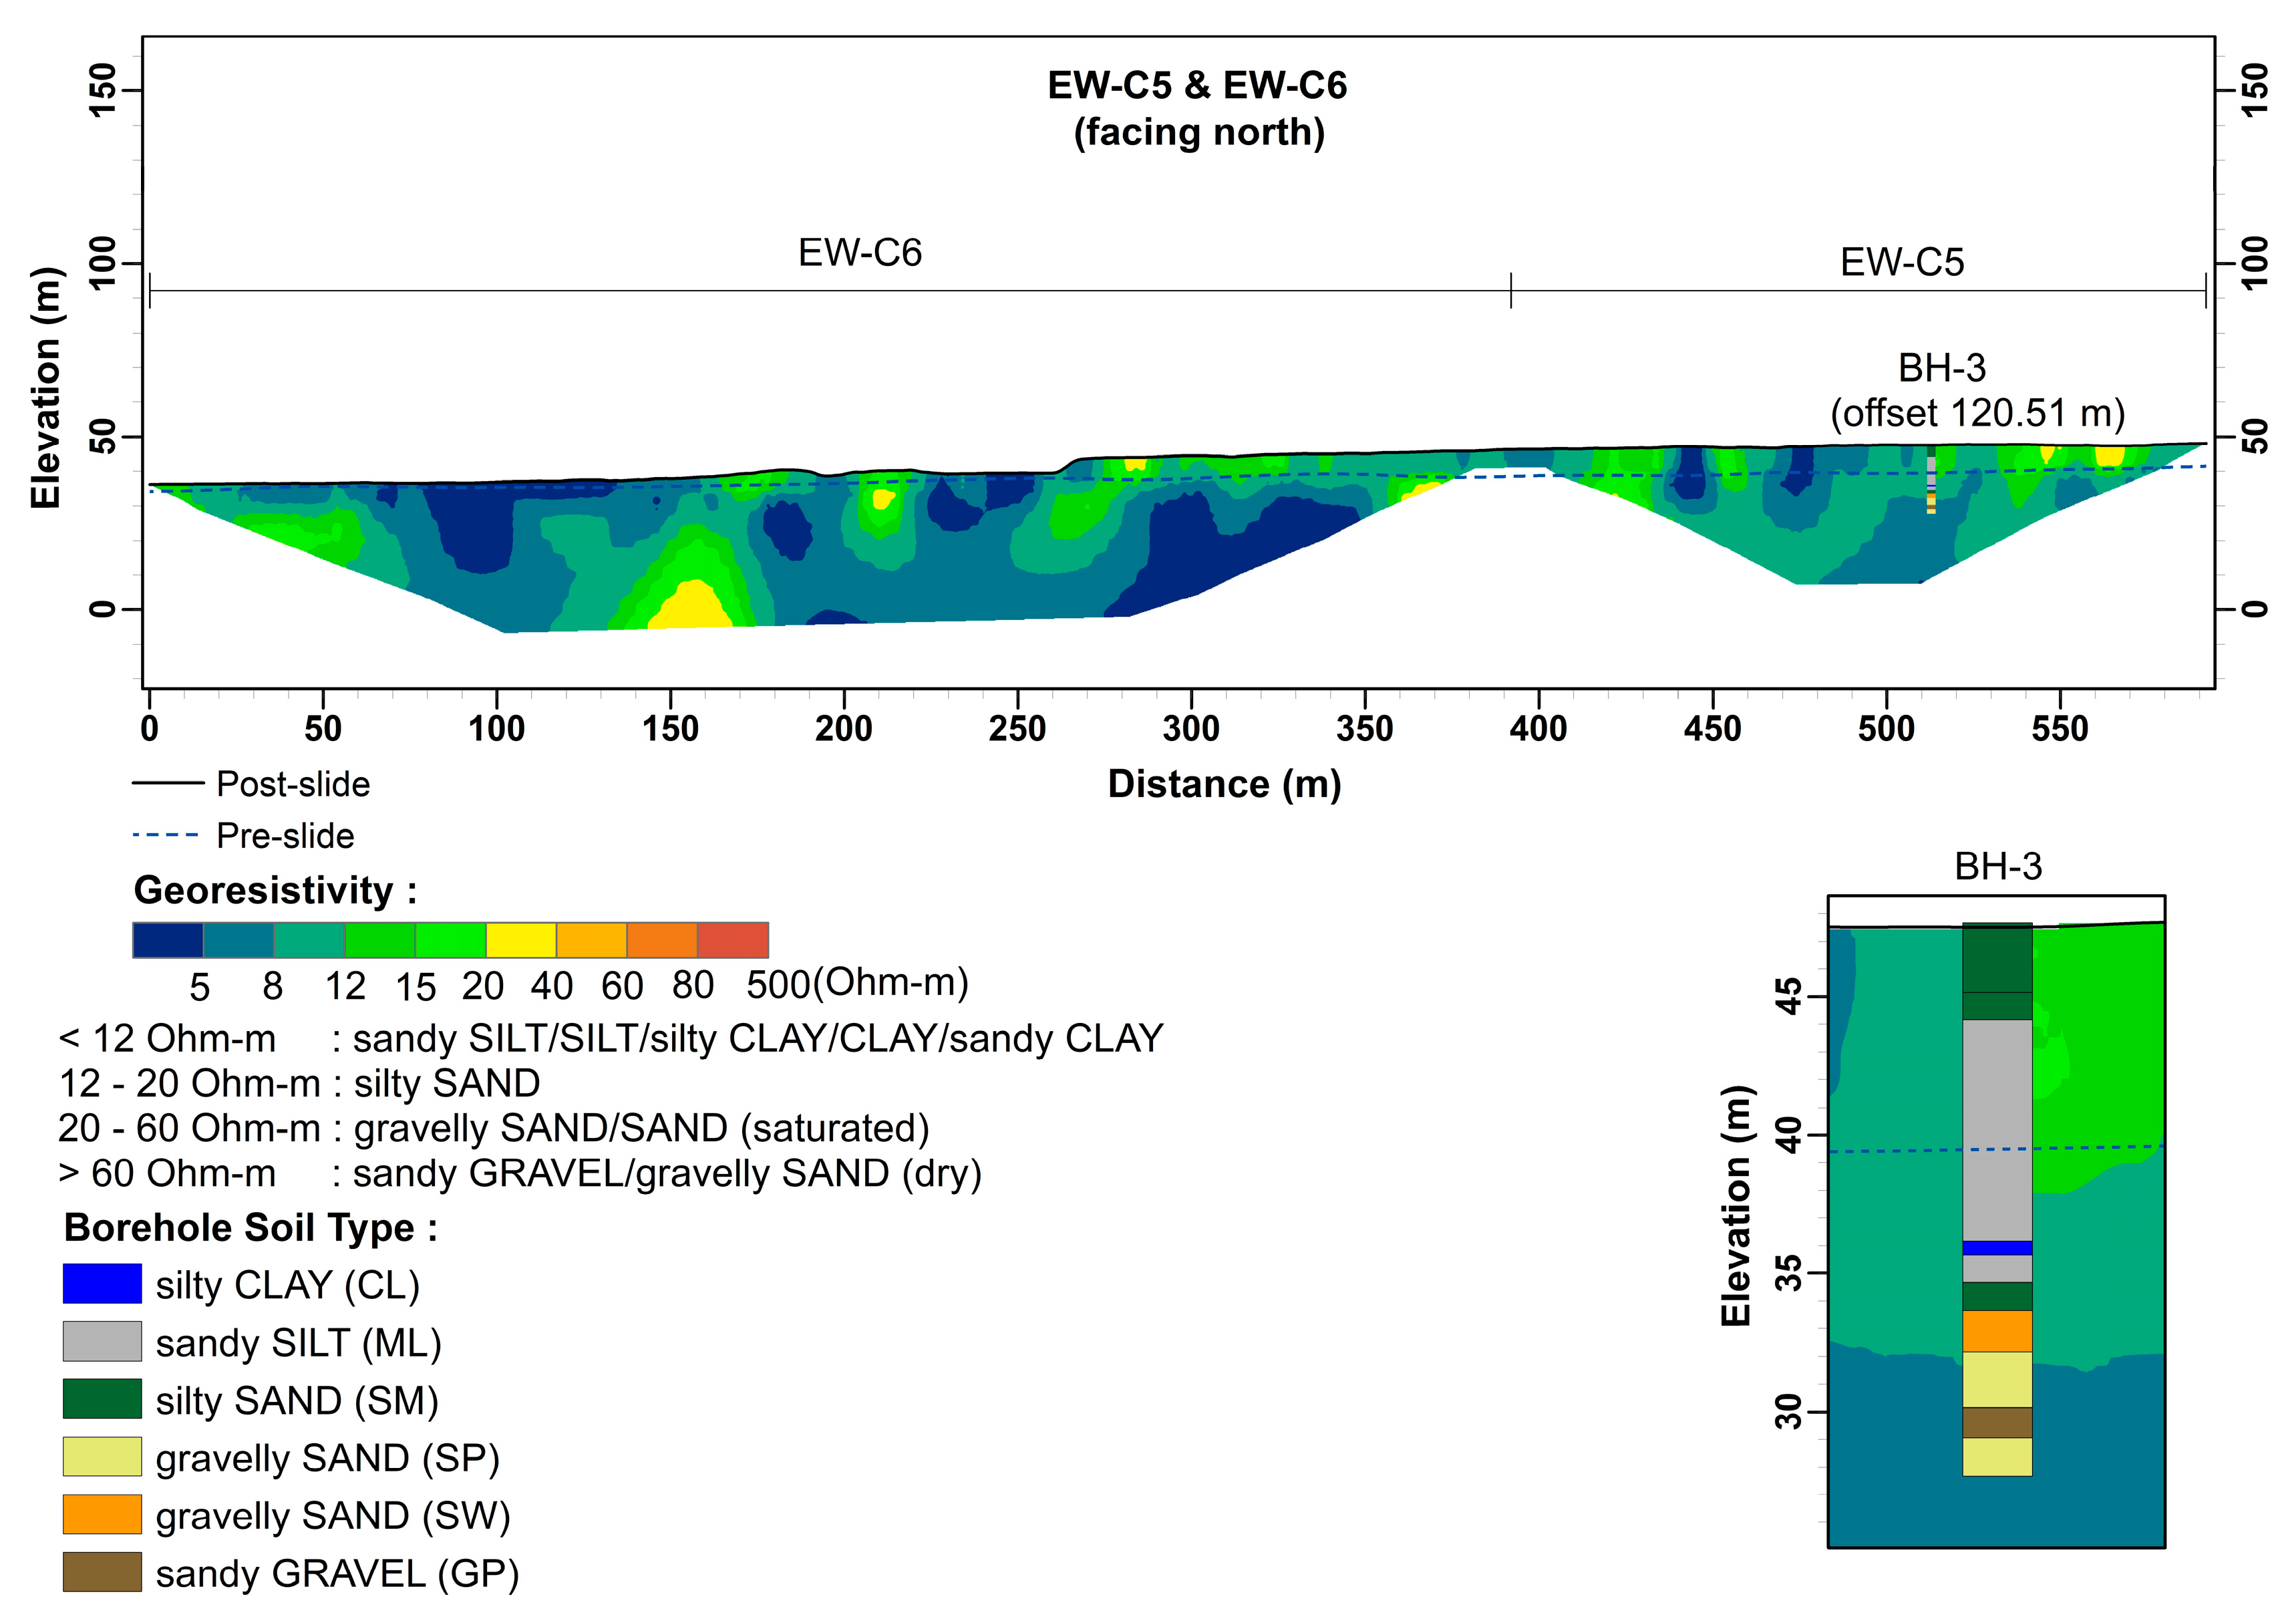
Figure 8 shows the resistivity profiles of EW-C5 and EW-C6 and the associated borehole BH-3. The horizontal offset of BH-3 to profile EW-C5 is approximately 121 m. Based on Kusumawardani et al. [8], these profiles sit in the debris flood zone (DF-2). The surficial deposit of these profiles comprise silty sand, sandy silt or silty clay, with moderate–low to low resistivity. As in profile EW-4, the deposited materials of these areas are most likely the transported debris from the liquefied upstream site.

6.3. Material Stratification

Figure 10 shows the results of GCO probing, located on the eastern portion of the road (Figure 2). The results indicate that the firm in situ layers are generally situated at a depth of 8~10 m below the post-slide ground. With the aid of other probings, i.e., the SPT-N profiles of boreholes current study [12], DCPT blowcounts [7], and Swedish soundings [12], as well as the ERI profiles of onsite materials discussed above, these results enable the establishment of an approximate boundary that delineates the junction between the relatively disturbed/loose sliding mass and the relatively undisturbed/firm in situ ground. Moreover, as will be discussed shortly, the liquefaction assessment results would be able to further verify whether the speculated boundary is the potential slip surface of the 2018 Petobo slide.
Certain criteria need to be considered during geological profile correlation. Firstly, BH-1 and LP-3 are located in relatively stable areas in which the soil layer is not susceptible to moving. Secondly, BH-3 and BH-5 are also situated in a stable area even though the debris material covers the existing ground. In the pre-slide geological profile, the debris material is not present, while in the post-slide geological profile, the debris material is considered to be the flowslide material. Finally, BH-2 and BH-4 are situated in the zones of liquefaction, hence the geological profile underneath the slip surface is considered stable. The post-slide geological profile below the slip surface is associated with a stable area, whereas the portion above the slip surface consists of flowslide mixtures.
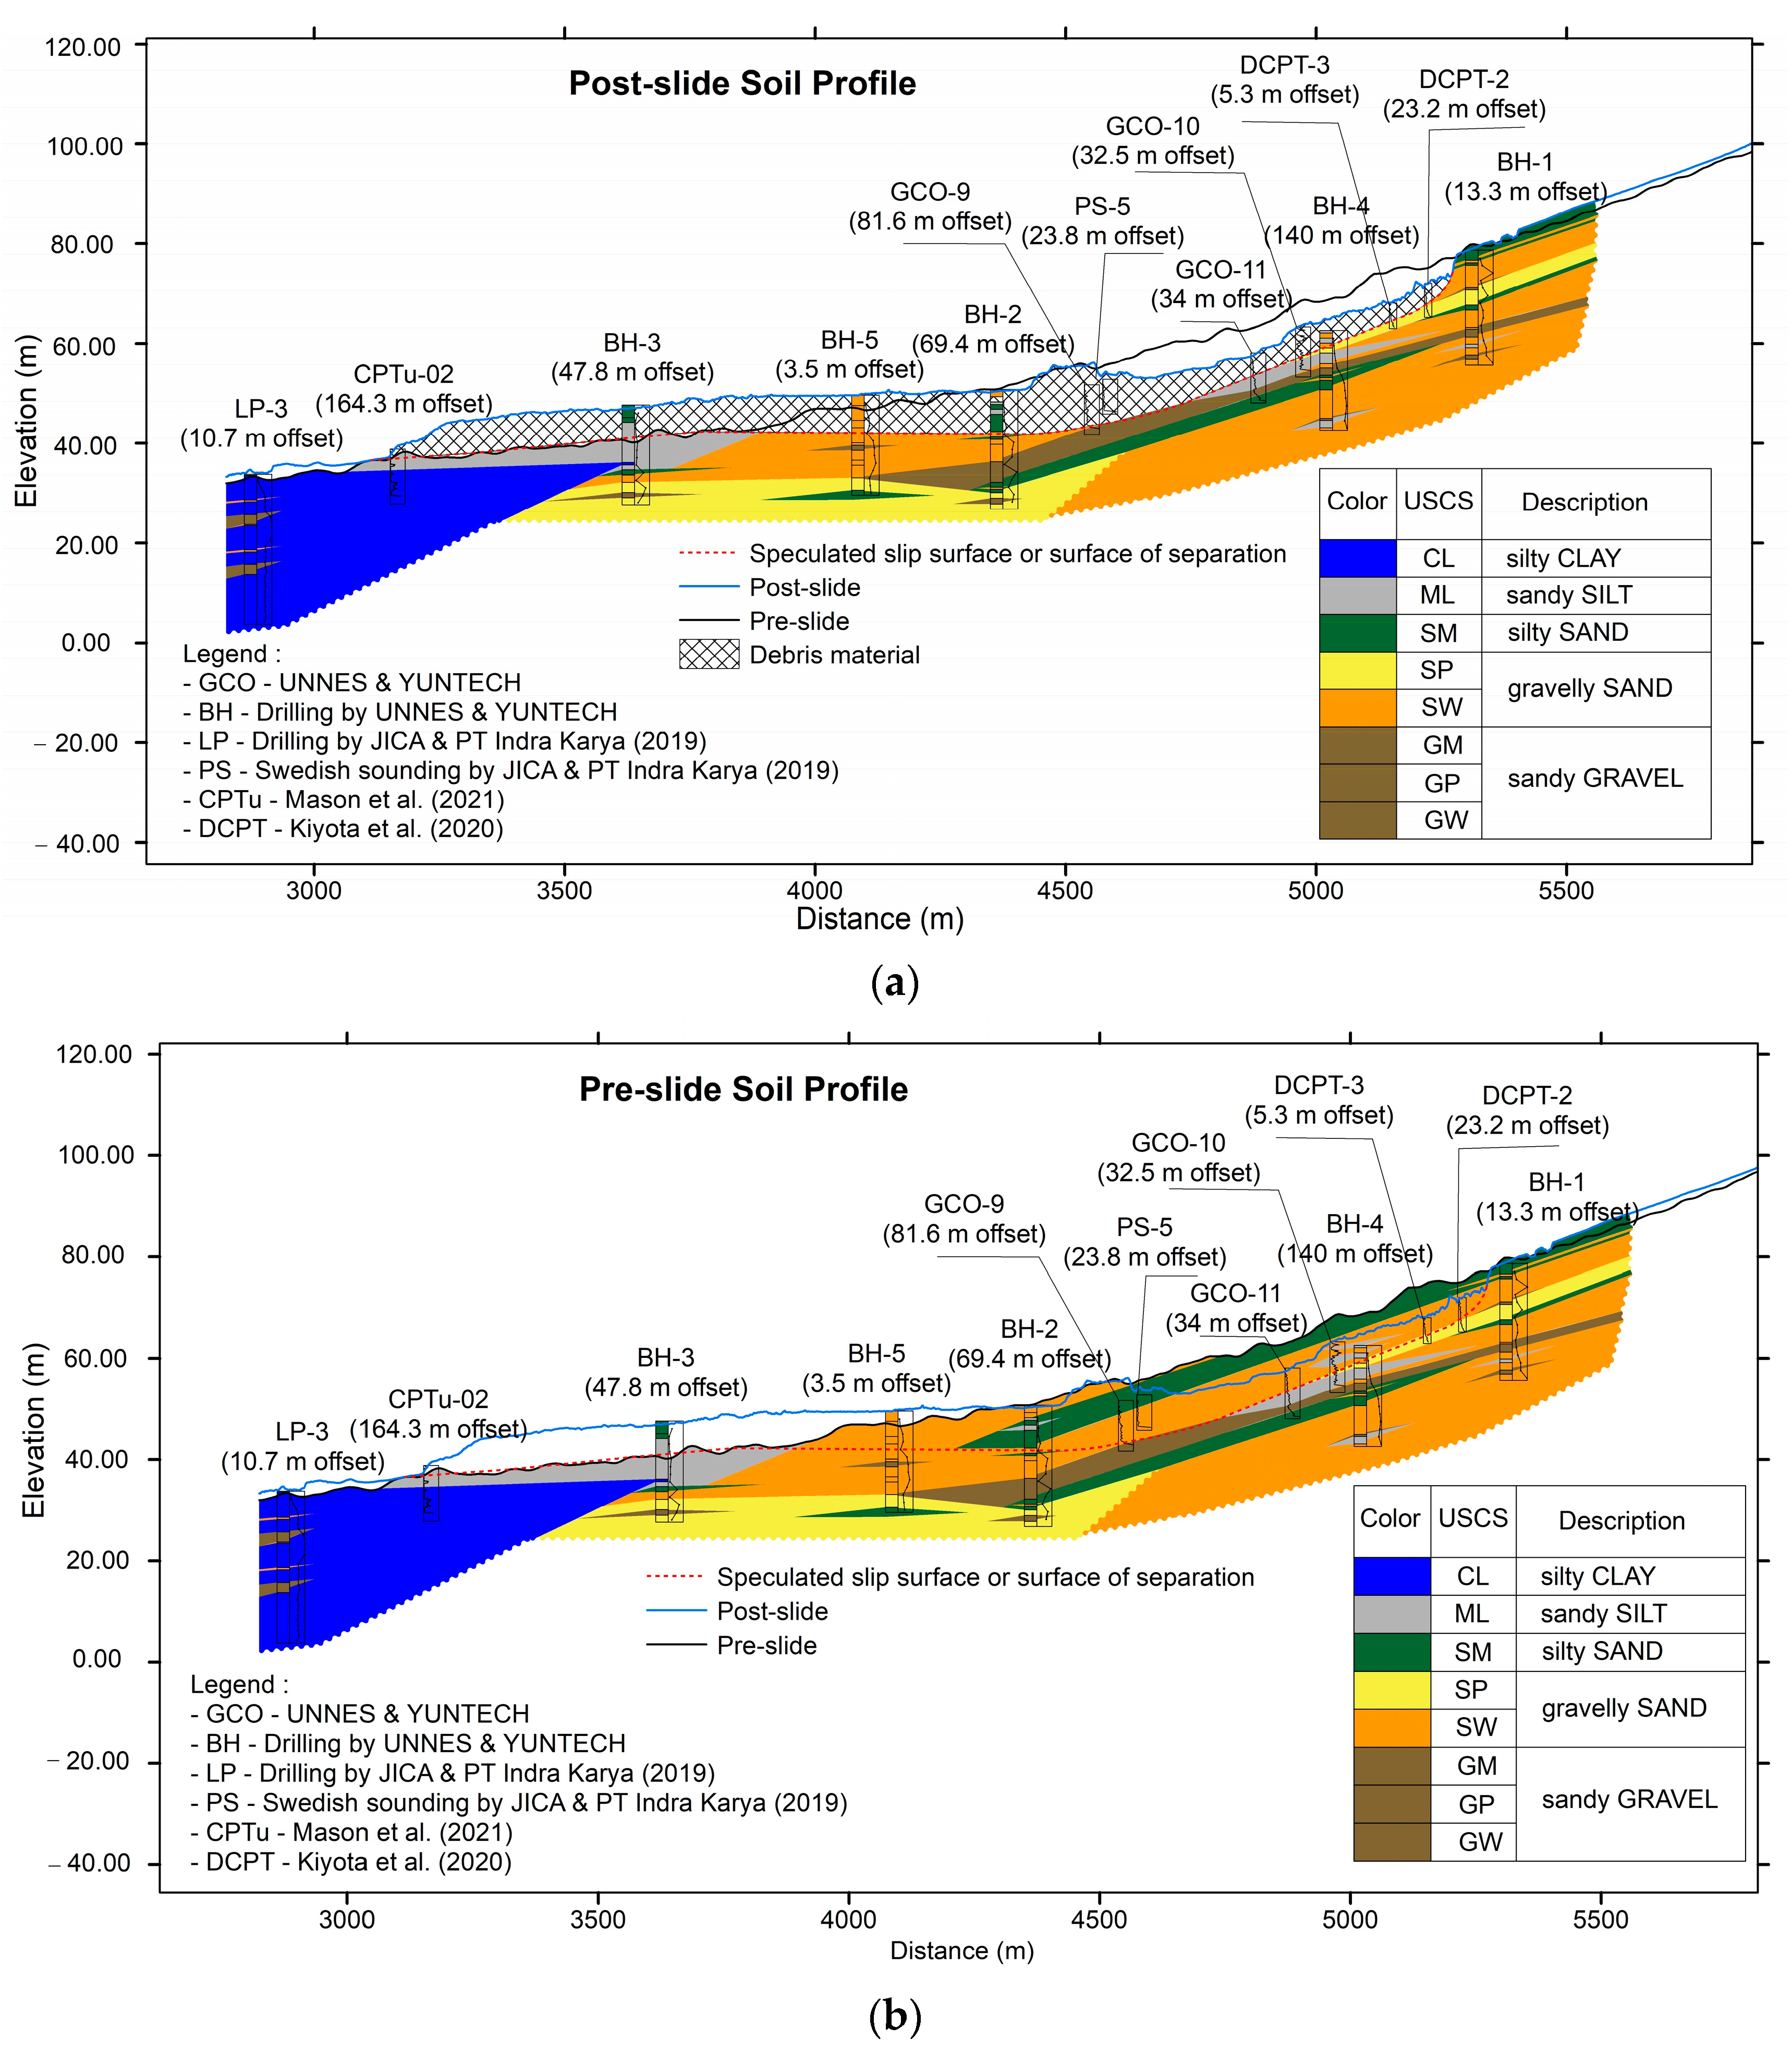
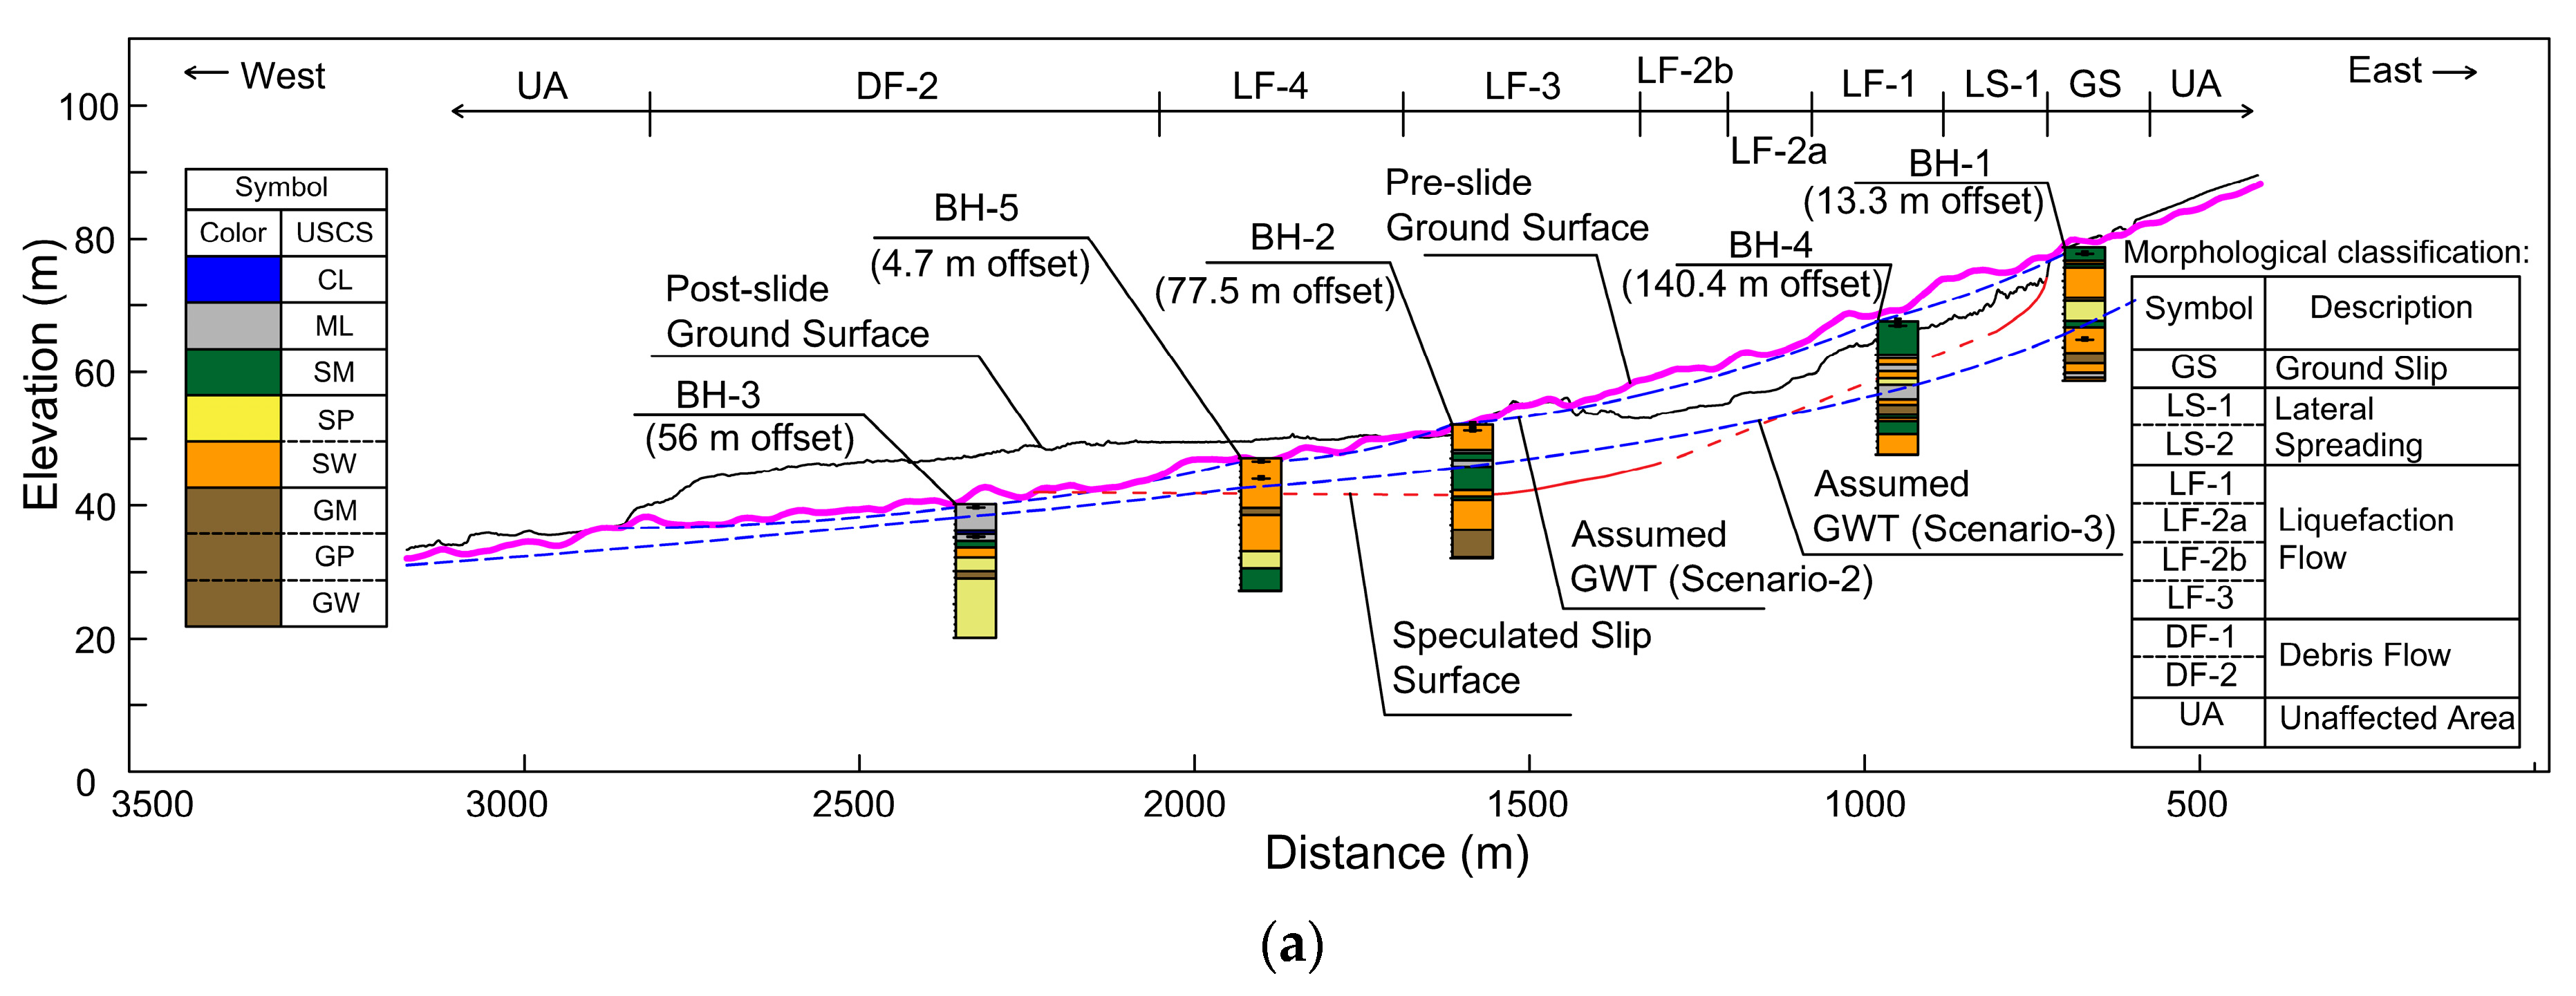
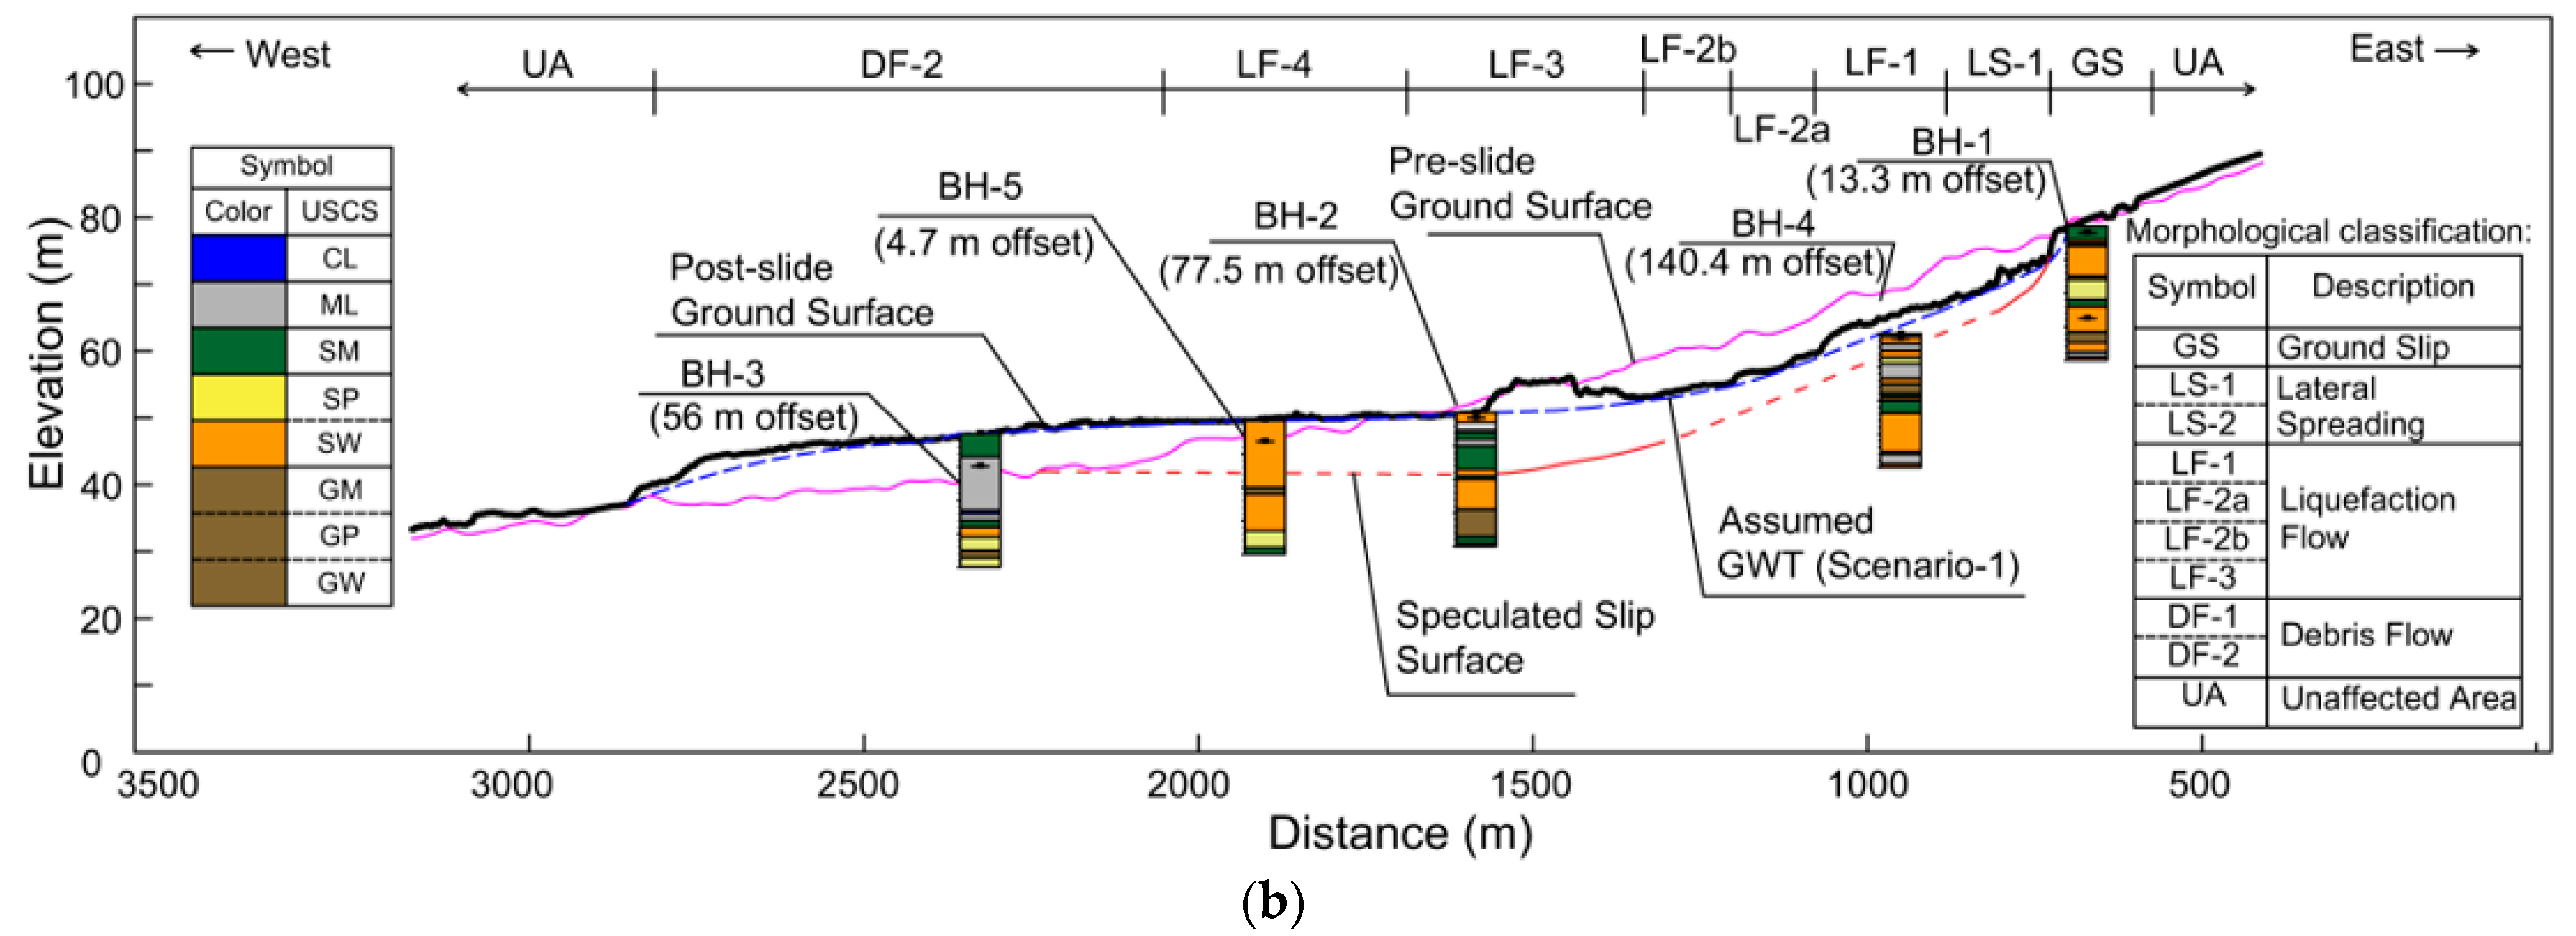
The results of the subsurface investigation are summarized and interpreted in Figure 11. Figure 11a shows the material stratification with the post-slide slope geometry of the site. Based upon the speculated boundary of the sliding mass and in situ ground, the figure approximately outlines the plausible mass of the 2018 sliding, including a major portion of the slip surface within the in situ ground and a small portion near the toe on the top of the ground surface, i.e., the surface of separation.
Figure 11b illustrates the material profile with the pre-slide slope geometry of the site. Since site investigations were performed after sliding, some of the boreholes were drilled at locations with ground elevations lower than their pre-slide levels. To reconstruct the pre-slide material profile, the missing data between the pre-slide and post-slide geometries were amended using the adjacent materials of the same boreholes, or the average data of materials at approximately the same elevations as the nearby boreholes. The amended pre-slide material profile indicates that soil layers are generally parallel to the ground in the crest and middle portions of the site. The soil materials presented in this area, in descending order, are more or less like silty SAND, gravelly SAND, sandy GRAVEL, etc. In the toe portion of the site, however, relatively thick layers of sandy SILT and silty CLAY are found.

6.4. Liquefaction Analysis

The liquefaction assessment of the site was performed with three analysis scenarios as described in Table 1. As discussed above, the analysis scenarios were assumed and evaluated in order to envisage the potential effect of the groundwater table and slope geometry on the sliding, for both liquefaction assessment and flowslide simulations. Table 4 indicates the groundwater tables and slope geometries adopted in the analysis scenarios, which are visualized, in association with the analyzed borehole logs, in Figure 12.
As mentioned previously, the liquefaction assessment, as well as the subsequent flowslide simulation, of this study took the 2018 Palu–Donggala earthquake as the object of focus, with a magnitude Mw of 7.5 and a PGA of 0.34 g. It is important to note that in liquefaction analysis, the groundwater table, GWT0, during drilling and standard penetration testing should be used for the evaluation of SPT-N1 and the associated cyclic resistance ratio, CRR, of the soil deposit. The GWT0 is likely to be dissimilar to the groundwater tables, GWT, as indicated in Table 1 and Table 4 and Figure 12, for the analysis at the time of earthquake shaking.
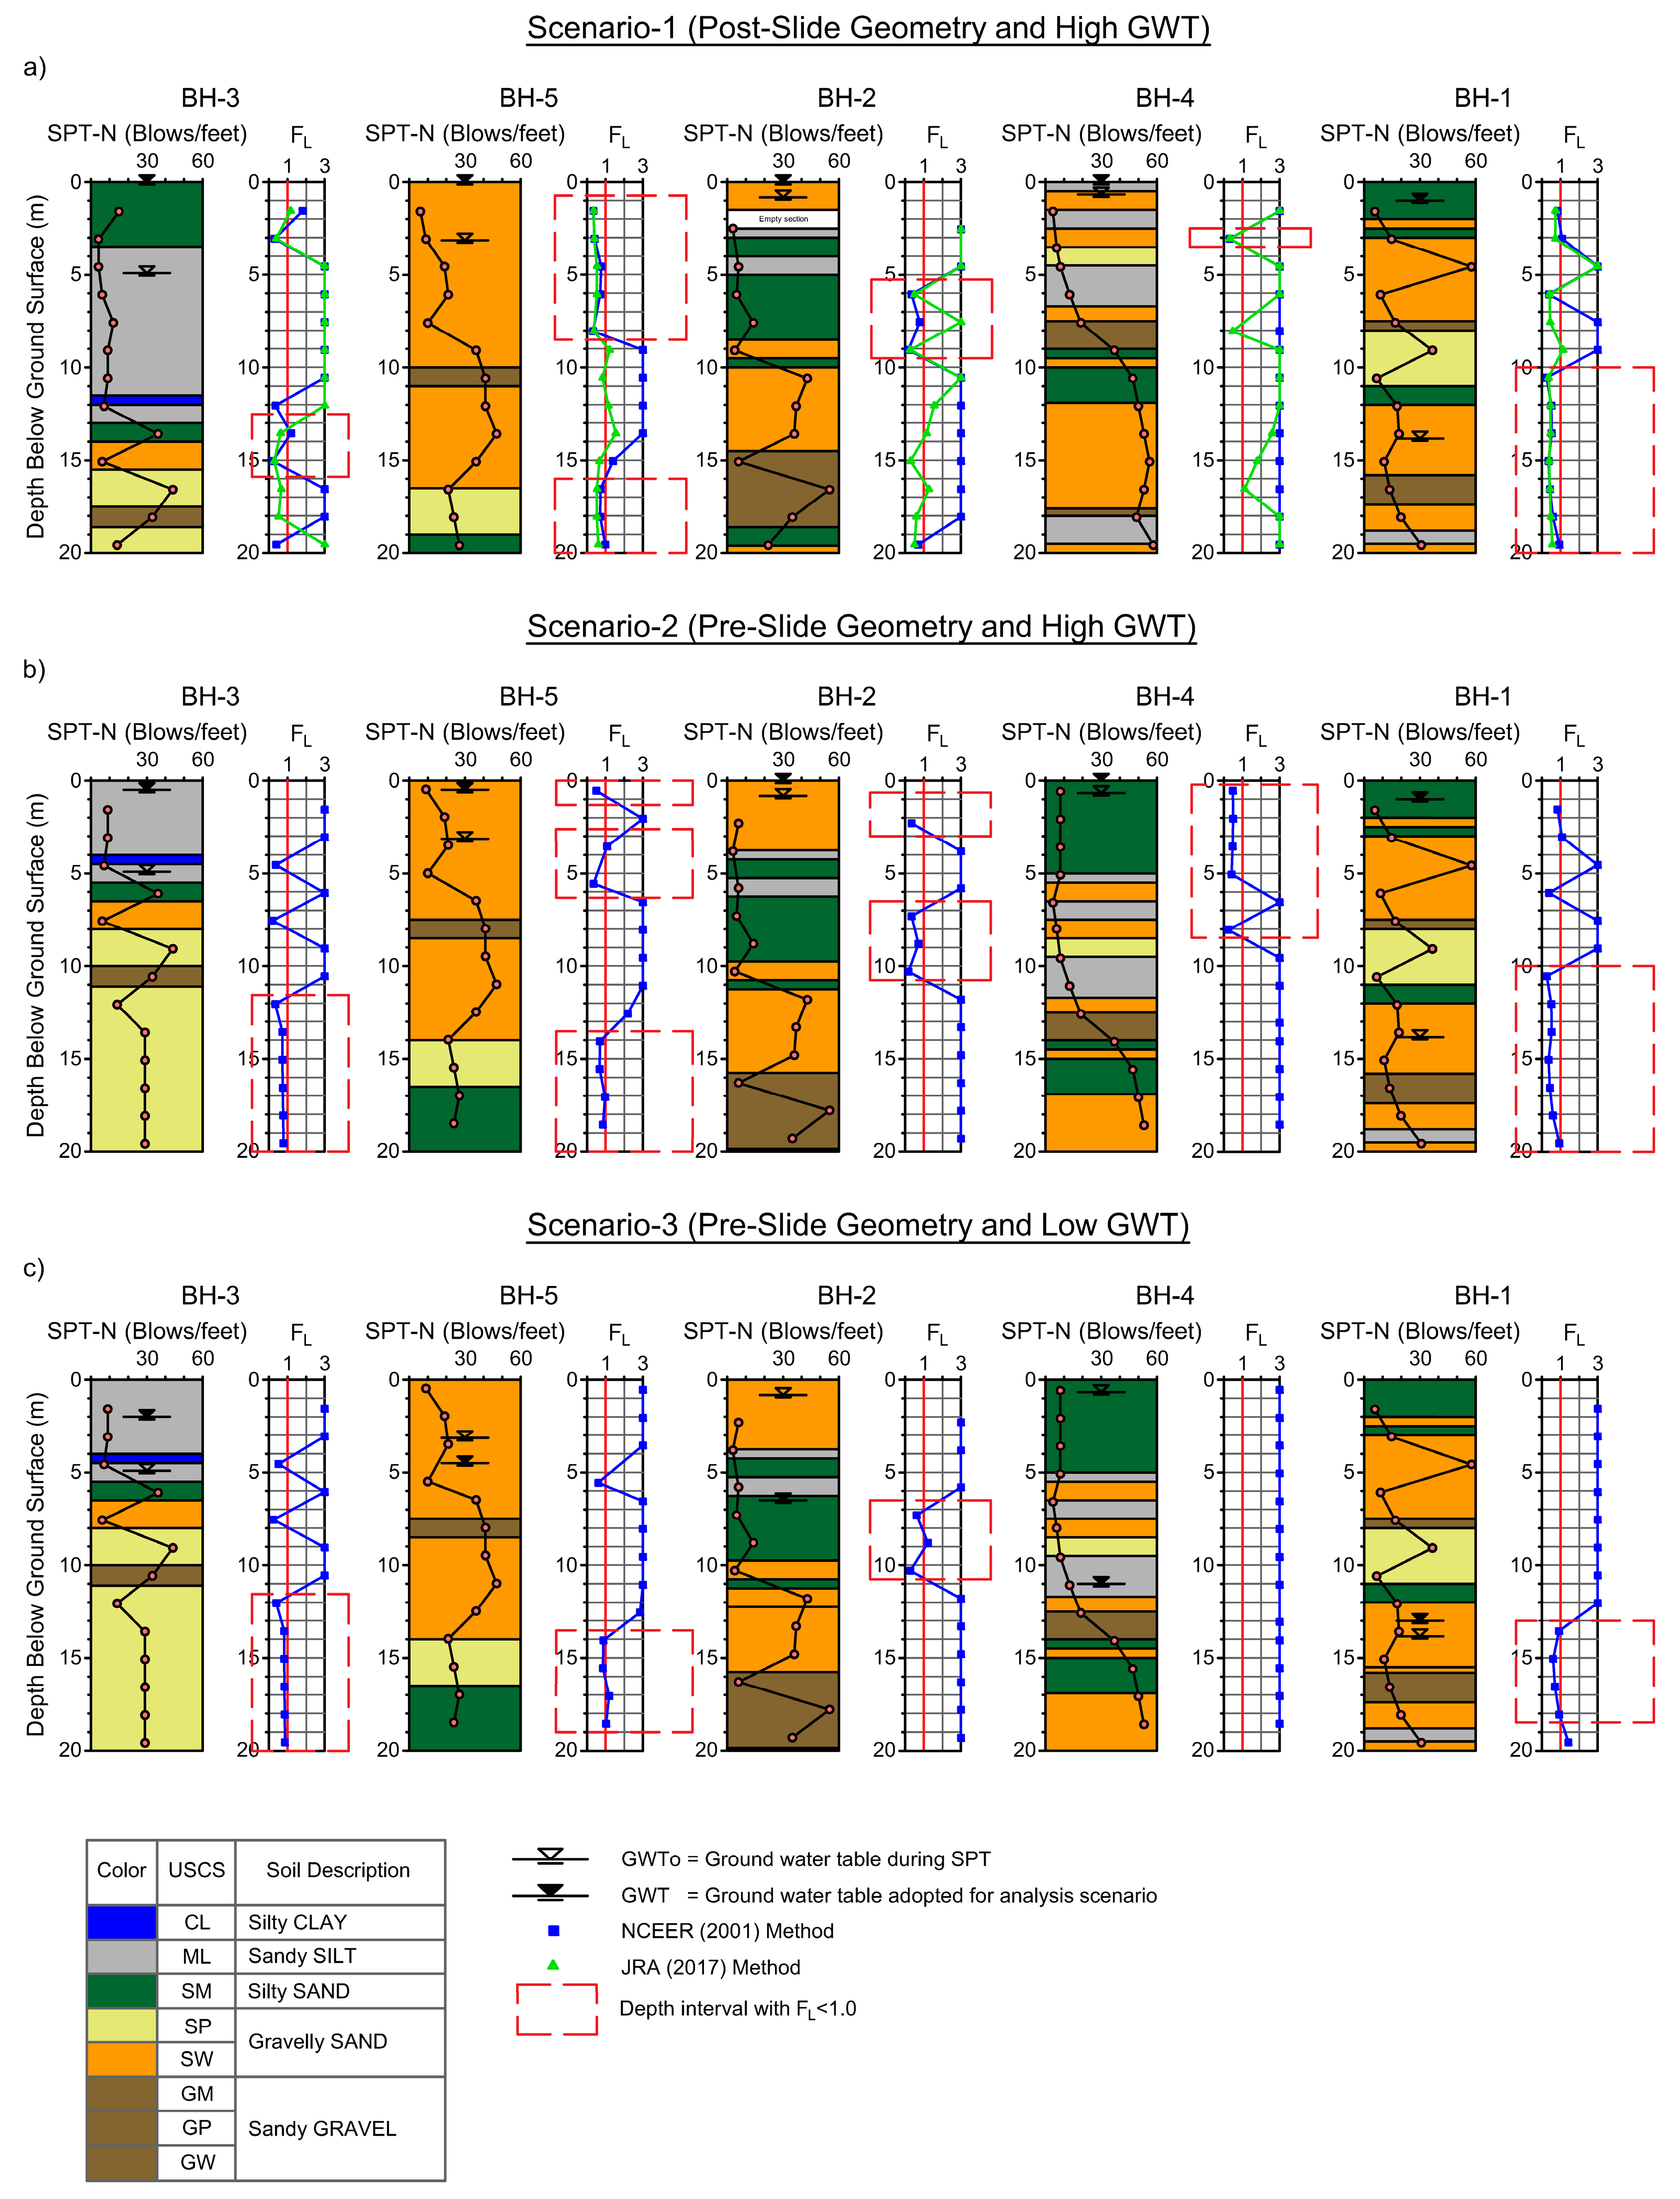
Figure 13 shows the results of liquefaction assessment for the three analysis scenarios. Both Seed/NCEER [33] and JRA [34] methods were adopted in the assessment for scenario 1. The results show general consistency between the methods, with only minor differences in the assessed factor of safety against liquefaction (FL). The differences might have been due to the fact that the Seed/NCEER method does not consider gravels to be a liquefiable soil type. In view of its general acceptance and extensive usage worldwide, the Seed/NCEER [33] method is the major tool used for the assessment of liquefaction in this study.
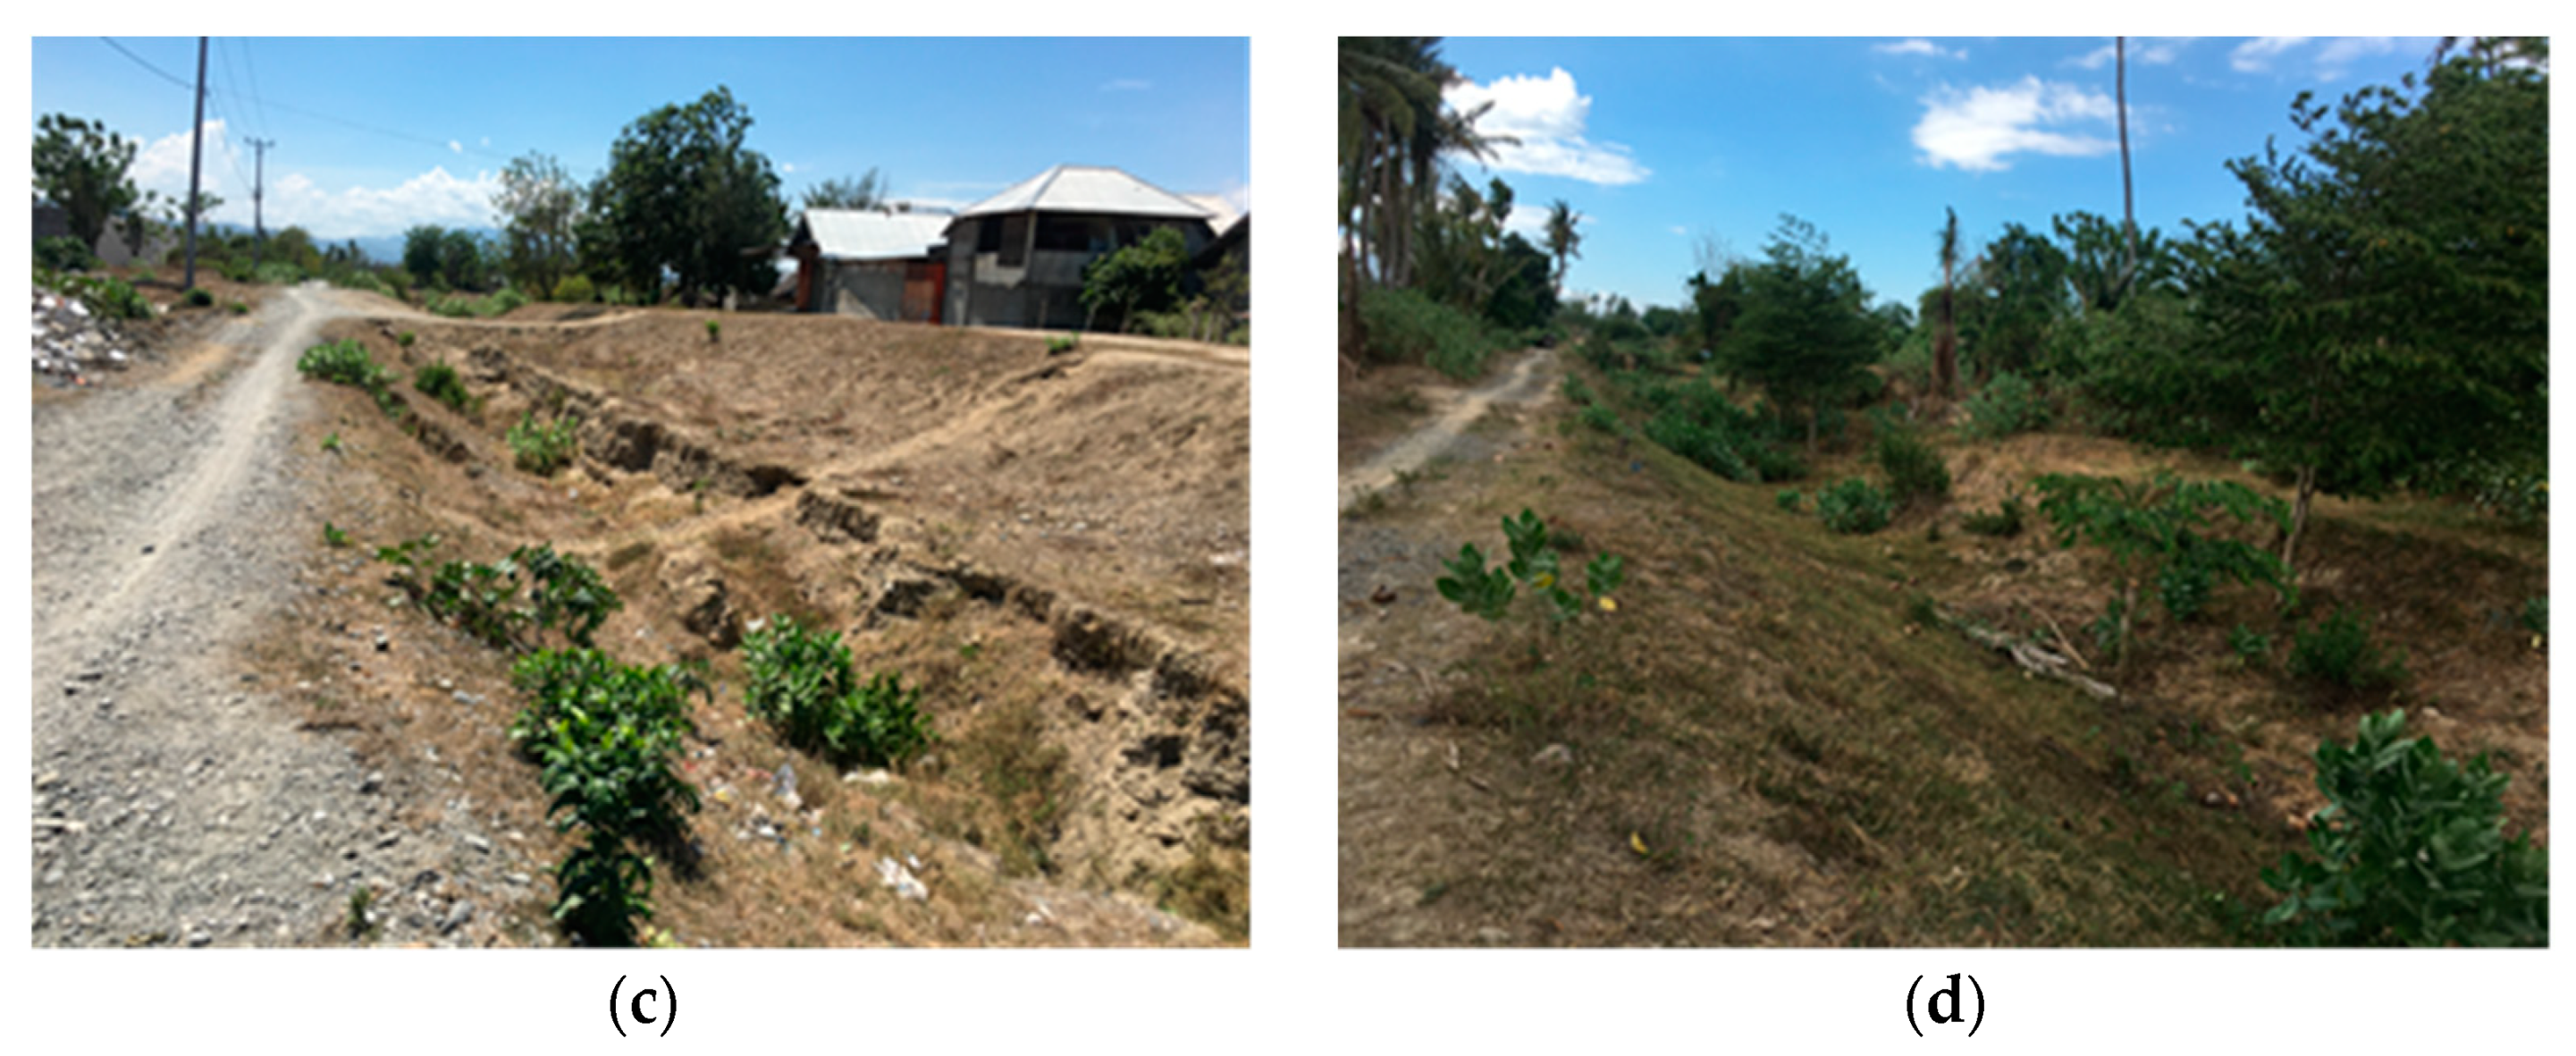
The borehole BH-1 results indicate that the top soil layers with a thickness of 10 m or more would generally not liquefy and only the soils below would have a computed factor of safety against liquefaction (FL) of less than unity, for all of the analysis scenarios assessed. In view of the studies by Ishihara [48] and Dobry [49], the 10-m-thick non-liquefied upper layer at this location would likely prevent the influence of the underneath liquefied soils and hence the effect on the ground surface. The onsite observations by Kusumawardani et al. [8] confirm that the ground surface in the neighborhood of BH-1 consisted of a series of cracks with no phenomena of soil liquefaction, which was classified as the ground slide (GS) zone, as shown in Figure 9a.
The borehole BH-4 results show that soil liquefaction is identified at a depth of around 3 m in the post-slide profile of scenario 1 and a zone from the surface to approximately 9 m deep in the pre-slide profile of scenario 2. Due to variations in pre-slide and post-slide ground surfaces, the elevations of liquefied depth in the profiles of scenarios 1 and 2 are nearly the same, indicating that the depth of liquefaction (i.e., the sliding surface) at this location was approximately 9 m below the pre-slide ground surface. For scenario 3, however, no liquefaction was found within the first 20 m of the pre-slide ground, implying that the drop in groundwater level as a result of the termination of surface water infiltration (i.e., the Gumbasa irrigation system and onsite paddy fields) significantly prevented soil liquefaction at this location.
The borehole BH-2 results denote that the zones of soil liquefaction were found at a depth of around 5~10 m in the post-slide geometry of scenario 1 or around 6~11 m in the pre-slide geometry of scenarios 2 and 3. In terms of elevations, the liquefied depths of these analysis scenarios were about the same, indicating that the depth of liquefaction (i.e., sliding surface) at this location was around 11 m below the pre-slide ground surface. It is important to note, however, that the liquefaction zone is also identified in scenario 3, under the conditions of a pre-slide slope and low groundwater table, suggesting that soil liquefaction would be triggered at this location even if the influence of surface water infiltration was prohibited and the groundwater table was dropped to a minimum level.
The borehole BH-5 results indicate that the zones of liquefaction are approximated from the surface to a depth of 8 m in the post-slide profile of scenario 1, and from the surface to a depth of 6 m in the pre-slide profile of scenario 2. In considering the variations in the pre-slide and post-slide ground surfaces, the elevations of liquefied depth in the profiles of scenarios 1 and 2 are almost the same, suggesting that the depth of liquefaction (i.e., sliding surface) at this location was approximately 6 m below the pre-slide ground surface. For scenario 3, however, the upper 14 m of the pre-slide profile was generally capable of resisting soil liquefaction caused by the earthquake, in the case of the minimal influence of surface water infiltration caused by the irrigation system and onsite paddy fields. Another zone of liquefaction was also identified in all of the analysis scenarios, located at approximately 16 m below the post-slide surface for scenario 1, or 14 m below the pre-slide surface for scenarios 2 and 3. In view of the studies by Ishihara [48] and Dobry [49], the non-liquefied layer, approximately 8 m thick, sandwiched between the upper and lower liquefied zones would likely prevent the influence of the lower liquefied zone on the ground surface.
The borehole BH-3 results of liquefaction assessment are shown in Figure 13, with sparse depths of liquefaction found at 12 m and 15 m in the post-slide profile of scenario 1, or at 5 m and 8 m in the pre-slide profile of scenarios 2 and 3. Due to a relatively thick layer of silts and clays at this borehole location, the assessment indicates that soil layers in the upper 10 m are generally capable of resisting soil liquefaction caused by the earthquake. Despite a lower zone of liquefaction being identified at a depth of below 19 m in the post-slide profile of scenario 1 or below 12 m in the pre-slide profile of scenarios 2 and 3, the upper non-liquefied layers of approximately 4 m or more in thickness would likely provide buffers and prevent the influence of lower liquefied zones on the ground surface, as suggested by Ishihara [48] and Dobry [49].
The results of liquefaction assessment associated with the liquefied zones identified for each of the boreholes are synthesized. A speculated slip surface connecting the liquefied zones of boreholes can therefore be delineated and is shown in Figure 12. It is noted that the speculated slip surface of the 2018 Petobo flowslide, based on the liquefaction assessment herein, is in good agreement with the speculated boundary of the sliding mass and in situ ground, as discussed previously through the results of probing and sounding during site investigation (Figure 11). It is also noted that the speculated slip surface as identified through the liquefaction assessment of scenario 1 (post-slide geometry and high GWT) is almost the same as that defined by the liquefaction assessment of scenario 2 (pre-slide geometry and high GWT). In accordance, the speculated slip surface is determined to generally pass through the weak interfaces of material layers and presents lower estimates of computed liquefaction stability during earthquake in both pre-slide and post-slide situations.
In scenario 3, however, with pre-slide geometry and the assumed low GWT that depicts the lack of an influence of the surface water infiltration, no slip surface was able to form continuously across the site due to the 2018 shaking. Instead, only a limited area in the middle of the slide boundary showed liquefaction, as recognized by the assessment results of BH-2 at depths of 6~11 m (Figure 13c). Liquefactions were also indicated for boreholes BH-1, BH-5 and BH-3 in the assessment. In view of the depths of liquefaction covered with relatively thick non-liquefied layers (>11 m), the manifestations and damages of the deep liquefactions on the shallower ground can be deemed unlikely based on the studies by Ishihara [48] and Dobry [49].

6.5. Flowslide Evaluation

The 2018 Petobo flowslide is simulated in two dimensions with an analysis cross-section along Moh. Soeharto road, the EW main road of the site (Figure 2). The 2D analysis models, with the main road profile in the X (i.e., EW) direction, are expanded perpendicular to both sides of the profile by 1500 m to ensure a plane strain condition. The elements of the model are arranged with a mesh size of 15 m × 15 m on the plane and a depth corresponding to the elevations of the slip surface determined in the liquefaction assessment stage. Both pre-slide and post-slide ground surfaces are considered for the analysis scenarios.
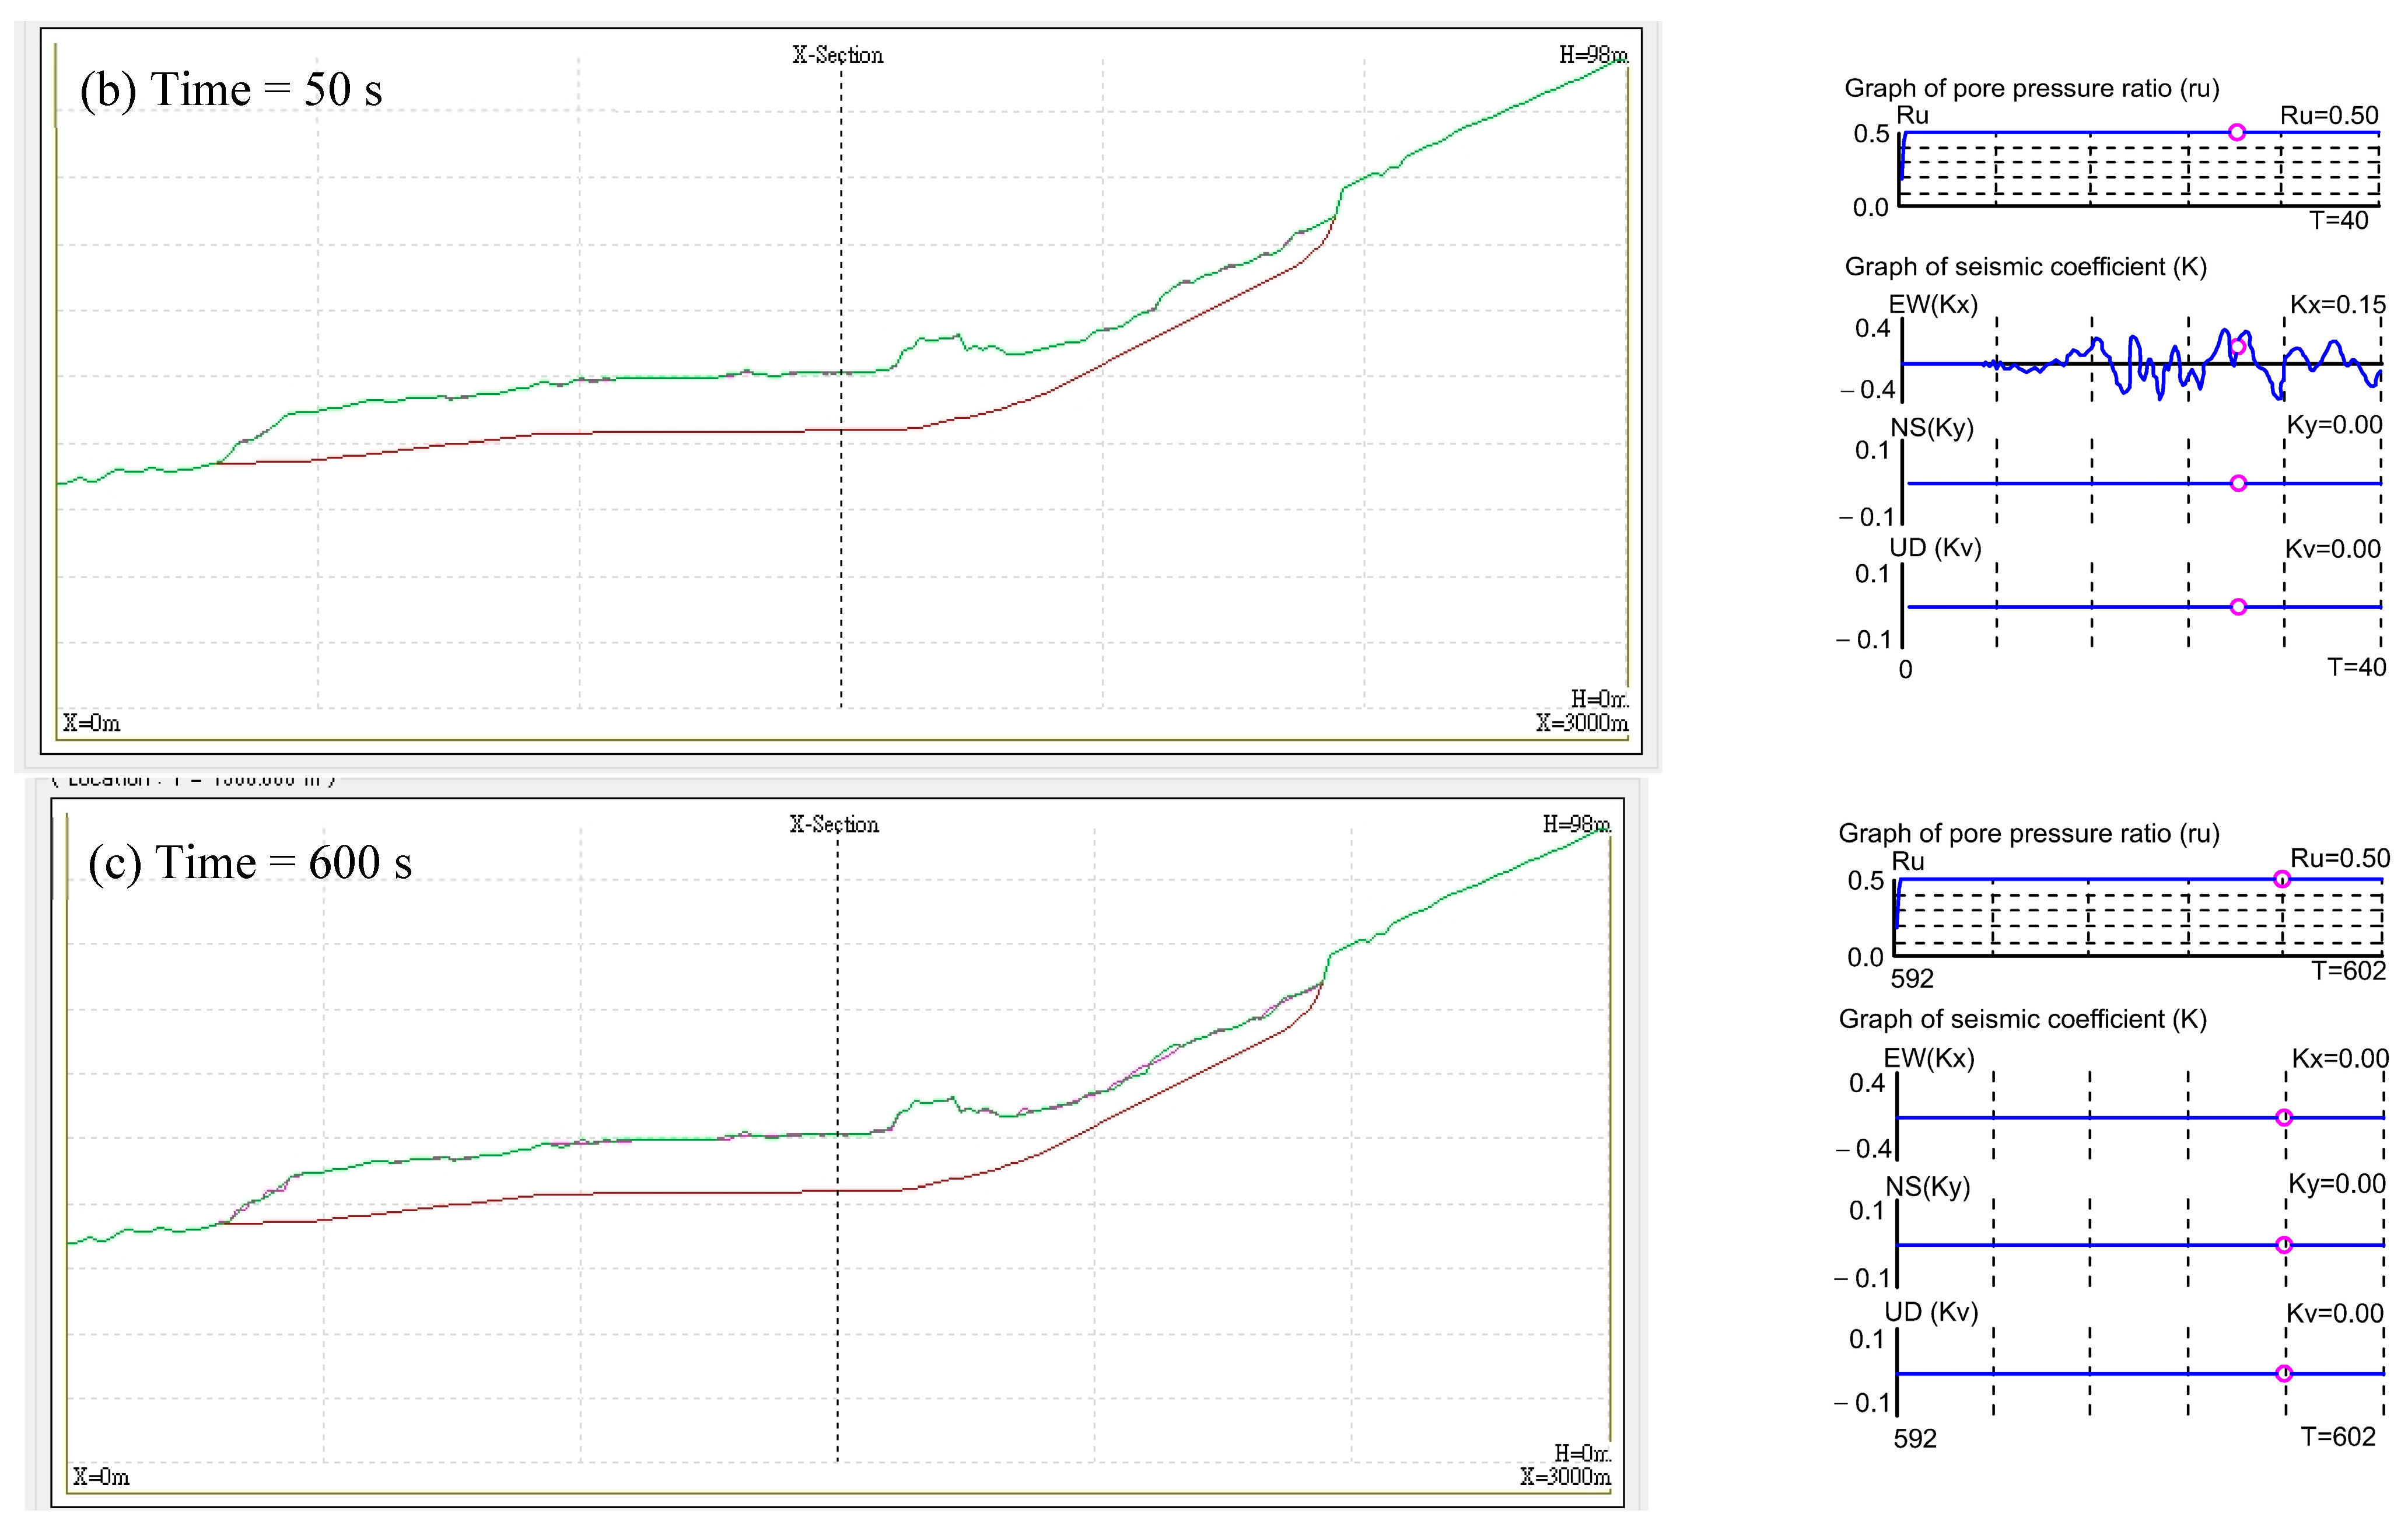
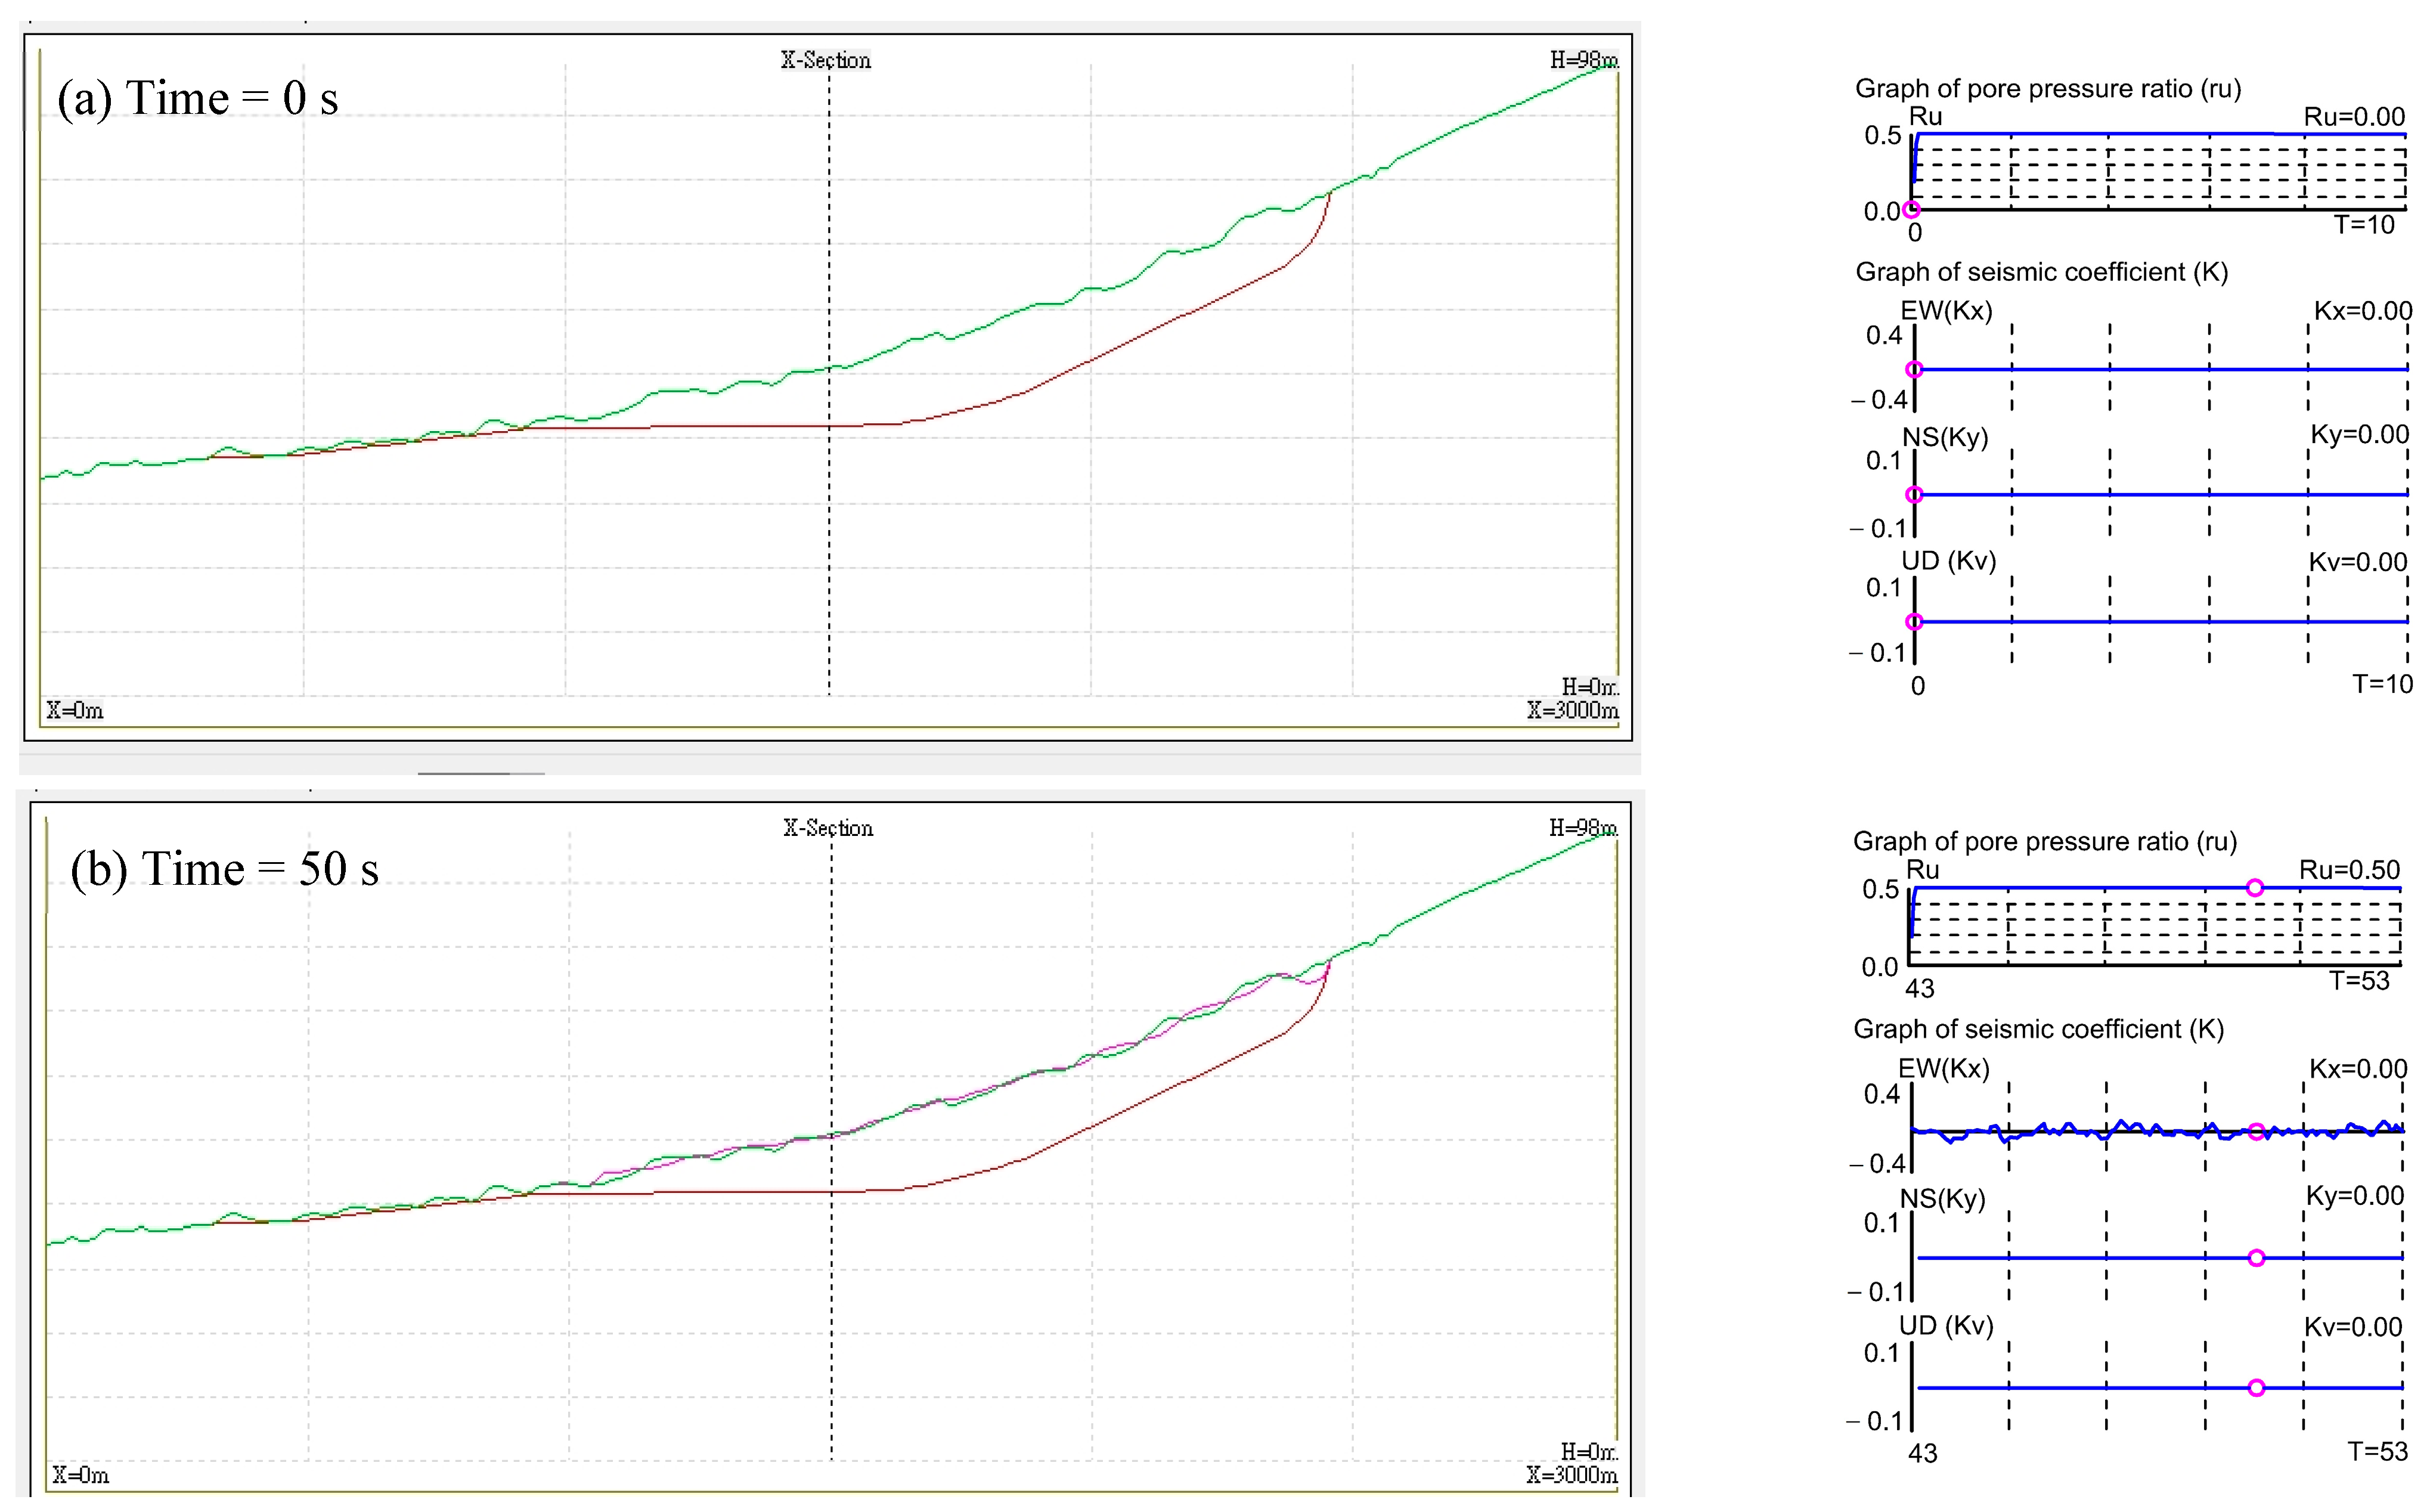
The analysis parameters assumed in LS-Rapid simulations are summarized in Table 5. Since the strength data of onsite materials have not yet been evaluated, the input parameters for materials and other analysis settings are assigned based on the recommended ranges of values by the software [42,44,50,51,52] as well as the estimated values of onsite soils by Mason et al. [11] and Okamura et al. [53]. In view of the morphological zonation of the Petobo site by Kusumawardani et al. [8], the classified morphological zones (i.e., ground slide—GS, liquefaction spread—LS, liquefaction flow—LF, and debris flood—DF) reflect the dissimilar strength characteristics of the associated materials and have an influence on the sliding behavior observed at the site. In accordance, we took the above into consideration and divided the analysis cross-section into four material zones, with each of the zones being equivalent to a morphological zonation by Kusumawardani et al. [8], as follows: (1) Zone 1 for LS-1, LF-1, LF-2a, and LF-2b; (2) Zone 2 for LF3; (3) Zone 3 for LF-4; and (4) Zone 4 for DF-2. The morphological zonation along the analysis cross-section, Moh. Soeharto road, can also be seen in Figure 12. In this simulation, the earthquake starts at 32 s, reaches a peak around 37 s, and stops at 120 s. Figure 14, Figure 15 and Figure 16 show the results of LS-Rapid simulation with computation times of 32 s, 50 s, and 600 s, respectively.
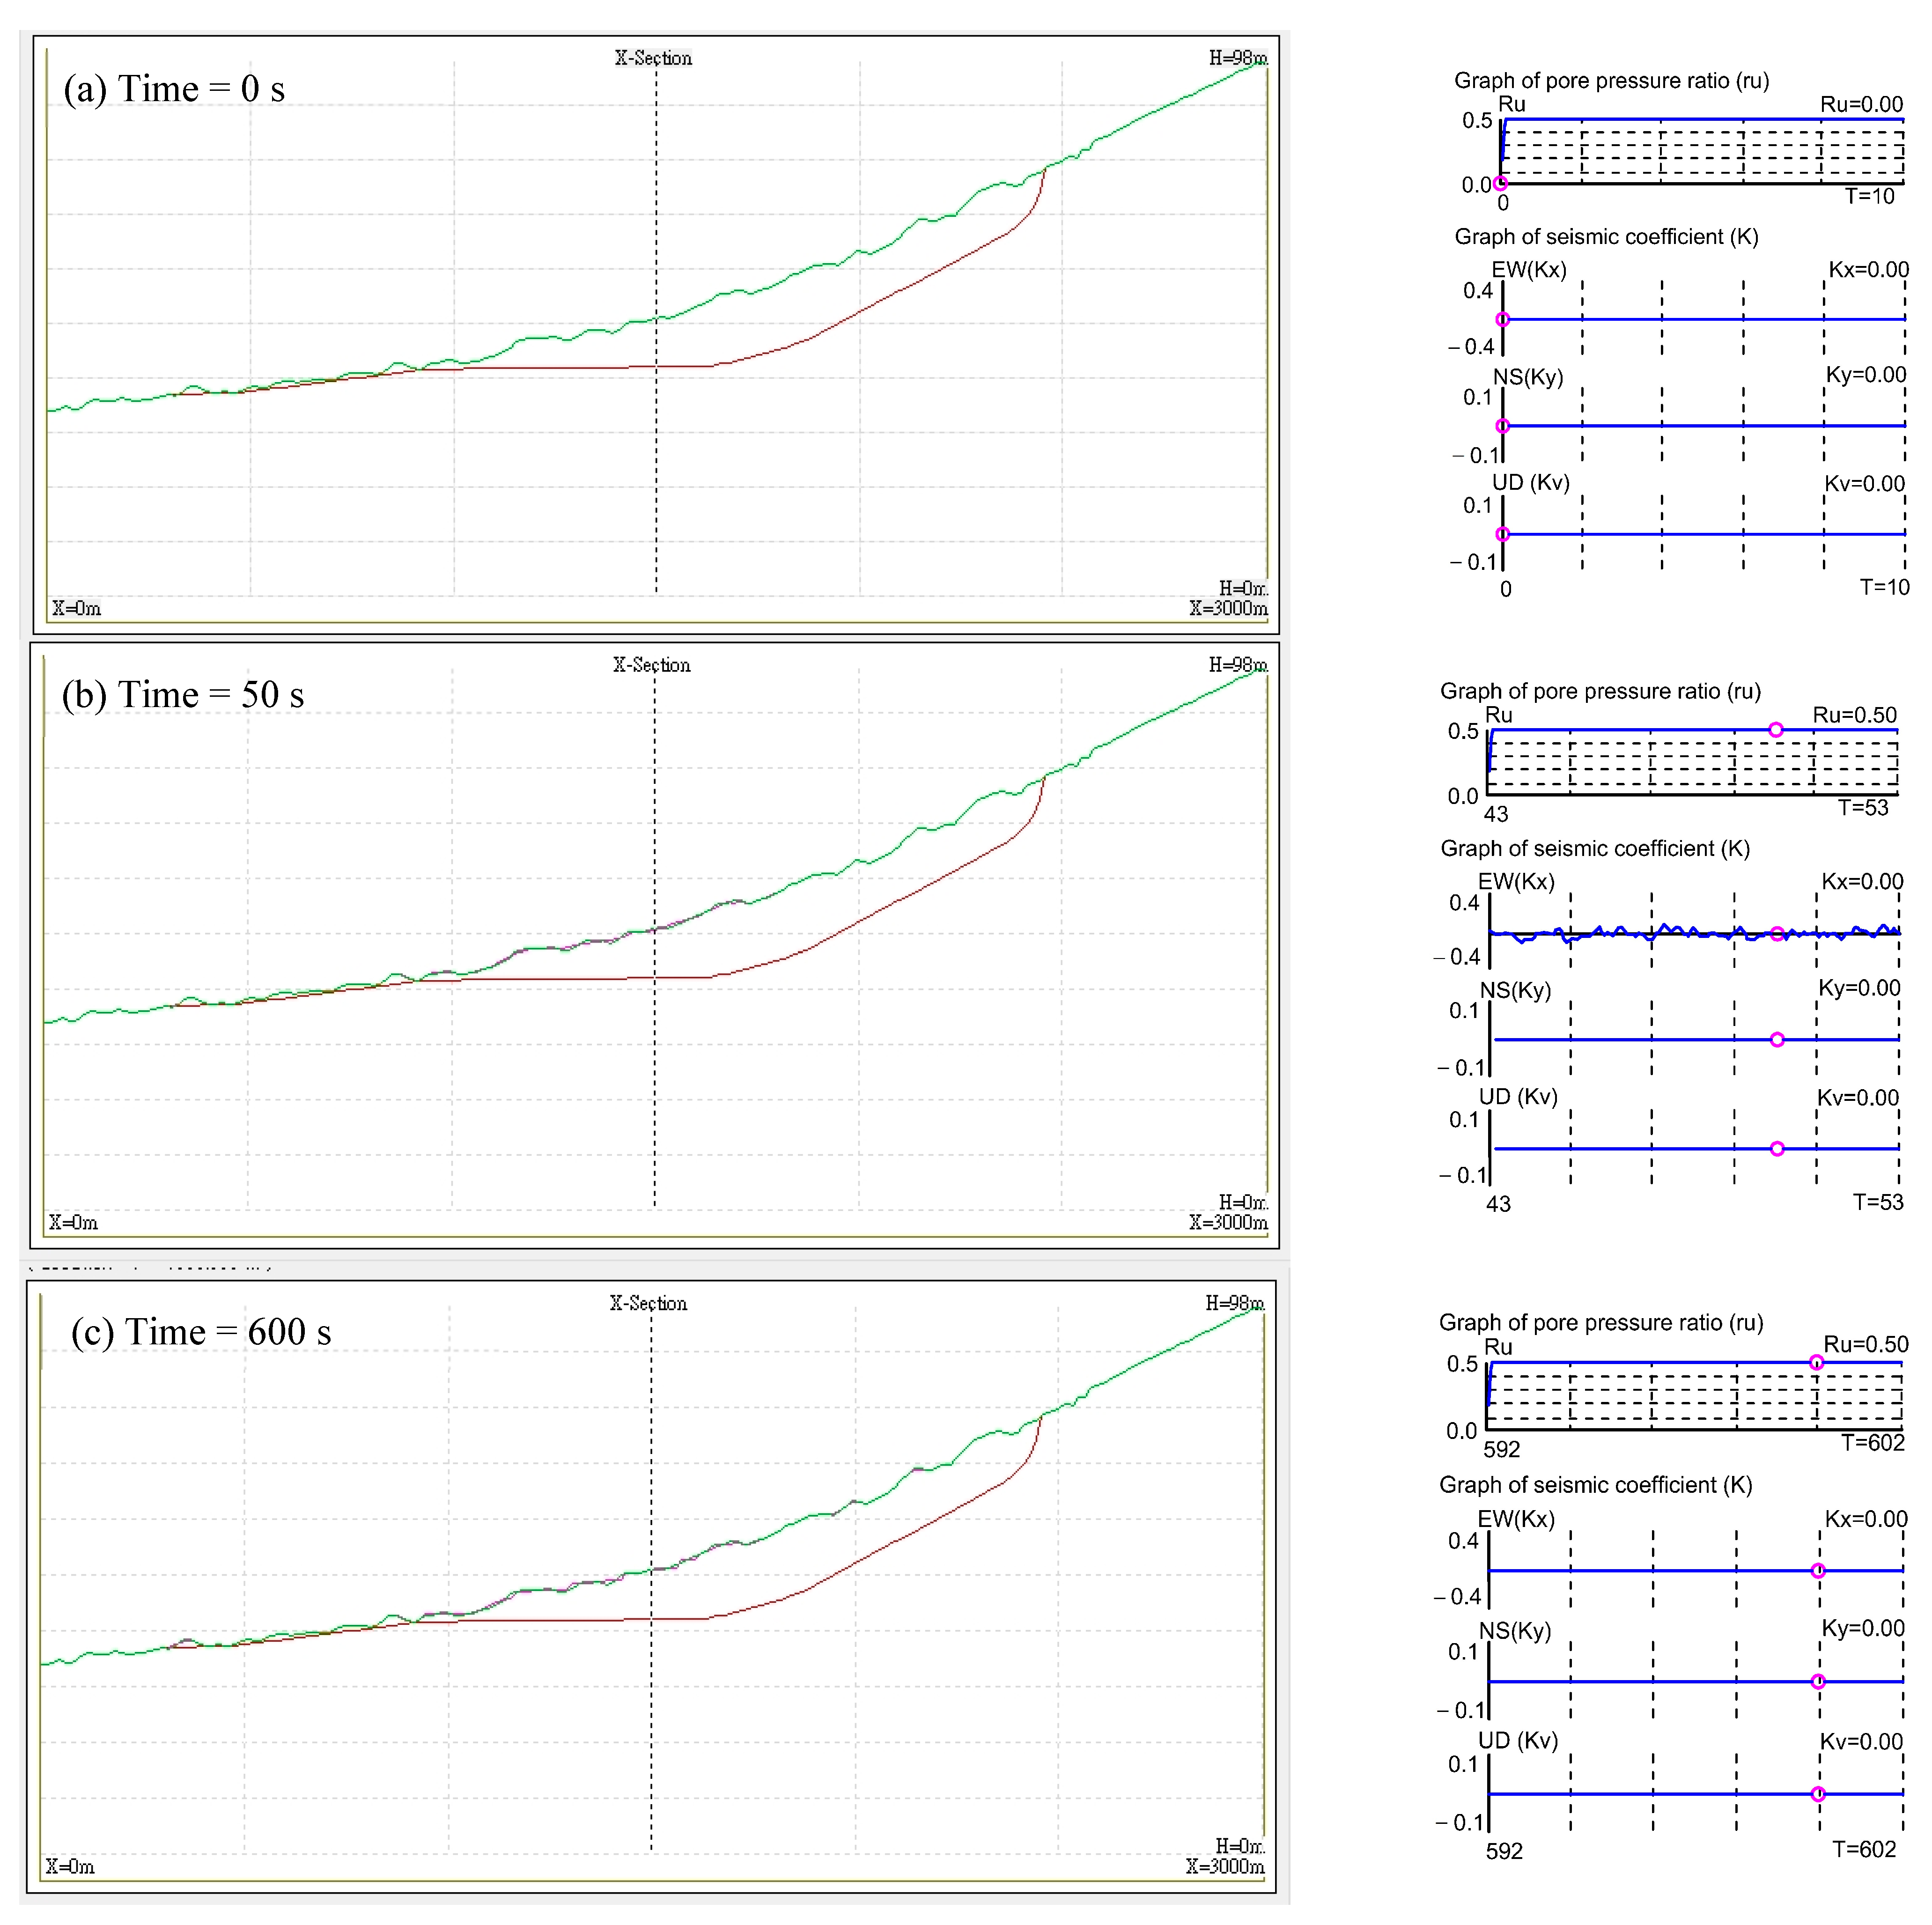
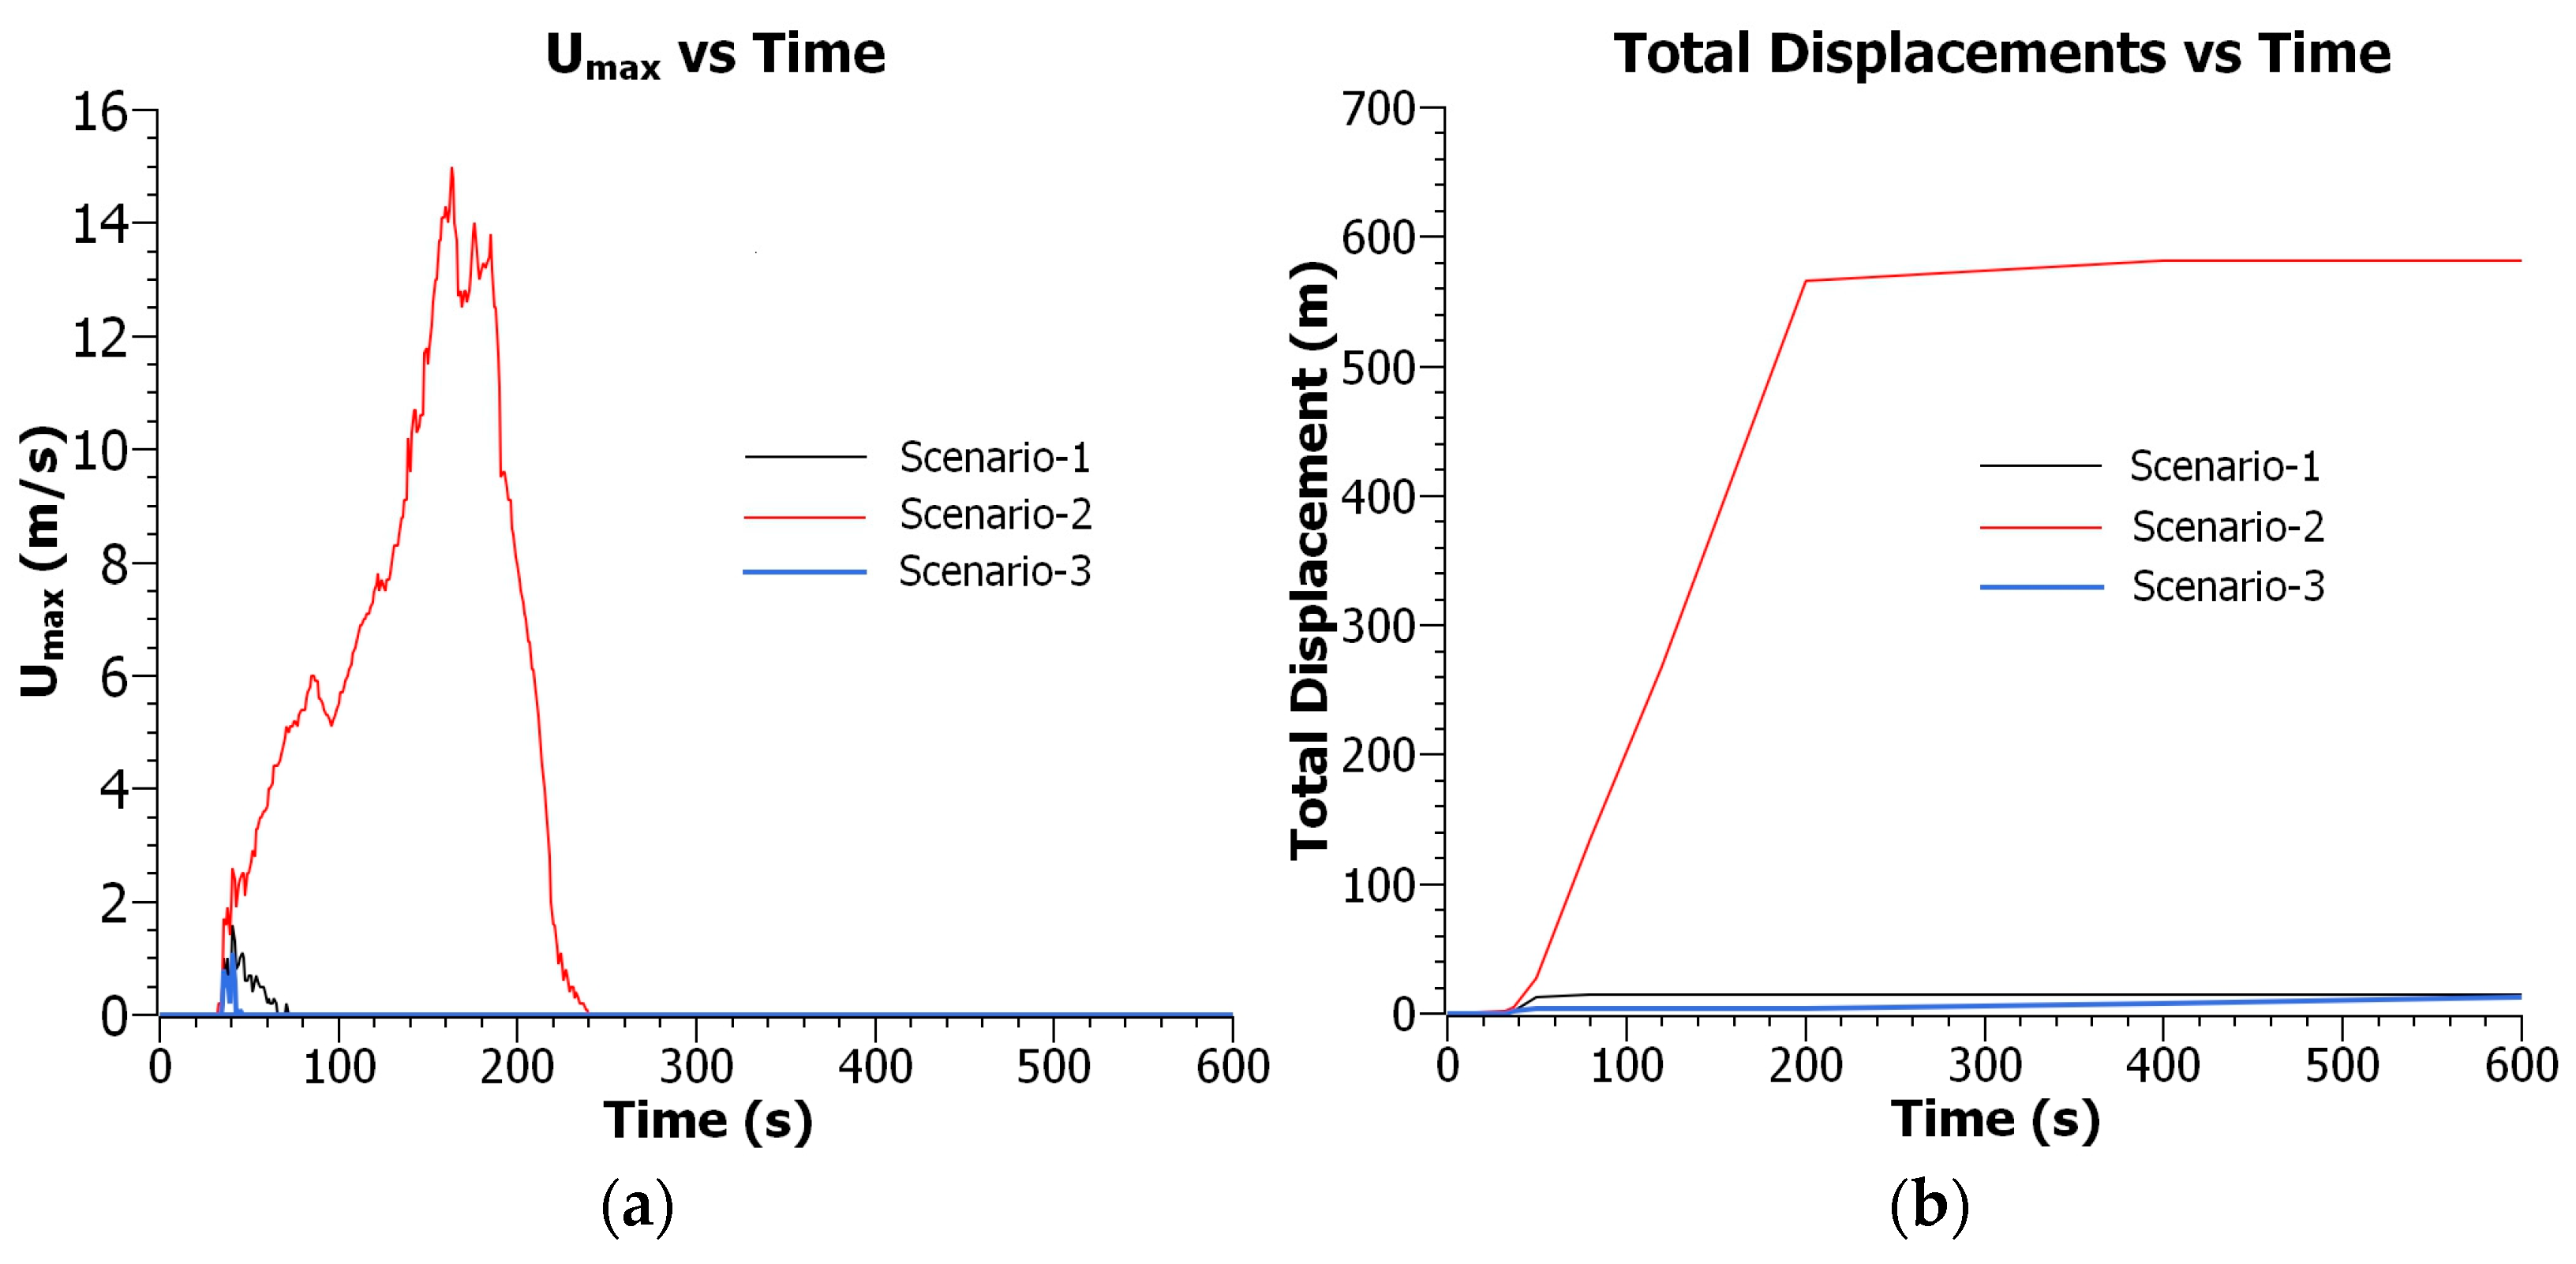
The results of flowslide simulation for scenario 1 in various computation stages are presented in Figure 14, in which the green and pink lines represent the initial post-slide ground surface (i.e., before computation) and the configuration of the sliding mass in progress, respectively. The results indicate that at second strike of the same earthquake on the failed Petobo site would cause minor deformations of the slope, till the end of computation of 600 s. The computed total displacement and maximum speed of the sliding mass are shown in Figure 17. The results imply that the initial strike of the earthquake that triggered the 2018 flowslide has resulted in a stabilized (post-slide) slope geometry, which would prevent a re-initiation of the flowslide of the failed slope by a second strike of the same earthquake.
The results of flowslide simulation for scenario 2 are illustrated in Figure 15, with various stages of sliding computation. scenario 2 is assumed for the case of the Petobo site when subjected to the 2018 earthquake shaking. The Petobo site had pre-slide geometry and a raised groundwater table as a result of the constant ground infiltration of the Gumbasa irrigation system and onsite paddy fields. The computed displacement and speed of the sliding mass are shown in Figure 17. As illustrated in Figure 15 and Figure 17, the flowslide started at approximately the same time as the initiation of earthquake shaking. The sliding speed reached a maximum value of approximately 15 m/s at a computation time of 163 s, then gradually decreased and ceased at a computation time of 240 s. The maximum displacement was 581.7 m. The computed final configuration of the sliding mass is comparable to the observed post-slide geometry, as indicated by the green line in Figure 14, in terms of the shape and sliding distance, implying that the simulation of scenario 2 would result in a significant flowslide that resembles the 2018 Petobo slide.
The results of scenario 3 are presented in Figure 16 and Figure 17. This scenario was used to examine the likelihood of the 2018 Petobo flowslide in the case of no infiltration of surface water (from irrigation system and wet paddy fields) and a low groundwater table of the site. As shown, the Petobo slope would not initiate a flowslide after the 2018 earthquake shaking if the deposit was desiccated and the groundwater level was low, even if some liquefiable zones were identified at depth in the middle portion of the site (i.e., BH-2). The results indicate that the slope stopped moving at a computation time of 45 s after earthquake shaking, and the maximum displacement of the slope was only about 1 m.

7. Discussion

A detailed program of field investigations and associated liquefaction analyses and flowslide simulations were conducted in this study. For a complete year of groundwater monitoring, which was conducted approximately one and half years after the slide, the variation in the groundwater table (GWT) of the site as a result of rainfall infiltration during the wet and dry seasons was generally minor, with a range of approximately ±1 m or less (Figure 5). It should be noted, however, that the GWT at BH-1 was approximately 12 m to 13 m deep below the ground, which was significantly lower than the expectation. In view of the proximity of BH-1 to the Gumbasa irrigation canal, which was fully loaded during and prior to the sliding [8] and was adjacent/beyond the sliding footprint (Figure 2), the GWT of the borehole should be high and close to the ground surface. Since the Gumbasa irrigation network and paddy fields were fully destroyed by the sliding, the onsite irrigation channels were displaced and dried and the ground became desiccated. Three weeks after the flowslide incident, Hidayat et al. [6] and Kiyota et al. [7] conducted probing tests at the site and found no GWT to a depth of around 5 m near BH-1, with an elevation of approximately the same as the pre-slide surface. However, a GWT of approximately 1 m in depth was encountered at the upstream side and within the sliding footprint (i.e., DCPT-2 and DCPT-3 in Figure 2), with elevations of around 5 m below those of the pre-slide ground. In addition, Mason et al. [11] have reported that the GWTs of the site dropped by more than 10 m in the months following the failure, based on interviews with the local residents. Bradley et al. [1] have also argued that the Gumbasa irrigation canal and onsite wet paddy fields would have contributed to the local groundwater recharges, because the soil materials of the site are sandy and gravelly and have a high rate of infiltration. Our field investigations of the site also confirm the onsite soils to have a measured permeability of around 10−4~10−2 cm/sec, a range suggesting clean sands to sandy gravels [54].
The electrical resistivity imaging (ERI) results also show the depth of the saturated zones. As indicated in Figure 6 and Table 3, the moderate–high resistivity of 20~60 ohm-m interpreted as saturated gravelly sand/sand is identified in profile EW-C1 and located at approximately 10 m below the ground surface. High resistivity values of >60 ohm-m interpreted as dry sandy gravel or gravelly sand are found on the shallow ground in profile EW-C1, extending from the proximity of the Gumbasa canal and approximately 200 m westwards to the upstream portion of the slide footprint. In accordance, the GWT in the east (upstream) portion of the sliding area would have been largely influenced by the presence of the Gumbasa irrigation canal and the onsite wet paddy fields. For the rest of the monitoring locations, the results generally indicate that the GWTs are relatively stable and close to the post-slide ground surface. It should be noted, however, that the GWTs at BH-5 and BH-3, located at the toe portion of the slide footprint, show relatively more fluctuations (Figure 5), suggesting that the measurements might have been affected not just by rainfall infiltration, but partly by the recharge of groundwater flow from the upstream side.
Based on borehole logs and ERI surveys, sandy soils with silt or gravel are mainly found in the morphological zones of ground slide (GS), liquefaction spread (LS) and liquefaction flow (LF), in the upstream and middle parts of the sliding area. The clayey and silty soils are mostly identified in the debris flood (DF) zone near the toe of the slide footprint. Silty and gravelly sands are abundant at depths of 0~10 m (Figure 6). However, in boreholes BH-2 and BH-5, the middle portion of the slide footprint, gravelly sands are also found below a depth of 10 m (Figure 7). The silts and clays are generally thick in the toe area, as indicated in profiles EW-C5 and EW-C6 (Figure 8), implying that this area is less likely to be liquefied during the earthquake shaking.
Liquefaction assessment was performed for the site using SPT-N approaches in association with three assumed analysis scenarios. The results indicate that the Petobo slope in its post-slide or pre-slide geometry and with a high GWT condition would cause the soil liquefaction of shallower ground in the upstream and middle portions of the slide footprint due to the 2018 earthquake shaking. The zones of liquefaction of the associated boreholes (BH-4, BH-2, and BH-5) enable the construction of a speculated slip surface that appears to be consistent with the boundary of the sliding mass and in situ ground, as interpreted through the results of subsurface investigations (Figure 12, Figure 12 and Figure 13). The upper depth of 10 m or so in borehole BH-1, located beyond the east boundary of sliding, generally presents no sign of soil liquefaction, which may have resulted from the gravelly type of the soils and the high blowcounts of the materials. Although low liquefaction resistances are computed at deeper depths (>10 m) in this location, the thick non-liquefied upper layer, however, would prevent the development of liquefaction and severe damage to the ground, as suggested by Ishihara [48] and Dobry [49]. Alternatively, the upper 13 m of borehole BH-3, located in the toe area of the site, consists mostly of silts and clays. The assessment of this depth interval generally indicates no liquefaction, which is due mainly to the type of materials, being those that are less likely to liquefy by shaking.
The flowslide simulation was conducted to provide an understanding of the initiation and movement of sliding that would not otherwise be provided by liquefaction assessment. The simulations were conducted using three analysis scenarios for liquefaction assessment and the slip surfaces were adopted based on the results of liquefaction assessment and field investigations.
The results of flowslide simulation for scenario 1 (post-slide geometry and high GWT) verify that the sliding of the failed mass will not be re-triggered due to the same earthquake, as a result of a more stabilized slope geometry that prevents the further movement of the slope. It should be noted that the results of liquefaction assessment indicate that some liquefiable zones still existed in the failed mass. The stabilized geometry of the major portion of the failed slope appeared to provide sufficient resistance against sliding promoted by the unstable portions due to soil liquefaction.
The results of flowslide simulation for scenario 2 (pre-slide geometry and high GWT) confirm the 2018 sliding behavior of the Petobo site. Liquefaction assessment showed that the liquefiable zones existed in the sliding mass due to shaking. A slight inclination of the pre-slide slope ( 3 ° ), providing static shear, appeared to trigger a long-distance sliding of the slope after earthquake shaking and soil liquefaction. The simulation indicated that the sliding was initiated at a computation time of approximately 33 s after the start of earthquake shaking and ceased at approximately 240 s (Figure 17). The total time of sliding would appear to be much shorter than the witness accounts, as detailed by Kusumawardani et al. [8]. The computed configuration of the slope after sliding, however, resembles the final geometry of the onsite failed slope, in terms of its shape and the sliding distance.
The results of flowslide simulation for scenario 3 (pre-slide geometry and low GWT) verify that the sliding of the Petobo slope due to the 2018 shaking would be unlikely if the local groundwater levels remained low as a result of the lack of recharge from the Gumbasa irrigation system and the onsite wet paddy fields. The results demonstrate the importance and adverse effects of anthropogenic factors due to the constant leaking of the irrigation system and wet paddy fields on the locally raised groundwater levels, increasing the risk of soil liquefaction and associated flowslides. Should the local groundwater not arbitrarily rise to a high level, the liquefaction-induced flowslide and the damages in the Petobo area could have been eased or avoided.

8. Summary and Conclusions

The Petobo long-distance flowslide induced by soil liquefaction occurred during the Mw7.5 Palu–Donggala earthquake on 28 September 2018. The incident resulted in thousands of people going missing or dying due to the flowslide. Several researchers have argued that the Gumbasa irrigation canal and the wet agricultural lands of the site played a key part in the incident. This paper attempts to discuss this issue by conducting a detailed field investigation for subsurface information, in association with other existing data, and by performing liquefaction assessments as well as flowslide simulations of the 2018 Petobo slide. The above three analysis scenarios would aid in the clarification of the various factors that might have contributed to the initiation and progress of the 2018 Petobo slide. Scenario 1 represents the post-slide geometry and high groundwater table (GWT) condition, to verify if sliding would be retriggered when the same earthquake strikes the site again. Scenario 2 represents the pre-slide geometry and high GWT condition, to confirm the sliding that was observed in the 2018 Palu–Donggala earthquake. Scenario 3 represents the pre-slide geometry and low GWT condition, to examine if the sliding would be triggered with no infiltration of the Gumbasa irrigation system and onsite paddies on the groundwater level of the site. The major findings of the study are summarized as follows:
(1)
As revealed by field investigations through drilling, probing and sounding, the subsurface material profile of the Petobo site generally consists of sandy deposits of SM/SP/SW, except for the toe portion where thick layers of silt (ML) and clay (CL) are found. The field investigations also confirmed the onsite sandy deposits with measured permeability of 10−4~10−2 cm/sec, equivalent to a range for clean sands to sandy gravels.
(2)
A year of groundwater monitoring conducted approximately one and a half years after the sliding incident indicated that the groundwater tables at the crest and upstream portions of the slide footprint are significantly lower than the levels at the time of the earthquake, suggesting that the anthropogenic efforts through the irrigation system and wet paddies would have a profound influence on the local groundwater levels, and that the ground condition would be very sensitive to the infiltration of surface waters.
(3)
Liquefaction assessments indicate that scenarios 1 and 2 would cause the soil liquefaction of shallower deposits in the middle and upstream portions of the Petobo site, in its post-slide and pre-slide geometries, respectively, with high groundwater tables due to the 2018 earthquake. In the toe portion, the assessment generally shows no sign of liquefaction, which may have been due to the soil deposit consisting mostly of silts and clays.
(4)
In the flowslide simulation of scenario 1, it is obvious that the failed slope reached a stabilized geometry, with a larger portion of the level ground that would prevent the further movement of the slope, even if zones of liquefaction may have still existed in the failed mass. The stabilized geometry of a major portion of the failed slope would provide sufficient resistance against sliding promoted by the unstable portions due to soil liquefaction.
(5)
The flowslide simulation of Scenario 2 confirms the 2018 sliding at the Petobo site. Liquefaction assessment showed that soil liquefaction existed in the slope due to shaking. A slight inclination of the pre-slide ground of approximately 3° would provide static shears and trigger a long-distance sliding of the slope after shaking and liquefaction. The simulation indicates that sliding was initiated at around 33 s, about the same time as the start of earthquake shaking, and ceased at approximately 240 s of computation time.
(6)
The flowslide simulation of scenario 3 verifies that the sliding at the Petobo site due to the 2018 shaking would not be possible, if the local groundwater levels remained low due to a lack of infiltration of the Gumbasa irrigation system and onsite wet paddy fields. The results demonstrate that the adverse effects originating from human activities, constantly recharging the groundwater through the leaking irrigation system and onsite wet paddy fields, locally raised the groundwater levels and increased the risk of soil liquefaction and flowslide.
(7)
In conclusion, this study suggests that the liquefaction-induced sliding in the Petobo area would have been due to the liquefiable sandy deposits, locally raised groundwater tables, a strong shaking that triggered extensive soil liquefaction, and gently sloping ground that provided static shears and promoted long-distance sliding.

Author Contributions

T.C.U., M.C. and R.K. conceived this research and designed the study; T.C.U., U.N. and G.A.P. participated in the field investigations, analysis and interpretations of the data; T.C.U., M.C., R.K. and C.-P.K. wrote the paper and participated in the associated revisions. All authors have read and agreed to the published version of the manuscript.

Funding

This research was funded by Research and Community Services Institute of Universitas Negeri Semarang, Indonesia for this work through International Research Collaboration Project Funding Fiscal year 2022 and also by the National Science and Technology Council, Taiwan, ROC, with contract number: MOST-110-2221-E-224-054.

Institutional Review Board Statement

Not applicable.

Informed Consent Statement

Not applicable.

Data Availability Statement

Not applicable.

Acknowledgments

The authors would like to express sincere gratitude for the materialization of this joint research between Universitas Negeri Semarang (UNNES, Indonesia) and National Yunlin University of Science and Technology (YunTech, Taiwan).

Conflicts of Interest

The authors declare that they have no potential conflict of interest in relation to the study of this paper.

References

  1. Bradley, K.; Mallick, R.; Andikagumi, H.; Hubbard, J.; Meilianda, E.; Switzer, A.; Du, N.; Brocard, G.; Alfian, D.; Benazir, B.; et al. Earthquake-triggered 2018 Palu valley landslides enabled by wet rice cultivation. Nat. Geosci. 2019, 12, 935–939. [Google Scholar] [CrossRef]
  2. Mason, H.B.; Gallant, A.P.; Hutabarat, D.; Montgomery, J.; Reed, N.; Wartman, J.; Irsyam, M.; Prakoso, W.; Djarwadi, D.; Harnanto, D.; et al. The 28 September 2018 M7.5 Palu–Donggala, Indonesia Earthquake: Version 1.0. Geotechnical Extreme Events Reconnaissance Association Report; GEER-061. 2019. Available online: https://ciptakarya.pu.go.id/admin/assets/upload/galeri/gempa/2023/02/16/163467_8_Geotechnical%20Extreme%20Events%20Reconnaissance%20The%2028%20September%202018%20M7.5%20Palu%20-%20Donggala,%20Indonesia%20Earthquake%20(VERSION%201.0_%203%20APRIL%202019).pdf (accessed on 1 July 2019).
  3. Miyajima, M.; Setiawan, H.; Yoshida, M.; Ono, Y.; Kosa, K.; Oktaviana, I.S.; Irdhiani, M. Geotechnical damage in the 2018 Sulawesi earthquake, Indonesia. Geoenvironmental Disasters 2019, 6, 6. [Google Scholar] [CrossRef]
  4. Watkinson, I.M.; Hall, R. Impact of communal irrigation on the 2018 Palu earthquake triggered landslides. Nat. Geosci. 2019, 12, 940–945. [Google Scholar] [CrossRef]
  5. Gallant, A.P.; Montgomery, J.; Mason, H.B.; Hutabarat, D.; Reed, A.N.; Wartman, J.; Irsyam, M.; Simatupang, P.T.; Alatas, I.M.; Prakoso, W.A.; et al. The Sibalaya Flowslide initiated by the 28 September 2018 MW 7.5 Palu–Donggala, Indonesia earthquake. Landslides 2020, 17, 1925–1934. [Google Scholar] [CrossRef]
  6. Hidayat, R.F.; Kiyota, T.; Tada, N.; Hayakawa, J.; Nawir, H. Reconnaissance on liquefaction-induced flow failure caused by the 2018 Mw 7.5 Sulawesi earthquake, Palu, Indonesia. J. Eng. Technol. Sci. 2020, 52, 51–65. [Google Scholar] [CrossRef] [Green Version]
  7. Kiyota, T.; Furuichi, H.; Hidayat, R.; Tada, N.; Nawir, H. Overview of long-distance flow-slide caused by the 2018 Sulawesi earthquake, Indonesia. Soils Found. 2020, 60, 722–735. [Google Scholar] [CrossRef]
  8. Kusumawardani, R.; Chang, M.; Upomo, T.C.; Huang, R.C.; Fansuri, M.H.; Prayitno, G.A. Understanding of Petobo liquefaction flowslide by 2018.09.28 Palu–Donggala Indonesia earthquake based on site reconnaissance. Landslides 2021, 18, 3163–3182. [Google Scholar] [CrossRef]
  9. National Agency for Disaster Management. Infografis Gempabumi M7,4 dan Tsunami Sulawesi Tengah update 5 February 2019, pukul 20.00 WIB. Available online: https://bnpb.go.id/infografis/infografis-gempabumi-m74-tsunami-sulawesi-tengah (accessed on 1 July 2019).
  10. Hungr, O.; Leroueil, S.; Picarelli, L. The Varnes classification of landslide types, an update. Landslides 2014, 11, 167–194. [Google Scholar] [CrossRef]
  11. Mason, H.B.; Montgomery, J.; Gallant, A.P.; Hutabarat, D.; Reed, A.N.; Wartman, J.; Irsyam, M.; Simatupang, P.T.; Alatas, I.M.; Prakoso, W.A.; et al. East Palu Valley flowslides induced by the 2018 MW 7.5 Palu–Donggala earthquake. Geomorphology 2021, 373, 107482. [Google Scholar] [CrossRef]
  12. Japan International Cooperation Agency and PT Indra Karya. Boring Survey for Basic Response for Central Sulawesi Earthquake (Phase 1) under the Japan International Cooperation Agency Survey for Disaster Information Collection in Indonesia; JICA: Tokyo, Japan, 2019.
  13. Center of Data and Information Technology of Indonesia. Lidar Data of Petobo Area before and after Palu Earthquake 2018; Ministry of Public Works and Public Housing of the Republic of Indonesia: Jakarta, Indonesia, 2020.
  14. Risna, W. Geological Investigation on the Liquefaction Potential of Palu Area, Central Sulawesi Province. Research Report. Geological Agency; Indonesian Ministry of Energy and Miineral Resources: Jakarta, Indonesia, 2012; (In Indonesian).
  15. Thein, P.S.; Pramumijoyo, S.; Brotopuspito, K.S.; Kiyono, J.; Wilopo, W.; Furukawa, A.; Setianto, A. Estimation of seismic ground motion and shaking parameters based on microtremor measurements at Palu city, Central Sulawesi province, Indonesia. Int. J. Geol. Environ. Eng. 2014, 8, 308–319. [Google Scholar]
  16. Watkinson, I.M.; Hall, R. Fault systems of the eastern Indonesian triple junction: Evaluation of Quaternary activity and implications for seismic hazards. Geol. Soc. 2016, 441, 71–120. [Google Scholar] [CrossRef]
  17. Patria, A.; Putra, P.S. Development of the Palu–Koro Fault in NW Palu Valley, Indonesia. Geosci. Lett. 2020, 7, 104659. [Google Scholar] [CrossRef]
  18. He, L.; Feng, G.; Li, Z.; Feng, Z.; Gao, H.; Wu, X. Source parameters and slip distribution of the 2018 Mw 7.5 Palu, Indonesia earthquake estimated from space-based geodesy. Tectophysics 2019, 772, 228216. [Google Scholar] [CrossRef]
  19. Walpersdorf, A.; Vigny, C.; Subarya, C.; Manurung, P. Monitoring of the Palu-Koro fault by GPS. Geophys. Res. Lett. 1998, 25, 2313–2316. [Google Scholar] [CrossRef] [Green Version]
  20. Sukamto, R. Reconnaissance Geologic Map of Palu Area, Sulawesi—Scale 1:250 000; Geological Survey of Indonesia, Directorate of Mineral Resources (Quadrangles 2015-2115); Geological Research and Development Centre: Ottawa, Canada, 1973.
  21. Hanifa, R. GEER–HATTI–PuSGeN Joint Survey on Palu Earthquake 2018 (M7. 4) 13-18 Nov 2018 Presentation; Indonesian Ministry of Research, Technology and Higher Education: Jakarta, Indonesia, 2018.
  22. Indonesian Agency for Meteorological, Climatological and Geophysics. Review of Ground Shaking due to the Donggala Earthquake on 28 September 2018. Available online: https://www.bmkg.go.id/berita/?p=ulasan-guncangan-tanah-akibat-gempabumi-utara-donggala-sulteng-28-september-2018&lang=ID&tag=ulasan-guncangan-tanah (accessed on 24 August 2019). (In Indonesian).
  23. Stan-Kłeczek, I.; Stan, D. Application of the ERT to recognise the geological structure of frost-riven clifs localised in the Skalny Potok (Hrubý Jeseník Mts.). Acta Geophys. 2019, 67, 1759–1764. [Google Scholar] [CrossRef] [Green Version]
  24. Samouëlian, A.; Cousin, I.; Tabbagh, A.; Bruand, A.; Richard, G. Electrical resistivity survey in soil science: A review. Soil Tillage Res. 2005, 83, 173–193. [Google Scholar] [CrossRef] [Green Version]
  25. Salleh, A.N.; Muztaza, N.M.; Sa’ad, R.; Zakaria, M.T.; Mahmud, N.; Rosli, F.N.; Samsudin, N. Application of geophysical methods to evaluate soil dynamic properties in Penang Island, Malaysia. J. Asian Earth Sci. 2021, 207, 1–12. [Google Scholar] [CrossRef]
  26. Loke, M.H. Electrical Imaging Surveys for Environmental and Engineering Studies: A Practical Guide to 2D and 3D Surveys. Geotomo Software; Penang Publishers: Penang, Malaysia, 1999. [Google Scholar]
  27. Reynolds, J.M. An Introduction to Applied Environmental Geophysics; Wiley: New York, NY, USA, 1997. [Google Scholar]
  28. Loke, M.H. Rapid 2-D Resistivity and IP Inversion Using the Least-Squares Method; Geotomo Software; Penang Publishers: Penang, Malaysia, 2018. [Google Scholar]
  29. Seed, H.B.; Tokimatsu, K.; Harder, L.F.; Chung, R.M. Influence of SPT procedures in soil liquefaction resistance evaluations. J. Geotech. Eng. 1985, 111, 1425–1445. [Google Scholar] [CrossRef]
  30. Sy, A.; Campanella, R.G. An alternative method of measuring SPT energy. In Proceedings of the 2nd International Conference Recent Advances in Geotechnical Earthquake Engineering and Soil Dynamics, St. Louis, MO, USA, 11–15 March 1991. [Google Scholar]
  31. Abou-matar, H.; Goble, G.G. SPT dynamic analysis and measurements. J. Geotech. Geoenvironmental Eng. 1997, 123, 921–928. [Google Scholar] [CrossRef]
  32. Geotechnical Engineering Office (GEO) Hong Kong. GEOGUIDE II—Guide to Site Investigation; Civil Engineering Department, Hong Kong SAR Government: Hong Kong, China, 1996.
  33. Youd, T.L.; Idriss, I.M.; Andrus, R.D.; Arango, I.; Castro, G.; Christian, J.; Dobry, R.; Liam Finn, W.D.; Leslie, H.; Hynes, M.E.; et al. Liquefaction resistance of soils: Summary report from the 1996 NCEER and 1998 NCEER/NSF workshops on evaluation of liquefaction resistance of soils. J. Geotech. Geoenvironmental Eng. 2001, 127, 817–833. [Google Scholar] [CrossRef] [Green Version]
  34. Japan Road Association (JRA). Design code and explanations for roadway bridges, 2017 version. In Part V–Seismic Resistance Design, Japan; Japan Road Association: Tokyo, Japan, 2017. [Google Scholar]
  35. Seed, H.B.; Idriss, I.M. Analysis of soil liquefaction: Niigata earthquake. J. Soil Mech. Found. Div. 1967, 93, 83–108. [Google Scholar] [CrossRef]
  36. Seed, H.B. Soil liquefaction and cyclic mobility evaluation for level ground during earthquakes. J. Geotech. Eng. 1979, 105, 201–255. [Google Scholar] [CrossRef]
  37. Seed, H.B.; Idriss, I.M.; Arango, I. Evaluation of liquefaction potential using field performance data. J. Geotech. Eng. 1983, 109, 458–482. [Google Scholar] [CrossRef]
  38. Japan Road Association (JRA). Design code and explanations for roadway bridges, 1990 version. In Part V–Seismic Resistance Design, Japan; Japan Road Association: Tokyo, Japan, 1990. [Google Scholar]
  39. Chang, M.; Chan, M.S.; Huang, R.C.; Upomo, T.C.; Kusumawardani, R. Assignment of Groundwater Table in Liquefaction Analysis of Soils. In Advancements in Geotechnical Engineering. Sustainable Civil Infrastructures; Shehata, H., Badr, M., Eds.; Springer: Berlin/Heidelberg, Germany, 2020; pp. 3–18. [Google Scholar]
  40. Sassa, K. Geotechnical model for the motion of landslides. In Proceedings of the 5th International Symposium on Landslides, Balkema, Rotterdam, The Netherland, 10–15 July 1988. [Google Scholar]
  41. Sassa, K.; Wang, G.; Fukuoka, H.; Wang, F.W.; Ochiai, T.; Sugiyama, S.T. Landslide risk evaluation and hazard mapping for rapid and long-travel landslides in urban development areas. Landslides 2004, 1, 221–223. [Google Scholar] [CrossRef]
  42. Sassa, K.; Setiawan, H.; He, B.; Gradiški, K.; Dang, K. TXT-tool 3.081-1.5: Manual for the LS-RAPID software. In Landslide dynamics: ISDR-ICL Landslide Interactive Teaching Tools; Springer: Berlin/Heidelberg, Germany, 2018; pp. 191–224. [Google Scholar]
  43. He, B.; Sassa, K.; Nagai, O.; Takara, K. Simulation of a Rapid and Long Travelling Landslide Using 2D-RAPID and LS-RAPID 3D Models. In Landslide Science for a Safer Geoenvironment: Vol. 1: The International Programme on Landslides (IPL); Springer International Publishing: Cham, Switzerland, 2014; pp. 479–484. [Google Scholar]
  44. Sassa, K.; Nagai, O.; Solidum, R.; Yamazaki, Y.; Ohta, H. An Integrated Model Simulating the Initiation and Motion of Earthquake and Rain Induced Rapid Landslides and Its Application to the 2006 Leyte Landslide. Landslides 2010, 7, 219–236. [Google Scholar] [CrossRef]
  45. Palacky, G.J. Resistivity characteristics of geological targets. In Electromagnetic Methods in Apllied Geophysics, Theory Society of Exploration Geophysicists; Nabighian, M.N., Ed.; Society of Exploration Geophysicists: Tulsa, OK, USA, 1991; Volume 1, pp. 53–129. [Google Scholar]
  46. Meads, L.N.; Bentley, L.R.; Mendoza, C.A. Application of electrical resistivity imaging to the development of a geologic model for a proposed Edmonton landfill site. Can. Geotech. J. 2003, 40, 551–558. [Google Scholar] [CrossRef]
  47. Lee, C.; Tsai, L.L.; Yang, C.; Wen, K.; Wang, Z.; Hsieh, Z.; Liu, H. The identified origin of a linear slope near Chi–Chi earthquake rupture combining 2D, 3D resistivity image profiling and geological data. Environ. Geol. 2009, 58, 1397–1406. [Google Scholar] [CrossRef]
  48. Ishihara, K. Stability of natural deposits during earthquakes. In Proceedings of the 11th International Conference on Soil Mechanics and Foundation Engineering, San Fransisco, USA, 12–16 August 1985. [Google Scholar]
  49. Dobry, R. Soil properties and earthquake ground response. In Proceedings of the Tenth European Conference on Soil Mechanics and Foundation Engineering, Florence, Italy, 26–30 May 1991. [Google Scholar]
  50. Dang, K.; Sassa, K.; Fukuoka, H.; Sakai, N.; Sato, Y.; Takara, K.; Quang, L.H.; Loi, D.H.; Van Tien, P.; Ha, N.D. Mechanism of two rapid and long-runout landslides in the 16 April 2016 Kumamoto earthquake using a ring-shear apparatus and computer simulation (ls-rapid). Landslides 2016, 13, 1525–1534. [Google Scholar] [CrossRef]
  51. Huy, L.D.; Sassa, K.; Fukuoka, H.; Sato, Y.; Takara, K.; Setiawan, H.; Pham, T.; Dang, K. TXT-tool 3.081-1.4: Initiation Mechanism of Rapid and Long Run-Out Landslide and Simulation of Hiroshima Landslide Disasters Using the Integrated Simulation Model (LS-RAPID). In Landslide Dynamics: ISDR-ICL Landslide Interactive Teaching Tools; Springer: Berlin/Heidelberg, Germany, 2018; pp. 149–168. [Google Scholar]
  52. Sassa, K.; He, B.; Miyagi, T.; Strasser, M.; Konagai, K.; Ostric, M.; Setiawan, H.; Takara, K.; Nagai, O.; Yamashiki, Y.; et al. A hypothesis of the Senoumi submarine megaslide in Suruga Bay in Japan—Based on the undrained dynamic-loading ring shear tests and computer simulation. Landslides 2012, 9, 439–455. [Google Scholar] [CrossRef]
  53. Okamura, M.; Ono, K.; Arsyad, A.; Minaka, U.S.; Nurdin, S. Large-scale flowslide in Sibalaya caused by the 2018 Sulawesi earthquake. Soils Found. 2020, 60, 1050–1063. [Google Scholar] [CrossRef]
  54. Chang, M.; Upomo, T.C.; Prayitno, G.A.; Kusumawardani, R.; Huang, R.C.; Liao, C.M. Subsurface investigation of liquefaction induced Petobo landslide during 28 September 2018 Palu Donggala Indonesia earthquake. Sino-Geotechnics 2022, 173, 111–120, (In Chinese with English abstract). [Google Scholar]
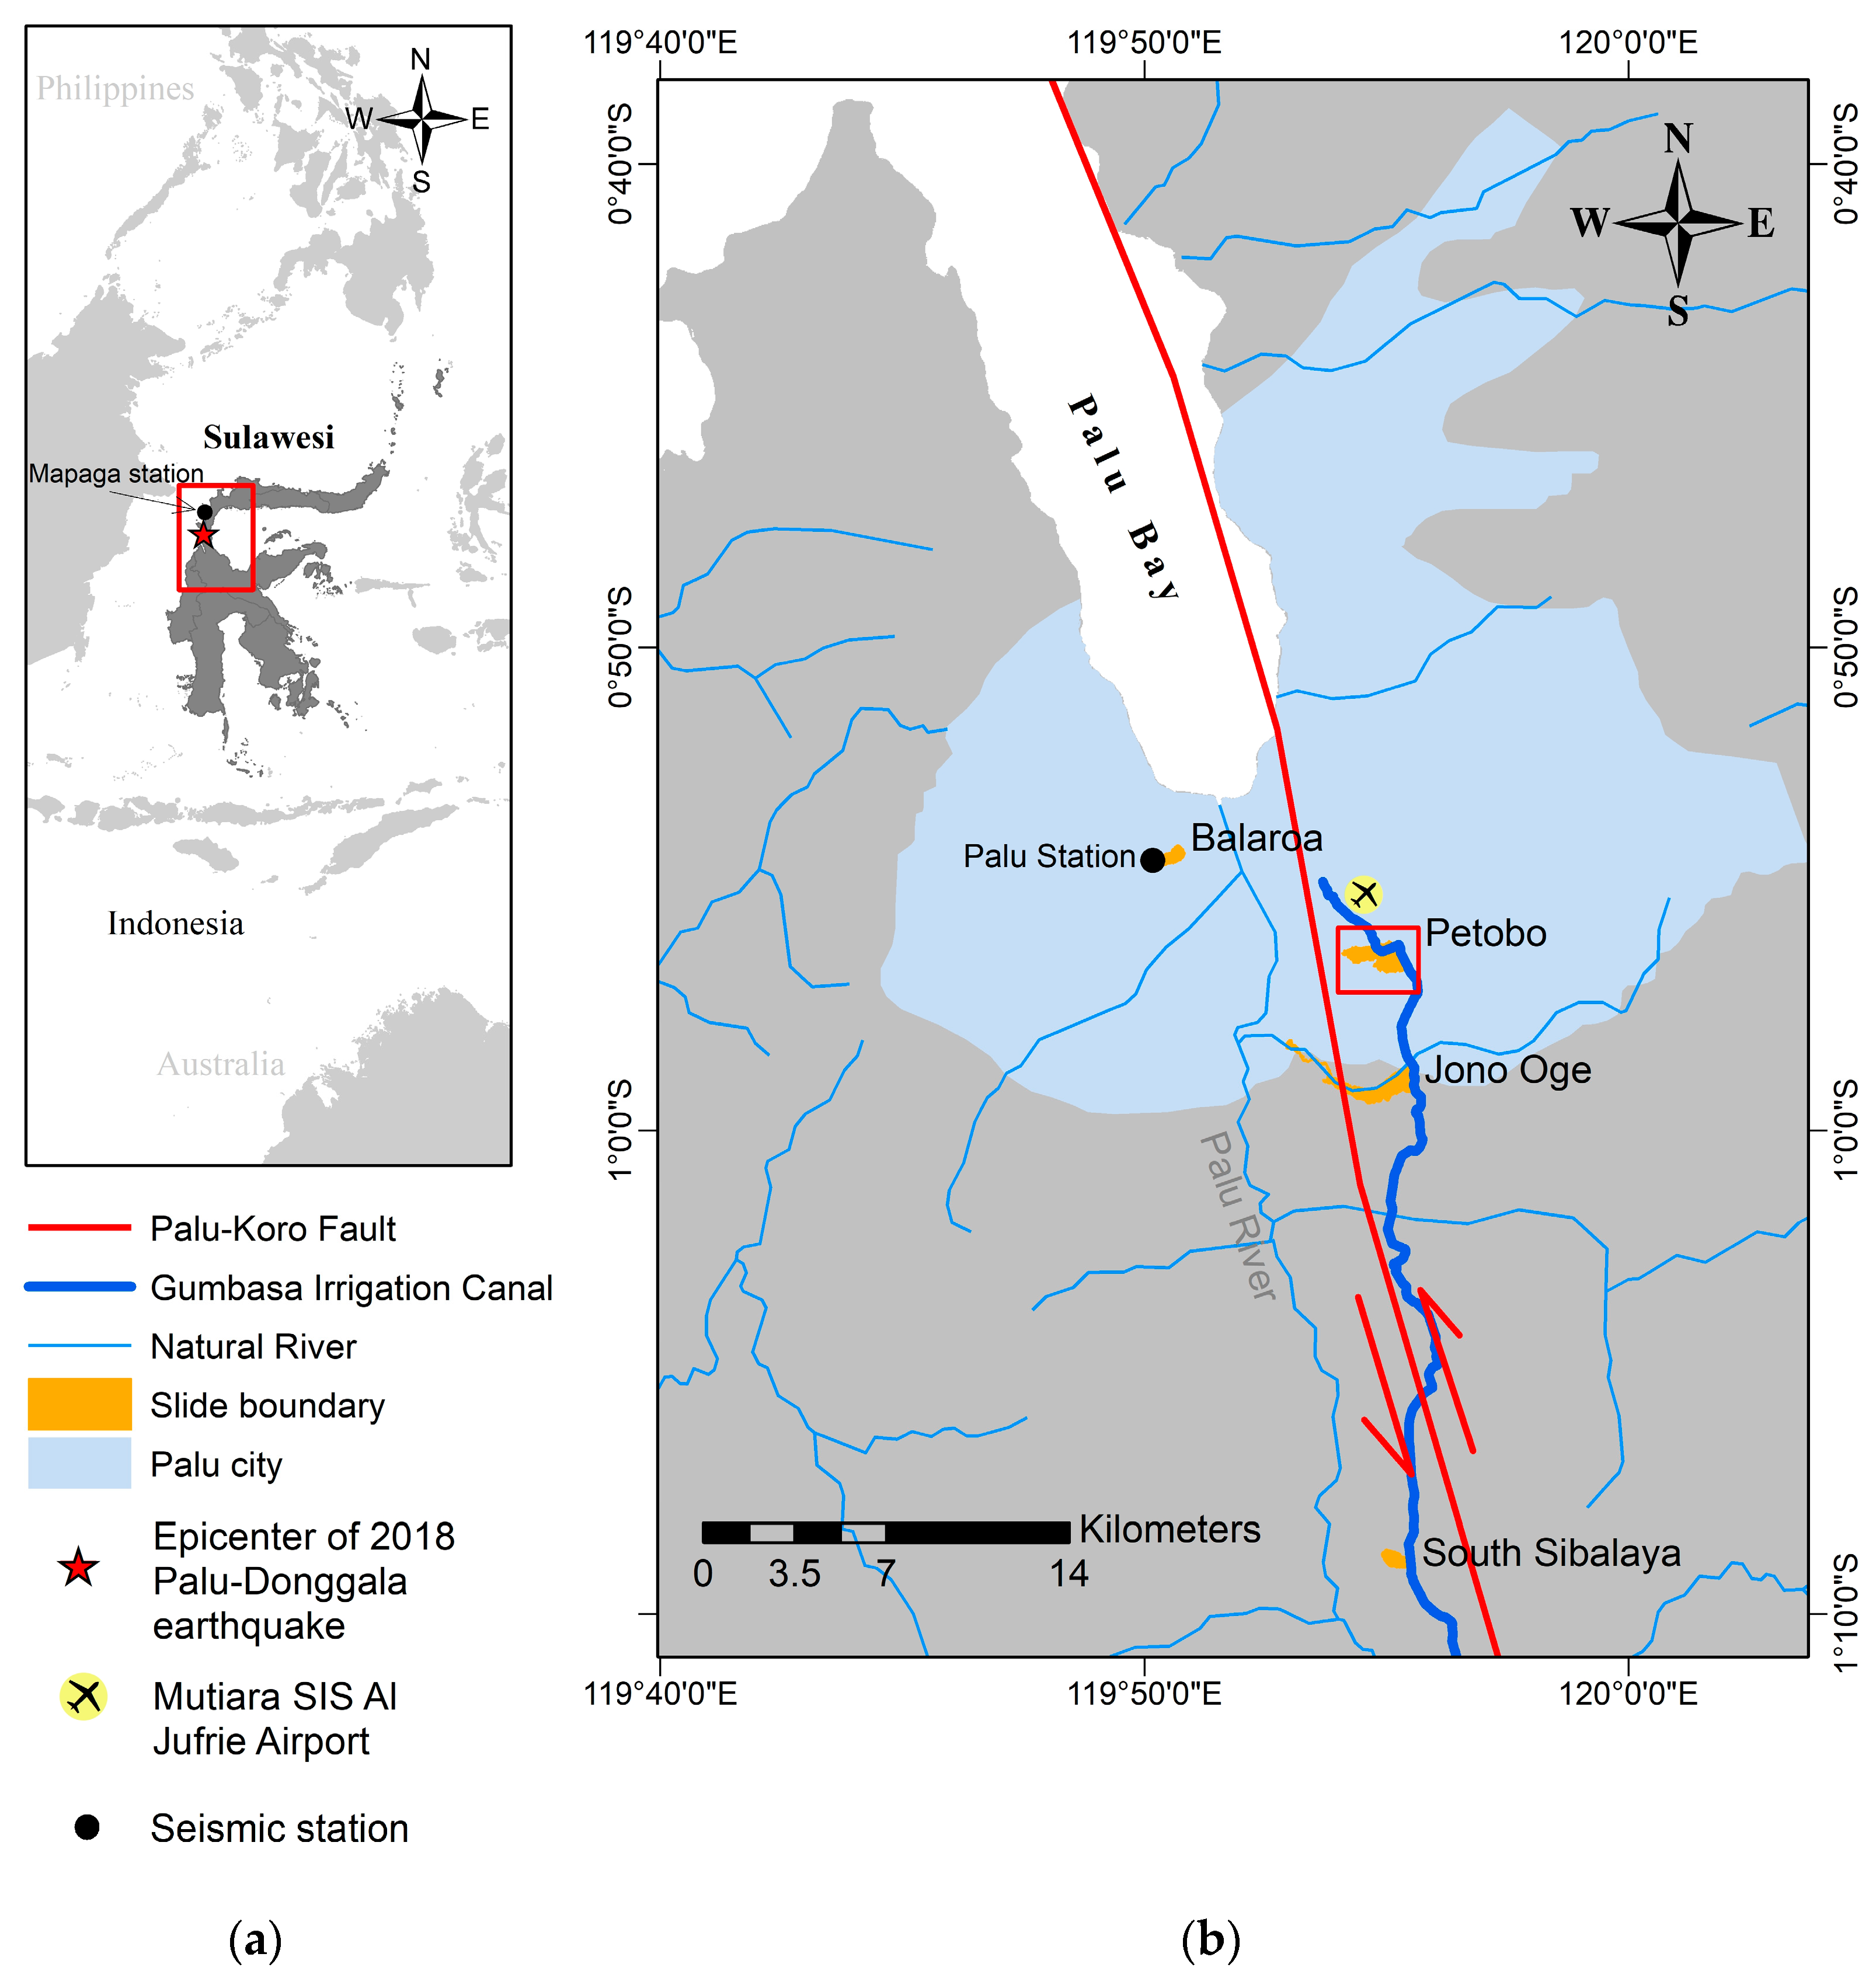
Figure 1. Location of study area. (a) Sulawesi island, Indonesia. (b) Four flowslide areas in Palu bay area: Balaroa, Petobo, Jono Oge and South Sibalaya.
Sustainability 15 05371 g001
Figure 2. Location of various types of field investigation conducted near Moh. Soeharto road of the study area.
Sustainability 15 05371 g002
Figure 3. The Gumbasa irrigation canal after slide (ad). The point of view of photo location can be seen in Figure 2.
Sustainability 15 05371 g003aSustainability 15 05371 g003b
Figure 4. Schematic illustration of column element in landslide mass for LS-RAPID analysis [44].
Sustainability 15 05371 g004
Figure 5. Results of groundwater measurement at Petobo site after the 2018 incident.
Sustainability 15 05371 g005
Figure 6. ERI profiles of EW-C1 and EW-C2 with comparison of borehole logs at BH-1 and BH-4.
Sustainability 15 05371 g006
Figure 7. ERI profiles of EW-C3 and EW-C4 with comparison of borehole logs at BH-2 and BH-5.
Sustainability 15 05371 g007
Figure 8. PERI profiles of ERI at EW-C5 and EW-C6 with comparison of borehole log at BH-3.
Sustainability 15 05371 g008
Figure 9. Photos showing GS and LS morphological features observed at Petobo sliding area: (a) ground slide (GS), (b) liquefaction spread (LS).
Sustainability 15 05371 g009
Figure 10. Results of GCO probing at Petobo site.
Sustainability 15 05371 g010
Figure 11. Interpretation of material stratification profile along Moh. Soeharto road in Petobo sliding area: (a) post-slide surface geometry and (b) pre-slide surface geometry.
Sustainability 15 05371 g011
Figure 12. Interpretation of the assumed GWT condition, material stratification, and speculated slip surface in the profile along Moh. Soeharto road in Petobo sliding area: (a) post-slide surface geometry and (b) pre-slide surface geometry.
Sustainability 15 05371 g012aSustainability 15 05371 g012b
Figure 13. Results of soil liquefaction analysis: (a) scenario 1 (post-slide and high GWT), (b) scenario 2 (pre-slide and high GWT), and (c) scenario 3 (pre-slide and low GWT).
Sustainability 15 05371 g013
Figure 14. Results of LS-Rapid simulation for scenario 1 (post-slide geometry and high GWT). (Note: “green” and “pink” lines represent the slope geometries before and after computations, respectively; and “red” line is the assumed slip surface.).
Sustainability 15 05371 g014aSustainability 15 05371 g014b
Figure 15. Results of LS-Rapid simulation for scenario 2 (pre-slide geometry and high GWT). (Note: “green” and “pink” lines represent the slope geometries before and after computations, respectively; and “red” line is the assumed slip surface.)
Sustainability 15 05371 g015aSustainability 15 05371 g015b
Figure 16. Results of LS-Rapid simulation for scenario 3 (pre-slide geometry and low GWT). (Note: “green” and “pink” lines represent the slope geometries before and after computations, respectively; and “red” line is the assumed slip surface.)
Sustainability 15 05371 g016
Figure 17. Results of LS-Rapid simulation in scenario 1, scenario 2, and scenario 3. (a) Maximum velocity vs. time, and (b) total displacements vs. time.
Sustainability 15 05371 g017
Table 1. Analysis scenarios for liquefaction assessment and flowslide simulation.
ScenarioGeometryTiming and GWT
(1)Post-slideThe condition at the cease of sliding if the same earthquake (M = 7.5, PGA = 0.34 g) strikes the site again (post-slide geometry; high GWT)
(2)Pre-slideThe condition when the localized high-raised GWTs, due to the influence of Gumbasa canal, irrigation system and paddy fields, existed at the time of earthquake (pre-slide geometry; high GWT)
(3)Pre-slideThe condition when the local GWTs were not affected by the canal and paddy fields/irrigation system at the time of earthquake (pre-slide geometry; low GWT)
Table 2. Results of groundwater monitoring.
Borehole NumberGroundwater Table (m)
(Depth from the Ground Surface)
MaxMinAverage
BH-1−13.63−12.75−13.18
BH-2−0.38+0.34−0.05
BH-3−4.70−2.60−3.83
BH-4−0.30+0.25−0.01
BH-5−3.30−0.24−1.70
Table 3. Interpreted correlation of soil type and resistivity value.
Resistivity Value
(ohm-m)
Resistivity ClassificationSoil Type Interpretation
<12Lowsandy SILT/SILT/silty CLAY/CLAY/sandy CLAY
12–20Moderate–lowsilty SAND
20–60Moderate–highgravelly SAND/SAND (saturated)
>60Highsandy GRAVEL/gravelly SAND (dry)
Table 4. Assumptions of soil profile and GWT for analysis scenarios.
BoreholeScenario 1
Geometry: Post-Slide
GWT: Right after Slide (GWT High)
Scenario 2
Geometry: Pre-Slide
GWT: Estimated GWT prior to Slide (GWT High)
Scenario 3
Geometry: Pre-Slide
GWT: Estimated GWT without Influences from Canal and Paddy Fields (GWT Low)
GWT Depth (m)Soil ProfileGWT Depth (m)Soil ProfileGWT Depth (m)Soil Profile
BH-1−1.00Post-slide elevation−1.00Same as post-slide elevation−13.00Same as post-slide elevation
BH-20.00Post-slide elevation0.00Post-slide elevation +1.25 m−6.50Post-slide elevation +1.25 m
BH-30.00Post-slide elevation−0.50Post-slide elevation −7.50 m−2.00Post-slide elevation −7.50 m
BH-40.00Post-slide elevation0.00Post slide elevation +5.00 m−11.00Post-slide elevation +5.00 m
BH-50.00Post-slide elevation−0.50Post-slide elevation −2.50 m−4.50Post-slide elevation −2.50 m
LP3−0.50Post-slide elevation−0.50Same as post-slide elevation−0.50Same as post-slide elevation
Table 5. Parameters adopted in LS-Rapid simulation of Petobo flowslide.
NoParameters Used in SimulationValueUnitRemark
Zone 4Zone 3Zone 2Zone 1
Parameter for each zone
1Friction angle of landslide mass (ϕi)1552533deg-
2Lateral earth pressure ratio (k) 0.7410.9130.5770.455-k = 1 − sinϕi
3Friction angle at peak of sliding surface (ϕp)5101520deg-
4Cohesion at peak of sliding surface (cp)2345kPa-
5Friction angle during motion at sliding surface (ϕm)2.557.510deg-
6Steady-state shear resistance of sliding surface (τss) 5.25145kPa-
7Rate of excess pore pressure generation (Bss)1.01.01.01.0-For Scenarios 1 and 2
0.00.20.70.0-For Scenario 3
Parameter for the whole areaValues for all zones
8Total unit weight of landslide mass (γt) 20kN/m3-
9Cohesion of landslide mass (ci)0.5kPa-
10Cohesion during motion at sliding surface (cm)0.1kPa-
11Shear displacement at the start of strength reduction (DL)2mm-
12Shear displacement at the start of steady state (DU)100mm-
Triggering factor
13Pore pressure ratio (Ru)0.5-For Scenarios 1 and 2
0.05-For Scenario 3
14EQ a-t motion (amax)0.340gAmplified EW component of 28 September 2018. Palu–Donggala M7.5 earthquake recorded at Balaroa station to a PGA of 0.340 g
Note: “Zone-1” includes LS-1, LF-1, LF-2a and LF-2b; “Zone-2” includes LF-3; “Zone-3” includes LF-4; and “Zone-4” includes DF-2.
Disclaimer/Publisher’s Note: The statements, opinions and data contained in all publications are solely those of the individual author(s) and contributor(s) and not of MDPI and/or the editor(s). MDPI and/or the editor(s) disclaim responsibility for any injury to people or property resulting from any ideas, methods, instructions or products referred to in the content.