Abstract
This study aimed to investigate the effects of the splitter-island on pedestrian safety at roundabouts, considering the interaction between pedestrians and vehicles. Traffic accident statistics have traditionally been used to assess traffic safety. This method has severe limitations when used to investigate the impact of a particular feature of traffic facilities on safety at a microscopic level. Most previous research on surrogate safety measures (SSMs) had, on the other hand, focused on studying the safety of traffic operation conditions. The impact of a particular geometric feature of a roundabout on safety has so far received little attention in the literature. Therefore, we evaluated pedestrian safety in the presence and absence of physical splitter-islands by taking advantage of comparative statistical analysis (SA) and Technique for Order Preference by Similarity to an Ideal Solution (TOPSIS) methods. The Towa-Cho roundabout in Nagano prefecture in Japan was chosen for this study because it allows for five approaches, three with a splitter-island and two without. From 33-hr video data, a total of 343 and 183 potential pedestrian-vehicle conflicts were detected in three crosswalks with splitter-islands and two crosswalks without splitter-islands, respectively. The minimum time-to-collision (TTCmin), post-encroach-time (PET), maximum speed (MaxS), and maximum deceleration-to-safety (DTS) measures were monitored using particle tracking velocimetry (PTV) software for potential pedestrian-vehicle conflicts. It was found that geometric differences were significantly reflected by SSMs, and TTCmin was the most efficient among all. It was concluded that the splitter-island had a better safety performance than the roundabout approach.
1. Introduction
Investigating the impact of a certain feature of traffic facilities on safety can provide a deeper understanding of safety conditions. The geometry of traffic facilities has a direct link to safety and traffic operation. Traditional accident-based analysis has severe limitations when investigating the effect of a certain feature of traffic facilities on safety at a microscopic level [1,2,3]. Nowadays, researchers and practitioners are widely employing a surrogate approach to assess the impact of new traffic designs and investigate safety-related issues by using real-world data extracted from videography and/or traffic safety simulation [4]. Although the SSM approach is an applicable tool to evaluate the effect of specific traffic facilities on safety, most previous research related to SSMs has focused on studying the safety performance and operational efficiency of overall traffic facilities in general [5]. The effect of individual features of traffic facilities on safety has received far less attention in the literature. The U.S. National Cooperative Highway Research Program Reports on Roundabouts: An Information Guide (NCHRP), defined a splitter-island as the key feature of roundabouts that enhances pedestrian safety at crosswalks and traffic operations by providing shelter for pedestrians, assisting control of entry speeds, and guiding traffic onto the roundabout [6]. This raised or painted area in the approach constitutes a separate and opposite traffic direction, providing deflection for entering and/or exiting vehicles, and accessible space for pedestrians crossing at two stages. Therefore, it is anticipated that a splitter-island would have a substantial impact on safety and operational efficiency, and their performance effectiveness could be evaluated by analyzing pedestrian-vehicle conflict behaviour through SSMs.
Following a partial amendment to the Japan Traffic Act in 2012, approximately 140 modern roundabouts were built [7]. Roundabouts are still uncommon in their number due to extensive landscaping requirements, particularly in the central-island and splitter-island alignments, as well as the limited space in densely populated residential, urban, and suburban areas of Japan. However, the reason for converting signalized intersections to roundabouts is to increase mobility during disasters such as earthquakes and tsunamis that occur more frequently in Japan [8]. The absence of a splitter-island is considered a defect in terms of geometry, and some roundabouts in Japan have some kind of such geometric issues. For example, some have unnecessarily wide circulatory roadways, and others lack apron steps [9]. Although the U.S. Guide on roundabouts (NCHRP) recommends that a splitter-island should be designed for all approaches of single roundabouts, the Towa-cha roundabout in Nagano prefecture of Japan does not have splitter-islands on two approaches due to limited space. The Towa-cha roundabout layout is illustrated in Figure 1. The figure shows that the Towa-cha roundabout is constructed with no splitter-islands in crosswalks C-C and D-D on the minor street approaches. Although road traffic is highly regulated, and rules of priority are consistently obeyed in Japan, users claim they still feel confused when crossing these types of traffic facilities [10], and it is even further frustrating to cross roundabouts without splitter-islands.
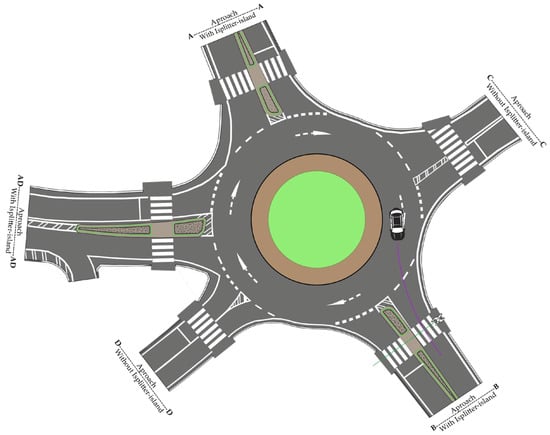
Figure 1.
The Towa-cha roundabout layout.
Consequently, it is not clear how the absence of a physical splitter-island impacts pedestrian safety when crossing a crosswalk. More specifically, the effect of a splitter-island on pedestrian safety has not been comprehensively studied due to limited cases, particularly in the Japanese traffic environment. Therefore, this paper aims to investigate the impact of splitter-island on pedestrian safety at roundabout crosswalks using comparative statistical analysis of SSMs.
Using SSMs, the impact of individual features of a traffic facility was reflected in 67 traffic users conflicts. Pedestrian-vehicle conflict behaviour was evaluated by measuring kinematic parameters such as speed, longitudinal acceleration, and deceleration. Particle tracking velocimetry (PTV) software was used to measure the traffic users’ kinematic parameters at microscopic levels for a more accurate determination of the impact of splitter-island on pedestrian safety. Among SSMs, Post-encroach-time (PET), minimum time to collision (TTCmin), maximum speed (MaxS), and maximum deceleration to safety time (maxDST) are the most applicable to analyze the conflict severity of pedestrian-vehicle conflict crosswalks [1,3,5]. SSMs, including PET, TTCmin, MaxS, and DST, were employed to analyze and compare safety performance between the presence of a splitter-island (PS) and the absence of a splitter-island (AS). Based on the results, a discussion and conclusion are provided.
2. Literature Review
Recent advances in video-based technology data science have made it more feasible to apply SSMs under different traffic scenarios [11]. However, it was understood that many factors, particularly geometric features, influence user behaviour in a conflict at a specific location. SSMs are reliant on traffic conflict behaviour and can reflect the impact of the physical feature of a traffic facility on pedestrian safety. Consequently, an extensive review of relevant and past research works on how SSMs are applied is crucial to this study to further interpret the impact of various factors on pedestrian crossing safety, as covered in this section.
2.1. Impact of Traffic Control Devices, Law Enforcement Programs and Surface Marking on Pedestrian Safety
Several past studies have explored how traffic control devices and road markings affect pedestrians’ crossing decisions. Navarro et al. [4] investigated the safety effectiveness of converting a two-way-stop sign to an all-way-stop sign using an observational before-and-after approach. The authors found that all-way-stop intersections significantly reduced vehicle speed and increased PET time. Another study by Turner et al. [12] had the same result and concluded that active signage systems are quite effective in decreasing vehicle speeds and improving safety performance because of pedestrians’ willingness to give way. Temporary traffic control devices that are featured on pedestrian walking paths should be flexible or energy-absorbing to moderate the injury outcome of a potentially vulnerable crash [13].
Li et al. [14] used SSMs to analyze the impact of law enforcement cameras on pedestrians’ risk perception and driver behaviour at non-signalized crosswalks. The result showed that the cameras had a positive influence on reducing drivers’ aggressiveness and conflict severity. Arhin et al. [15] conducted a statistical comparison to study the impact of different traffic enforcement programs on pedestrian-vehicle safety at four signalized intersections using SSM variables. The result indicated that enforcement measures have a significant impact on pedestrian safety.
Surface markings are often listed amongst meaningful contributors to traffic safety. Suzuki et al. [8] investigated vehicle movement by conducting driving experiments at five Japanese roundabouts; the results showed that coloured surface marking significantly reduces the necessary deceleration rate before crosswalks. The presence of parallelogram-shaped pavement markings were effective in decreasing approaching speeds at areas of intersection, and reduce both the severity and frequency of crashes at pedestrian crosswalks [16]. The safety effectiveness of newly designed crosswalk markings was evaluated by Bian et al. [17]. The results indicate that newly designed crosswalk markings are highly effective and influence drivers’ behaviour more than standard crosswalk markings, no matter where pedestrian-vehicle conflict occurs. Hussain et al. [18] investigated the effect of two traffic control strategies, namely an advanced variable message sign, LED lights, and surface markings, on driver behaviour at high-speed uncontrolled crosswalks. The authors used a driving simulator in the presence or absence of a pedestrian and concluded that both traffic control strategies were effective in reducing vehicle speed. Mukherjee and Mitra [19] studied illegal crossings of 55 signalized intersections in Kolkata city, India. They concluded that illegal crossing is highly associated with defects and/or the absence of surface markings at crosswalks.
2.2. Impact of Distracted and Violating Behaviour of Pedestrians on Safety
Many researchers, for example, [19,20,21], are aware of the negative impact of distracted and violating pedestrian behaviour on safety, and it is believed that both factors increase the risk of pedestrian-vehicle conflict severity at crosswalks.
Distracted behaviour is defined as walking while simultaneously engaged in other activities, such as using technological devices, eating or drinking, and conversing with other people [22]. Thompson et al. [23] randomly recorded the behaviour of 1102 pedestrians crossing at 20 high-risk intersections. The authors observed that nearly one-third (29.8%) of all pedestrians engaged in some kind of distracting activity. Gruden et al. [24] conducted an eye-tracking study to investigate digital distraction and pedestrian reaction time at roundabout crosswalks, and reported an 84% increase in reaction time and slight rise in crossing time when using a phone. In another study, Mohammed [25] studied distracted pedestrian behaviour at 23 midblock crosswalks to determine the relationship between distraction type, road cross-sections, and other in-person factors and pedestrian walking speed. The author found that crossing with headphones increased walking speeds, using other forms of distraction decreased walking speeds, while using cellphones when crossing had no effect.
According to Raoniar and Maurya [26], pedestrian waiting time has a direct effect on reducing the likelihood of an oncoming pedestrian signal violation. The authors observed that red light signals were more often violated by oncoming pedestrians when neighbours were doing the same in Kolkata city, India. Wu et al. [27] developed a real-time safety model to investigate red-light running violations in the city of Nanjing, China. The results showed that pedestrian red-light running is statistically significantly associated with pedestrian volume, the ratio of males to females, the proportion of pedestrians on phones talking, pedestrian waiting time, green ratio, signal type, and length of the crosswalk. Gong et al. [28] reported a significant correlation between pedestrian violation rate and cycle length, crosswalk length, crossing time, vehicle headway, and age category by conducting an observational and questionnaire case study in Lanzhou City, China.
2.3. Impact of Geometric Features on Pedestrian Safety
Most past studies have applied the accident-based/traditional safety approach to investigating the impact of overall traffic facilities on traffic safety. As an alternative, surrogate approaches are commonly applied to study the safety effectiveness of engineering treatments of traffic facilities. There are similar investigations of the effectiveness of geometric features (i.e., road slop, cross-section, deceleration/acceleration lane, pavement friction, lane configuration, road shoulder, etc.) on vehicular traffic safety that apply different surrogate approaches [3,29,30,31,32].
Through SSMs, studies have been conducted to investigate the impact of certain geometric features of traffic facilities on pedestrian safety using SSMs. Candappa et al. [33] investigated the pedestrian safety effectiveness of raised crosswalks at roundabout entrances in a quasi-experimental before-and-after study. Results showed a significant reduction in mean approaching speed, reduction in total crossing time, and increased crossing compliance, and pedestrians perceived a more convenient safety crossing compared to the post-treatment. Chaudhari et al. [34] evaluated pedestrian safety at urban midblock crosswalks using different SSMs (vehicle crossing speed, PET, yielding compliance, and conflict rate). The authors concluded that the severity of crosswalk conflicts depends on the street type and land use, that dangerous conflict occurs more at high-speed multilane road crosswalks due to increasing approaching speed and decreasing PET time, and that the PET time for light vehicles is shorter than for heavy vehicles. Zhu et al. [35] developed a novel agent-based framework for evaluating pedestrian safety at unsignalized crosswalks. The authors targeted mid-block crosswalks with refuge islands for the experimental study using relevant behavioural measures, and a sensitivity analysis of the proposed framework showed that the probability of serious conflicts increased with the longer reaction time of drivers and small safety margin time, when visual obstacles exist near crosswalks. Yoshioka et al. [9] proposed a risk index by combining the invisibility probability and the crash impact as a performance measure for evaluating the impact of geometric features of roundabouts on safety and concluded that larger invisibility probability increased with a smaller entry angle and a decrease in deviation angle was associated with greater crash impact.
In conclusion, previous research has shown that SSMs can address pedestrian safety in different traffic conditions. Only a limited number of past studies have investigated the effect of a specific geometrical feature of traffic facilities on pedestrian safety using SSMs. In addition, internationally recognized standards (e.g., NCHRP) strongly recommended that modern single roundabouts have a splitter-island at all approaches [6]. Furthermore, previous related studies have shown that the absence or defect of crosswalk elements influences pedestrian crossing safety. As a result, it is worthwhile to investigate how pedestrian safety is affected by the lack of a splitter-island at roundabout crosswalks.
3. Material and Methods
3.1. Research Framework
This study aimed to determine the impact of a splitter-island on pedestrian safety using SSMs. SSMs are reliant on the kinematic behaviour of users under traffic conflicts. Figure 2 shows a conceptual framework of the steps followed to carry out this research. The process consists of three main steps: behavioural analysis, SSMs application, and comparative analysis.
- At the beginning of the process, pedestrian-vehicle conflicts were detected by observing video data collected from sites. Then, to accumulate a more accurate result, PTV software was used to extract real-world data on pedestrian and vehicle behaviour under conflict.
- At this step, the SSMs calculations were conducted manually using kinematic variables, i.e., position, velocity, acceleration/deceleration and potential conflict points extracted from pedestrian-vehicle trajectories when they conflicted with each other.
- Finally, impact analysis was carried out by statistically comparing the SSMs for both conditions (AS and PS). The Statistical Analysis (SA) and the Technique for Order of Preference by Similarity to an Ideal Solution (TOPSIS) methods were applied to determine the influence of a splitter-island on pedestrian safety.

Figure 2.
Impact analysis framework: step by step process.
3.2. Site Location and Video Data
For data collection purposes, the Towa-cha roundabout located in Nagano prefecture, Japan was selected as a representative for analysis, its real-world image is shown in Figure 3. This roundabout has five approaches: three with a splitter-island and two without a splitter-island. There is a need to detect a sufficient frequency of pedestrian-vehicle conflicts; hence, the possible number of severe conflicts for safety analysis can be provided by monitoring one site for 30 h [36]. In this study we used video data collected by the Nagoya Institute of Technology on 25th, 26th, and 27th March 2013, during which pedestrian and vehicle behaviour were recorded at crosswalks for 12 h each day (from 6:00 am to 6:00 pm).
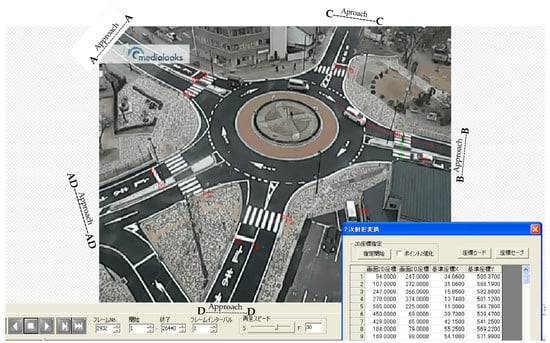
Figure 3.
Calibration process and pedestrian and vehicle trajectory tracking. The left tab shows the homographic transformation between real-world coordinates and image pixel. The bottom ribbon of DippMotionPro 2D software shows the image displaying button, in Japanese.
3.3. Particle Tracking Velocimetry (PTV) Software
The empirical application of SSMs is dependent on a precise understanding of pedestrian and vehicle kinematics behaviour during conflicts. PTV is a great tool for accurately extracting pedestrian and vehicle trajectories from video surveys. We assumed that using TTC would be the most reliable indicator to investigate the effect of the geometry feature on safety. Other SSMs are calculated based on measurements of TTC under all observed scenarios. TTC is a time-continued indicator and reaches a minimum value (TTCmin). Laureshyn, A. [37] explain that TTCmin is the closest point in space and time where users come into contact. It requires the user’s speed profile and real-time estimation of the entire TTC curve. Chen et al. [38] argued that in the case of pedestrian-vehicle conflict, it is very difficult to precisely estimate TTC in practice. That is why our study involved PTV to observe and estimate pedestrian-vehicle conflict behavior in the shortest possible timeframe. The behavior of pedestrians and vehicles was studied using DippMotionPro 2Dsoftware manufactured by Four Assist Company in Tokyo, Japan. This PTV-based software can smoothly measure the X and Y coordinate positions, as well as distance, velocity, deceleration, and acceleration, frame by frame, and record the result in a spreadsheet Excel file. For calibration purposes, the software can overlay the real-world coordinates into the images of videos. Figure 3 shows the calibration process and pedestrian-vehicle trajectory tracking at crosswalk B-B. The interaction between crossing pedestrians and vehicular flow and their conflicting conditions are shown in Figure 4.
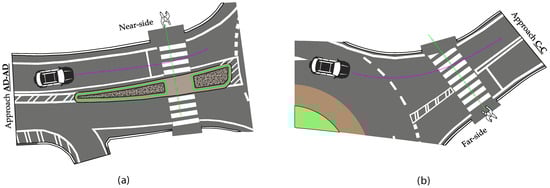
Figure 4.
Traffic direction flow: (a) near-side conflict with entering vehicle in the presence of splitter-island; (b) far-side conflict with exit vehicle in the absence of splitter-island condition.
3.4. Surrogate Safety Measures (SSMs) Application
The concept of SSMs is based on an underlying understanding of what a traffic conflict is. According to Zheng et al. [39], almost all operational traffic conflicts can be classified into two groups: evasive action and proximity (in time and space) to an accident. SSMs are near-accident indicators that track how close road users are in time and space [40]. Since it is hypothesized that SSMs can reflect the impact of the geometric features of traffic facilities on safety, appropriate SSMs need to be selected for vehicle-pedestrian conflict risk estimation. As a result, we attempted to apply SSMs based on the time and space proximity of road users. The following SSMs indicators were used.
3.4.1. Time to Collision (TTC)
TTC is the most important time proximity indicator for traffic safety evaluation. TTC is defined by Hayward [41] as “the time remaining between two road users to collide if they maintain the collision course and continue their present time and space trajectory.” In theory, it is a time-continued indicator that varies along the collision path and eventually reaches its minimum value (zero in case of a collision). TTCmin is a critical moment in the entire collision course during which road users are closest to each other. In our study, the behavior of pedestrians and vehicles was used to measure the whole TTC curve for each conflict, and the TTCmin was used for safety analysis. According to the definition, the concept of TTC is dependent on two pre-conditions: maintaining a collision course and assuming users preserve their speeds. Considering those underlying conditions, the following four types of pedestrian-vehicle conflict scenarios were observed:
- Scenario 1: A pedestrian and vehicle are on a collision course, the driver decelerates to avoid collisions and allows the pedestrian to cross conflict points (Figure 5a).
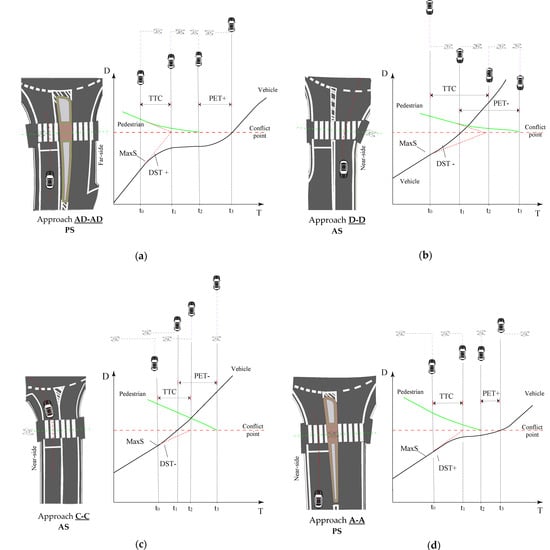 Figure 5. Pedestrian-vehicle conflict diagram. (a) Scenario 1, first pedestrian cross conflict point (collision course event). (b) Scenario 2, first vehicle cross conflict point (collision course event). (c) Scenario 3, first vehicle cross conflict point (no collision course event). (d) Scenario 4, first pedestrian cross conflict point (no collision course event).
 - Scenario 2: The driver accelerates to change the collision course situation into a non-collision course, which causes pedestrian delay for the vehicle to first cross conflict points. As illustrated in Figure 5b, this type of conflict occurs very rarely compared to others.
- Scenario 3: A pedestrian and vehicle are not on a collision course, and the vehicle accelerates to be the first to cross the conflict point, as shown in Figure 5c.
- Scenario 4: The pedestrian and vehicle are not on a collision course, and the vehicle stops or decelerates to allow a pedestrian to cross the conflict point first (Figure 5d).
The main problem with TTC is that it cannot be calculated for all conflict events without a collision course, even if the road users are only a few meters apart [37]. On the other hand, the impact of the splitter-island on safety needs to be studied within a very small margin. Therefore, this study came up with some other indicators to investigate the impact of a splitter-island on safety under the abovementioned scenarios.
3.4.2. Post-Encroachment Time (PET)
SSM is not a time-continued indicator. It has just one value for each user’s conflicts. Allen et al. [42] defined PET as the “time difference between two road users when the first user leaves the conflict area until the next user arrives in the conflict area”. PET can have both values (PET+) and (PET−) according to observing scenarios. The (PET+) situation occurs in the case of the pedestrian first leaving the conflict points, then the vehicle arrives at the conflict points, and when the vehicle first leaves the conflict points, the (PET−) situation occurs.
3.4.3. Deceleration-to-Safety Time (DST)
It is a required action for road users to change their speed to avoid an accident, i.e., to turn a collision course situation into a non-collision course situation [43]. The DST can be observed instantaneously for each moment of a traffic conflict. A positive (DST+) value indicates deceleration, and a negative (DST−) value indicates users accelerating during the traffic conflict. The maximum DST+/DST− value shows traffic users engaged in the highest reaction to avoid safety hazards during traffic conflict.
3.4.4. Maximum Speed (MaxS)
MaxS is the maximum speed of either vehicle throughout the conflict [44]. In the case of pedestrian-vehicle conflict, MaxS is the maximum speed of the conflicting vehicle, which is usually observed just before starting evasive action.
3.5. Comparative Analysis
The impact of a splitter-island on pedestrian safety needs to be compared between the PS and AS, and SSMs were used as comparison criteria. Comparative analysis, within the context of traffic safety, refers to the comparison of two or more policies, plans, designs, safety treatments, or other objects. A statistical comparison study was conducted to identify the influence of splitter-islands on pedestrian safety.
3.5.1. Statistical Analysis (SA)
It is hypothesized that the SSM mean values are statistically significantly different for both the PS and AS. On the other hand, it was also observed that the SSM mean values are normally distributed on a continuous scale. Therefore, the T-test and Analysis of Variance (ANOVA) methods were performed to compare the SSMs data sets for both the PS and AS.
3.5.2. Comprehensive Comparison by TOPSIS
The Technique for Order Preference by Similarity to an Ideal Solution (TOPSIS) is a multi-criteria decision analysis method. Recently, this methodology has been increasingly used for safety programs in the traffic engineering field [17,45,46,47]. This method has the ability to determine premium safety programs among several alternatives by aggregating indicators. Therefore, TOPSIS was applied to compare the PS and AS conditions by combining several SSMs and deciding which one performs better. Six SSM indicators were used as evaluation indices in the four vehicle-pedestrian conflicts scenario. This study assigns the entropy concept to weigh indices objective weights.
In the four scenarios of vehicle-pedestrian conflict, the multiple objective decision matrix of TOPSIS was formed as X = (X)mn (m = 2, n = 6). To simplify the explanation of the result, the SSMs indicators were transformed to work in the same direction. Therefore, () was formed as a new multiple-objective decision matrix. The normalized matrix was then computed using the following Equation:
The SSMs indicators are weighted based on entropy weight methods and the information entropy Hj is computed using Equation (2)
where: ,
The entropy weight was obtained according to Equation (3)
The former matrix Xij* was used to obtain index weights (Wj). These weight values revealed that Six indicators had varied effects on the overall efficiency of the two distinct pedestrian crossing conditions. The weighted normalized matrix was then computed:
Two deal solution vectors (U+ and U−) were computed based on the best and worst indicators of matrix Uij. For the compression SSM indicators of the PS and PS, their distance to the U+ reflected the best distance-vector Di+, and their distance to the U− reflected the worst distance. In the end, the premium degrees (Ci*) of both conditions was scored by Equation (5)
The value ranged between 0 and 1. A higher value of 1 demonstrates better safety performance.
4. Results
The results are described in two sections. First, the influence of a splitter-island on pedestrian safety is identified by comparing SSMs values between different traffic flow directions. The results of this part were found to be very useful in interpreting how to select significantly affected SSMs indicators and build an SSM indicator system for a comprehensive comparison. The impact of the splitter-island on pedestrian safety was also investigated by a two-way analysis of variance and a t-test. The second section highlights the premium degrees of four traffic flow directions under PS and AS conditions.
4.1. Impacts on Pedestrian Safety
Before conducting the two-way analysis of variance (ANOVA) and t-test, the distributions of SSM data (as dependent variables) were checked for normality and homogeneity of variances. Kolmogorov-Smirnov and Shapiro–Wilk tests were used to explore the normality of data, and Levene’s test statistic was conducted to verify the homogeneity of variances. Kolmogorov-Smirnov and Shapiro–Wilk tests revealed that all SSM data were normally distributed. Within all data sets, Levene’s Test was conducted under collision course and non-collision course events. maxDST+ in the case of a no-collision course and MaxS simply amongst the four different types of traffic flow directions were the only data sets showing unequal variances, and results rejected the null hypothesis for homogeneity of variances, maxDST+ (F(3182) = 13.232, p < 0.05) and MaxS (F(3295) = 28.963, p < 0.05).
4.1.1. Collision Course Events
A two-way ANOVA of six SSM indicators was designed based on four types of traffic flow direction with two types of approach. In Table 1, the results show a different trend between collision course and no-collision course events. TTCmin, maxDST+, and MaxS were significantly affected by the type of approach (PS vs. AS) and different traffic flow directions during collision course events, compared to no-collision course events (p < 0.05). It was found that TTCmin was significantly influenced by both traffic flow directions and type of approach (F(3207) = 8.769, p < 0.05; F(1207) = 4.521, p < 0.05). Post-hoc analysis found that PS had significantly higher TTCmin means in all traffic flow directions compared to AS, which means that PS had a safer performance than AS. The one-tailed t-test was used to compare the TTCmin mean values between PS and AS in each traffic flow direction (entry flow, exit flow, far-side, and near-side) assuming that the variances were not the same (unequal variance). The findings revealed that PS had a better TTCmin mean value than AS in each direction, as shown in Table 2 and Figure 6a. Inversely, PET+ did not show a significant difference between PS and AS, except between four traffic flow directions (F(3207) = 11.126, p < 0.05). The different traffic flow direction variables had a substantial impact on the maxDST+ (F(3207) = 12.929, p < 0.05). The t-test revealed that there was a statistically significant difference between the maxDST+ mean values for PS and AS in all traffic directions, except for exiting flow (p = 0.3108). The effect of four traffic flow direction types on MaxS was insignificant (p = 0.500). Meanwhile, as shown in Table 1 and Figure 6a, the types of approaches (p < 0.05) and the interaction of two factors (p = 0.05) had a significant influence. Post-hoc analysis revealed that a splitter-island had significantly reduced MaxS in the entering flow direction in both far-side and near-side conditions. In Table 2, although PS had a significantly higher MaxS mean value than AS in the exiting flow direction, TTCmin showed a higher mean value. Despite having a lower MaxS, entering flow was associated with lower TTCmin and higher PET+ than exiting flow, as shown in Figure 6a,b,d. Figure 6c shows that maxDST+ was higher for entering flow. This may be due to yield signs and stop lines on roundabout approaches that force vehicles to decelerate more and maintain longer PET+ compared to the exiting flow.

Table 1.
The result of the Two-way ANOVA.
Table 2.
Significance test on difference PS Vs AS mean values.
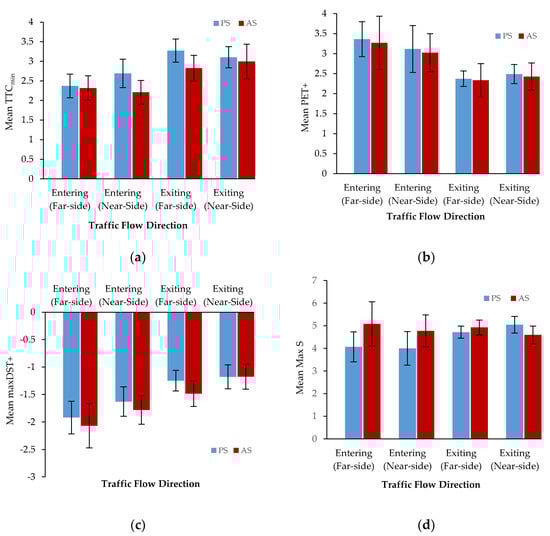
Figure 6.
SSM indicator mean values for pedestrian-vehicle conflict involved in a collision course: (a) minimum time-to-collision (TTCmin); (b) post-encroachment time (PET+); (c) maximum deceleration safety time (maxDST+); (d) maximum Speed (MaxS).
4.1.2. Without Collision Course Events
Since PS and AS were not on a collision course, the two-way ANOVA showed that the SSM indicators did not differ significantly between the two groups. Analysis of the data showed that the relevant SSM indicators were not affected differently by the PS compared to the AS in roundabout approaches where pedestrians and vehicles are not involved in the collision course. The PET+ and PET− were not significantly influenced by two independent variables, as shown in Table 2. The dependent variables were significantly affected by the four different types of traffic flow direction (maxDST+, F(3178) = 41.386, p < 0.05; maxDST, F(3106) = 3.780, p = 0.013; MaxS, F(3291) = 15.566, p < 0.05). These dependent variables were not significantly different in the situation where a splitter-island was absent, as shown in Table 2.
4.2. Result of Comprehensive Comparison by TOPSIS
TOPSIS was applied to comprehensively and objectively integrate the SSMs into a composite indicator, which compared PS and AS in four traffic flow directions, by weighting them based on entropy weight methods. The weights of SSMs are shown in Table 3. The impact of the splitter-island on safety in four directions of pedestrian-vehicle interactions was also quantified, as shown in Figure 7. Scores for PS were higher compared to AS in all traffic flow directions. No matter whether there was far-side or near-side pedestrian-vehicle interaction, the existing traffic flow directions also had a higher score than the entering flow directions. The results show that a splitter-island at the roundabout approach, as the main geometric element, has a substantial effect on safety performance.
Table 3.
Two-way ANOVA results.
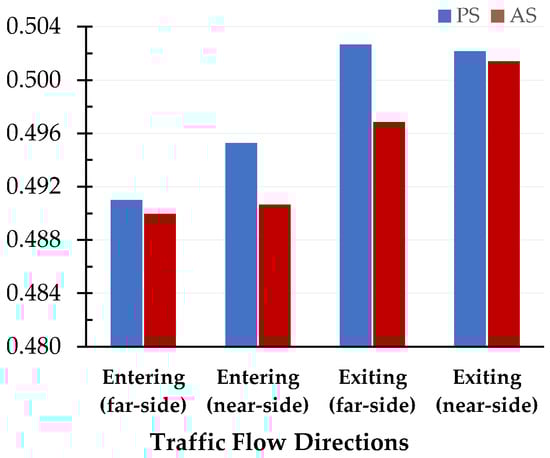
Figure 7.
Scoring of the impact of splitter-island on pedestrian safety.
5. Discussion
From statistical analysis of the results, a splitter-island can significantly reduce the risk of pedestrian-vehicle conflict. It was found that the mean values of SSMs were significantly different between PS and AS, and more obvious under the collision course for all SSMs except PET. Therefore, the result is aligned with the research hypothesis, which assumed that SSMs can reflect the impact of the geometric feature on safety. In previous studies, results showed that crosswalks with proper geometric features, such as surface marking, signage and refuge islands, improve pedestrian safety [15,23,34,35]. This study had a similar result, showing that splitter-islands significantly increase safety at roundabout approaches. In many studies, PET was the main indicator used to evaluate safety performance [1,2,3,4,5]. In contrast, the result of PET in this study did not show a significant difference between PS and AS compared to other indicators (MaxS, TTCmin, and maxDST).
The vehicles’ closeness to a potential threat (crossing pedestrians), represented by TTCmin, was found to be safer when vehicles travelled along a roundabout approach with a splitter-island. TTCmin is zero when the collision course does not exist. From the result of analyzing the SSM data, it can be concluded that TTCmin had a statistically more dynamic way of measuring the impact of geometric features on safety than all SSMs. Therefore, when road users interact on a collision course, their conflicting behaviours are more likely affected by geometric features, as shown in Table 1. Furthermore, when there was an existing splitter island, the required action taken by drivers to safely avoid an accident (represented by maxDST) was relatively higher than when there was no splitter island. The maximum speed (MaxS) of vehicles, which is usually detectable just before beginning evasive action, was higher at the splitter island exit (Table 2). Both TTCmin and MaxS revealed that the approach to the roundabout with a splitter-island was safer. Even though vehicle speed directly affects TTCmin, Figure 6a,d demonstrate that exiting the traffic flow direction has a better safety performance than entering the traffic flow direction.
We conducted a two-way ANOVA to investigate the impact of a splitter-island in four traffic flow directions. As shown in Figure 6, all SSM indicators had better safety performance for PS, compared to when there was no splitter-island in entering and exiting traffic flow directions. In both PS and AS conditions, the exiting traffic flow directions had significantly safer performance via all SSMs indicators, except PET, which may be due to no stop line, vehicles allowed to come closer to pedestrians, and maintaining lower PET+ mean values compared to entering traffic flow direction. Post-hoc analysis results revealed that a splitter-island significantly reduced MaxS in entering flow directions, as shown in Figure 6d. This means that a splitter-island was more likely to arouse the drivers’ awareness to reduce their speed before taking evasive action against crossing pedestrians, and it had a positive impact on safety.
In no-collision course events, the result of the two-way ANOVA also indicated that there was a significant difference between entering traffic flow and exiting traffic flow directions. This may be due to differences in their geometric layout. Entering traffic flow directions had significantly lower MaxS mean values than exiting traffic flow directions. Drivers slow down when arriving at roundabout approaches which causes lower MaxS and higher maxDST- compared to exiting traffic flow direction. On the contrary, ANOVA results showed that drivers speed up more when entering a roundabout than exiting in no-collision events, which causes entering flow directions to have significantly higher maxDST+ means compared to the exiting traffic flow direction. Results revealed that PET+ and PET− were not significantly affected by geometric differences between entering traffic flow and exiting traffic flow directions.
We applied TOPSIS to quantify the differences between PS and As. The TOPSIS result revealed that PS had better safety performance than AS by integrating all four SSMs into one composite indicator. The scores between PS and AS in all four traffic flow directions were different to some extent, as shown in Figure 7 From the result of TOPSIS, it can be concluded that SSMs can reflect the splitter-island impact on pedestrian safety at roundabout approaches.
6. Conclusions
The absence of particular geometric features in existing transportation facilities has increasingly been considered a safety threat to traffic operations and road users, especially in road facilities such as roundabouts. This paper was based on the study of pedestrian-vehicle conflicts and comparative analysis of SSM data between PS and AS, evaluating the safety effectiveness of a splitter-island as a geometric feature of roundabout approaches. The findings study led to the following conclusions:
- Under collision course events, the SSMs more efficiently reflected the geometric difference in safety. Under collision course events, road users behaved differently than they would without a collision course, and the impact of geometric features on users is more obvious in this condition. Additionally, the SSM data pattern showed a different trend. Under collision course events, it was more likely to be normally distributed and has better variance homogeneity.
- Among the SSMs, TTCmin was a more efficient indicator to determine the impact of the geometric feature on safety. Compared with AS, PS had significantly safer performance in all traffic flow directions at roundabouts. The effect of a splitter-island on all SSMs was significant except for PET, and SSM indicators indicated safer performance for the roundabout with a splitter-island. Combining SSMs into one composite indicator also revealed that PS has better safety performance than AS. Therefore, it is concluded that a splitter-island more effectively promotes road user safety at the roundabout approach.
- Compared with entering traffic flow directions, TTCmin and max DST revealed that interactions between pedestrians and vehicles were significantly safer in exiting traffic flow directions, although, they both had significantly higher MaxS. The directional traffic flow had a significant effect on PET under a collision course. It was lower for exiting traffic flow directions, which could be attributed to the lack of a stop line, vehicles being allowed to get closer to pedestrians, and maintaining lower PET+ mean values compared to entering traffic flow directions.
- The surrogate approach, particularly using SSMs, remains a more efficient methodology for investigating the impact of geometric features on safety. It was found that geometric differences in transportation facilities are significantly reflected by SSMs.
This study evaluated the effect of a splitter-island on pedestrian safety at a roundabout during pedestrian-vehicle interactions and road users’ directional flow. As the key contribution, the research showed the methodological value of SSMs for identifying the effect of the geometric features of traffic facilities on safety. In future studies, more research will be needed to investigate the influence of geometric layout on safety. Additional research should be carried out to determine the most effective surrogate measures for quantifying geometric effect on safety. The impact of geometric feature details (e.g., facility dimensions or standards) on safety should also be further investigated using SSMs.
Author Contributions
Software, K.S.; Data curation, K.S.; Methodology, Z.K.; Analysis, Z.K.; Writing—original draft, Z.K.; Writing—review & editing, S.M., O.O. and S.H.M.; Supervision, S.M., K.S. and M.Z.S. All authors have read and agreed to the published version of the manuscript.
Funding
This research received no external funding.
Institutional Review Board Statement
Not applicable.
Informed Consent Statement
Not applicable.
Data Availability Statement
The data presented in this study area available in this article.
Acknowledgments
The authors would like to acknowledge the support of UTM Fundamental Research -PY2022/02136 (Q.J130000.3852.21), Universiti Teknologi Malaysia, and Nagoya Institute of Technology.
Conflicts of Interest
The authors declare no conflict of interest.
References
- Arun, A.; Haque, M.M.; Washington, S.; Sayed, T.; Mannering, F. A systematic review of traffic conflict-based safety measures with a focus on application context. Anal. Methods Accid. Res. 2021, 32, 100–185. [Google Scholar] [CrossRef]
- Astarita, V.; Giofrè, V.P. Trajectory Perturbation in Surrogate Safety Indicators. Transp. Res. 2020, 32, 393–400. [Google Scholar] [CrossRef]
- Mahmud, S.M.; Ferreira, L.; Hoque, M.S.; Tavassoli, A. Using a surrogate safety approach to prioritize hazardous segments in a rural highway in a developing country. IATSS Res. 2020, 44, 132–141. [Google Scholar] [CrossRef]
- Navarro, B.; Miranda-Moreno, L.; Saunier, N.; Labbe, A.; Fu, T. Do stop-signs improve the safety for all road users? A before-after study of stop-controlled intersections using video-based trajectories and surrogate. Accid. Anal. Prev. 2022, 167, 106563. [Google Scholar] [CrossRef]
- De Ceunynck, T. Defining and Applying Surrogate Safety Measures and Behavioral Indicators Through Site-Based Observations. Ph.D. Thesis, Lund University, Lund, Sweden, August 2017. Available online: https://portal.research.lu.se/en/publications/defining-and-applying-surrogate-safety-measures-and-behavioural-i (accessed on 15 March 2023).
- National Cooperative Highway Research Program’s NCHRP Report 672. Roundabouts: An Informational Guide, 2nd ed.; TRB: Washington, DC, USA, 2010. [Google Scholar] [CrossRef]
- Macioszek, E. Roundabout entry capacity calculation-A case study based on roundabouts in Tokyo, Japan, and Tokyo surroundings. Sustainability 2020, 12, 1533. [Google Scholar] [CrossRef]
- Suzuki, K.; Yasuda, S.; Morimoto, K. Analysis on Safety Check Behaviors and Vehicle Movements at Roundabouts in Japan. J. East. Asia Soc. Transp. Stud. 2015, 11, 2227–2240. [Google Scholar] [CrossRef]
- Yoshioka, K.; Nakamura, H.; Shimokawa, S.; Morita, H. Modeling of a novel risk index for evaluating the geometric designs of roundabouts. Accid. Anal. Prev. 2020, 145, 105702. [Google Scholar] [CrossRef]
- Lu, W.; Vandebona, U.; Kiyota, M.; Wang, Y. Estimation of Traffic Delay at an Unconventional Roundabout by Computer Simulation. IEEE. In Proceedings of the 3rd International Conference on Information Systems and Computer Aided Education, Dalian, China, 27–30 September 2020. [Google Scholar] [CrossRef]
- Wang, C.; Dai, Y.; Zhou, W.; Geng, Y. A Vision-Based Video Crash Detection Framework for Mixed Traffic Flow Environment Considering Low-Visibility Condition. J. Adv. Transp. 2020, 20, 1–11. [Google Scholar] [CrossRef]
- Turner, S.; Fitzpatrick, K.; Brewer, M.; Park, E.S. Motorist yielding to pedestrians at unsignalized intersections findings from a national study on improving pedestrian safety. Transp. Res. Rec. 2006, 1982, 1–12. [Google Scholar] [CrossRef]
- Niska, A.; Wenäll, J.; Karlström, J. Crash tests to evaluate the design of temporary traffic control devices for increased safety of cyclists at road works. Accid. Anal. Prev. 2022, 166, 106–529. [Google Scholar] [CrossRef]
- Li, H.; Hu, H.; Zhang, Z.; Ren, G.; Liu, X. Impacts of enforcement cameras on pedestrians’ risk perception and drivers’ behaviors at non-signalized crosswalks. J. Saf. Res. 2022, 81, 313–325. [Google Scholar] [CrossRef]
- Arhin, S.; Jones, P.; Anderson, M.F. Evaluation of Safety Surrogates of Traffic Enforcement at Signalized Intersections. J. Saf. Eng. 2016, 5, 1–7. [Google Scholar]
- Guo, Y.; Liu, P.; Liang, Q.; Wang, W. Effects of parallelogram-shaped pavement markings on vehicle speed and safety of pedestrian crosswalks on urban roads in China. Accid. Anal. Prev. 2016, 95, 438–447. [Google Scholar] [CrossRef]
- Bian, Y.; Liang, K.; Zhao, X.; Li, H.; Yang, L. Evaluating the effectiveness of new-designed crosswalk markings at intersections in China considering vehicle-pedestrian interaction. Accid. Anal. Prev. 2020, 139, 105498. [Google Scholar] [CrossRef]
- Hussain, Q.; Alhajyaseen, W.K.; Pirdavani, A.; Brijs, K.; Shaaban, K.; Brijs, T. Do detection-based warning strategies improve vehicle yielding behavior at uncontrolled midblock crosswalks? Accid. Anal. Prev. 2021, 157, 438–447. [Google Scholar] [CrossRef]
- Mukherjee, D.; Mitra, S. A comprehensive study on factors influencing pedestrian signal violation behaviour: Experience from Kolkata City, India. Saf. Sci. 2020, 124, 438–447. [Google Scholar] [CrossRef]
- Jiang, K.; Ling, F.; Feng, Z.; Ma, C.; Kumfer, W.; Shao, C.; Wang, K. Effects of mobile phone distraction on pedestrians’ crossing behavior and visual attention allocation at a signalized intersection: An outdoor experimental study. Accid. Anal. Prev. 2018, 115, 170–177. [Google Scholar] [CrossRef]
- Campisi, T.; Ištoka Otkovic, I.; Šurdonja, S.; Deluka-Tibljaš, A. Impact of Social and Technological Distraction on Pedestrian Crossing Behaviour: A Case Study in Enna, Sicily. Transp. Res. Procedia 2022, 60, 100–107. [Google Scholar] [CrossRef]
- Violano, P.; Roney, L.; Bechtel, K. The incidence of pedestrian distraction at urban intersections after implementation of a Streets Smarts campaign. Inj. Epidemiol. 2015, 2, 1–7. [Google Scholar] [CrossRef]
- Thompson, L.; FP, R.; Ayyagari, R.; Bel, B. Impact of social and technological distraction on pedestrian crossing behaviour: An observational study. Inj. Prev. 2015, 19, 232–237. [Google Scholar] [CrossRef]
- Gruden, C.; Ištoka Otkovic, I.; Šraml, M. Pedestrian safety at roundabouts: Their crossing and glance behavior in the interaction with vehicular traffic. Accid. Anal. Prev. 2021, 159, 106290. [Google Scholar] [CrossRef] [PubMed]
- Mohammed, H.A. Assessment of distracted pedestrian crossing behavior at midblock crosswalks. ATSS Res. 2021, 45, 584–593. [Google Scholar] [CrossRef]
- Raoniar, R.; Maurya, A.K. Pedestrian red-light violation at signalized intersection crosswalks: Influence of social and non-social factors. Saf. Sci. 2022, 147, 105583. [Google Scholar] [CrossRef]
- Wu, Y.; Guo, Y.; Yin, W. Real time safety model for pedestrian red-light running at signalized intersections in China. Sustainability 2021, 13, 1695. [Google Scholar] [CrossRef]
- Gong, Q.; Xiao, L.; Xu, M. Pedestrian violations crossing behavior at signal intersections: A case study in Anning District of Lanzhou. OP Conf. Ser. Mater. Sci. Eng. 2019, 668, 044006. [Google Scholar] [CrossRef]
- Calvi, A.; Benedetto, A.; De Blasiis, M. A driving simulator study of driver performance on deceleration lanes. Accid. Anal. Prev. 2022, 45, 195–203. [Google Scholar] [CrossRef]
- Ibrahim, M.K.A.; Hamid, H.; Law, T.H.; Wong, S.V. Evaluating the effect of lane width and roadside configurations on speed, lateral position and likelihood of comfortable overtaking in exclusive motorcycle lane. Accid. Anal. Prev. 2018, 111, 63–70. [Google Scholar] [CrossRef]
- Sil, G.; Nama, S.; Maji, A.; Maurya, A.K. Effect of horizontal curve geometry on vehicle speed distribution: A four-lane divided highway study. Transp. Lett. 2019, 12, 713–722. [Google Scholar] [CrossRef]
- Singh Bisht, L.; Tiwari, G. Safety effects of paved shoulder width on a four-lane divided rural highway in India: A matched case-control study. Saf. Sci. 2022, 147, 105606. [Google Scholar] [CrossRef]
- Candappa, N.; Stephan, K.; Fotheringham, N.; Lenné, M.G.; Corben, B. Raised Crosswalks on Entrance to the Roundabout—A Case Study on Effectiveness of Treatment on Pedestrian Safety and Convenience. Traffic Inj. Prev. 2014, 15, 631–639. [Google Scholar] [CrossRef]
- Chaudhari, A.; Gore, N.; Arkatkar, S.; Joshi, G.; Pulugurtha, S. Exploring pedestrian surrogate safety measures by road geometry at midblock crosswalks: A perspective under mixed traffic conditions. IATSS Res. 2021, 45, 87–101. [Google Scholar] [CrossRef]
- Zhu, H.; Almukdad, A.; Iryo-Asano, M.; Alhajyaseen, W.K.; Nakamura, H.; Zhang, X. A novel agent-based framework for evaluating pedestrian safety at unsignalized mid-block crosswalks. Accid. Anal. Prev. 2021, 15, 106–288. [Google Scholar] [CrossRef]
- Hydén, C.; Várhelyi, A. The effects on safety, time consumption and environment of large scale use of roundabouts in an urban area: A case study. Accid. Anal. Prev. 2000, 32, 11–23. [Google Scholar] [CrossRef]
- Laureshyn, A. Application of Automated Video Analysis to Road User Behaviour. Ph.D. Thesis, Lund University, Lund, Sweden, January 2017. Available online: https://portal.research.lu.se/en/publications/application-of-automated-video-analysis-to-road-user-behaviour (accessed on 15 February 2023).
- Chen, P.; Zeng, W.; Yu, G. Assessing right-turning vehicle-pedestrian conflicts at intersections using an integrated microscopic simulation model. Accid. Anal. Prev. 2019, 139, 211–224. [Google Scholar] [CrossRef]
- Zheng, L.; Ismail, K.; Meng, X. Traffic conflict techniques for road safety analysis: Open questions and some insights. Can. J. Civ. Eng. 2014, 41, 633–641. [Google Scholar] [CrossRef]
- Chen, P.; Zeng, W.; Yu, G.; Wang, Y. Surrogate Safety Analysis of Pedestrian-Vehicle Conflict at Intersections Using Unmanned Aerial Vehicle Videos. J. Adv. Transp. 2017, 2017, 5202150. [Google Scholar] [CrossRef]
- Hayward, J.C. Near-Miss Determination Through Use of Scale of Danger. In Proceedings of the 51st Annual Meeting of the Highway Research Board, Washington, DC, USA, 17 January 1972; pp. 24–34. Available online: https://trid.trb.org/view/115323 (accessed on 15 February 2023).
- Allen, B.L.; Shin, B.T.; Cooper, P.J. Analysis of Traffic Conflicts and Collisions; Department of Civil Engineering, McMaster University: Hamilton, ON, Canada, 1978; pp. 67–74. Available online: https://trid.trb.org/view/85806 (accessed on 15 February 2023).
- Hupfer, C. Deceleration to safety time (DST)-a useful figure to evaluate traffic safety. In Proceedings of the 97th Conference on International Cooperation on Theories and Concept in Traffic Safety (ICTCT), Lund, Sweden, 5–7 November 1997; Available online: https://www.ictct.net/conferences/10-lund-1997 (accessed on 15 February 2023).
- Gettman, D.; Pu, L.; Sayed, T.; Shelby, S. Surrogate Safety Assessment Model and Validation: Final Report; Rep. No. FHWA-HRT-08-051 2008; FHWA: Washington, DC, USA, 2008; pp. 20–30. Available online: https://trid.trb.org/view/864039 (accessed on 15 February 2023).
- Rosic, M.; Peši, D.; Kukic, D.; Antic, B.; Božovic, M. Method for selection of optimal road safety composite index with examples from DEA and TOPSIS method. Accid. Anal. Prev. 2017, 98, 277–286. [Google Scholar] [CrossRef]
- Huang, L.; Zhao, X.; Li, Y.; Ma, J.; Yang, L.; Rong, J.; Wang, Y. Optimal design alternatives of advance guide signs of closely spaced exit ramps on urban expressways. Accid. Anal. Prev. 2020, 138, 105465. [Google Scholar] [CrossRef]
- Yu, J.; Wang, L.; Gong, X. Study on the Status Evaluation of Urban Road Intersections Traffic Congestion Base on AHP-TOPSIS Modal. Proc. Soc. Behav. Sci. 2013, 96, 609–616. [Google Scholar] [CrossRef]
Disclaimer/Publisher’s Note: The statements, opinions and data contained in all publications are solely those of the individual author(s) and contributor(s) and not of MDPI and/or the editor(s). MDPI and/or the editor(s) disclaim responsibility for any injury to people or property resulting from any ideas, methods, instructions or products referred to in the content. |
© 2023 by the authors. Licensee MDPI, Basel, Switzerland. This article is an open access article distributed under the terms and conditions of the Creative Commons Attribution (CC BY) license (https://creativecommons.org/licenses/by/4.0/).