Article

Landslide Susceptibility Assessment Using the Analytic Hierarchy Process (AHP): A Case Study of a Construction Site for Photovoltaic Power Generation in Yunxian County, Southwest China

1
Institute of International Rivers and Eco-Security, Yunnan University, Kunming 650500, China
2
School of Earth Sciences, Yunnan University, Kunming 650500, China
3
Yunnan Architecture Engineering Design Company Limited, Kunming 650501, China
*
Author to whom correspondence should be addressed.
Sustainability 2023, 15(6), 5281; https://doi.org/10.3390/su15065281
Submission received: 19 February 2023 / Revised: 6 March 2023 / Accepted: 14 March 2023 / Published: 16 March 2023
(This article belongs to the Special Issue Sustainable Study on Landslide Disasters and Restoration)

Abstract

:
China is actively promoting the construction of clean energy to reach its objective of achieving carbon neutrality. However, engineering constructions in mountainous regions are susceptible to landslide disasters. Therefore, the assessment of landslide disaster susceptibility is indispensable for disaster prevention and risk management in construction projects. In this context, the present study involved conducting a field survey at 42 landslide points in the selected planned site region. According to the geological and geographical conditions of the study region, the existing regulation, and the influencing factors of landslides, the assessment in the field survey was performed based on 11 impact factors, namely, the slope, slope aspect, curvature, relative relief, NDVI, road, river, fault, lithology, the density of the landslide points, and the land-use type. Next, based on their respective influences, these impact factors were further divided into subfactors according to AHP, and the weights of each factor and subfactor were calculated. The GIS tools were employed for linear combination calculation and interval division, and accordingly, a landslide susceptibility zone map was constructed. The ROC curve was adopted to test the partition evaluation results, and the AUC value was determined to be 0.845, which indicated the high accuracy of the partition evaluation results.

1. Introduction

China, as a contribution to the worldwide consensus on mitigating the greenhouse effect and developing a low-carbon economy, has established the objective of “carbon peaking and carbon neutrality”. Photovoltaic power generation is representative of generating energy from renewable resources. The installed capacity and the output of photovoltaic power generation in China have been increasing every year [1]. Particularly due to the limited potential of the new hydropower and coal power establishments in Yunnan Province, photovoltaic power generation is expected to become the main source of electricity generation in Yunnan in the future [2].
Yunnan Province is a typical mountainous region that raises serious geological challenges to engineering constructions, leading to serious economic losses and even casualties. Previous studies on geological disasters in Yunnan Province indicated that geological disasters in Yunnan Province are frequent, among which landslides are the most frequent [3]. The study region is located in Yunxian County, Yunnan Province, China, which is a geological-disaster-prone area in Yunnan Province [4]. According to a survey report released by the local government in 2005, geological disasters caused direct economic losses of CNY 26.65 million (USD 3.86 million) between 1995 and 2005, with 8388 people potentially threatened by geological disasters and assets worth CNY 65.22 million (USD 9.44 million) threatened [5]. Engineering constructions in mountainous regions either lead to or aggravate slope instability due to slope cutting or excavating and filling projects [6]. Based on past studies on a provincial or municipal scale, the proposal of efficient solutions for zones that are susceptible to landslides in the layout of the photovoltaic power project is the research significance of the study. Photovoltaic power generation also involves engineering construction processes, which disturb the slope in the natural state and destroy the original stable state. Therefore, an assessment of the landslide susceptibility of the photovoltaic power project land is significant for facilitating reasonable planning and management of the project.
Landslide susceptibility assessment and zoning indicate the possibility of the occurrence of landslides in a certain region and are, therefore, important tools for disaster prevention and risk management during engineering construction projects [7]. The results are visualized in the form of a susceptibility zone map. In addition, a complete understanding of the causes of landslides is necessary [8]. Certain studies have reported the slope, aspect, curvature, lithology, geological structure, and river as the latent factors associated with a landslide [9]. Other studies have reported that the inducing factors, such as rainfall, erosion, earthquake, and human activities, induce or intensify landslides [10]. In terms of research methodologies, the geographic information system (GIS) is efficient in the management of spatiotemporal data and in obtaining the corresponding output results according to different input data. Consequently, landslide susceptibility zoning and mapping based on GIS have become the focus of several studies [10,11].
In the duration between the initiation of a photovoltaic power generation construction project and the commencement of the construction, the project team usually requires 3–6 months to conduct surveys and for designing and planning. The construction site is usually selected in a mountainous region that is far away from any established township and lacks any historical data related to geological disasters. Therefore, it is necessary to make full use of this period to conduct field surveys and form landslide data. Sufficient field survey and analysis of the geological environment and landslide features in the study region are the necessary conditions to accurately select factors and create susceptibility zoning. With the selection of an appropriate method for analyzing the landslide data in the last few months prior to the commencement of the construction, a landslide susceptibility zone is established, which forms a basis for project planning and risk assessment of the project while also serving as a reference tool for the landslide susceptibility assessment of other similar mountain region engineering construction projects to be undertaken in the future.
The commonly used methods for landslide susceptibility assessment and mapping, which are based on GIS, include qualitative, quantitative, and semi-quantitative methods [12,13,14]. The results of qualitative methods are generally expressed in terms of the risk level or other qualitative descriptions, while the results of quantitative methods are generally expressed as numerical values [15]. The susceptibility assessment method based on expert experience is qualitative and involves assigning relative weights to the different factors causing the landslides according to the opinions of experts. This approach is the most commonly used one in previous engineering projects. The selection of the assessment factors as well as the evaluation of the impact of these factors is based on the professional knowledge of experts [16]. This approach does not require historical data and is, therefore, relatively easy to implement. However, the method based on expert experience is highly subjective and does not guarantee accuracy [17].
The quantitative method involves establishing mathematical models for the association between landslide occurrence and the related factors, such as a frequency ratio [18,19,20], logistic regression [18,19,21], information value model [9], artificial neural networks [18,22], and other methods, which have been used for evaluating the influence of factors and subfactors on landslides. In comparison to the qualitative method, the quantitative method offers higher accuracy, although this accuracy depends on the historical landslide data used for model construction. The quantitative method is suitable for a region with a large range of study regions and detailed historical data on landslides [17,23]. In the quantitative method, the weights are calculated based on the statistical results, which provide relatively higher accuracy compared to the qualitative method.
The semi-quantitative methods include methods based on the combination of the above two methods, such as the analytic hierarchy process (AHP) [24], network analysis (ANP) [25], fuzzy analytic hierarchy process (FAHP) [26], etc. These methods are based on the experience and professional knowledge of the researcher, combined with the efficiency of a mathematical model that evaluates and verifies the consistency of various factors. While having historical landslide data is not necessary for certain semi-quantitative methods, such as the analytic hierarchy process, it nonetheless is useful in improving the consistency and accuracy of the obtained results [27].
The analytic hierarchy process (AHP) method involves decomposing complex problems into multiple simple indicators followed by assigning weights to those indicators according to their relative levels of importance [28,29]. Although AHP was proposed very early, it has been used in the field of engineering and disaster assessment because of its efficiency and simplicity. In recent years, AHP has been applied in flood disaster [30,31], sinkhole disaster [32], and landslide disaster [32] sustainability assessments and other fields. This study expands the application of the AHP method to include hot point and forward position fields. AHP as a semi-quantitative method, as described above, does not require historical landslide data. However, with the help of historical data or field survey data, researchers may analyze the correlation between landslides and factors, select factors accurately, and fill in the judgment matrix.
A complex problem refers to a problem caused due to a variety of factors. In the present study, the occurrence of landslides is a complex natural problem that relies on a variety of factors, such as slope, slope direction, curvature, hydrological characteristics, stratigraphic lithology, and anthropological activities, among others.
Therefore, in the present study, the analytic hierarchy process (AHP) was adopted for the following reasons:
  • The study region in the present research included only 1 township and 15 surrounding villages. The data on the landslide points were obtained from the 6-month-long field survey conducted by the project team, and a total of 42 disaster sites were recorded. The scope of the study region was small, and the samples of the landslide points were inadequate. Therefore, the supplementation and correction of the collected data by experienced experts were necessary.
  • The data on the landslide points in the study region were recorded in the form of points.
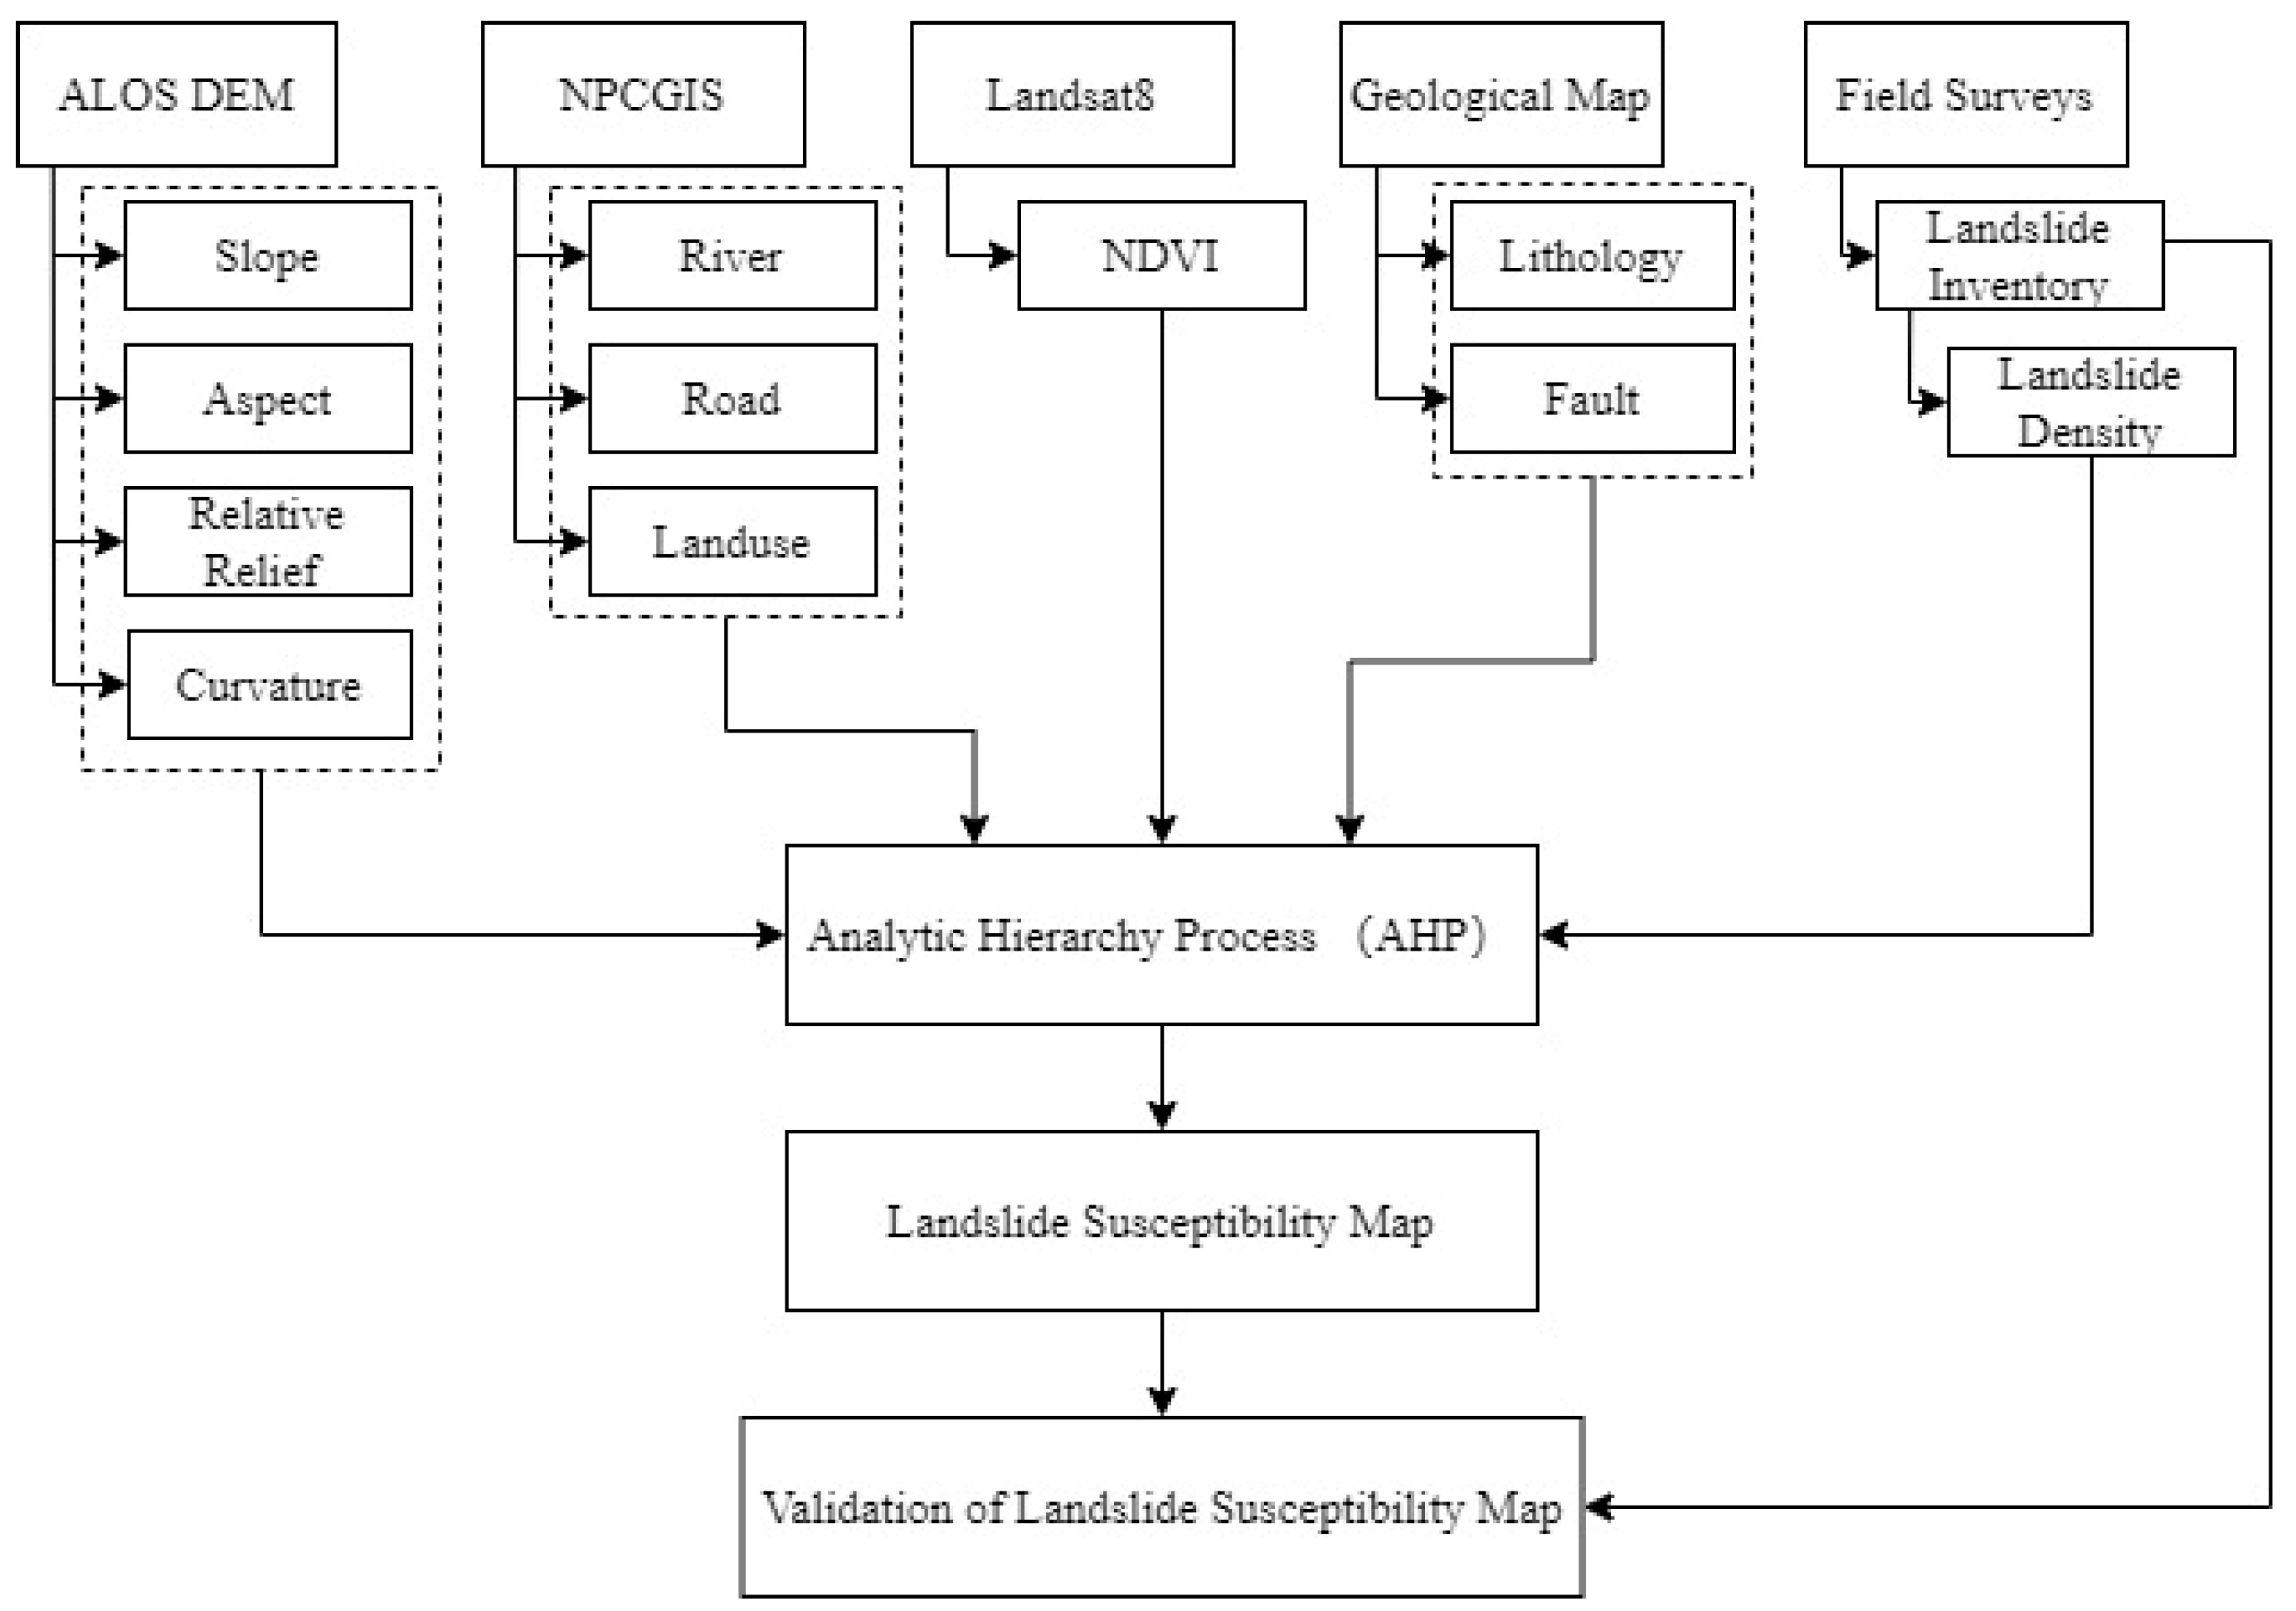
  • Several experts from the project team were involved in the present study, and the analytic hierarchy process (AHP) was adopted to ensure the consistency of the weights assigned by these experts based on their combined experience to prevent any conflict of opinions [33].
  • The use of the analytic hierarchy process ensured an improvement in the evaluation accuracy through weight adjustment.
Among other multi-criteria decision-making methods, the judgment matrix of Fuzzy AHP cannot express the extreme importance among factors. ANP and DEMATEL need to consider the interaction between the level factors of the same layer, so when it is used as a single method, the calculation is too large, and it is difficult to achieve consistency in the team. It is often combined with other methods to maximize its accuracy characteristics. Therefore, although these methods have their advantages, they are not used in this study.

2. Materials and Methods

2.1. Study Region

The study region was the construction site of the West Dachaoshan Photovoltaic Power Station, which is currently under preparation for construction. The site is located in Yunxian County, Lincang City, Yunnan Province, China, and has an expected operating period of 25 years. This site would remain the main power supply source for this region in the future. The project selected in the present study is located in the southwest province of China, which is a typical alpine region with frequent landslides experienced in the rainy season. Table 1 lists the data sources used in the present study.
According to plans, the West Dachaoshan Photovoltaic Power Station would cover a total area of 5.6 km2. However, due to the scattered layout of the photovoltaic array, the north–south crossing distance is large. The main area of the project is located on the top of the mountain and the surrounding slopes. The total investment of the project budget is CNY 1.38 billion, and the installed capacity is 300 MW. According to the strategic and social perspectives, the project would serve as the main source of local power supply for the next 25 years, thereby holding a crucial strategic position in terms of energy.
The study region extends 1–1.5 km in all directions from the main body of the project to the surrounding low valley, spanning an area of 263.92 km2, including the surrounding towns, roads, and other important buildings. The study region is a typical mountainous landform located in southwest China and covers just 7% of the entire county area. However, it contains a variety of buildings and types of surface vegetation. The study region is located between 24°15′6.26″ N, 100°11′27.21″ E and 24°03′26.37″ N, 100°22′57.46″ E, with an elevation range of 1058–2733 m. The highest temperature recorded in the summer season is 38.3 °C, while the lowest temperature of −1.3 °C is recorded in winter. The average annual temperature of the study region is 19.5 °C. The annual average rainfall received in the study region is 972 mm. The rainy season extends from May to October and accounts for 85% of the annual rainfall. Figure 1 depicts the location of the study region and the general layout of the project.

2.2. Geological Setting

The region is covered in micaceous granite with an undulating surface. The Tethys Tectogen was found in the study region, which is characterized by complex and diverse strata and a wide distribution of magmatic rocks [34]. The study region comprises Triassic, Jurassic, and Indosinian strata, with the lithology including limestone, mudstone, granite, rhyolite, and slate, which may be divided into the Huakaizuo group, Xiaodingxi group, and Manghuai group. The topographic geological map of the study region is depicted in Figure 2.

2.3. Landslide Point Data

The field survey team conducted 6 geological disaster investigations within 6 months for data recording in the study region. A total of 42 landslide points were recorded. The landslide data comprised information regarding the location, slope features, scale, triggering factors, nearby anthropological activity, classification, and geology of the mass. Figure 3 depicts the partial landslides in the study region.

2.4. Assessment Factors and Methods
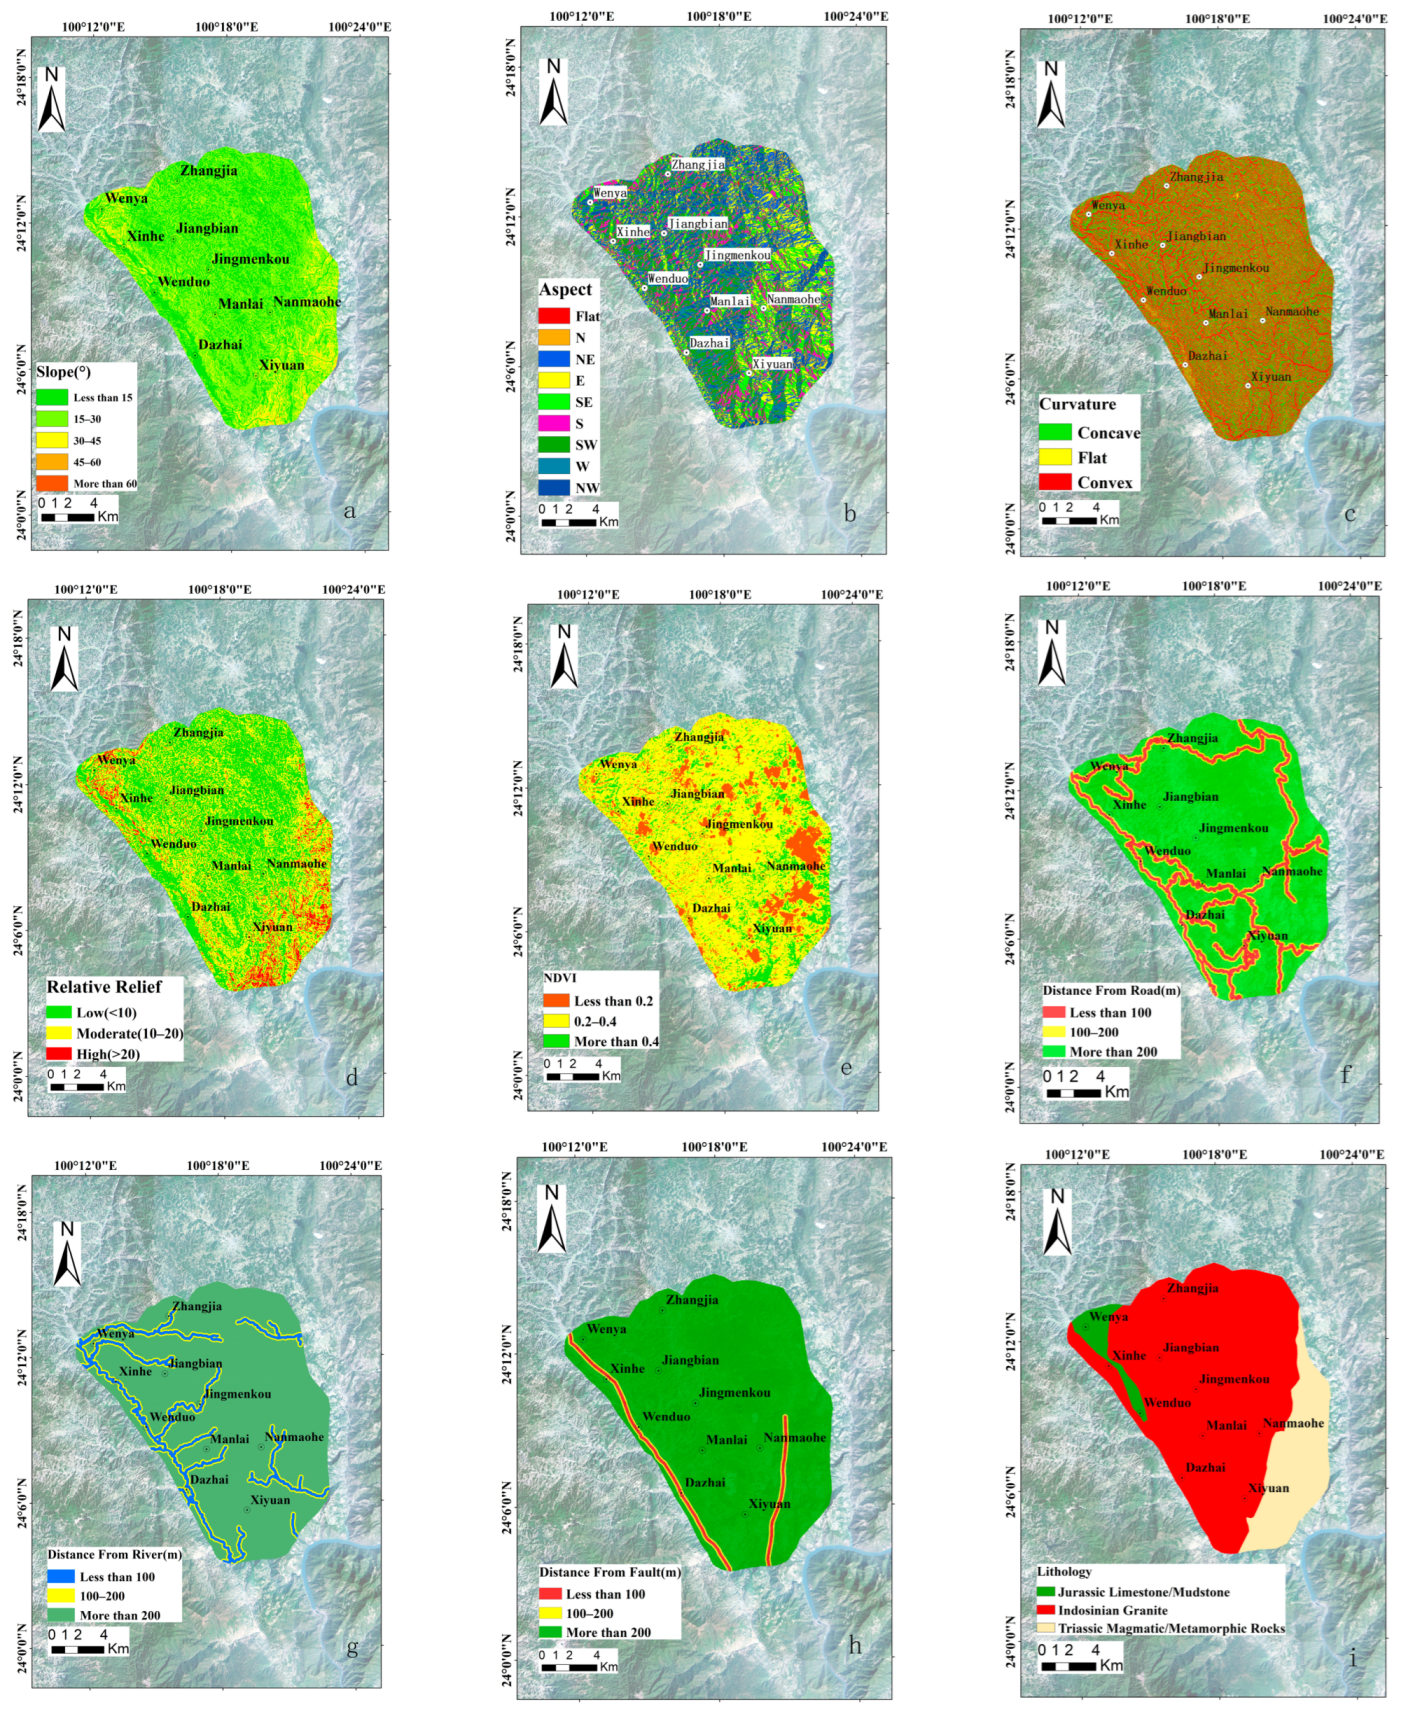
In the present study, the data were obtained from satellite imagery, digital archives, and field surveys. The digital elevation model (DEM) was obtained from ALOS PALSAR, which has a grid size of 12.5 m × 12.5 m. The slope, aspect, curvature, and relative relief were extracted from ALOS DEM. The geology and lithology data were digitized based on the geological maps. A detailed flow chart of the entire process is provided in Figure 4.
The occurrence of a landslide depends on various factors, which may be divided into topographic factors based on the DEM, regional geographic factors, and geological factors. In the present study, rainfall was not selected as an assessment factor as the study region presented little difference in the spatial distribution of rainfall, which was mainly related to the seasons. The density of the landslide points was rather selected as the assessment factor. In the field of engineering, landslide-intensive regions are classified, to the extent possible, into moderate- or high-susceptibility regions. Figure 5 depicts the distribution of the evaluation factors.

2.4.1. Slope

The shear force of the slope influences its own stability [35]. In general, the steeper the slope, the greater the possibility of the occurrence of landslides [36]. The slope in the study region varies significantly, from 0° to 73° at its steepest. A large slope gradient leads to soil instability and accelerates the flow rate of surface runoff. In the present study, the slope gradient was divided into five categories: <15°, 15°–30°, 30°–45°, 45°–60°, and over 60°.

2.4.2. Slope Aspect

Different slope aspects are subject to different intensities and durations of light exposure, which results in differences in the local temperature and climate. These differences then indirectly affect the weathering of the rock mass, soil moisture, and vegetation development [37]. In the present study, the slope aspect was divided into 10 categories: flat, north, northeast, east, southeast, south, southwest, west, and northwest.

2.4.3. Curvature

The curvature is the second derivative of the surface and may be considered the slope of the slope. If the curvature is positive, the slope is convex. If the curvature is negative, the slope is concave. If the curvature is close to 0, the slope is flat. In addition to affecting the characteristics of surface runoff, curvature also affects the stress distribution of the soil surface. In excavation work, a convex surface often requires greater excavation and slope protection work [38]. In the present study, the curvature was divided into three categories: flat (−0.5 to 0.5), concave (<0.5), and convex (>0.5).

2.4.4. Relative Relief

Relative relief reflects the degree of elevation change in a certain region. This parameter affects vegetation development, surface runoff, and other natural conditions in local regions, which indirectly affects landslide development. The relative relief of the study region varies from 0 m to 107 m. Accordingly, in the present study, the relative relief was divided into three categories: low (<10 m), moderate (10–20 m), and high (>20 m).

2.4.5. NDVI

The normalized difference vegetation index (NDVI) represents the growth status and the coverage information of green vegetation. The root development of surface vegetation has a stabilizing effect on the loose soil layer on the surface, while the relatively bare surface vegetation implies that the rock and the soil mass structure are relatively loose and further susceptible to weathering or erosion [39,40]. NDVI is calculated using the following formula:
Normalized difference vegetation index (NDVI) =  ρ n i r ρ r e d ρ n i r + ρ r e d .
Here,  ρ n i r  is specific to band 5 of Landsat 8 and  ρ r e d  is specific to band 4 of Landsat 8.
In the present study, NDVI was divided into three categories: low (<0.2), moderate (0.2–0.4), and high (>0.4).

2.4.6. Distance from the Road

Road disturbance is one of the important causes of landslides [41,42]. When a road is constructed, the cut slope causes disturbance to the natural slope and weakens the stability of the slope foot. In the present study, the distance from the road was divided into three categories: less than 100 m, 100–200 m, and over 200 m.

2.4.7. Distance from the River

The study region belongs to the Lancang River basin, which is formed by the Dazhai River, the Nayu River, and their tributaries. A portion of the study region is a valley landform, with water running in the gullies throughout the year. The flowing water leads to distinct scour and erosion on the bank slope, which destroys the stability of the bank slope [43,44]. In the present study, the distance from the river was divided into three categories: less than 100 m, 100–200 m, and over 200 m.

2.4.8. Distance from the Fault

In the fault zone, the rock mass is broken, which leads to poor integrity and stability [45,46]. In the present study, the distance from the fault was divided into three categories: less than 100 m, 100–200 m, and over 200 m.

2.4.9. Lithology

The lithology reflects the stability and bearing strength of rocks and may be divided into Jurassic limestone, mudstone, Triassic magmatic rock, metamorphic rock, and Indosinian granite. In general, mudstone and karst limestone have a relatively low bearing capacity and greater susceptibility to landslides, while magmatic rock and metamorphic rock have a relatively high bearing capacity. The lithology in the study region was divided into three categories: Indosinian granite, Jurassic limestone/mudstone, and Triassic magmatic/metamorphic rocks.

2.4.10. Landslide Density

The density of landslide points reflects the intensity of the occurrence of landslides within a certain period and could, therefore, reflect, to a certain extent, the degree of instability of the slope and the possibility of subsequent disasters [47]. The landslide density in the study region was divided into four categories: none, low, moderate, and high.

2.4.11. Land-Use Type

A few researchers analyzed the correlation between landslides and land-use type in a county in Yunnan Province and concluded that land-use status was a landslide-inducing factor that should not be ignored. Mountain land reclamation could easily induce landslides, while native forests and artificial forests could effectively prevent and control mountain landslides [48]. In the present study, the land-use types and landslide occurrence characteristics of the study region were similar to the situation mentioned in the previous article, and the land-use types were divided into farmlands, forests, villages, bare land, and intermediate grasslands and shrubland.

2.5. Analytic Hierarchy Process

The analytic hierarchy process (AHP) method is a useful tool for the decomposition of complex problems into simple factors, which may then be divided into the three processes of factor decomposition, comparative judgment, and relative importance, which are usually used later in decision making. In the criterion layer, the target problem is decomposed into multiple factors, which are compared in pairs, and the comparison results are converted into feature vectors and subjected to consistency evaluations. According to the degree of importance, the integers 1–9 are used to indicate the relative importance of the above two factors. Table 2 presents the degree of preference in pairwise comparison.
Next, the matrix is evaluated for consistency. If CR ≤ 0.1, the evaluation matrix is considered to have passed the consistency evaluation. In contrast, if CR > 0.1, the matrix has failed the consistency evaluation, and the scale of the matrix has to be adjusted.
The large quantity eigenvalue formula of the judgment matrix is as follows:
λ m a x = 1 n i = 1 n A W i W i
Here, n denotes the number of factors,  A  represents the judgment matrix,  W  denotes the weight vector calculated using the judgment matrix A, and  W i  denotes the element in the weight vector  W .
Then, the consistency evaluation index formula of the judgment matrix is as follows:
C I = λ m a x n n 1
The random consistency ratio CR formula is as follows:
C R = C I R I
Here,  λ m a x  is the maximum eigenvalue of the matrix, n denotes the order of the judgment matrix, CI denotes the Consistency Index of the judgment matrix, and CR denotes the random consistency ratio.
The random index RI is a fixed value determined based on n, which is based on the results of a large number of data experiments. When the CR value is less than 0.1, the judgment matrix is considered to have passed the consistency evaluation; otherwise, the judgment matrix has to be adjusted until it passes the evaluation. The evaluation results and the weight of each factor in the present study are presented in Table 3. The weights of all subfactors are listed in Table 4.

3. Results

The AHP results were processed using GIS, following which the landslide susceptibility zone map of the study region was constructed. The weights of each factor and subfactor were calculated using the analytic hierarchy process, and the results were evaluated for consistency. All the obtained CR values were below 0.1. The CI value of each subfactor was calculated based on the maximum eigenvalue. Figure 4 presents each of the assessment factors of the landslides.
The weight of each factor is presented in Table 4. The weight of the influence of the land-use type on landslides was the largest, with a value of 0.241. The weight of landslide density was the second largest, with a value of 0.173. The weight of the influence of the slope aspect on the disaster was the minimum, with a value of 0.015.
The statistical analysis of the result data revealed that 60.81% of the area in the study region was located in the 15°–30° slope range, and 66.67% of the landslides occurred in this range. The area in the slope range of 0°–15° accounted for 29.73% of the total area of the study region, and 21.43% of the landslides occurred in this interval. The area with a slope greater than 30° accounted for just 9.46% of the total area of the study region.
It was observed that 28.51%, 21.43%, and 16.67% of the landslides occurred on the slopes of the south, southwest, and west, respectively. According to the field investigation, the weathering of the surface rock and soil mass on the slopes of these three directions was more serious, and the structure was looser.
The flat slope area accounted for 7.11% of the total area of the study region, and no landslides occurred in this area. The area of the concave slope accounted for 45.81% of the total area of the study region and 57.14% of all landslides. The area of the convex slope accounted for 47.08% of the total area of the study region and 42.86% of all landslides. The curvature would affect the characteristics of the surface runoff and the soil stress distribution. The concave slope has a greater probability of leading to rainwater accumulation, while the stress is relatively dispersed. On the other hand, the convex slope does not easily lead to surface runoff accumulation, although the stress would concentrate on the slope angle.
The regions with a relative relief value in the range of 0–10 m, 10–20 m, and >20 m accounted for 42.86%, 52.38%, and 4.76% of all landslides, respectively, and 47.35%, 46.60%, and 6.05% of the total area of the study region, respectively. Relative relief has a certain influence on local vegetation development, and the regions with higher relative relief have a greater susceptibility to landslide occurrence.
The area with the NDVI ranging between 0.2 and 0.4 in the study region constituted 71.0% and accounted for 78.6% of all landslides. The area with an NDVI of less than 0.2 constituted 14.35% and accounted for 14.29% of all landslides. The NDVI of 14.61% of the area was greater than 0.4, which accounted for 7.14% of landslides.
The disturbance of natural slopes caused by road construction is another important factor that leads to a landslide. The closer region, which was within 100 m of the road, accounted for 11.65% of the total area of the study area, although only 19.05% of the landslides occurred in this region. The area that was 100–200 m away from the road accounted for 9.56% of the total area and 7.14% of the landslides. The area more than 200 m away from the road accounted for 78.79% of the total area and 73.81% of the landslides.
River scours and erosion exert a certain degree of influence on slope stability. In the present study, 8.30% of the study region was located within 100 m of the river, and 11.90% of the landslides occurred in this area. The area 100–200 m away from the river accounted for 7.44% of the total area and 9.52% of the landslides. The area more than 200 m away from the river accounted for 84.21% of the total area and 78.57% of the landslides.
The fault zone usually contains broken rock mass and has poor integrity, which exerts a certain influence on landslide occurrence. The area less than 100 m away from a fault accounted for 2.45% of the total area in the study region, and the landslides accounted for 2.38% of the total area. The area 100–200 m away from the fault accounted for 2.46% of the total area, and the landslides accounted for 4.76% of the total area. The area more than 200 m away from the fault accounted for 95.09% of the total area, and the landslides accounted for 92.86% of the total area.
The study region presented a distribution of various lithologic strata, which could be classified according to age and lithology into the following three categories: Triassic magmatic rocks and metamorphic rocks, Jurassic limestone and mudstone, and Indosinian granite. The Indosinian granite accounted for the largest distribution area of 76.72% of the total area and 88.10% of the total landslide occurrence. The distribution area of Jurassic limestone and mudstone was the smallest, accounting for just 4.05% of the total area in the study region, with a landslide occurrence of 7.14%. The area of the Triassic magmatic rocks and metamorphic rocks accounted for 19.23% of the total area in the study region, with a landslide occurrence of 4.65%.
The field survey revealed a specific concentration of the landslide points, with 40.5% of the landslide points having occurred or having a possibility to occur again within 1 km. The areas with high density, moderate density, low density, and no landslides accounted for 2.1%, 9.2%, 22.5%, and 66.2%, respectively, of the total study region.
The boundaries and differences in the land-use types in the study region were distinct. Different land-use types had significant differences in terms of soil fixation due to the different root depths and different vegetation development. In the study region, the forest area accounted for 56.7% of the total area, and the landslide occurrence in this area was 38.1%. The villages and towns accounted for the smallest area of 7.57%, and no landslide occurrence was recorded in this area. Farmlands and bare land exerted the most evident influence on the occurrence of landslides. The farmlands occupied 19.3% of the total area in the study region, and the proportion of landslide occurrence in this area was 35.7%. Bare land accounted for 6.4% of the total area in the study region, with a landslide occurrence of 11.9%. The shrubland and the grasslands were located in the transition zone between the forests, farmlands, and bare land, and in this region, attention was generally paid to landslide prevention and control when constructing the village houses. Therefore, these land-use types exerted a low influence on landslide occurrence.
The landslide susceptibility index (LSI) was calculated by using the following formula [49]:
Landslide susceptibility index (LSI) = 0.037 × Slope + 0.015 × Aspect + 0.022 × Curvature + 0.026 × Relative Relief + 0.059 × NDVI + 0.099 × Distance from the Road + 0.091 × Distance from the River + 0.068 × Distance from the Fault + 0.168 × Lithology + 0.173 × Disaster Density + 0.241 × Land-Use Type
According to the above formula, the landslide susceptibility index value ranged from 0.06885 to 0.41561. The landslide susceptibility zoning in the study region is depicted in Figure 6. The natural breakpoint method was adopted to divide the areas based on their landslide susceptibility into non-susceptible areas (0.0689–0.1378) and susceptible areas (0.1378–0.4156). The susceptible areas were further and similarly divided into low- (0.1378–0.1928), moderate- (0.1928–0.2522), and high- (0.2522–0.4156) susceptibility areas. The results revealed that the landslide susceptibility zone accounted for 49.45% of the total area, and the landslide non-susceptibility zone accounted for 50.55% of the total area in the study region. In the landslide susceptibility zone, the proportion of the high zone was 12.30%, that of the moderate zone was 34.52%, and that of the low zone was 53.18%.

4. Discussion

The classification results were then compared with the assessment factors, which revealed that the region with just one high-weight factor could not be satisfactorily classified as a moderate-susceptibility or high-susceptibility zone. The region with no high-weight factors and the regions with landslide occurrence, despite there being no signs of concentrated occurrence, could not be classified as moderate-susceptibility or high-susceptibility zones. The zones with moderate or high susceptibility were usually characterized by a minimum of two high-weight factors or concentrated landslide occurrences led by a factor.
In terms of susceptibility distribution, the moderate-susceptibility and high-susceptibility zones were mainly distributed in the region to the west of the study region and were overlapped by faults, rivers, and roads, as well as central high-altitude farmlands and bare land. These areas exhibited the characteristics of a variety of factors overlapping and also a concentration of landslide occurrences. The above results and the distribution characteristics of susceptible zoning are consistent with the previously reported cases in the field of engineering and the experience of the team experts.
With regard to the photovoltaic array construction land, 20.82% of the area was located in the high-susceptibility zone, 30.40% of the area was located in the moderate-susceptibility zone, 18.39% of the area was located in the low-susceptibility zone, and 30.39% of the area was located in the non-susceptible zone. Among these, the areas with moderate and high susceptibility were mainly distributed in the central region of bare land and farmland distribution. In order to prevent encroachment on the forestland, the land types were mainly classified as farmlands and bare land, although this would also imply that the site selection coincided highly with the moderate- and high-susceptibility areas, and over half of the construction land area was distributed in the moderate- and high-susceptibility zones. Therefore, it is recommended to pay particular attention to the prevention and control of landslide occurrences in these moderate- and high-susceptibility areas.
The receiver operating characteristic (ROC) curve was used for the verification of the attained results. In the ROC curve, the area under the curve (AUC) represents the accuracy of the classification model, and the value of AUC represents the accuracy of the prone model in predicting whether the landslide would occur [50]. At AUC = 1.0, the classification model is considered a perfect classification method under ideal conditions. At AUC = 0.5–1.0, the classification model is considered a reasonable model superior to random classification; the closer the value is to 1.0, the more accurate the classification is considered to be [51,52]. In the present study, the AUC of the classification model was 0.845 for the study region, which indicated high accuracy of the assessment results. The generated ROC curve is depicted in Figure 7. The verification results revealed that using the analytic hierarchy process (AHP) and selecting accurate assessment factors allowed for an effective combination of the landslide data and expert experience for obtaining accurate results. This method is, therefore, suitable for engineering constructions in mountainous regions, which are usually small in scope, scattered in terms of the engineering layout, and lack historical landslide records. In such kinds of projects, the landslide development situation could be obtained through field surveys for a certain period, although the sample size remains inadequate to ensure the accuracy of quantitative methods. In such a case, the analytic hierarchy process (AHP) would be an appropriate method to consider and would serve as a reference scheme for the landslide susceptibility evaluation of similar projects. In comparison to the qualitative method, the analytic hierarchy process would produce results in the form of numerical values, which would contribute to the accuracy of the evaluation results.
The above results show that AHP, as a research focus, is suitable for the landslide susceptibility evaluation of construction sites. The above discussion is made on the basis that this study has a field survey as the weight of AHP calculation. In a real situation, there is no guarantee that historical or landslide data will be available. Without samples, ROC cannot be created to validate. According to the comparative studies by other researchers, AHP is not the best way to pursue accuracy when there are sufficient historical or study data, and researchers tend to use quantitative methods [53,54]. Even if they are available, they may not be sufficient. Under such conditions, AHP may be the team’s choice between efficiency and accuracy.

5. Conclusions

The study area in this study is a high-susceptibility landslide area, so it is necessary to carry out landslide susceptibility assessments when planning and building large-scale engineering projects. After a 6-month field survey, 42 landslide points were recorded, 11 influence factors were selected as assessment factors, and the weight of each factor and subfactor was determined by the analytic hierarchy process (AHP). The main conclusions are as follows:
(1)
The analytic hierarchy process (AHP) can be well applied to the evaluation and zoning mapping of landslide susceptibility. The results show that 23.16% of the study area is located in moderate-susceptibility and high-susceptibility areas, and 69.05% of landslides occur in moderate-susceptibility and high-susceptibility areas. At the same time, 51.22% of the construction land is distributed in moderate-susceptibility and high-susceptibility areas. Special attention should be paid to the protection of geological landslides during construction and operation.
(2)
By comparing factors, it is found that the presence of a factor with high weight or factors without high weight is not enough for areas with occasional landslides to be classified as moderate- or high-susceptibility zones. The characteristics of the moderate- and high-susceptibility zones show that two or more factors with high weight and their influence areas overlap, usually accompanied by intensive landslide occurrence.
(3)
The ROC curve verified that the susceptibility assessment results based on AHP are accurate, whose accuracy was 0.845. The research results depend on the selected assessment factors and their weights. Appropriate adjustment of the selected factors and their weights can improve the accuracy. The results of this study can provide a decision-making basis for the design, construction, and geological disaster prevention teams or risk engineers involved in the construction and operation of photovoltaic projects, as well as a method reference for the landslide susceptibility evaluation of similar mountain engineering construction projects in the future.

Author Contributions

Conceptualization, J.Z.; Software, J.Z. validation S.T.; investigation, J.Z., S.T., J.L., J.X., C.W. and H.Y.; resources, J.L.; data curation, J.L writing—original draft preparation, J.Z.; writing—review and editing, S.T. visualization, J.X. All authors have read and agreed to the published version of the manuscript.

Funding

This research was funded by the Science and Technology Innovation Team Program (no. YNEDUSTIT202202), Education Department of Yunnan Province.

Institutional Review Board Statement

Not applicable.

Informed Consent Statement

Not applicable.

Data Availability Statement

Not applicable.

Conflicts of Interest

The authors declare no conflict of interest.

References

  1. China-Electricity, C. Report on Analysis and Forecast of Power Supply and Demand in China in 2021–2022. 2022. Available online: https://cec.org.cn/detail/index.html?3-293398 (accessed on 5 March 2023).
  2. Tao, Y.; Wu, Y.; Wu, M.; Luo, X.; He, F.; Gao, R.; Zhang, L. Multi-criteria decision making for comprehensive benefits assessment of photovoltaic poverty alleviation project under sustainability perspective: A case study in Yunnan, China. J. Clean. Prod. 2022, 346, 131175. [Google Scholar] [CrossRef]
  3. Yang, Y.; Yan, X.; Wang, X. The Characteristics and Formation of Geological Hazards in Yunnan Province. J. Catastrophol. 2021, 36, 131–139. [Google Scholar]
  4. Hongbin, Z. Characteristics and Hazards of Mountainous Geological Hazards in Yunnan Province. Master’s Thesis, Kunming University of Science and Technology, Kunming, China, 2005. Available online: https://kns.cnki.net/kcms2/article/abstract?v=u1RXSVo1P2b3QvNiAHcZFf4bZrl4kaSmhfCs-2p6ik68DTE9BWvMNZw84JkfKb-Gt4YgUqTDajpfK4RLrdfEXJDrYhj2WWAo7E24ud5j2gUj4LT2pgLh1A==&uniplatform=NZKPT&language=CHS (accessed on 4 March 2023).
  5. Hongwu, Z. Geological Disaster Investigation and Regionalization Report in Yunxian County, Yunnan Province; National Geological Archives: Beijing, China, 2005; Available online: https://www.ngac.cn/dzzlfw_sjgl/d2d/dse/category/detail.do?method=cdetail&_id=102_122472&tableCode=ty_qgg_edmk_t_ajxx&categoryCode=dzzlk (accessed on 5 March 2023).
  6. Pradhan, S.; Toll, D.G.; Rosser, N.J.; Brain, M.J. An investigation of the combined effect of rainfall and road cut on landsliding. Eng. Geol. 2022, 307, 106787. [Google Scholar] [CrossRef]
  7. Fayaz, M.; Meraj, G.; Khader, S.A.; Farooq, M. ARIMA and SPSS statistics based assessment of landslide occurrence in western Himalayas. Environ. Chall. 2022, 9, 100624. [Google Scholar] [CrossRef]
  8. Carrara, A.; Pike, R.J. GIS technology and models for assessing landslide hazard and risk. Geomorphology 2008, 94, 257–260. [Google Scholar] [CrossRef]
  9. Lin, J.; Chen, W.; Qi, X.; Hou, H. Risk assessment and its influencing factors analysis of geological hazards in typical mountain environment. J. Clean. Prod. 2021, 309, 127077. [Google Scholar] [CrossRef]
  10. Ma, C.; Wang, Y.; Hu, K.; Du, C.; Yang, W. Rainfall intensity–duration threshold and erosion competence of debris flows in four areas affected by the 2008 Wenchuan earthquake. Geomorphology 2017, 282, 85–95. [Google Scholar] [CrossRef]
  11. Bragagnolo, L.; da Silva, R.V.; Grzybowski, J.M.V. Landslide susceptibility mapping with r.landslide: A free open-source GIS-integrated tool based on Artificial Neural Networks. Environ. Model. Softw. 2020, 123, 104565. [Google Scholar] [CrossRef]
  12. Tan, Q.; Bai, M.; Zhou, P.; Hu, J.; Qin, X. Geological hazard risk assessment of line landslide based on remotely sensed data and GIS. Measurement 2021, 169, 108370. [Google Scholar] [CrossRef]
  13. Bera, S.; Guru, B.; Oommen, T. Indicator-based approach for assigning physical vulnerability of the houses to landslide hazard in the Himalayan region of India. Int. J. Disaster Risk Reduct. 2020, 50, 101891. [Google Scholar] [CrossRef]
  14. Zou, Q.; Jiang, H.; Cui, P.; Zhou, B.; Jiang, Y.; Qin, M.; Liu, Y.; Li, C. A new approach to assess landslide susceptibility based on slope failure mechanisms. Catena 2021, 204, 105388. [Google Scholar] [CrossRef]
  15. Reichenbach, P.; Rossi, M.; Malamud, B.D.; Mihir, M.; Guzzetti, F. A review of statistically-based landslide susceptibility models. Earth-Sci. Rev. 2018, 180, 60–91. [Google Scholar] [CrossRef]
  16. Barredo, J.; Benavides, A.; Hervás, J.; van Westen, C.J. Comparing heuristic landslide hazard assessment techniques using GIS in the Tirajana basin, Gran Canaria Island, Spain. Int. J. Appl. Earth Obs. Geoinf. 2000, 2, 9–23. [Google Scholar] [CrossRef]
  17. Grabowski, D.; Laskowicz, I.; Małka, A.; Rubinkiewicz, J. Geoenvironmental conditioning of landsliding in river valleys of lowland regions and its significance in landslide susceptibility assessment: A case study in the Lower Vistula Valley, Northern Poland. Geomorphology 2022, 419, 108490. [Google Scholar] [CrossRef]
  18. Yilmaz, I. Landslide susceptibility mapping using frequency ratio, logistic regression, artificial neural networks and their comparison: A case study from Kat landslides (Tokat—Turkey). Comput. Geosci. 2009, 35, 1125–1138. [Google Scholar] [CrossRef]
  19. Pradhan, B.; Lee, S. Landslide susceptibility assessment and factor effect analysis: Backpropagation artificial neural networks and their comparison with frequency ratio and bivariate logistic regression modelling. Environ. Model. Softw. 2010, 25, 747–759. [Google Scholar] [CrossRef]
  20. Khan, H.; Shafique, M.; Khan, M.A.; Bacha, M.A.; Shah, S.U.; Calligaris, C. Landslide susceptibility assessment using Frequency Ratio, a case study of northern Pakistan. Egypt. J. Remote Sens. Space Sci. 2019, 22, 11–24. [Google Scholar] [CrossRef]
  21. Goyes-Peñafiel, P.; Hernandez-Rojas, A. Landslide susceptibility index based on the integration of logistic regression and weights of evidence: A case study in Popayan, Colombia. Eng. Geol. 2021, 280, 105958. [Google Scholar] [CrossRef]
  22. Zhao, Z.; He, Y.; Yao, S.; Yang, W.; Wang, W.; Zhang, L.; Sun, Q. A comparative study of different neural network models for landslide susceptibility mapping. Adv. Space Res. 2022, 70, 383–401. [Google Scholar] [CrossRef]
  23. Alsabhan, A.H.; Singh, K.; Sharma, A.; Alam, S.; Pandey, D.D.; Rahman, S.A.S.; Khursheed, A.; Munshi, F.M. Landslide susceptibility assessment in the Himalayan range based along Kasauli–Parwanoo road corridor using weight of evidence, information value, and frequency ratio. J. King Saud Univ.-Sci. 2022, 34, 101759. [Google Scholar] [CrossRef]
  24. Sonker, I.; Tripathi, J.N.; Singh, A.K. Landslide susceptibility zonation using geospatial technique and analytical hierarchy process in Sikkim Himalaya. Quat. Sci. Adv. 2021, 4, 100039. [Google Scholar] [CrossRef]
  25. Abedi Gheshlaghi, H.; Feizizadeh, B. An integrated approach of analytical network process and fuzzy based spatial decision making systems applied to landslide risk mapping. J. Afr. Earth Sci. 2017, 133, 15–24. [Google Scholar] [CrossRef]
  26. Ali, S.A.; Parvin, F.; Vojteková, J.; Costache, R.; Linh, N.T.T.; Pham, Q.B.; Vojtek, M.; Gigović, L.; Ahmad, A.; Ghorbani, M.A. GIS-based landslide susceptibility modeling: A comparison between fuzzy multi-criteria and machine learning algorithms. Geosci. Front. 2021, 12, 857–876. [Google Scholar] [CrossRef]
  27. Panchal, S.; Shrivastava, A.K. A Comparative Study of Frequency Ratio, Shannon’s Entropy and Analytic Hierarchy Process (AHP) Models for Landslide Susceptibility Assessment. ISPRS Int. J. Geo-Inf. 2021, 10, 603. [Google Scholar] [CrossRef]
  28. Mandal, B.; Mandal, S. Analytical hierarchy process (AHP) based landslide susceptibility mapping of Lish river basin of eastern Darjeeling Himalaya, India. Adv. Space Res. 2018, 62, 3114–3132. [Google Scholar] [CrossRef]
  29. Kayastha, P.; Dhital, M.R.; De Smedt, F. Application of the analytical hierarchy process (AHP) for landslide susceptibility mapping: A case study from the Tinau watershed, west Nepal. Comput. Geosci. 2013, 52, 398–408. [Google Scholar] [CrossRef]
  30. Nsangou, D.; Kpoumié, A.; Mfonka, Z.; Ngouh, A.N.; Fossi, D.H.; Jourdan, C.; Mbele, H.Z.; Mouncherou, O.F.; Vandervaere, J.-P.; Ngoupayou, J.R.N. Urban flood susceptibility modelling using AHP and GIS approach: Case of the Mfoundi watershed at Yaoundé in the South-Cameroon plateau. Sci. Afr. 2022, 15, e01043. [Google Scholar] [CrossRef]
  31. Das, S. Flood susceptibility mapping of the Western Ghat coastal belt using multi-source geospatial data and analytical hierarchy process (AHP). Remote Sens. Appl. Soc. Environ. 2020, 20, 100379. [Google Scholar] [CrossRef]
  32. Taheri, K.; Gutiérrez, F.; Mohseni, H.; Raeisi, E.; Taheri, M. Sinkhole susceptibility mapping using the analytical hierarchy process (AHP) and magnitude–frequency relationships: A case study in Hamadan province, Iran. Geomorphology 2015, 234, 64–79. [Google Scholar] [CrossRef]
  33. Saaty, R.W. The analytic hierarchy process—What it is and how it is used. Math. Model. 1987, 9, 161–176. [Google Scholar] [CrossRef] [Green Version]
  34. Cong, F.; Wu, F.-Y.; Li, W.-C.; Mou, C.-L.; Huang, X.-M.; Wang, B.-D.; Hu, F.-Y.; Peng, Z.-M. Origin of the Triassic Lincang granites in the southeastern Tibetan Plateau: Crystallization from crystal mush. Lithos 2020, 360–361, 105452. [Google Scholar] [CrossRef]
  35. Hewitt, K.; Clague, J.J.; Orwin, J.F. Legacies of catastrophic rock slope failures in mountain landscapes. Earth-Sci. Rev. 2008, 87, 1–38. [Google Scholar] [CrossRef]
  36. Raghuvanshi, T.K.; Ibrahim, J.; Ayalew, D. Slope stability susceptibility evaluation parameter (SSEP) rating scheme—An approach for landslide hazard zonation. J. Afr. Earth Sci. 2014, 99, 595–612. [Google Scholar] [CrossRef]
  37. Kafle, L.; Xu, W.-J.; Zeng, S.-Y.; Nagel, T. A numerical investigation of slope stability influenced by the combined effects of reservoir water level fluctuations and precipitation: A case study of the Bianjiazhai landslide in China. Eng. Geol. 2022, 297, 106508. [Google Scholar] [CrossRef]
  38. Tang, Y.; Feng, F.; Guo, Z.; Feng, W.; Li, Z.; Wang, J.; Sun, Q.; Ma, H.; Li, Y. Integrating principal component analysis with statistically-based models for analysis of causal factors and landslide susceptibility mapping: A comparative study from the loess plateau area in Shanxi (China). J. Clean. Prod. 2020, 277, 124159. [Google Scholar] [CrossRef]
  39. Tao, R. Risk Assessment of Geological Hazard in Pingshan County Based on GIS 2022; Hebei GEO University: Shijiazhuang, China, 2022. [Google Scholar] [CrossRef]
  40. Khaliq, A.H.; Basharat, M.; Riaz, M.T.; Riaz, M.T.; Wani, S.; Al-Ansari, N.; Le, L.B.; Linh, N.T.T. Spatiotemporal landslide susceptibility mapping using machine learning models: A case study from district Hattian Bala, NW Himalaya, Pakistan. Ain Shams Eng. J. 2023, 14, 101907. [Google Scholar] [CrossRef]
  41. Zhang, W.; Chen, W.; Ye, F.; Wang, S. Study of the distribution rules of landslides of Bailong River basin in Gansu Province. J. Eng. Geol. 2016, 24, 1135–1143. [Google Scholar]
  42. He, X.; Liao, X.; Zhang, L.; Zeng, Q. Clustering of landslide causal factors and road Engineering disturbance effect analysis in Bailong River basin. J. Eng. Geol. 2022, 30, 672–687. [Google Scholar] [CrossRef]
  43. Lingang, L. Study on the Mechanism of Bank Slope Instability Considering River Scouring 2019. Master’s Thesis, Chongqing Jiaotong University, Chongqing, China, 2019. [Google Scholar] [CrossRef]
  44. Lo, P.-C.; Lo, W.; Chiu, Y.-C.; Wang, T.-T. Movement characteristics of a creeping slope influenced by river erosion and aggradation: Study of Xinwulü River in southeastern Taiwan. Eng. Geol. 2021, 295, 106443. [Google Scholar] [CrossRef]
  45. Yin, Y.; Huang, B.; Wang, W.; Wei, Y.; Ma, X.; Ma, F.; Zhao, C. Reservoir-induced landslides and risk control in Three Gorges Project on Yangtze River, China. J. Rock Mech. Geotech. Eng. 2016, 8, 577–595. [Google Scholar] [CrossRef] [Green Version]
  46. Liu, Y.; Li, H.; Zheng, H.; Tan, F. Research progress and prospect of the relationship among active tectonics, earthquakes and geological disasters in China. J. Nat. Disasters 2022, 31, 1–14. [Google Scholar] [CrossRef]
  47. Florsheim, J.L.; Nichols, A. Landslide area probability density function statistics to assess historical landslide magnitude and frequency in coastal California. Catena 2013, 109, 129–138. [Google Scholar] [CrossRef]
  48. Wei, S.; Luan, Q.; Hunag, C.; Gu, X. Review and prospects on researches on soft measures of land-use planning in prevention and control of geological disasters. J. Nat. Disasters 2014, 23, 159–165. [Google Scholar] [CrossRef]
  49. Panchal, S.; Shrivastava, A.K. Landslide hazard assessment using analytic hierarchy process (AHP): A case study of National Highway 5 in India. Ain Shams Eng. J. 2022, 13, 101626. [Google Scholar] [CrossRef]
  50. Nie, X.; Yang, J. The determination of afm abrasive flow boundary conditions. Mach. Manuf. 2001, 33, 9–11. Available online: https://www.scopus.com/inward/record.uri?eid=2-s2.0-84928401405&partnerID=40&md5=7fd4dd4c67a8a430e3ac0e43253c38bc (accessed on 6 February 2023).
  51. El Jazouli, A.; Barakat, A.; Khellouk, R.; Rais, J.; El Baghdadi, M. Remote sensing and GIS techniques for prediction of land use land cover change effects on soil erosion in the high basin of the Oum Er Rbia River (Morocco). Remote Sens. Appl. Soc. Environ. 2019, 13, 361–374. [Google Scholar] [CrossRef]
  52. Patriche, C.V.; Pirnau, R.; Grozavu, A.; Rosca, B. A Comparative Analysis of Binary Logistic Regression and Analytical Hierarchy Process for Landslide Susceptibility Assessment in the Dobrov River Basin, Romania. Pedosphere 2016, 26, 335–350. [Google Scholar] [CrossRef]
  53. Abedini, M.; Ghasemyan, B.; Mogaddam, M.H.R. Landslide susceptibility mapping in Bijar city, Kurdistan Province, Iran: A comparative study by logistic regression and AHP models. Environ. Earth Sci. 2017, 76, 14. [Google Scholar] [CrossRef]
  54. Yu, C.L.; Chen, J. Application of a GIS-Based Slope Unit Method for Landslide Susceptibility Mapping in Helong City: Comparative Assessment of ICM, AHP, and RF Model. Symmetry-Basel 2020, 12, 1848. [Google Scholar] [CrossRef]
Figure 1. The study region.
Sustainability 15 05281 g001
Figure 2. The topographic geological map of the study region.
Sustainability 15 05281 g002
Figure 3. The landslides in the study region ((a): Long: 100°19′55.65″ E, Lat: 24°06′04.38″; (b) Long: 100°19′34.83″, Lat: 24°06′50.68″).
Sustainability 15 05281 g003
Figure 4. The flow chart of the method followed.
Sustainability 15 05281 g004
Figure 5. Assessment factors of landslides. (a) Slope, (b) aspect, (c) curvature, (d) relative relief, (e) NDVI, (f) distance from the road, (g) distance from the river, (h) distance from the fault, (i) lithology, (j) landslide density, (k) land-use type.
Sustainability 15 05281 g005aSustainability 15 05281 g005b
Figure 6. The landslide susceptibility zone map.
Sustainability 15 05281 g006
Figure 7. The ROC curve generated for the zoning.
Sustainability 15 05281 g007
Table 1. The data sources used in the present study.
Extracted DataScaleSource
Landslide data Field Survey
Topographic elements (aspect, slope, curvature, relative relief) ALOS-Digital Elevation Model
NDVI Landsat 8
Geographical elements (roads, rivers, land-use type)1:10,000National Platform for Common Geospatial Information Services (NPCGIS)
Geological elements (fault, stratigraphic lithology)1:200,000Geological map for Yunxian County
Table 2. The scale of the judgment matrix.
Scale
Preference
DefinitionExplanation
1Equally ImportantBoth factors are equally important
3Slightly ImportantThe factor has a few more effects than the other one
5More ImportantOne factor is more effective as compared to the other one
7Particularly ImportantA factor has higher importance than the other one
9Most ImportantA factor has the highest possibility of affecting the occurrence
of landslide over the other factor
2,4,6,8Intermediate ValuesThe degree of importance is between the above scales
Table 3. The weightage of the major factors.
FactorsSlopeAspectCurvatureRelative ReliefNDVIRoad
Distance
River
Distance
Fault
Distance
LithologyDensityLand UseWeightage
Slope1 0.037
Aspect0.21 0.015
Curvature0.3321 0.022
Relative Relief0.5211 0.026
NDVI57531 0.059
Road Distance353351 0.099
River Distance3533311 0.091
Fault Distance25442111 0.068
Lithology579533351 0.168
Density5785322321 0.173
Land use798752333210.241
Table 4. The evaluation matrix.
Factors/Subfactors123456789AHP Weightage
Slope (°)
0–151 0.033
15–3031 0.064
30–45531 0.130
45–607531 0.264
More than 6097531 0.510
CR0.049
Aspect
flat1 0.024
North21 0.049
Northeast741 0.217
East420.331 0.089
Southeast98341 0.295
South530.520.251 0.135
Southwest420.25120.51 0.108
West30.50.250.50.140.330.51 0.049
Northwest210.140.330.120.250.330.510.024
CR0.070
Curvature
Flat (−0.5–0.5)1 0.072
Concave (<0.5)71 0.650
Convex (>0.5)50.331 0.278
CR0.046
Relative Relief (m)
Low (<10)1 0.105
Moderate (10–20)31 0.258
High (>20)531 0.637
CR0.0284
NDVI
Low (<0.2)1 0.651
Moderate (0.2–0.4)31 0.126
High (>0.4)531 0.223
CR0.0284 0.017
Distance from Road (m)
Low (<100)1 0.806
100–2000.121 0.120
More than 2000.110.51 0.074
CR0.019 0.019
Distance from River (m)
Less than 1001 0.740
100–2000.21 0.167
More than 2000.140.51 0.094
CR0.006
Distance from Fault
Less than 1001 0.637
100–2000.331 0.259
More than 2000.20.331 0.104
CR0.028
Lithology
Indosinian granite1 0.258
Jurassic limestone/mudstone31 0.637
Triassic magmatic/metamorphic rocks0.330.21 0.105
CR0.028
Disaster Density
None1 0.046
Low31 0.115
Moderate731 0.309
High9521 0.529
CR0.008
Land Use
Village1 0.022
Shrubland0.331 0.039
Farmland551 0.064
Grassland30.330.331 0.108
Bare land78351 0.041
Forest0.200.330.200.200.141 0.154
CR0.071
Disclaimer/Publisher’s Note: The statements, opinions and data contained in all publications are solely those of the individual author(s) and contributor(s) and not of MDPI and/or the editor(s). MDPI and/or the editor(s) disclaim responsibility for any injury to people or property resulting from any ideas, methods, instructions or products referred to in the content.

