Article

The Dietary Carbon Footprint of Portuguese Adults: Defining and Assessing Mitigation Scenarios for Greenhouse Gas Emissions

by
Cristóvão Fraga Andrade Pereira da Rocha
1,2,†,
Catarina de Sousa Tavares Pinho da Silva
1,2,†,
Rafaela Martins da Silva
3,
Manuel Joaquim da Silva Oliveira
4 and
Belmira de Almeida Ferreira Neto
1,2,4,*
1
LEPABE—Laboratory for Process Engineering, Environment, Biotechnology and Energy, Faculty of Engineering, University of Porto, Rua Dr. Roberto Frias, 4200-465 Porto, Portugal
2
ALiCE—Associate Laboratory in Chemical Engineering, Faculty of Engineering, University of Porto, Rua Dr. Roberto Frias, 4200-465 Porto, Portugal
3
Faculty of Engineering, University of Porto, Rua Dr. Roberto Frias, 4200-465 Porto, Portugal
4
DEMM—Department of Metallurgical and Materials Engineering, Faculty of Engineering, University of Porto, Rua Dr. Roberto Frias, 4200-465 Porto, Portugal
*
Author to whom correspondence should be addressed.
These authors contributed equally to this work.
Sustainability 2023, 15(6), 5278; https://doi.org/10.3390/su15065278
Submission received: 30 November 2022 / Revised: 20 February 2023 / Accepted: 7 March 2023 / Published: 16 March 2023
(This article belongs to the Section Sustainable Food)

Abstract

:
The food chain is a large contributor to environmental pollution, especially greenhouse gas emissions, strongly associated with the consumption of animal-based proteins. The understanding of the negative environmental impacts of dietary habits by the population is of the utmost importance to provide the means to effect change to more sustainable eating patterns. The main purpose of this study was to assess the carbon footprint of animal protein consumption in Portugal, while also evaluating six mitigation scenarios aiming to lower greenhouse gas emissions through strategic changes to the animal protein consumption of current dietary habits. Overall, the carbon footprint associated with animal protein consumption is 2.63 kg CO2 eq/(cap⋅day) nationally and 28.4 t CO2 eq/month for the faculty canteen. Meat is by far the largest contributor to the carbon footprint in both cases, with beef being its “hotspot”. All scenarios showed significant reduction potentials, with values ranging from 16% (lower value for both the national case and the faculty canteen) to 71% (faculty canteen). In sum, substantial carbon footprint reductions can be attained if policymakers support the implementation of effective measures to promote a shift in the current animal protein consumption towards more sustainable eating habits.

Graphical Abstract

1. Introduction

The food production chain is a key contributor to climate change, accounting for approximately 30% of global greenhouse gas (GHG) emissions [1]. The environmental burdens associated with the food chain result from several activities, such as the combustion of fossil fuels along the food system, the use and production of agrochemicals (e.g., fertilisers and pesticides), enteric fermentation from ruminant cattle, land use change (including deforestation), livestock manure, and bacterial fermentation occurring, for instance, at flooded rice paddies [1,2].
Besides GHG emissions, the growth of intensive and industrialised agricultural production has brought massive pressure on ecosystems and natural resources, leading to a wide range of environmental problems. These include a significant loss of biodiversity (through, for example, land occupation and promotion of Genetically Modified Organisms (GMOs)), freshwater scarcity due to irrigation—agriculture is responsible for about 70% of freshwater withdrawals [3] —, water contamination by nitrogen, phosphorus and toxic chemicals, and soil degradation due to intensive and aggressive agricultural production practices [3,4,5].
Recent figures show that over 80% of the GHG emissions of the European Union (EU) diets are caused by the consumption of meat, dairy, and eggs [6]. Such relevance calls for urgent mitigation measures to be implemented. According to the United Nations [7] and the EAT-Lancet Commission [8], a drastic shift in production systems and dietary patterns is crucial to cope with population growth and climate change. This urgency is well documented by Clark et al. [1], whose findings point out that if all non-food system GHG emissions were to comply with the decarbonisation targets of the Paris Agreement (while maintaining the current food system GHG emissions), the world temperature would rise above the settled 2 °C limit. Accordingly, the EAT-Lancet Commission stated that it is imperative to also consider the food system as a key factor in the fight against climate change [8].
Many studies assess human diets’ environmental impacts [9,10,11,12]. From these, a certain number converge their focus on assessing human behaviour in food consumption to form the basis for GHG mitigation actions related to human diets [13,14,15,16,17].
Countrywide studies focusing on types of diets reinforce the large contribution that the consumption of animal-based products has on overall GHG emissions. Analysing a shift from the Danish diet to two Nordic diets, Saxe et al. [18] found that animal-based products have larger impacts on GHG emissions when compared to plant-based ones. The same study reveals that the consumption of animal-based products has a larger contribution to GHG emissions when compared to local purchases, consumption of imported products, or even the contribution of agricultural production methods (conventional or organic). Vázquez-Rowe et al. [19] corroborate these findings for food consumption in Peru. The authors suggest that efficient pathways to mitigate GHG emissions from the food sector shall primarily focus on reducing food losses and replacing ruminant meat with less carbon-intensive protein-rich foods. The work by van Dooren et al. [20] explored the relationship between health and sustainability for six different human diets. They concluded that four of the diets (Mediterranean, vegetarian, semi-vegetarian, and vegan) meet the EU’s 2020 target of a 20% reduction in GHG emissions. They also concluded that the average Dutch and the official recommended Dutch diets are not orientated to this EU target. In a similar study, Aleksandrowicz et al. [21] stated that if typical western diets were changed by partially or fully replacing meat consumption with, for instance, fish or plants, reductions summing up to 70% in GHG emissions and land use and 50% in water use could be achieved. Some authors studied the carbon footprint associated with Portuguese consumption patterns at an aggregated level [22]. Similarly, they found that the consumption of livestock products is also a large contributor to the overall GHG emissions of food consumption. The authors report a potential 25% decrease in GHG emissions if the EAT-Lancet’s Planetary Health Diet is adopted. Overall, studies on the environmental impacts of different diets tend to converge on the idea that a diet low in animal-based products and high in plant-based ones brings environmental improvements [8,13,14]. There are, however, two obstacles that need to be carefully addressed: society’s reluctance to make dietary shifts and the lack of concrete, realistic, and effective policies addressing this issue.
The 2015 GHG emissions of the Portuguese food system accounted for 0.05% of the global GHG emissions and 1.6% of the European food system [23,24]. The Portuguese food system contributes 31% to the total national GHG emissions, similar to the EU average (30%) [23]. These emissions are split into several activities: agriculture and associated land use and land-use change activities (46%), energy use (34%), industrial activities (11%), and waste management (9%). The same study shows that, from the 21 Mt CO2 eq emitted by Portugal’s food system, the contribution of the production dominates (52%). Processing has the lowest contribution to the impact of the entire food chain (6%). Distribution, which aggregates transport, packaging, and retail, is the stage with the second-largest contribution to the impact (28%). Finally, the consumption and disposal of food accounted for 14% of the country’s food system emissions [23].
Portugal is characterised mostly by a Mediterranean diet, as recognised by the United Nations Educational, Scientific, and Cultural Organization (UNESCO) in 2013 [25]. In the north of the country, there is also the predominance of the Atlantic diet, in many ways similar to the Mediterranean, but with a higher intake of seafood and potatoes in particular [26]. However, it is known that the country is shifting towards a “Westernised” diet, wherein large quantities of animal-based proteins are consumed [25]. National studies show that the Portuguese are consuming more than three times the amount of meat, seafood and eggs recommended in the National Food Wheel and 33% more dairy, whereas fruits and vegetables are well below the recommended values [27]. Portugal’s per capita dietary carbon footprint is the largest within the EU, emitting 1460 kg CO2 eq/(cap⋅year), whereas the average EU diet emits 1070 kg CO2 eq/(cap⋅year) [6]. Portugal is the world’s third-highest consumer of seafood [28], driven by the fact that 62% of its population is settled in urban areas on the coast [29]. It is also due to the long-life consumption of dried salted codfish, one of the most popular products in Portuguese cuisine. FAO also notices the larger carbon footprint of Portuguese dietary patterns by highlighting the large caloric intake [30]. Food waste is also a severe issue in Portugal, amounting to 17% of the country’s total food produced for human consumption [31]. Accordingly, Galli et al. [5] found that Portugal’s ecological footprint is almost three times higher than its biocapacity (3.69 gha/cap vs. 1.28 gha/cap), and food consumption has a contribution of 30% to the ecological footprint. Overall, this study demonstrates that a lot of work is needed to promote national sustainable food consumption policies.
The aim of the present study is to contribute to covering a current gap by assessing the environmental impact associated with the consumption of animal protein sources by the Portuguese adult population. The present study adds to [22] by providing a detailed analysis of the CF for 23 animal-based proteins. This makes a step forward in understanding food products that make the basis of national diets. The main purpose is to raise awareness of the impacts of national food consumption, particularly of animal protein sources, and analyse mitigation scenarios to reduce GHG emissions. In this regard, two case studies were considered. The first one evaluates the carbon footprint (CF) of the national food consumption patterns of animal-based proteins, while the other targets the consumption of animal-based proteins in the canteen of the Faculty of Engineering of the University of Porto (FEUP), Portugal. The national food consumption by the adult population is estimated through the use of data from a national survey, and the environmental burden of such consumption is assessed by the carbon footprint, which quantifies GHG emissions and expresses them in CO2 equivalents. For this purpose, carbon footprint values were mainly retrieved from Life Cycle Assessment (LCA) and carbon footprint studies. By considering the carbon footprint associated with each food, it is possible to calculate the carbon footprint of a meal or also a dietary pattern. Carbon footprint impact values were preferred to the use of the multiple environmental impact category values from LCA studies. This is because, although LCA is a comprehensive tool, many literature sources regarding food products focus, so far, on carbon footprint to evaluate the environmental impacts [32]. This simplified analysis seemed to be the most appropriate due to the recognised large contribution that animal-based proteins have specifically to climate change impacts [6].
In the end, this work defines and assesses mitigation scenarios to reduce GHG emissions. Such scenarios were designed to provide some alternative pathways to impact mitigation. By doing so, they can simultaneously raise public consciousness about the environmental impacts of the national food consumption patterns and aid policymakers in promoting actions that lead to more sustainable food consumption patterns.

2. Methods

The following sections detail the data collection process used for the Portuguese national food consumption and in a faculty canteen, and how the carbon footprint values for the individual food products were gathered. The carbon footprint mitigation scenarios are also described here.

2.1. Portuguese Food Consumption

Data regarding Portuguese dietary patterns were collected from the National Food and Physical Activity Survey (IAN-AF). It is the result of a consortium between national and international researchers involving nine entities, which is promoted by the Faculty of Medicine of the University of Porto [33]. Data from the IAN-AF were used, as opposed to data from Food Balance Sheets (FBS) and Household Budget Surveys (HBS). This is because, unlike FBS and HBS (that focus on food availability), the IAN-AF estimates the direct food consumption and, hence, is the more representative and accurate way for the quantification of the dietary habits of the Portuguese population [34]. It is, therefore, more suited to be used within the consumption scope of the present study. Moreover, the IAN-AF survey is currently being used as the main source of information for food and nutrition policies in Portugal, as mentioned in the Portuguese Journal of Public Health [35]. The IAN-AF gathered national information on the food consumption habits (including nutritional intake and physical activity) of individuals, allowing the study of several health aspects and establishing relations with citizens’ socioeconomic factors [33]. The information was collected from a target population of country residents registered at the National Health Service, aged between 3 months and 84 years, from October 2015 to December 2016. A randomised selection of citizens was made from the ones registered in each health care unit, according to their sex and age. Food consumption was assessed by two 24 h recall questionnaires conducted face-to-face, on non-consecutive days. Overall, 5 811 candidates completed both interviews and 742 completed only the first. The two groups were both representatives of the original sample, as the calculated p-values were lower than 0.001 for every characteristic analysed (with a confidence level of 95%) [33]. The IAN-AF study is considered a national reference for estimating the food consumption of national citizens [35]. In the present work, out of the selected sample who completed the two interviews (5811 participants), only adults 18 to 64 years (3102), and senior citizens 65 to 84 years (750), were considered. In total, this represents a sample of 3852 people [33].
Data were reported on each protein’s weight, both in its raw and cooked forms, without distinction and corresponding to the edible (e.g., without bones, peels) amount of the food item consumed before processing [33]. Some food diaries from the IAN-AF include the full recipe consumed and not the individual quantity of food products used. In this way, the IAN-AF data for these particular situations is a rough estimation of real food consumption.
Solely animal protein is under the scope of this study, namely meat, seafood, eggs, and dairy products. All the food products included in the four main categories are present in Supplementary Material Table S1.
The overall consumption of a protein was obtained by adding all the constituents of that food item, which are consumed separately. For example, the separate consumption of chicken breast or chicken wings was summed and included in the “chicken” category. This methodology was applied to all the food items and categories considered in the study. The consumption of non-chicken eggs was assumed to be negligible. Processed foods were excluded from the present study. These may comprise sausages, including charcuterie products and cold meats (for instance, ham). Processed foods only account for 4.4% (mass) of the total animal protein considered in this study. The reason for this exclusion deals with the absence of carbon footprint values for such products in the literature and the fact that their varied composition does not ease the identification of the individual ingredients by the IAN-AF respondents.
Figure 1 presents the Portuguese population’s consumption of animal protein sources, expressed in g per capita per day.
The results from the IAN-AF show that milk is the most consumed animal protein in Portugal (in mass), at around 81 g/(cap⋅day), followed by chicken and yoghurt, with 46 and 31 g/(cap⋅day), respectively. Among the dairy category, cheese is the least consumed protein, with 12 g/(cap⋅day).
In general, Portugal consumes more meat than seafood. Meat has a total consumption per capita per day of 127 g, far higher than the quantity of seafood—47 g/(cap⋅day). Within meat, chicken and pork are the most consumed protein sources, representing, respectively, 36% and 28% of the overall meat consumption nationally. Concerning seafood, cod represents 27% of the national consumption of this food group (4% of the total consumption), followed by hake, with 18%, and salmon, with 12%.

2.2. Food Consumption in a Portuguese Faculty Canteen

The Faculty of Engineering is part of the University of Porto, Portugal. Porto is the second main city in Portugal and is located in the north of the country. The Faculty of Engineering has the largest number of students within the University of Porto, with more than 7000 [36]. Accordingly, its canteen has the largest number of seats on the premises of the University of Porto—324 seats [37]. In 2019, the canteen served a total of 143,298 meals, including lunch and dinner [37]. This paper focuses solely on lunchtime due to the drastically higher number of lunch meals served in comparison with dinner meals, and the period chosen was October 2019. During this month, 16,403 meals were served, of which 77% were served at lunch and only 23% were served at dinner (Table S2). Three types of meals are available to be served during lunchtime: one with meat as the main protein source (known as “meat” meal), another with seafood as the main protein source (“seafood” meal) and finally, a low-fat meal containing either meat, seafood, or eggs (“diet” meal). Despite the fact that the canteen is open during the weekends, the number of meals served is much lower at that time. In fact, during October 2019, an average of five “meat” meals, 1 “seafood” meal, and 1 “diet” meal were served on the weekends.
During the period assessed, the canteen at FEUP served, on average, 366 “meat” meals, 41 “seafood” meals, and 7 “diet” meals. Table S3 contains information provided by the Social Services from the University of Porto (SASUP) with the description of every meal and its composition in terms of the amounts of animal protein sources served.
Figure 2 shows the overall consumption in the canteen expressed in kg per month. These values, provided by the SASUP, were obtained by considering the quantity served in each meal and the number of times it was served. Table S4 shows the details on the amount of protein served per meal, the total number of servings, and the number of times the food product was used per month.
Results show that despite meat and seafood appearing on the menu an equal number of times (50 times each, according to Table S4), canteen users largely prefer meat to seafood. Overall, during the time evaluated, only 235 “seafood” meals were served, in contrast with 11,360 “meat” meals. Among meat, the most consumed food products are pork, chicken, beef, and turkey. In total, they account for 90% of the meat served at the canteen. The same occurs with the national consumption of meat, according to the IAN-AF results (see Figure 1).
Regarding seafood, the larger consumption is for the category “other fish”. This is due to the number of times (36) that the fish species included in this category are present in the canteen menus throughout the month (see Table S5). Species from the “other fish” category that were served the most accounted for 36% of the category consumption and included redfish, pollack, and squid. “Other fish” is followed by codfish and tuna as the most consumed seafood in the faculty canteen. Hake, one of the most consumed seafood at the national level, is rarely found on the canteen menu, which leads to it being the least consumed type of seafood.
Cheese, milk, and eggs present low consumption values in the faculty canteen since they are not usually served as the main source of protein at lunch; instead, they are generally used as secondary ingredients in meal preparation.

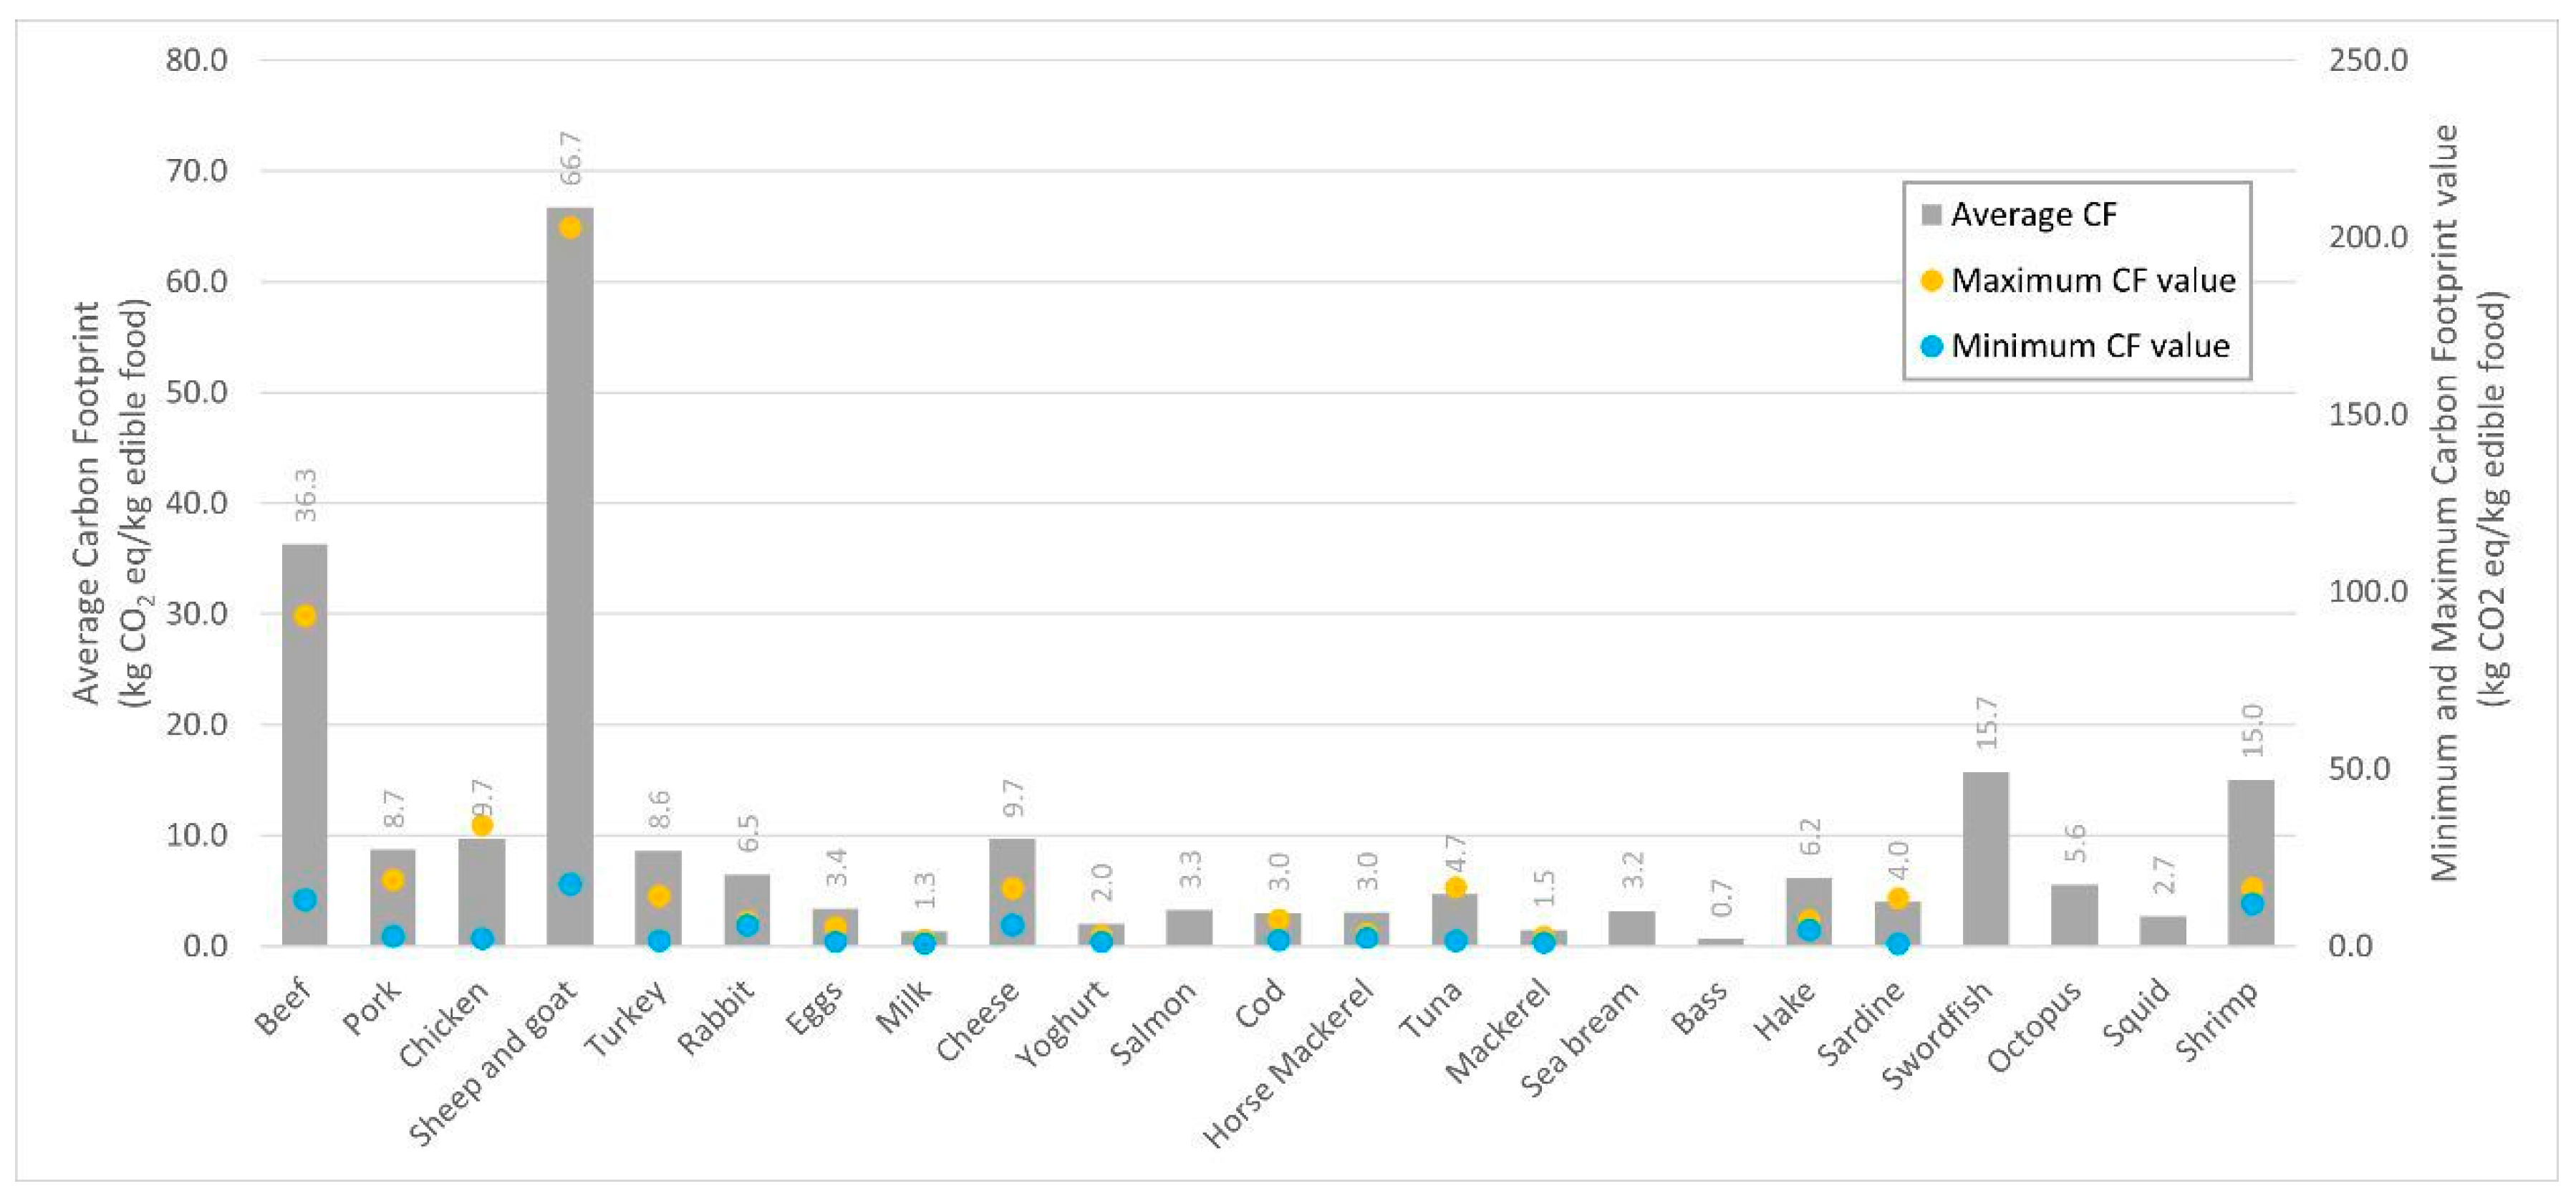
2.3. Carbon Footprints of Individual Food Products

The literature review on the carbon footprint values focused on four main categories of animal-based proteins consumed by the target population: meat, seafood, dairy, and eggs. The food products included in each category represent a total of about 80% of the overall food products integrated into each animal protein group. The food products included in this study are listed below:
  • Meat: beef, pork, chicken, turkey, rabbit, sheep, and goat.
  • Seafood: codfish, tuna, sea bream, sardines, salmon, shrimp, octopus, squid, swordfish, horse mackerel, bass, hake, and mackerel.
  • Dairy: milk, cheese, and yoghurt.
The values for the carbon footprint were retrieved from a vast number of peer-reviewed studies, which used the GHG Protocol methodology to quantify the footprint [38]. Of the 23 food products considered in this study, only seven (beef, pork, milk, eggs, sheep and goat meat, yoghurt, and sardine) report the carbon footprint of their production for Portugal. To face that limitation of values from the available literature for Portugal and to seek a more complete analysis, a larger number of global carbon footprint values were collected in this study. With that, the aim was to perform a more comprehensive study.
Most of the carbon footprints are expressed in mass of CO2 equivalent emissions per mass of live weight (LW) or carcass weight (CW). Considering that only a few values are expressed in animal edible weight (EW), and the consumption values are reported to the edible part of the food item, a conversion of the CF values from LW and CW to the edible portion was performed. The conversion was completed in steps. First, the values were converted from LW and CW to retail weight (RW) through values retrieved from the literature, and then from RW to EW using the average edible fraction of the food item taken from the Portuguese Food Composition Table [39] (Table S6). For chicken, the mentioned table already lists the conversion factor from CW to EW, which was instead used.
Several details associated with the carbon footprint values were also systematised. This includes the functional unit, the origin of production, the system boundaries considered in the study, and the animal production method.
Based on the values collected, the mean CF was calculated (Table S7). Figure 3 presents the results obtained for the carbon footprint values per food product and the minimum and maximum values for each. For salmon, bass, swordfish, octopus, and squid, only one study was used. This average value was then used to calculate the overall carbon footprint of the consumption of animal protein sources for both case studies (Portugal and the faculty canteen).
The category “other fish”—included in the consumption in the faculty canteen—was assumed to be the mean value of all types of seafood considered in this study. The carbon footprint for this category is 5.3 kg CO2 eq/kg edible food.
Overall, 394 CF values were collected from a total of 100 studies from 32 different countries (Table S7). Some of the studies focused on specific regions instead of individual countries, such as Europe [40] or East/Southeast Asia [41]. For meat, there was a large heterogeneity in the origin of the footprint values, and a vast number of studies were available. On the other hand, almost all the values for seafood were obtained from the same study performed for the Galicia region in Spain [42].
The values obtained from the literature were compared with the CF values from a review study by Clune et al. [43] (Table S7), where the authors performed a similar analysis of carbon footprint values, reviewing a total of 369 studies. This step allowed for testing the robustness of the data collected. The work from Clune et al. [43] reports the CF results as kg CO2 eq/kg produce or bone-free meat for several individual food products. Results show that for meat, eggs, and dairy, the average CF values do not differ considerably from the ones obtained by Clune et al. [43]. In the case of seafood, a larger discrepancy occurs between the CF results obtained for this study and the ones from Clune et al. [43]. This is possibly attributed to the differences in the number of CF values analysed and, consequently, in the estimated average value for the CF since there is a small number of footprint values available in the literature for the different types of seafood when compared to meat. Additionally, the work from Clune et al. [43] does not comprehend all the types of seafood considered at the national level and in the faculty canteen.
The carbon footprint from the overall consumption of animal-based proteins was calculated by multiplying the consumption in mass by the average value of its carbon footprint obtained from the literature. For national consumption, the CF result is expressed in kg CO2 eq/(cap⋅day), whereas, for consumption in the canteen, the CF is expressed in kg CO2 eq/month. Therefore, both results cannot be compared. It is also important to note that the CF for the canteen is an exploratory study, and the conclusions should be carefully read since it focuses on a rather small population having lunch at a faculty canteen over a short period (one month).

2.4. Sensitivity Analysis

To assess the influence of the CF values on the overall dietary carbon footprint, a sensitivity analysis was carried out by varying the edible yield of the animal proteins in use, considering the national consumption. Therefore, the carbon footprint was calculated for the average, minimum, and maximum edible yields for each food group, using the data from the Portuguese Food Composition Table [39]. Results for the overall CF considering the different edible yields are presented in Table 1. Results for all the food products and the average, minimum, and maximum edible yields are presented in Table S8.
Results show that considering the minimum edible yield, the CF was approximately 20% larger than the mean value; as for the maximum edible yield, it was 15% lower. As for the food groups, the largest variation was observed in meat when the minimum edible yield was used (+26%). For seafood, the largest variation was, again, when using the minimum edible yield; however, this produced only a 2% increase in the carbon footprint. This shows that the CF of consumption has a low sensitivity to the different edible yields used. Therefore, the results are not greatly affected, allowing the conclusion that the use of the mean value is acceptable in the present study.

2.5. Carbon Footprint Mitigation Scenarios

Scenarios may allow evaluation of the changes induced in the carbon footprint resulting from alterations in food consumption patterns. Such scenarios were meant to assess the maximum reduction in GHG emissions that can potentially be attained by some dietary shifts on the main types of animal protein consumed by the Portuguese population. In this way, potential solutions can be used to support decision making by those responsible for planning menus either at home or at the university social services. Noteworthily, some aspects of consumption (e.g., diet costs and consumer preferences) and the social dimensions of production (such as the livelihoods of farmers) were disregarded in defining these scenarios.
The scenarios were designed to be practical and built based on the premises of the National Food Wheel [44]. According to these guidelines, a food product can be substituted by the same amount of another food product, as long as they belong to the same food group. In this case, the substitutions were made within the group of “meat, seafood, and eggs” by using interchangeable food products within the same food product groups. A scenario contemplating dairy products (milk, yoghurt, and cheese) was not considered in this study (except for scenario 1), not only because they belong to a different food group in the National Food Wheel, but also because, as the consumption data show, dairy products are not consumed as single products during lunch or dinner meals in Portugal, by opposition to meat, seafood, and eggs.
A total of six scenarios were identified and evaluated. Except for scenario 1, all the scenarios apply to the two cases (national consumption and consumption in the canteen). The exception is because scenario 1 aims to assess the relative importance of adjusting the daily animal protein consumption patterns to the dietary guidelines settled in the National Food Wheel. Hence, it is only appropriate to apply it to national consumption, the case study that comprehends an entire day of eating. Furthermore, since recommendations for the “dairy products” food group are also present in these guidelines, dairy was also included in scenario 1. The other scenarios (2 to 6) aim to understand the relative contribution of meat, in general, and bovine meat, in particular, to the overall carbon footprint. This is done by assessing the total or partial replacement of this type of meat in the two cases considered.
The carbon footprint for each scenario was determined by first calculating the new amount consumed for each animal protein, and then multiplying this amount by the respective individual carbon footprint for each food product. The resulting carbon footprint was obtained by the sum of the carbon footprint for each food product. This procedure is valid for the two cases analysed.
For both national and canteen levels, a weighted replacement of each food product was calculated to determine the overall consumption for each scenario. In this way, the original share of each protein consumed was respected when the food product was replaced. The calculation of the new consumption values for each scenario consisted of three main steps, which are valid for both cases studied:
  • Calculation of the weight of the original consumption of each protein replaced in the total consumption (in %).
  • Calculation of the weight of each replacement protein on the protein(s) to replace (in %): each weight calculated in (1) is divided by the sum of all of them.
  • Calculation of the new consumption for each replacement protein: each value calculated in (2) is multiplied by the total consumption of the protein(s) to replace, and finally added to the original consumption of each replacement protein.
Finally, the reduction potential of each scenario is calculated by comparing the original consumption carbon footprint with the newly calculated consumption carbon footprint for each scenario, which followed the same procedure described in Section 2.3, for Portugal and the canteen cases.
Table 2 synthesises the main information about the carbon footprint mitigation scenarios. A more detailed description of the scenarios can be found in Supplementary Material (Table S9). Data used to calculate the reduction potential of each scenario are also in Supplementary Material (Table S10).
To statistically validate the results of the GHG mitigation scenarios, the significance was evaluated through parametric hypothesis testing. The detailed analysis can be found in Supplementary Material (in Statistical Analysis).

3. Results and Discussion

3.1. National Consumption of Animal Protein

Figure 4 shows that overall meat consumption corresponds to 78% of the CF associated with animal protein sources. On the other hand, dairy products correspond to 11%, seafood corresponds to 9%, and eggs to 2%.
The total carbon footprint of animal protein consumption is 2.63 kg CO2 eq/(cap⋅day). Beef is the largest contributor, corresponding to 40% of the total carbon footprint. The second-largest contributors are chicken and pork. Overall, these three types of meat represent approximately 69% of Portugal’s carbon footprint of the overall consumed animal protein sources. Within the meat category, the consumption of beef, pork, sheep and goat (red meat) corresponds to 53%, while the consumption of chicken, turkey, and rabbit (white meat) sums up to 47%. Still, the carbon footprint of red meat accounts for 73% of the carbon footprint of the meat category (in contrast with 27% for white meat).
Sheep and goat meat, although having the largest CF among all the distinct types of protein considered, shows one of the smallest CF within the meat category (see Figure 4). This can be attributed to the fact that it is the type of meat under analysis less consumed by the Portuguese population. In the case of rabbit meat, its relatively small consumption and the fact that it shows one of the smallest CFs leads to it being the meat with the smaller CF—and having a lower value than most of the seafood considered−1.
For dairy proteins, the CF values range from 0.06 kg CO2 eq/(cap⋅day) for yoghurt to 0.11 kg CO2 eq/(cap⋅day) for cheese. Noteworthily, eggs and cheese, despite being similarly consumed nationally – 16 and 12 g/(cap⋅day), respectively –, have different CF values, which is related to the fact that the CF of the individual food products is larger for cheese than for eggs.
Within seafood, cod and hake have the largest associated CF, which is essentially related to their large consumption by the Portuguese population. In contrast, swordfish, which shows the largest CF within the seafood category, has a small CF due to its small consumption. The opposite happens for horse mackerel, showing one of the smallest CF despite being the sixth-most consumed seafood in Portugal.

3.2. Consumption of Animal Protein in a Portuguese Faculty Canteen

The total carbon footprint of all animal protein-based lunch meals served in October 2019 in the canteen of the Faculty of Engineering of the University of Porto was 28.4 t CO2 eq/month. Figure 5 shows the carbon footprint of each food product served. Meat was by far the largest contributor to the overall CF, accounting for up to 94% of the total value. Within the meat category, beef, pork, chicken, and turkey are the four types of meat considered which have the largest carbon footprint. The larger preference for “meat” over “seafood” and “diet” meals, together with the large environmental impact of meat consumption, is the basis for such large CF values.
Despite representing over 3% of the overall CF, the category “other fish” had the largest CF within seafood: 79%. This is due to the considerable number of times that kinds of seafood included in “other fish” were served, together with the fact that this category had the largest consumption (75%) among all the types of seafood consumed, as was mentioned in Section 2.2. Besides this multispecies seafood category, all the other types of seafood had a negligible contribution to the total carbon footprint (less than 1%).
Together, dairy and eggs represent only a small fraction of the overall carbon footprint of the canteen (summing up to about 2%). However, it is relevant to mention that these food groups are not the main protein source in the meals served, but are instead generally used in small portions in the preparation of the meal.

3.3. Carbon Footprint Mitigation Scenarios

A total of six carbon footprint mitigation scenarios were defined for the case of consumption by the Portuguese population and the case of the faculty canteen. Except for scenario 1, all the scenarios were assessed for both cases.
Table 3 shows the reduction potential achieved by each scenario.
Results show that the reduction of the carbon footprint varies between 16 and 71% for the canteen and 16 to 62% for the national level.
Scenario 6 presents the largest carbon footprint reduction potentially achieved for both national (62%) and faculty (71%) levels. Scenario 5 also presents comparatively large reduction potentials, namely 55 and 59%, respectively. The substitution of meat—the food group with the largest carbon footprint—for eggs leads to the largest reduction, due to the relatively small individual CF of eggs. In FEUP’s canteen, several different meals containing at least one type of seafood or meat are provided at lunch and dinnertime. Consumers are free to choose their type of meal. This means that, at best, the potential reduction of GHG emissions may be 59% if consumers shift their dietary habits toward seafood.
Next on the list is scenario 1, which is only applicable nationally. Like the previous ones, it more than halves the overall carbon footprint (53%). This scenario was built based on the recommended guidelines from the National Food Wheel, while not accounting for the consumption of non-animal products (such as vegetables and fruits). Nevertheless, such exclusions are not likely to alter the results substantially. Literature values state that fruits, vegetables, and nuts are only responsible for 4% of the carbon footprint of EU diets (in opposition to the contribution of meat, dairy, and eggs, which account for about 80%) [6]. Such results show that an important climate change mitigation path could be achieved by adopting a human diet closer to the recommendations set by the National Food Wheel.
All other scenarios (scenarios 2 to 4) led to a CF reduction larger than 16%. Scenarios 3 and 4 share some important characteristics—e.g., totally replacing the meat with larger CF, beef—and, hence, result in similar results. For the consumption in the faculty canteen, there was no difference between scenarios 3 and 4 (both led to a 32% reduction), while nationally, the difference between the two scenarios was small (29 vs. 33%, respectively).
In scenario 4, beef, pork, and sheep and goat were replaced with chicken, turkey, and rabbit. The average weighted carbon footprint of chicken, turkey, and rabbit (their replacement proteins) is much lower than that of sheep and goat but slightly higher than pork. These differences in carbon footprints, together with consumption values, explain the results obtained for the canteen and the national case.
In the canteen, where the consumption of sheep and goat is almost negligible, replacing beef (scenario 3) or replacing sheep and goat and pork as well (scenario 4) has the same effect. This is because the increase in the carbon footprint that results from replacing pork with white meat is counterbalanced by replacing the negligible consumption of sheep and goat meat (but with a comparatively larger CF).
However, for the national case, although pork is also more consumed in proportion, there is a substantial increase in the consumption of sheep and goat meat in proportion to the canteen. Therefore, replacing it has a large influence on the reduction of the carbon footprint.
Globally, the mitigation scenarios point out that beef consumption is undoubtedly the major contributor to the carbon footprint associated with the consumption of animal proteins. For all scenarios where beef consumption is excluded from the meals, the reduction varies between 29 and 71% (scenarios 3–6). The substitution of only half the beef shows the lowest reduction—16% for both cases (scenario 2).
Results also show that the same scenarios allow for a larger CF reduction for the canteen when compared to the national case (except for scenario 4). However, this remark shall be considered carefully because only lunchtime meals are considered at the faculty canteen and for only one month, while at the national level, the data refers to one year of daily consumption patterns (where meat consumption is lower due to dairy consumption).
The results of the mitigation scenarios were validated statistically. After performing a parametric hypothesis test for the average footprint reduction in the two cases, it was calculated, using the p-value analysis with a 5% error, that the reduction value is not only positive but higher than 20%. The confidence intervals for the average reductions at a 95% confidence level were [14.2%, 69.8%] for the national case and [22.2%, 60.2%] for the faculty canteen. The reduction in the two cases was also compared. It was concluded that the carbon footprint reduction was, on average, the same, with an error of 5% (p-value of 0.9507). Overall, it was concluded that the reductions were significant and similar (on average) in the two cases. More detail on this analysis is provided in Supplementary Material (in Statistical Analysis).
The results obtained for the mitigation scenarios were compared to the few studies available in the literature. The results are in line with the literature, in the sense that reducing ruminant meat [19,21]—and beef in particular [17,18]—or meat in general [20,21] can lead to significant reductions in the CF associated with food consumption patterns. This work also corroborates the findings from the study by van Dooren et al. [20], in which it is stated that a shift to a pesco-vegetarian (or pescatarian) diet can be an effective way to reduce dietary CF.
A study from Aleksandrowicz et al. [21] analyses different mitigation scenarios from several studies, where current average diets (The “current average diet” means the average value from all studies considered for a specific scenario. In turn, an individual scenario is categorised as the comparison between this baseline diet and a given sustainable diet. In each scenario, the relative differences in GHG emissions between baseline and sustainable diets were quantified. Note that all these scenarios contemplate the consumption of other (non-animal) food groups, and that the studies they are based on assess the consumption in different countries [21]) are compared with sustainable dietary patterns in terms of GHG emissions. One scenario in particular analyses a pescatarian diet. Therefore, it is similar to scenario 5 of the present work. Results show that the reduction resulting from this scenario ranges from 17 to 55% [21]. Scenario 5 of the present work led to a reduction of 55% nationally, the upper limit of the mentioned range. Another scenario focused on the replacement of ruminant meat with monogastric meat (A ruminant has a multi-compartmented stomach (generally four-chambered). Deer, cattle, antelopes, sheep, and goats are among the most common ruminants [45]. A monogastric is a mammal with a single-compartmented stomach, such as humans, poultry, pigs, and rabbits [46]), showing a reduction in a range of approximately 4 to 37%. This scenario resembles scenario 4 from the present work. The main difference is that, in our work, besides beef and sheep and goat, pork was also replaced (despite being monogastric). However, pork has a slightly smaller individual carbon footprint than the weighted average of chicken, turkey, and rabbit, enabling the establishment of a comparison between the two scenarios. In this way, scenario 4 from the present work leads to a 33% reduction nationally, which fits within the range of the literature study.

3.4. Policy Implications

The assessment of the global GHG emissions associated with food consumption is of pivotal importance to strategic political decisions. This is relevant for Portugal, in particular—the country with the largest per capita contribution to Europe’s dietary carbon footprint. From this fact stems the importance of understanding the reasons behind such consumption, as it shows to be very different from the consumption recommendations set by the National Food Wheel.
Progress towards healthier and more sustainable eating habits should be encouraged by familiar, community and school educational campaigns, improved marketing dissemination, and specialised education programs targeting professionals of the National Health System. Health professionals (dietitians and nutritionists) have a pivotal role in planning meals. The literacy on the CF of food products and meals may assist in promoting less carbon-intensive menus by, for instance, experiencing the replacement of beef in current meals by other foods with a lower CF. Pilots can be made at, for instance, schools. These actions may likely form the basis for a documented Action Plan for the reduction of the dietary carbon footprint promoted by the National Program for the Promotion of Healthy Food (PNPAS) [47].
Some food policy initiatives in Portugal already address environmental issues (mostly regarding food waste and circular economy) [5]. The creation of a national dietary guideline that integrates health and environmental considerations could be a catalyst and political commitment to encourage citizens to adhere to healthier and less impacting food consumption [5,8]. In addition, the recognition of the impact of several food products may drive health professionals to be more eager to use sustainable recipes based on traditional culinary principles and flavours, for instance, through cookbooks and recipes created by Chefs and made available by public institutions and by professional menu design in catering enterprises [8,48]. Some examples of that are also advanced in related literature [8].
Not to be forgotten is the cost that may be associated with CF reduction of meals. This is because consumer behaviour in industrialised countries is mostly driven by economic factors [49]. Studies show that there is some consensus on the fact that sustainable diets can be achieved without higher costs associated, especially when compared with the costs of current consumption patterns [49,50]. Naturally, this is an important topic that shall be evaluated with more detail, but some of the measures advanced are not costly and thus align with the findings that it is possible for the final consumer to spend the same, or even less, for a meal with lower CF.
Other studies also approach the effects that food cost policies can have on increasing the consumption of healthy and sustainable foods. Financial incentives (e.g., subsidies) to healthy and sustainable foods can naturally shift consumer purchasing patterns and, consequentially, drive dietary change [49]. On the other hand, unhealthy and impactful foods (e.g., red meat) could be recognized. Taxes on sugary drinks are already in place in Portugal, and it was observed that the sugar content in these drinks dropped by 17% from 2016 to 2020 [47]. It should be noted, however, that such measures are not easy to implement. These are likely to be met with fierce opposition by the agri-food industry, whose interests may influence the policy agenda, as recognized by Portuguese health authorities [35].
It is not surprising that policymakers often operate in complex multidisciplinary contexts, where a multitude of social, political, economic, and environmental aspects co-exist. Dietary shifts can have a strong impact on the livelihood of both consumers and producers; thus, making food policies based solely on an environmental dimension is, hence, not recommendable.
All in all, the transition to sustainable diets—and climate change mitigation in general—calls for concerted action between policymakers, society, producers, and other actors in the food chain. They all should be aware that trade-offs between environmental, economic, and social issues are likely to be inevitable. By alerting and raising awareness of the carbon footprint associated with animal protein consumption, this study may be a valuable resource for policymakers to take more informed GHG mitigation actions.

4. Conclusions, Limitations, and Future Work

This paper assesses the carbon footprint associated with the consumption of animal-based proteins by the Portuguese adult population and also in a faculty canteen. Afterwards, six GHG mitigation scenarios were designed and assessed.
Bovine meat, despite being only the third most consumed, both nationally and in the canteen, has a carbon footprint at least two times larger than chicken and pork. These are the most consumed types of meat in both cases under study. Not surprisingly, for Portugal, and due to its large consumption, codfish and hake have the largest carbon footprint of all the seafood included in this study. On the other hand, in the canteen, the consumption of “other fish” reveals the largest CF for the seafood category. As expected, due to their individual carbon footprints, meat consumption has a significantly larger environmental impact even when compared with the sum of all other animal proteins (dairy, seafood, and eggs).
The comparison of CF values for the present study with the ones from a systematic review paper [43] revealed minor changes, hence contributing to the robustness of the results. The sensitivity analysis performed on the different edible yields considered for each of the food items under study also proved that the overall CF of consumption is not affected by such variations.
Concerning the GHG mitigation scenarios, the CF reduction potential varies from 16 to 62% at the national level, and between 16 and 71% at the canteen. Scenario 1 evaluated the mitigation potential of adhering to the nutritional guidelines of the National Food Wheel. The fact that it led to the largest potential reduction nationally (53%) shows that the drastic shift towards the overconsumption of animal protein—particularly carbon-intensive sources such as dairy, beef, and pork—is the major cause of the large carbon footprint of the Portuguese diet. In both cases (national and faculty canteen), the most extreme dietary shifts, such as replacing meat with seafood (scenario 5) or eggs (scenario 6), resulted in the largest reductions in GHG emissions. Not surprisingly, the replacement or limitation in the consumption of one to all types of meat may lead to a relevant reduction in GHG emissions.
Some limitations were identified during the development of this paper. Overall, the lack of a standardised uniformity in the methods and boundaries chosen for carbon footprint determination may be the cause of substantial variations in the carbon footprint values obtained for individual food products. Additionally, the small number of carbon footprint values collected for some food products (mainly seafood), could have led to some uncertainties in the final results since the literature available was not as vast as for meat. Moreover, ideally, country-specific carbon footprints should be preferred to global ones, but unfortunately, these are not readily available in a number that allows complete coverage of animal-based food products. In the literature review, only 7 out of the 23 foods considered had carbon footprint values specific to Portugal. That is a small sample. Hopefully, the efforts and insights provided on this subject by the present study may impel future research on this topic. Furthermore, regarding the environmental data retrieved from the literature, it should be noted that the food production methods underlying the carbon footprints were not analysed in detail in terms of their relationship with the respective carbon footprint value. It is understood that this may be a limitation; however, the number of studies available that characterise the carbon footprint for each product evaluated would not allow for a detailed and complete assessment. Thus, the option was, again, to be more complete while recognising such limitations.
Another limitation is that the exclusion of processed foods may have led to an underestimation of the carbon footprint mainly associated with national meat consumption and pork in particular since most of the meat-based processed food eaten in Portugal is made of pork. It is recognised that it may influence, by underestimation, the results for meat-based processed foods alone.
Regarding the definition of the mitigation scenarios, the validation of the replacement choices must be conducted by health professionals for a complete nutritional evaluation of the population’s diets. Another aspect relates to the extension of the environmental impact categories to others than climate change. For instance, water use, land use transformation, or freshwater eutrophication shall also be considered for more robust decision making towards more sustainable diets. Finally, the fact that the analysis assumes that all the protein assessed is consumed and no food waste is produced poses another limitation.
It should also be acknowledged that food consumption may have changed in recent years in Portugal. Since the IAN-AF was published (2017), the world has faced a global Pandemic. Although the post-Pandemic dietary impacts are yet to be evaluated, according to the 2021 National Food Balance Sheet (2016–2020), the event itself has caused a slight decrease in the availability of meat, seafood, and dairy, when compared to the pre-Pandemic period (2016 to early 2020) [51]. Another noticeable change in animal protein consumption may have occurred as a result of the potential adoption of more flexitarian, vegetarian, and vegan diets. Nevertheless, no official data exist concerning the recent dietary options of the Portuguese population; therefore, it cannot be affirmed with precision whether the food consumption values used are underestimated.
Future work could focus on building new scenarios that also consider vegetarian or plant-based protein replacements and compare those results with the original animal-based scenarios, as well as considering processed foods and food waste. When considering the shift from a meat-based diet to a plant-based diet, the risks of plant-based foods shall be considered in line with recent findings in the literature [52]. Social and economic studies may assist in better comprehending the potential adhesion to each of the mitigation scenarios by the population and by catering or social food services.
Policymakers should address the problems of Portugal’s carbon-intensive diets by alerting the population about it and providing the tools to increase environmental literacy. Some other dimensions shall not be forgotten, for instance, food security and consumer health, optimal nutritional intake, and affordability, to identify effective measures to strategically shift the current consumption based on animal protein towards healthier and sustainable diets.

Supplementary Materials

The following supporting information can be downloaded at: https://www.mdpi.com/article/10.3390/su15065278/s1, Table S1: List and amount of animal protein ingredients included in each of the food categories, for the national consumption [53]; Table S2: Number of lunch and dinner meals served in the faculty canteen, in October 2019 [54]; Table S3: Description of menus served in the faculty canteen (October 2019) [54]; Table S4: Average mass served per food product and other characteristics of the servings per food product, in the faculty canteen (based on [54]); Table S5: Seafood included in the "Other Fish" category from the faculty canteen animal-based protein consumption (based on [54]); Table S6: Conversion factors from Live Weight (LW), Hot Carcass Weight (HCW), or Carcass Weight (CW) to Retail Weight (RW), and from RW to Edible Weight (EW); Table S7: Carbon footprint values taken from the reviewed literature and from the study from Clune et al. (2017) [43]; Table S8: Sensitivity Analysis; Table S9: Introductory note and detailed description of the six carbon footprint mitigation scenarios; Table S10: Overall carbon footprint calculated, per mass of each food product, for the base case and for each scenario assessed (Scenarios 1 to 6)—for the national case and for FEUP's canteen; and Statistical Analysis. References [53,54,55,56,57,58,59,60,61,62,63,64,65,66,67,68,69,70,71,72,73,74,75,76,77,78,79,80,81,82,83,84,85,86,87,88,89,90,91,92,93,94,95,96,97,98,99,100,101,102,103,104,105,106,107,108,109,110,111,112,113,114,115,116,117,118,119,120,121,122,123,124,125,126,127,128,129,130,131,132,133,134,135,136,137,138,139,140,141,142,143,144,145,146,147,148,149,150,151,152,153] are cited in the supplementary materials.

Author Contributions

Conceptualisation, C.F.A.P.d.R., C.d.S.T.P.d.S., R.M.d.S. and B.d.A.F.N.; methodology, C.F.A.P.d.R., C.d.S.T.P.d.S. and R.M.d.S.; validation, C.F.A.P.d.R., C.d.S.T.P.d.S., R.M.d.S., M.J.d.S.O. and B.d.A.F.N.; formal analysis, C.F.A.P.d.R., C.d.S.T.P.d.S. and R.M.d.S.; investigation, C.F.A.P.d.R., C.d.S.T.P.d.S. and R.M.d.S.; resources, B.d.A.F.N.; writing—original draft preparation, C.F.A.P.d.R. and C.d.S.T.P.d.S.; writing—review and editing, M.J.d.S.O. and B.d.A.F.N.; supervision, B.d.A.F.N.; project administration, B.d.A.F.N.; funding acquisition, B.d.A.F.N. All authors have read and agreed to the published version of the manuscript.

Funding

This work was financially supported by LA/P/0045/2020 (ALiCE), UIDB/00511/2020, and UIDP/00511/2020 (LEPABE), funded by national funds through FCT/MCTES (PIDDAC).

Data Availability Statement

Data sharing is not applicable.

Acknowledgments

The authors gratefully acknowledge the research team of the Portuguese National Food, Nutrition and Physical Activity Survey (IAN-AF) 2015–2016 for the data. The IAN-AF 2015–2016 received funding from the EEA Grants Programme, Public Health Initiatives (PT06–000088SI3). The authors would also like to thank the SASUP personnel for providing the data that helped to determine the carbon footprint of the meals consumed at FEUP’s canteen.

Conflicts of Interest

The authors declare no conflict of interest. The sponsors had no role in the design, execution, interpretation, or writing of the study.

References

  1. Clark, A.; Domingo Nina, G.G.; Colgan, K.; Thakrar Sumil, K.; Tilman, D.; Lynch, J.; Azevedo Inês, L.; Hill Jason, D. Global food system emissions could preclude achieving the 1.5° and 2 °C climate change targets. Science 2020, 370, 705–708. [Google Scholar] [CrossRef]
  2. Searchinger, T.; Richard, W. More Rice, Less Methane. Creating a Sustainable Food Future 2014. 2022. Available online: https://www.wri.org/insights/more-rice-less-methane (accessed on 18 January 2022).
  3. Petersen, P.F.; von der Weid, J.M.; Fernandes, G.B. Agroecologia: Reconciliando agricultura e natureza. Inf. Agropecuário 2009, 30, 7–15. [Google Scholar]
  4. Poore, J.; Nemecek, T. Reducing food’s environmental impacts through producers and consumers. Science 2018, 360, 987–992. [Google Scholar] [CrossRef] [Green Version]
  5. Galli, A.; Moreno Pires, S.; Iha, K.; Alves, A.A.; Lin, D.; Mancini, M.S.; Teles, F. Sustainable food transition in Portugal: Assessing the Footprint of dietary choices and gaps in national and local food policies. Sci. Total Environ. 2020, 749, 141307. [Google Scholar] [CrossRef] [PubMed]
  6. Sandström, V.; Valin, H.; Krisztin, T.; Havlík, P.; Herrero, M.; Kastner, T. The role of trade in the greenhouse gas footprints of EU diets. Glob. Food Secur. 2018, 19, 48–55. [Google Scholar] [CrossRef]
  7. UN. Transforming Our World: The 2030 Agenda for Sustainable Development; eSocialSciences: Navi Mumbai, India, 2015. [Google Scholar]
  8. Willett, W.; Rockström, J.; Loken, B.; Springmann, M.; Lang, T.; Vermeulen, S.; Garnett, T.; Tilman, D.; DeClerck, F.; Wood, A.; et al. Food in the Anthropocene: The EAT-Lancet Commission on healthy diets from sustainable food systems. Lancet 2019, 393, 447–492. [Google Scholar] [CrossRef] [PubMed]
  9. Forero-Cantor, G.; Ribal, J.; Sanjuán, N. Levying carbon footprint taxes on animal-sourced foods. A case study in Spain. J. Clean. Prod. 2020, 243, 118668. [Google Scholar] [CrossRef]
  10. Gaillac, R.; Marbach, S. The carbon footprint of meat and dairy proteins: A practical perspective to guide low carbon footprint dietary choices. J. Clean. Prod. 2021, 321, 128766. [Google Scholar] [CrossRef]
  11. Gonera, A.; Svanes, E.; Bugge, A.B.; Hatlebakk, M.M.; Prexl, K.M.; Ueland, Ø. Moving consumers along the innovation adoption curve: A new approach to accelerate the shift toward a more sustainable diet. Sustainability 2021, 13, 4477. [Google Scholar] [CrossRef]
  12. Osei-Owusu, A.K.; Wood, R.; Bjelle, E.L.; Caro, D.; Thomsen, M. Understanding the trends in Denmark’s global food trade-related greenhouse gas and resource footprint. J. Clean. Prod. 2021, 313, 127785. [Google Scholar] [CrossRef]
  13. Broekema, R.; Tyszler, M.; Van ‘T Veer, P.; Kok, F.J.; Martin, A.; Lluch, A.; Blonk, H.T.J. Future-proof and sustainable healthy diets based on current eating patterns in the Netherlands. Am. J. Clin. Nutr. 2020, 112, 1338–1347. [Google Scholar] [CrossRef]
  14. Laine, J.E.; Huybrechts, I.; Gunter, M.J.; Ferrari, P.; Weiderpass, E.; Tsilidis, K.; Aune, D.; Schulze, M.B.; Bergmann, M.; Temme, E.H.M.; et al. Co-benefits from sustainable dietary shifts for population and environmental health: An assessment from a large European cohort study. Lancet Planet. Health 2021, 5, e786–e796. [Google Scholar] [CrossRef]
  15. Ridoutt, B.; Baird, D.; Hendrie, G.A. Diets within environmental limits: The climate impact of current and recommended Australian diets. Nutrients 2021, 13, 1122. [Google Scholar] [CrossRef]
  16. Sáez-Almendros, S.; Obrador, B.; Bach-Faig, A.; Serra-Majem, L. Environmental footprints of Mediterranean versus Western dietary patterns: Beyond the health benefits of the Mediterranean diet. Environ. Health 2013, 12, 118. [Google Scholar] [CrossRef] [Green Version]
  17. Vidal, R.; Moliner, E.; Pikula, A.; Mena-Nieto, A.; Ortega, A. Comparison of the carbon footprint of different patient diets in a Spanish hospital. J. Health Serv. Res. Policy 2014, 20, 39–44. [Google Scholar] [CrossRef]
  18. Saxe, H.; Larsen, T.; Mogensen, L. The global warming potential of two healthy Nordic diets compared with the average Danish diet. Clim. Change 2012, 116, 249–262. [Google Scholar] [CrossRef]
  19. Vázquez-Rowe, I.; Larrea-Gallegos, G.; Villanueva-Rey, P.; Gilardino, A. Climate change mitigation opportunities based on carbon footprint estimates of dietary patterns in Peru. PLoS ONE 2017, 12, e0188182. [Google Scholar] [CrossRef] [PubMed] [Green Version]
  20. van Dooren, C.; Marinussen, M.; Blonk, H.; Aiking, H.; Vellinga, P. Exploring dietary guidelines based on ecological and nutritional values: A comparison of six dietary patterns. Food Policy 2014, 44, 36–46. [Google Scholar] [CrossRef]
  21. Aleksandrowicz, L.; Green, R.; Joy, E.J.M.; Smith, P.; Haines, A. The Impacts of Dietary Change on Greenhouse Gas Emissions, Land Use, Water Use, and Health: A Systematic Review. PLoS ONE 2016, 11, e0165797. [Google Scholar] [CrossRef] [Green Version]
  22. Esteve-Llorens, X.; Dias, A.C.; Moreira, M.T.; Feijoo, G.; González-García, S. Evaluating the Portuguese diet in the pursuit of a lower carbon and healthier consumption pattern. Clim. Chang. 2020, 162, 2397–2409. [Google Scholar] [CrossRef]
  23. Crippa, M.; Solazzo, E.; Guizzardi, D.; Monforti-Ferrario, F.; Tubiello, F.N.; Leip, A. Food systems are responsible for a third of global anthropogenic GHG emissions. Nat. Food 2021, 2, 198–209. [Google Scholar] [CrossRef]
  24. World Resources Institute. Climate Watch Historical Country GHG Emissions. Available online: https://www.climatewatchdata.org/ghg-emissions (accessed on 5 February 2023).
  25. Bento, A. Comer Bem é o Melhor Remédio, 1st ed.; Porto Editora, Ed.; Porto Editora: Porto, Portugal, 2017. [Google Scholar]
  26. Vaz Velho, L.M.; Pinheiro, R.; Rodrigues, A.S. The Atlantic Diet—Origin and features. Int. J. Food Stud. 2016, 5. [Google Scholar] [CrossRef]
  27. Lopes, C.; Torres, D.; Oliveira, A.; Severo, M.; Alarcão, V.; Guiomar, S.; Mota, J.; Teixeira, P.; Rodrigues, S.; Lobato, L.; et al. Inquérito Alimentar Nacional e de Atividade Física, IAN-AF 2015–2016: Relatório de Resultados; Universidade do Porto: Porto, Portugal, 2017. [Google Scholar]
  28. Guillen, J.; Natale, F.; Carvalho, N.; Casey, J.; Hofherr, J.; Druon, J.-N.; Fiore, G.; Gibin, M.; Zanzi, A.; Martinsohn, J.T. Global seafood consumption footprint. Ambio 2019, 48, 111–122. [Google Scholar] [CrossRef] [Green Version]
  29. DGT. Habitat III—National Report Portugal; DGT: Lisboa, Portugal, 2016. [Google Scholar]
  30. FAO. Food Balances (-2013, Old Methodology and Population); FAO: Rome, Italy, 2015. [Google Scholar]
  31. Baptista, P.; Campos, I.; Pires, I.; Vaz, S. Do Campo ao Garfo, Desperdício Alimentar em Portugal; CESTRAS: Lisboa, Portugal, 2012. [Google Scholar]
  32. Heller, M. Food Product Environmental Footprint Literature Summary: Foreword; University of Michigan: Ann Arbor, MI, USA, 2017. [Google Scholar]
  33. Lopes, C.; Torres, D.; Oliveira, A.; Severo, M.; Alarcão, V.; Guiomar, S.; Mota, J.; Teixeira, P.; Ramos, E.; Rodrigues, S.; et al. Inquérito Alimentar Nacional e de Atividade Física, IAN-AF 2015–2016: Relatório Metodológico; University of Porto: Porto, Portugal, 2017. [Google Scholar]
  34. Rodrigues, S.S.P.; Lopes, C.; Naska, A.; Trichopoulou, A.; de Almeida, M.D.V. Comparison of national food supply, household food availability and individual food consumption data in Portugal. J. Public Health 2007, 15, 447–455. [Google Scholar] [CrossRef]
  35. Graça, P.; Gregório, M.J.; Freitas, M.G. A Decade of Food and Nutrition Policy in Portugal (2010–2020). Port. J. Public Health 2020, 38, 94–118. [Google Scholar] [CrossRef]
  36. FEUP. FEUP em Números—2020. Available online: https://sigarra.up.pt/feup/pt/WEB_BASE.GERA_PAGINA?p_pagina=31697 (accessed on 8 March 2022).
  37. Soares, A. Relatório de Atividades e Contas 2020; Serviços de Ação Social da Universidade do Porto: Porto, Portugal, 2021. [Google Scholar]
  38. Greenhouse Gas Protocol. Product Life Cycle Accounting and Reporting Standard; World Business Council for Sustainable Development and World Resource Institute: Geneva, Switzerland, 2011. [Google Scholar]
  39. Martins, I. Tabela da Composição de Alimentos, 1st ed.; Instituto Nacional de Saúde Doutor Ricardo Jorge: Lisboa, Portugal, 2007. [Google Scholar]
  40. Dourmad, J.Y.; Ryschawy, J.; Trousson, T.; Bonneau, M.; Gonzàlez, J.; Houwers, H.W.J.; Hviid, M.; Zimmer, C.; Nguyen, T.L.T.; Morgensen, L. Evaluating environmental impacts of contrasting pig farming systems with life cycle assessment. Animal 2014, 8, 2027–2037. [Google Scholar] [CrossRef] [Green Version]
  41. Macleod, M.; Gerber, P.; Mottet, A.; Tempio, G.; Falcucci, A.; Opio, C.; Vellinga, T.; Henderson, B.; Steinfeld, H. Greenhouse Gas Emissions from Pork and Chicken Supply Chains—A Global Life Cycle Assessment; Food and Agriculture Organization of the United Nations (FAO): Rome, Italy, 2013; Available online: http://www.fao.org/3/a-i3460e.pdf (accessed on 25 February 2022).
  42. Iribarren, D.; Vázquez-Rowe, I.; Hospido, A.; Moreira, M.T.; Feijoo, G. Estimation of the carbon footprint of the Galician fishing activity (NW Spain). Sci. Total Environ. 2010, 408, 5284–5294. [Google Scholar] [CrossRef]
  43. Clune, S.; Crossin, E.; Verghese, K. Systematic review of greenhouse gas emissions for different fresh food categories. J. Clean. Prod. 2017, 140, 766–783. [Google Scholar] [CrossRef] [Green Version]
  44. Programa Operacional Saúde (POS). A Nova Roda dos Alimentos. Available online: https://alimentacaosaudavel.dgs.pt/activeapp2020/wp-content/uploads/2020/01/a-ax433o.pdf (accessed on 25 February 2022).
  45. Britannica, T. Ruminat; Encyclopedia Britannica: Chicago, IL, USA, 2021. [Google Scholar]
  46. TABLE. Monogastric. Available online: https://www.tabledebates.org/glossary/monogastric (accessed on 21 April 2022).
  47. Gregório, M.J.; Sofia, M.d.S.; Diana, T. Programa Nacional para a Promoção da Alimentação Saudável; Direção-Geral de Saúde: Lisboa, Portugal, 2020. [Google Scholar]
  48. de Freitas Porto Mesquita, M.C. A Pegada de Carbono das Refeições Habituais Omnívoras e Vegetarianas em Portugal: Uma Estimativa, Comparação e Análise; Iscte—Instituto Universitário de Lisboa: Lisboa, Portugal, 2021. [Google Scholar]
  49. Seubelt, N.; Michalke, A.; Gaugler, T. Influencing Factors for Sustainable Dietary Transformation—A Case Study of German Food Consumption. Foods 2022, 11, 227. [Google Scholar]
  50. Springmann, M.; Clark, M.A.; Rayner, M.; Scarborough, P.; Webb, P. The global and regional costs of healthy and sustainable dietary patterns: A modelling study. Lancet Planet. Health 2021, 5, e797–e807. [Google Scholar] [CrossRef]
  51. Statistics Portugal. The Portuguese Food Balance Sheet: 2020; Statistics Portugal: Lisboa, Portugal, 2021. [Google Scholar]
  52. Mihalache, O.A.; Dellafiora, L.; Dall’Asta, C. Assessing the Mycotoxin-related Health Impact of Shifting from Meat-based Diets to Soy-based Meat Analogues in a Model Scenario Based on Italian Consumption Data. Expo. Health 2022, 1–15. [Google Scholar] [CrossRef]
  53. Lopes, C.; Torres, D.; Oliveira, A.; Severo, M.; Alarcão, V.; Guiomar, S.; Mota, J.; Teixeira, P.; Rodrigues, S.; Lobato, L.; et al. The Portuguese National Food, Nutrition, and Physical Activity Survey (IAN-AF), 2015-2016. 2017. Available online: https://www.globaldietarydatabase.org/management/microdata-surveys/692 (accessed on 27 March 2022).
  54. Sasup. Cantina de Engenharia. Available online: https://sigarra.up.pt/sasup/en/WEB_BASE.GERA_PAGINA?P_pagina=265490 (accessed on 25 January 2022).
  55. Food and Agriculture Organization of the United Nations (FAO). Report of the Expert Workshop on Greenhouse Gas Emissions Strategies and Methods in Seafood; FAO: Rome, Italy, 2012; p. 117. [Google Scholar]
  56. Williams, A.; Audsley, E.; Sandars, D. Determining the Environmental Burdens and Resource Use in the Production of Agricultural and Horticultural Commodities; Main Report. Defra Research Project IS0205; Cranfield University and Defra: Bedford, UK, 2006. Available online: https://randd.defra.gov.uk/ProjectDetails?ProjectId=11442 (accessed on 21 March 2022).
  57. Phetteplace, H.W.; Johnson, D.E.; Seidl, A.F. Greenhouse gas emissions from simulated beef and dairy livestock systems in the United States. Nutr. Cycl. Agroecosystems 2001, 60, 99–102. [Google Scholar] [CrossRef]
  58. Green Eatz. Food's Carbon Footprint. Available online: https://www.greeneatz.com/foods-carbon-footprint.html (accessed on 15 February 2022).
  59. Gerber, P.J.; Steinfeld, H.; Henderson, B.; Mottet, A.; Opio, C.; Dijkman, J.; Falcucci, A.; Tempio, G. Tackling Climate Change through Livestock: A Global Assessment of Emissions and Mitigation Opportunities; Food and Agriculture Organization of the United Nations (FAO): Rome, Italy, 2013. [Google Scholar]
  60. Mogensen, L.; Kristensen, T.; Nielsen, N.I.; Spleth, P.; Henriksson, M.; Swensson, C.; Hessle, A.; Vestergaard, M. Greenhouse gas emissions from beef production systems in Denmark and Sweden. Livest. Sci. 2015, 174, 126–143. [Google Scholar] [CrossRef]
  61. Capper, J.L. Is the Grass Always Greener? Comparing the Environmental Impact of Conventional, Natural and Grass-Fed Beef Production Systems. Animals 2012, 2, 127–143. [Google Scholar] [CrossRef] [PubMed]
  62. Presumido, P.; Sousa, F.; Gonçalves, A.; Bosco, T.; Feliciano, M. Environmental Impacts of the Beef Production Chain in the Northeast of Portugal Using Life Cycle Assessment. Agriculture 2018, 8, 165. [Google Scholar] [CrossRef] [Green Version]
  63. Casey, J.W.; Holden, N.M. Greenhouse gas emissions from conventional, agri-environmental scheme, and organic Irish suckler-beef units. J Environ. Qual 2006, 35, 231–239. [Google Scholar] [CrossRef]
  64. Weiss, F.; Leip, A. Greenhouse gas emissions from the EU livestock sector: A life cycle assessment carried out with the CAPRI model. Agric. Ecosyst. Environ. 2012, 149, 124–134. [Google Scholar] [CrossRef]
  65. Joint Research Centre; Institute for Prospective Technological Studies; Delgado, L.; Weidema, B.; Eder, P. Environmental Improvement Potentials of Meat and Dairy Products; Publications Office: Luxembourg, 2008. [Google Scholar]
  66. Cederberg, C.; Flysjö, A.; Sonesson, U.; Sund, V.; Davis, J. Greenhouse Gas Emissions from Swedish Consumption of Meat, Milk and Eggs 1990 and 2005 (SIK Report No794); The Swedish Institute for Food and Biotechnology: Gothenburg, Sweden, 2009. [Google Scholar]
  67. Roer, A.-G.; Johansen, A.; Bakken, A.K.; Daugstad, K.; Fystro, G.; Strømman, A.H. Environmental impacts of combined milk and meat production in Norway according to a life cycle assessment with expanded system boundaries. Livest. Sci. 2013, 155, 384–396. [Google Scholar] [CrossRef]
  68. Foley, P.A.; Crosson, P.; Lovett, D.K.; Boland, T.M.; O’Mara, F.P.; Kenny, D.A. Whole-farm systems modelling of greenhouse gas emissions from pastoral suckler beef cow production systems. Agric. Ecosyst. Environ. 2011, 142, 222–230. [Google Scholar] [CrossRef]
  69. Beauchemin, K.A.; Janzen, H.H.; Little, S.M.; McAllister, T.A.; McGinn, S.M. Mitigation of greenhouse gas emissions from beef production in western Canada—Evaluation using farm-based life cycle assessment. Anim. Feed. Sci. Technol. 2011, 166–167, 663–677. [Google Scholar] [CrossRef]
  70. Pelletier, N.; Pirog, R.; Rasmussen, R. Comparative life cycle environmental impacts of three beef production strategies in the Upper Midwestern United States. Agric. Syst. 2010, 103, 380–389. [Google Scholar] [CrossRef]
  71. Peters, G.M.; Rowley, H.V.; Wiedemann, S.; Tucker, R.; Short, M.D.; Schulz, M. Red Meat Production in Australia: Life Cycle Assessment and Comparison with Overseas Studies. Environ. Sci. Technol. 2010, 44, 1327–1332. [Google Scholar] [CrossRef] [PubMed]
  72. Stackhouse-Lawson, K.; Rotz, C.A.; Oltjen, J.; Mitloehner, F. Carbon footprint and ammonia emissions of California beef production systems. J. Anim. Sci. 2012, 90, 4556–4665. [Google Scholar] [CrossRef] [Green Version]
  73. De Vries, M.; van Middelaar, C.E.; de Boer, I.J.M. Comparing environmental impacts of beef production systems: A review of life cycle assessments. Livest. Sci. 2015, 178, 279–288. [Google Scholar] [CrossRef]
  74. Wiedemann, S.G.; McGahan, E.; Grist, S.; Grant, T. Environmental assessment of two pork supply chains using life cycle assessment. In Proceedings of the 7th international Conference on life Cycle Assessment in the Agri-Food Sector (LCA Food 2010), Bari, Italy, 22–24 September 2010; pp. 227–232. [Google Scholar]
  75. Hamerschlag, K. Meat Eater´s Guide: Report 2011; Environmental Working Group: Washington, DC, USA, 2011. [Google Scholar]
  76. Audsley, E.; Brander, M.; Chatterton, J.; Murphy-Bokern, D.; Webster, C.; Williams, A. How Low Can We Go? An assessment of Greenhouse Gas Emissions from the UK Food System and the Scope for to Reduction Them by 2050. Available online: https://dspace.lib.cranfield.ac.uk/handle/1826/6503 (accessed on 25 March 2022).
  77. Jeswani, H.K.; Espinoza-Orias, N.; Croker, T.; Azapagic, A. Life cycle greenhouse gas emissions from integrated organic farming: A systems approach considering rotation cycles. Sustain. Prod. Consum. 2018, 13, 60–79. [Google Scholar] [CrossRef] [Green Version]
  78. Dalgaard, R.; Halberg, N.; Hermansen, J.E. Danish pork production An environmental assessment. Grøn Viden 2007. Available online: https://dcapub.au.dk/djfpdf/djfhus82.pdf (accessed on 19 March 2022).
  79. Reckmann, K.; Traulsen, I.; Krieter, J. Life Cycle Assessment of pork production: A data inventory for the case of Germany. Livest. Sci. 2013, 157, 586–596. [Google Scholar] [CrossRef]
  80. Basset-Mens, C.; van der Werf, H.M.G. Scenario-based environmental assessment of farming systems: The case of pig production in France. Agric. Ecosyst. Environ. 2005, 105, 127–144. [Google Scholar] [CrossRef]
  81. Rougoor, C.; Elfrink, E.; Lap, T.; Balkema, A. LCA of Dutch pork, assessment of three pork production systems in the Netherlands. In Global and Local Food Assessment: A Multidimensional Performance-Based Approach; Centre for Agriculture and Environment (CLM): Culemborg, The Netherlands, 2015; Available online: https://www.clm.nl/wp-content/uploads/2021/09/glamur-wp3-dutch-pork.pdf (accessed on 20 March 2022).
  82. Lesschen, J.P.; van den Berg, M.; Westhoek, H.J.; Witzke, H.P.; Oenema, O. Greenhouse gas emission profiles of European livestock sectors. Anim. Feed. Sci. Technol. 2011, 166–167, 16–28. [Google Scholar] [CrossRef]
  83. McAuliffe, G.A.; Chapman, D.V.; Sage, C.L. A thematic review of life cycle assessment (LCA) applied to pig production. Environ. Impact Assess. Rev. 2016, 56, 12–22. [Google Scholar] [CrossRef]
  84. Cederberg, C.; Flysjö, A. Environmental Assessment of Future Pig Farming System, Quantification of Three Scenarios from the Food 21 Synthesis Work; 723; SIK–The Swedish Institute for Food and Biotechnology: Gothenburg, Sweden, 2004; pp. 1–54. [Google Scholar]
  85. Reckmann, K.; Traulsen, I.; Krieter, J. Environmental Impact Assessment—Methodology with special emphasis on European pork production. J. Environ. Manag. 2012, 107, 102–109. [Google Scholar] [CrossRef]
  86. Bava, L.; Zucali, M.; Sandrucci, A.; Tamburini, A. Environmental impact of the typical heavy pig production in Italy. J. Clean. Prod. 2017, 140, 685–691. [Google Scholar] [CrossRef]
  87. González-García, S.; Belo, S.; Dias, A.C.; Rodrigues, J.V.; Costa, R.R.d.; Ferreira, A.; Andrade, L.P.d.; Arroja, L. Life cycle assessment of porkmeat production: Portuguese case study and proposal of improvement options. J. Clean. Prod. 2015, 100, 126–139. [Google Scholar] [CrossRef]
  88. Mackenzie, S.; Leinonen, I.; Ferguson, N.; Kyriazakis, I. Accounting for uncertainty in the quantification of the environmental impacts of Canadian pig farming systems. J. Anim. Sci. 2015, 93, 3130–3143. [Google Scholar] [CrossRef] [PubMed] [Green Version]
  89. Nguyen, T.L.T.; Hermansen, J.E.; Mogensen, L. Fossil energy and GHG saving potentials of pig farming in the EU. Energy Policy 2010, 38, 2561–2571. [Google Scholar] [CrossRef]
  90. Vergé, X.P.C.; Dyer, J.A.; Desjardins, R.L.; Worth, D. Greenhouse gas emissions from the Canadian pork industry. Livest. Sci. 2009, 121, 92–101. [Google Scholar] [CrossRef]
  91. Noya, I.; Villanueva-Rey, P.; González-García, S.; Fernandez, M.D.; Rodriguez, M.R.; Moreira, M.T. Life Cycle Assessment of pig production: A case study in Galicia. J. Clean. Prod. 2017, 142, 4327–4338. [Google Scholar] [CrossRef]
  92. Lamnatou, C.; Ezcurra-Ciaurriz, X.; Chemisana, D.; Plà, L. Environmental assessment of a pork-production system in North-East of Spain focusing on life-cycle swine nutrition. J. Clean. Prod. 2016, 137, 105–115. [Google Scholar] [CrossRef] [Green Version]
  93. Baumgartner, D.; De Baan, L.; Nemecek, T. European grain legumes—Environment-friendly animal feed? Life cycle assessment of pork, chicken meat, egg and milk production. Final Rep. WP2 2008, 2, 112. [Google Scholar]
  94. Winkler, T.; Schopf, K.; Aschemann, R.; Winiwarter, W. From farm to fork—A life cycle assessment of fresh Austrian pork. J. Clean. Prod. 2016, 116, 80–89. [Google Scholar] [CrossRef] [Green Version]
  95. Kalhor, T.; Rajabipour, A.; Akram, A.; Sharifi, M. Environmental impact assessment of chicken meat production using life cycle assessment. Inf. Process. Agric. 2016, 3, 262–271. [Google Scholar] [CrossRef] [Green Version]
  96. Leinonen, I.; Williams, A.G.; Wiseman, J.; Guy, J.; Kyriazakis, I. Predicting the environmental impacts of chicken systems in the United Kingdom through a life cycle assessment: Broiler production systems. Poult Sci 2012, 91, 8–25. [Google Scholar] [CrossRef]
  97. López-Andrés, J.J.; Aguilar-Lasserre, A.A.; Morales-Mendoza, L.F.; Azzaro-Pantel, C.; Pérez-Gallardo, J.R.; Rico-Contreras, J.O. Environmental impact assessment of chicken meat production via an integrated methodology based on LCA, simulation and genetic algorithms. J. Clean. Prod. 2018, 174, 477–491. [Google Scholar] [CrossRef] [Green Version]
  98. Cesari, V.; Zucali, M.; Sandrucci, A.; Tamburini, A.; Bava, L.; Toschi, I. Environmental impact assessment of an Italian vertically integrated broiler system through a Life Cycle approach. J. Clean. Prod. 2017, 143, 904–911. [Google Scholar] [CrossRef]
  99. Prudêncio da Silva, V.; van der Werf, H.M.G.; Soares, S.R.; Corson, M.S. Environmental impacts of French and Brazilian broiler chicken production scenarios: An LCA approach. J. Environ. Manag. 2014, 133, 222–231. [Google Scholar] [CrossRef]
  100. Payandeh, Z.; Kheiralipour, K.; Karimi, M.; Khoshnevisan, B. Joint data envelopment analysis and life cycle assessment for environmental impact reduction in broiler production systems. Energy 2017, 127, 768–774. [Google Scholar] [CrossRef]
  101. Skunca, D.; Tomasevic, I.; Nastasijevic, I.; Tomovic, V.; Djekic, I. Life cycle assessment of the chicken meat chain. J. Clean. Prod. 2018, 184, 440–450. [Google Scholar] [CrossRef]
  102. Ibidhi, R.; Hoekstra, A.Y.; Gerbens-Leenes, P.W.; Chouchane, H. Water, land and carbon footprints of sheep and chicken meat produced in Tunisia under different farming systems. Ecol. Indic. 2017, 77, 304–313. [Google Scholar] [CrossRef]
  103. Léger-Dionne, A.; Charron-Doucet, F.; Clément, E. Life Cycle Assessment of Sheep Production in Ontario. 2017. Available online: https://www.ontariosheep.org/uploads/userfiles/files/Life%20Cycle%20Analysis%20project%20final%20report%20October%202017.pdf (accessed on 27 March 2022).
  104. AEA; Cranfield University; Ed Moorhouse; Paul Watkiss Associates; AHDBMS; Marintek. Comparative Life-Cycle Assessment of Food Commodities Procured for UK Consumption through a Diversity of Supply Chains; Cranfield University: Cranfield, UK, 2008. Available online: http://randd.defra.gov.uk/Default.aspx?Module=More&Location=None&ProjectID=15001 (accessed on 20 March 2022).
  105. Wallman, M.; Cederberg, C.; Sonesson, U. Life Cycle Assessment of Swedish Lamb Production; SIK—The Swedish Institute for Food and Biotechnology: Gothenburg, Sweden, 2011. [Google Scholar]
  106. Ledgard, S.F.; Lieffering, M.; McDevitt, J.; Boyes, M.; Kemp, R. A Greenhouse Gas Footprint Study for Exported New Zealand Lamb; Agresearch. 2010. Available online: https://www.mia.co.nz/assets/MIA-Publications/Greenhouse-gas-footprint-study-for-exported-NZ-lamb.-March-2010.pdf (accessed on 25 March 2022).
  107. Taylor, R.; Jones, A.; Edwards-Jones, G. Measuring holistic carbon footprints for lamb and beef farms in the Cambrian Mountains Initiative. Policy Research Report; Countryside Council for Wales: Wales, UK, 2010. [Google Scholar]
  108. Wiltshire, J.; Wynn, S.; Clarke, J.; Chambers, B.; Cottrill, B.; Drakes, D.; Foster, C. Scenario Building to Test and Inform the Development of a BSI Method for Assessing Greenhouse Gas Emissions from Food; Agricultural Development and Advisory Service (ADAS): Helsby, UK, 2009; Available online: https://adas.co.uk/wp-content/uploads/2021/01/FO0404_8543_TRP-1.pdf (accessed on 24 March 2022).
  109. Wiedemann, S.G.; Ledgard, S.F.; Henry, B.K.; Yan, M.-J.; Mao, N.; Russell, S.J. Application of life cycle assessment to sheep production systems: Investigating co-production of wool and meat using case studies from major global producers. Int. J. Life Cycle Assess. 2015, 20, 463–476. [Google Scholar] [CrossRef] [Green Version]
  110. Gac, A.; Ledgard, S.; Lorinquer, E.; Boyes, M.; Le Gall, A. Carbon footprint of sheep farms in France and New Zealand and methodology analysis. In Proceedings of the Proceedings of the 8th International Conference on Life Cycle Assessment in the Agri-Food Sector, Saint-Malo, France, 1–4 October 2012; pp. 310–314. [Google Scholar]
  111. Ripoll-Bosch, R.; de Boer, I.J.M.; Bernués, A.; Vellinga, T.V. Accounting for multi-functionality of sheep farming in the carbon footprint of lamb: A comparison of three contrasting Mediterranean systems. Agric. Syst. 2013, 116, 60–68. [Google Scholar] [CrossRef]
  112. Bell, M.J.; Eckard, R.J.; Cullen, B.R. The effect of future climate scenarios on the balance between productivity and greenhouse gas emissions from sheep grazing systems. Livest. Sci. 2012, 147, 126–138. [Google Scholar] [CrossRef]
  113. Dyer, J.; Vergé, X.; Desjardins, R.; Worth, D. A Comparison of the Greenhouse Gas Emissions From the Sheep Industry With Beef Production in Canada. Sustain. Agric. Res. 2014, 3, 65–75. [Google Scholar] [CrossRef] [Green Version]
  114. O'Brien, D.; Bohan, A.; McHugh, N.; Shalloo, L. A life cycle assessment of the effect of intensification on the environmental impacts and resource use of grass-based sheep farming. Agric. Syst. 2016, 148, 95–104. [Google Scholar] [CrossRef]
  115. Jones, A.K.; Jones, D.L.; Cross, P. The carbon footprint of lamb: Sources of variation and opportunities for mitigation. Agric. Syst. 2014, 123, 97–107. [Google Scholar] [CrossRef]
  116. Ponsioen, T.C.; Blonk, T.J. Calculating land use change in carbon footprints of agricultural products as an impact of current land use. J. Clean. Prod. 2012, 28, 120–126. [Google Scholar] [CrossRef]
  117. Vergé, X.P.C.; Dyer, J.A.; Desjardins, R.L.; Worth, D. Long-term trends in greenhouse gas emissions from the Canadian poultry industry. J. Appl. Poult. Res. 2009, 18, 210–222. [Google Scholar] [CrossRef]
  118. Leinonen, I.; Williams, A.G.; Kyriazakis, I. Comparing the environmental impacts of UK turkey production systems using analytical error propagation in uncertainty analysis. J. Clean. Prod. 2016, 112, 141–148. [Google Scholar] [CrossRef]
  119. Ziegler, F.; Winther, U.; Hognes, E.S.; Emanuelsson, A.; Sund, V.; Ellingsen, H. The Carbon Footprint of Norwegian Seafood Products on the Global Seafood Market. J. Ind. Ecol. 2013, 17, 103. [Google Scholar] [CrossRef]
  120. Zened, A.; Méda, B.; Ponchant, P.; Wilfart, A.; Arroyo, J.; Gidenne, T.; Combes, S.; Fortun-Lamothe, L. Conséquences d’une restriction alimentaire chez le lapereau sevré sur les impacts environnementaux de la production de viande de lapin. In Proceedings of the 15èmes Journées de la Recherche Cunicole, Le Mans, France, 19–20 November 2013; pp. 141–144. [Google Scholar]
  121. Aubin, J. Empreinte environnementale de la viande et des produits carnés. Viandes Prod. Carnés 2014, 30, 1–7. [Google Scholar]
  122. Svanes, E.; Vold, M.; Hanssen, O. Environmental assessment of cod (Gadus Morhua) from autoline fisheries. Int. J. Life Cycle Assess. 2011, 16, 611–624. [Google Scholar] [CrossRef]
  123. Sund, V. Environmental Assessment of Northeast Arctic Cod Caught by Long-Lines and Alaska Pollock Caught by Pelagic Trawls; SIK–The Swedish Institute for Food and Biotechnology: Gothenburg, Sweden, 2009. [Google Scholar]
  124. Hospido, A.; Tyedmers, P. Life cycle environmental impacts of Spanish tuna fisheries. Fish. Res. 2005, 76, 174–186. [Google Scholar] [CrossRef]
  125. Almeida, C.; Vaz, S.; Ziegler, F. Environmental Life Cycle Assessment of a Canned Sardine Product from Portugal. J. Ind. Ecol. 2015, 19, 607–617. [Google Scholar] [CrossRef]
  126. Seafish. Greenhouse Gas Emissions in Seafood; Seafish: Grimsby, UK, 2008. [Google Scholar]
  127. Cao, L.; Diana, J.S.; Keoleian, G.A.; Lai, Q. Life Cycle Assessment of Chinese Shrimp Farming Systems Targeted for Export and Domestic Sales. Environ. Sci. Technol. 2011, 45, 6531–6538. [Google Scholar] [CrossRef] [PubMed]
  128. Mungkung, R. Shrimp Aquaculture in Thailand: Application of Life Cycle Assesment to Support Sustainable Development; University of Surrey: Guildford, UK, 2005. [Google Scholar]
  129. Djekic, I.; Miocinovic, J.; Tomasevic, I.; Smigic, N.; Tomic, N. Environmental life-cycle assessment of various dairy products. J. Clean. Prod. 2014, 68, 64–72. [Google Scholar] [CrossRef]
  130. González-García, S.; Castanheira, É.G.; Dias, A.C.; Arroja, L. Using Life Cycle Assessment methodology to assess UHT milk production in Portugal. Sci. Total Environ. 2013, 442, 225–234. [Google Scholar] [CrossRef] [PubMed]
  131. Thomassen, M.A.; de Boer, I.J.M. Evaluation of indicators to assess the environmental impact of dairy production systems. Agric. Ecosyst. Environ. 2005, 111, 185–199. [Google Scholar] [CrossRef]
  132. Salou, T.; Espagnol, S.; Gac, A.; Ponchant, P.; Tocqueville, A.; Colomb, V.; van der Werf, H.M. Life Cycle Assessment of French livestock products: Results of the AGRIBALYSE® program. In Proceedings of the 9th International Conference on Life Cycle Assessment in the Agri-Food Sector (LCA Food 2014), San Francisco, CA, USA, 8–10 October 2014; pp. 1154–1162. [Google Scholar]
  133. Haas, G.; Wetterich, F.; Köpke, U. Comparing intensive, extensified and organic grassland farming in southern Germany by process life cycle assessment. Agric. Ecosyst. Environ. 2000, 83, 43–53. [Google Scholar] [CrossRef] [Green Version]
  134. Vergé, X.P.C.; Maxime, D.; Dyer, J.A.; Desjardins, R.L.; Arcand, Y.; Vanderzaag, A. Carbon footprint of Canadian dairy products: Calculations and issues. J. Dairy Sci. 2013, 96, 6091–6104. [Google Scholar] [CrossRef] [PubMed] [Green Version]
  135. Kim, D.; Thoma, G.; Nutter, D.; Milani, F.; Ulrich, R.; Norris, G. Life cycle assessment of cheese and whey production in the USA. Int. J. Life Cycle Assess. 2013, 18, 1019–1035. [Google Scholar] [CrossRef] [Green Version]
  136. Santos, H.C.M.; Maranduba, H.L.; de Almeida Neto, J.A.; Rodrigues, L.B. Life cycle assessment of cheese production process in a small-sized dairy industry in Brazil. Environ. Sci. Pollut. Res. 2017, 24, 3470–3482. [Google Scholar] [CrossRef]
  137. Broekema, R.; Kramer, G. LCA of Dutch Semi-Skimmed Milk and Semi-Mature Cheese. 2014. Available online: https://website-production-s3bucket-1nevfd7531z8u.s3.eu-west-1.amazonaws.com/public/website/download/919fd091-1ff7-485f-844b-241d14b7b510/FrieslandCampina-LCA-milk-cheese-C0.5.pdf (accessed on 20 March 2022).
  138. Flysjö, A.; Thrane, M.; Hermansen, J.E. Method to assess the carbon footprint at product level in the dairy industry. Int. Dairy J. 2014, 34, 86–92. [Google Scholar] [CrossRef]
  139. Finnegan, W.; Goggins, J.; Clifford, E.; Zhan, X. Global warming potential associated with dairy products in the Republic of Ireland. J. Clean. Prod. 2017, 163, 262–273. [Google Scholar] [CrossRef]
  140. Berlin, J. Environmental life cycle assessment (LCA) of Swedish semi-hard cheese. Int. Dairy J. 2002, 12, 939–953. [Google Scholar] [CrossRef]
  141. Vasilaki, V.; Katsou, E.; Ponsá, S.; Colón, J. Water and carbon footprint of selected dairy products: A case study in Catalonia. J. Clean. Prod. 2016, 139, 504–516. [Google Scholar] [CrossRef]
  142. Belo, S.; Dias, A.C.; Trindade, H.; Almeida, J.; Andrade, L.; Arroja, L. Using life cycle assessment to assess yogurt production. In Proceedings of the EfS 2015—2nd Energy for Sustainability Multidisciplinary Conference, Coimbra, Portugal, 14–15 May 2015. [Google Scholar]
  143. Ghasempour, A.; Ahmadi, E. Assessment of environment impacts of egg production chain using life cycle assessment. J. Environ. Manag. 2016, 183, 980–987. [Google Scholar] [CrossRef]
  144. Van Asselt, E.D.; van Bussel, L.G.; van Horne, P.; van der Voet, H.; van der Heijden, G.W.; van der Fels-Klerx, H.J. Assessing the sustainability of egg production systems in The Netherlands. Poult. Sci. 2015, 94, 1742–1750. [Google Scholar] [CrossRef] [PubMed]
  145. Leinonen, I.; Kyriazakis, I. Quantifying the environmental impacts of UK broiler and egg production systems. Lohmann Inf. 2013, 48, 45–50. [Google Scholar]
  146. Nielsen, N.I.; Jørgensen, M.; Rasmussen, I.K. Greenhouse Gas Emission from Danish Organic Egg Production estimated via LCA Methodology; Knowledge Centre for Agriculture: Aarhus, Denmark, 2013. [Google Scholar]
  147. Abín, R.; Laca, A.; Díaz, M. Environmental assesment of intensive egg production: A Spanish case study. J. Clean. Prod. 2018, 179, 160–168. [Google Scholar] [CrossRef]
  148. Dekker, S.E.M.; de Boer, I.J.M.; van Krimpen, M.; Aarnink, A.J.A.; Groot Koerkamp, P.W.G. Effect of origin and composition of diet on ecological impact of the organic egg production chain. Livest. Sci. 2013, 151, 271–283. [Google Scholar] [CrossRef]
  149. Wiedemann, S.; McGahan, E. Environmental Assessment of An Egg Production Supply Chain Using Life Cycle Assessment. Australian Egg Corporation Limited: Sydney, Australia, 2011. [Google Scholar]
  150. Taylor, R.C.; Omed, H.; Edwards-Jones, G. The greenhouse emissions footprint of free-range eggs. Poult. Sci. 2014, 93, 231–237. [Google Scholar] [CrossRef]
  151. Nijdam, D.; Rood, T.; Westhoek, H. The price of protein: Review of land use and carbon footprints from life cycle assessments of animal food products and their substitutes. Food Policy 2012, 37, 760–770. [Google Scholar] [CrossRef]
  152. Holland, R.; Loveday, D.; Ferguson, K. How Much Meat to Expect from a Beef Carcass; University of Tennessee Institute of Agriculture Extension Publication: Tennessee, TN, USA, 2014. [Google Scholar]
  153. Sukhatme, P. Technical conversion factors for agricultural commodities; FAO: Rome, Italy, 1960. [Google Scholar]
Figure 1. Portuguese food consumption of animal-based proteins by the adult population based on average daily meal data collected by the IAN-AF between October 2015 and December 2016.
Sustainability 15 05278 g001
Figure 2. Total consumption of animal-based proteins served during lunchtime at the canteen of the Faculty of Engineering (University of Porto). Data provided by the SASUP.
Sustainability 15 05278 g002
Figure 3. Average, minimum, and maximum carbon footprint values (in kg CO2 eq/kg edible food) for single food products, based on single values (see Table S7).
Sustainability 15 05278 g003
Figure 4. Carbon footprint of Portugal’s consumption of animal protein sources.
Sustainability 15 05278 g004
Figure 5. Carbon footprint of the animal-based lunch meals served in FEUP’s canteen in October 2019.
Sustainability 15 05278 g005
Table 1. Sensitivity analysis results (based on Table S8).
Food GroupCarbon Footprint of National Consumption
(kg CO2 eq/[Cap⋅Day])
Fraction of the Total Consumption
Edible Yield Considered for Each Food Item
AverageMaximumMinimum
Meat2.071.682.6140%
Eggs0.065%
Dairy0.2839%
Seafood0.230.230.2415%
Total2.632.253.19100%
Table 2. Synthesised description of the six carbon footprint mitigation scenarios.
ScenarioDescription
1—Adoption of the national guidelines with recommendations for meat, seafood, dairy and eggs consumptionThe consumption of “dairy products” and “meat, seafood, and eggs” complies with the national dietary guidelines established in the National Food Wheel [44], which results in a reduction from the current values of 24 and 17%, respectively, to the recommended values of 18 and 5%.
2—Beef consumption is halved50% reduction in the consumption of beef and its replacement with any other type of animal-based proteins considered in this study (excluding dairy).
3—Total replacement of beefFull replacement of beef with the other types of meat under study.
4—Total replacement of red meat with white meatBeef, pork, and sheep and goat (red meat) are fully replaced with turkey, chicken, and rabbit (white meat), which have a lower carbon footprint (on average).
5—Total replacement of all types of meat with seafoodMeat is fully replaced with all types of seafood consumed in each case study.
6—Total replacement of all types of meat with eggsMeat is replaced with eggs.
Table 3. Carbon footprint reduction scenarios for consumption at the national level and in the faculty canteen.
ScenarioCarbon Footprint Reduction
National ConsumptionConsumption in the
Faculty Canteen
1—Adoption of the national guidelines with recommendations for meat, seafood, dairy and eggs consumption53%-
2—Beef consumption is halved16%16%
3—Total replacement of beef29%32%
4—Total replacement of red meat with white meat33%32%
5—Total replacement of all types of meat with seafood55%59%
6—Total replacement of all types of meat with eggs62%71%
Disclaimer/Publisher’s Note: The statements, opinions and data contained in all publications are solely those of the individual author(s) and contributor(s) and not of MDPI and/or the editor(s). MDPI and/or the editor(s) disclaim responsibility for any injury to people or property resulting from any ideas, methods, instructions or products referred to in the content.

