Article

Comparison of the Antioxidant Power of Extracts of the Red vs. Yellow Nephelium lappaceum Variety

by
Mariana Diaz Rojas
1,
Aldo Alvarez-Risco
2,
Alejandra Eugenia Loáiciga González
1,
Eduardo Arguedas Chaverri
1,
Lissette Rodríguez Yebra
1,
Shyla Del-Aguila-Arcentales
3,* and
Jaime A. Yáñez
4
1
Facultad de Farmacia, Universidad de Iberoamerica, San Jose 11303, Costa Rica
2
Carrera de Negocios Internacionales, Facultad de Ciencias Empresariales y Económicas, Universidad de Lima, Lima 15023, Peru
3
Escuela de Posgrado, Universidad San Ignacio de Loyola, Lima 15024, Peru
4
Vicerrectorado de Investigación, Universidad Norbert Wiener, Lima 15108, Peru
*
Author to whom correspondence should be addressed.
Sustainability 2023, 15(6), 5188; https://doi.org/10.3390/su15065188
Submission received: 22 November 2022 / Revised: 3 February 2023 / Accepted: 20 February 2023 / Published: 15 March 2023
(This article belongs to the Special Issue Achieving Sustainable Development Goals in COVID-19 Pandemic Times)

Abstract

:
Nephelium lappaceum L., also known as “Chinese mamon” (mamon chino) or “rambutan”, is an exotic fruit of tropical climate with a sweet flavor and aroma, which can be found in the territory of Costa Rica in the Brunca and Huetar Atlántica regions. For the comparison of antioxidants, different electronic tests were carried out with the red peel and the yellow peel of Nephelium lappaceum, taking ascorbic acid as a base. In addition, Nephelium lappaceum peels, due to their antioxidant properties, allowed the identification of the active components and their antioxidant activity by thin layer chromatography and DPPH tests. The results of these tests show the presence of flavonoids, coumarins, glycosides, and carotenoids, which are the primary metabolites of Nephelium lappaceum peels.

1. Introduction

Nephelium lappaceum L. [1,2], better known as “rambutan” [3,4] or “Chinese mamon” (chino mamon) [5], is a fruit native to Indonesia [6]. This fruit is cultivated in South-East Asia, mainly in Indonesia, India, Finland, and Malaysia. The rambutan is a tropical fruit known for its sweet flavor, oval shape, juiciness, brown seed, white flesh, and softness [7]. The tree is about 12 to 20 m high, and its red or yellow skin is covered by soft thorns [8].
In addition, the Nephelium lappaceum has excellent antioxidant power [9,10,11,12,13,14]. Costa Rica has all the soil and climatic conditions necessary to produce this fruit, which favors large-scale planting. The most significant Nephelium lappaceum at a national level is in the Brunca and Huetar Atlántica regions; this large production has put the country in a better position in Central America. The rambutan harvest time starts in July and ends in October [15].
It is necessary to study all the compounds that can protect the body against substances that cause oxidative damage that is caused by different free radicals [16,17,18] and, thus, to know antioxidants such as vitamin C, carotenoids, and different polyphenolic compounds found in plant substances with antioxidant properties, is of great importance [19,20,21]. Nephelium lappaceum seeds have polyphenols and fats that provide nutritious minerals and healing quality [22,23,24].
Then, based on the research in the practical part for the comparisons of the antioxidant power of the red shell against the yellow shell of Nephelium lappaceum, it is determined through the realization of extractions and identification of secondary metabolites, using a thin layer chromatography and different methods of electronic studies, such as UV spectroscopy, and IR spectroscopy, among others.
In addition, during this process, the antioxidant capacity of ascorbic acid has been taken as a basis to determine whether Nephelium lappaceum has a higher antioxidant power against Vitamin C and, in turn, identify which of the two Nephelium lappaceum peels has a higher antioxidative concentration. Free radicals are different atoms or groups of atoms with a free electron and are, therefore, very reactive, as they tend to capture an electron from a molecule to achieve electrochemical stability [25,26]. Oxidative stress is the imbalance between the production of different free radicals and the capacity of the organism to neutralize them before causing any damage [27,28,29]. The evidence confirms that free radicals and the set of different reactive species are associated with the central role in the homeostatic balance, which is the normal functioning of the different regulatory mechanisms.
In the case of antioxidants, they can be found in the different parts of a plant, in the peel of Nephelium lappaceum, and are characterized by having hydroxyl groups linked together by benzene rings [30,31]. The antioxidant capacities that Nephelium lappaceum has in the red and yellow peel are of great importance for our research since it is a waste with an excellent opportunity to use and take advantage to obtain a pharmaceutical product with beneficial qualities to counteract and combat oxidative stress in humans and to improve the quality of life. Consuming it helps the body protect itself against possible radical agents that cause an imbalance that favors a series of processes leading to cell death, thus preventing the development and occurrence of diseases, such as cancer and cardiovascular and immunological problems, among others.
The objective of the current study is to compare the antioxidant activity of red-shelled and yellow-shelled Nephelium lappaceum with vitamin C by DPPH assay.

2. Description of Nephelium lappaceum

2.1. Origin and Distribution

Nephelium lappaceum L., also known as Rambutan, is a fruit native to the Asian continent, cultivated in Indonesia, Malaysia, Thailand, Vietnam, India, and the Philippines, first introduced in Indonesia in 1912 [32]. In this country, it has been used for fresh and industrial processes.
The name comes from the Malaysian word “rambut”, which means hair [33], referring to the soft peel that covers the fruit and is one of the main characteristics that distinguishes it from its consumers. This fruit belongs to the Sapindaceae family [34,35], including about 150 genera and about 2000 species of trees, shrubs, and herbaceous plants [36]. The Nephelium lappaceum family is known mainly through other species that produce edible fruits and have long been cultivated in the areas of origin.
The first consumption of this fruit occurred between the 1950s and 1960s in Mexico and Central America; initially, this crop was kept as an exotic and ornamental plant [37]. Nephelium lappaceum is cultivated in different tropical areas of the world, such as Colombia, Ecuador, Honduras, Mexico, Cuba, and Costa Rica; the cultivation of Nephelium lappaceum was introduced in the 1960s by the transnational banana company United Fruit Company [6].

2.2. Botanical Description

The Nephelium lappaceum tree has free growth that can have a height of 15 to 20 m [38], and when grafted, trees reach a height of 5 to 7 cm with a thickness of 60 cm in diameter; the flowers are greenish–white with small short and thin pedicels. The fruits of Nephelium lappaceum are oval and with a scale of colors ranging from light to intense, for example, from red to yellow [8].
Nephelium lappaceum is a sweet fruit with white flesh that comes off quickly and is large [39]. Different varieties of Nephelium lappaceum are cultivated in Costa Rica; the variety R134 is characterized by the type of growth and rounded shape [15]. The varieties R162 and R167 have common characteristics; for example, they are oval fruits with red skin, but part of the spines is yellow, and these varieties weigh between 34 and 42 g with a soluble solids content of approximately 20 g.

2.3. Cultivation Zones and Climate for Nephelium lappaceum Production in Costa Rica

In Costa Rica, the main rambutan growing areas are in the Brunca region, which includes Pérez Zeledón, Osa, Golfito, Coto Brus, Corredores, Buenos Aires, Huetar Norte region, San Carlos, Upala, and finally, the Huetar Atlántica region in the Valle de la Estrella, Bataan, Pococí, and Sarapiquí [40]. The planting settled in these areas due to their humid tropical climate being very similar to the country of origin. The Nephelium lappaceum should grow at an ideal temperature of 26–32 °C, with good lighting throughout the year as it is essential for fruit ripening, and with humidity of over 70% to ensure its quality as it is not exposed to dehydration [41].

3. Materials and Methods

3.1. Methods of Substance Separation

A separation process allows to determine which substance is richer in components of the mixture. For the separation of mixtures, physical, chemical, mass, and density properties can be considered among the components that constitute the mixture.

3.2. Identification of Substances

3.2.1. Thin Layer Chromatography (TLC)

It is a fast and straightforward analytical technique that is used to determine the degree of purity of the compound, such as, for example, the effectiveness of the purification step, the comparison of one or more samples as they run through the plate, and finally, the follow-up of the reaction when the reagents disappear, and the final products appear. The solids, which are often used, are silica gel and alumina; this plate can be the size of a laboratory slide, and the substance is placed on the end of the plate and then stored in a stoppered vial. The solvent rises by capillary action through the differential partition adsorbent and occurs between the components of the dissolved mixture of the adsorbent stationary phase. Most chromatographic plates have a fluorescence indicator that allows the visualization of compounds that are active in ultraviolet light of 254 nm.
The presence of an active compound in the UV prevents the indicator from absorbing light in the area where the product is located. When the compound does not absorb UV light, chromatography requires a developing agent.

3.2.2. Ultraviolet/Visible (UV/Vis)

Ultraviolet/visible spectroscopy must have a wavelength between 160 and 270 nm per molecule with a type of energy used to determine the concentrations of the different substances, and that is why it allows us to study and determine the rate equations for the reactions. This type of spectroscopy is used in teaching laboratory analysis for quantitative analysis of all molecules that absorb ultraviolet light and visible electromagnetic radiation. There are different applications, such as analyzing biochemical samples, determining metals in compounds, color measurements, and monitoring the kinetics of chemical and biochemical processes.

4. Results and Discussion

An analytical experimental study was carried out on the shells of yellow and red Nephelium lappaceum.

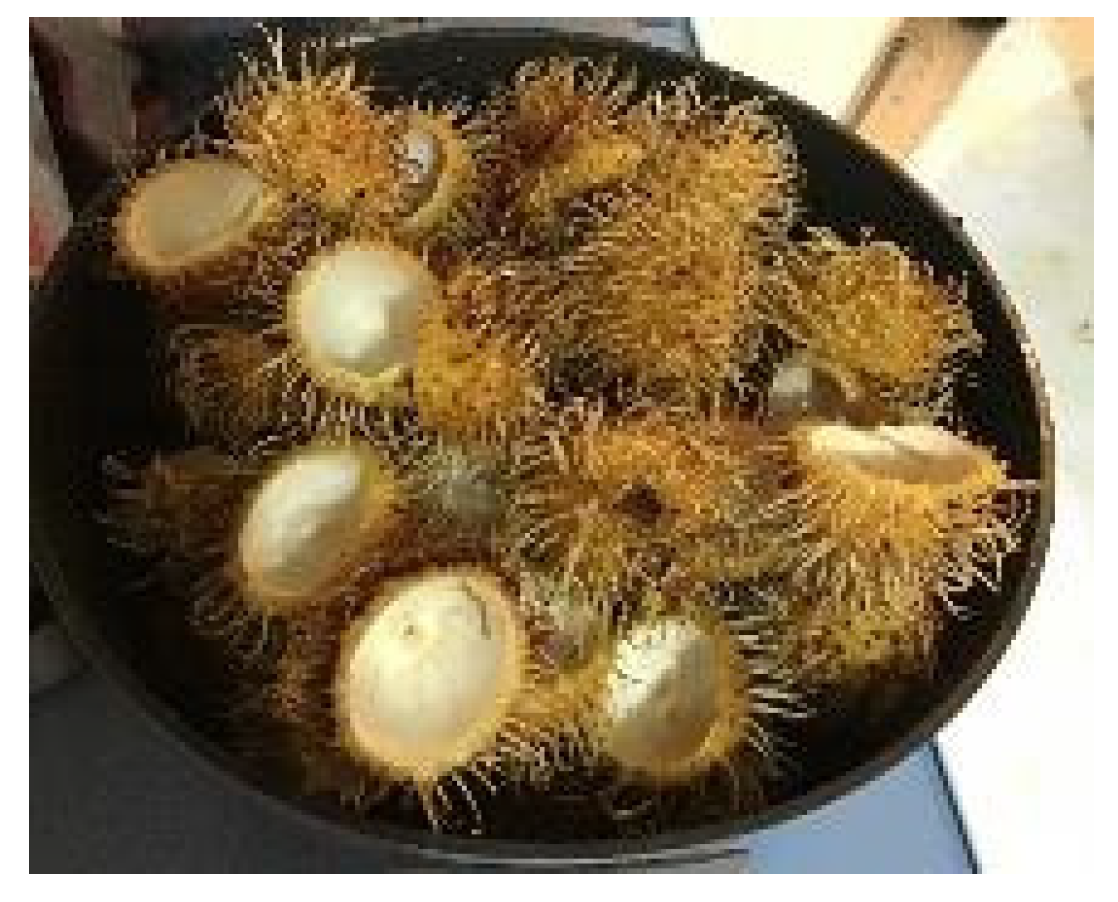
4.1. Botanical Material

Red and yellow Nephelium lappaceum peels obtained from Finca La China, located in Perez Zeledon, La China, were used (Figure 1 and Figure 2).

4.2. Raw Material

Red and yellow Nephelium lappaceum husks.

4.3. Materials and Methods

4.3.1. Materials

The materials include samples of plants, lab instruments, and the following equipment: Red Nephelium lappaceum shells; Yellow Nephelium lappaceum shells; a knife; a chopping board; a blender; large and small glass jars; a spatula; a 250 mL beaker; a 500 mL beaker; a 1000 mL beaker; electric heater; infrared spectrometry equipment; reflux equipment; rotary evaporator; cotton; reagents; a stirrer; test tubes; aluminum; UV lamp; labels; silica gel plates; and capillaries.

4.3.2. Methods

-
Reflux extraction equipment;
-
Rotavapor equipment;
-
Thin layer chromatography;
-
UV/Visible spectroscopy;
-
Infrared spectroscopy;
-
Gas chromatography;
-
Mass spectroscopy;
-
DPPH test.

4.4. Procedure

4.4.1. Experimental Part

A rotary evaporator was used to identify the metabolites present in the Nephelium lappaceum peels to separate the solvents from the secondary metabolites. Nephelium lappaceum red and yellow peels were washed and chopped, then crushed in the blender, and finally, three aluminum pyrex were used to dry them in the oven at 60 °C for 24–48 h. Then, 50 g of Nephelium lappaceum peel was weighed into a 1000 mL beaker, then transferred into a 1000 mL volumetric beaker, and then 400 mL of Hexane was added, placed over the heater to boil, then added Dichloromethane, and finally, methanol. We kept the mixture in each solvent for an hour and a half, making sure that the icebox had ice. The content of the flat-bottomed volumetric balloon was allowed to cool to filter and separate the solvents.

4.4.2. Thin Plate Chromatography

A chromatographic plate of 4 cm × 10 cm was selected so that the extracts would be sufficiently separated and would not mix, and the length of 10 cm was chosen to better separate the metabolites in the stationary phase. Then, at 1.5 cm from the edges of the plate, a line of origin was traced where the extracts of Nephelium lappaceum peel with its solvent were located with the support of a capillary after having passed through the Rotavapor and a final line. The chromatographic plate was labeled, and the different reagents were identified. After that, a mobile phase was prepared with the solvents in a ratio of 4:4:2 (ethyl acetate: dichloromethane: hexane), which had a better separation of the metabolites. A total amount of 5 mL was added in a 1000 mL beaker; the plates were introduced and covered with aluminum foil, and the mobile phase was expected to reach the final line. Finally, the thin layer of chromatographic plates was removed and allowed to dry; then, the corresponding reagents were added to determine the presence of metabolites and developed with a UV lamp.

4.4.3. Ultraviolet/Visible Spectroscopy

The extracts of the red and yellow shells of Nephelium lappaceum had to be diluted to prevent them from being highly concentrated and affecting the reading of the samples. The UV/visible spectrophotometer Cary 60 Agilent was used, and in support of the cuvette where the extracts were added to perform the reading of the wavelengths and determine their absorption major (nm), it was washed at each change of the sample with methanol. The white standard used was methanol.

4.4.4. Infrared Spectroscopy and Mass Spectroscopy

The identification of the samples of the extracts of the red and yellow shells of Nephelium lappaceum was carried out. The spectroscopy tests were performed by the UNIBE laboratory personnel.

4.4.5. Preparation of the Capsules of Red and Yellow Nephelium lappaceum Shells

Nephelium lappaceum

Both colors of Nephelium lappaceum shells were crushed to obtain a fine powder. The shells of both colors were chopped and liquefied until they looked like small pieces. Then, they were placed in an aluminum pyrex to dry in the oven at 60 ºC. After that, capsules of red Nephelium lappaceum husk powder were filled, stored in glass jars, and labeled. Finally, capsules of yellow shell powder were filled, stored in glass jars, and labeled.

DPPH Antioxidant Activity Test

Some techniques have been described to test the antioxidant capacity of medicinal plants, but the one that has received preferential attention is the technique that uses the free radical 2,2-diphenyl-1-picrylhydrazyl, known by the acronym DPPH [42,43,44]. This free radical is susceptible to react with antioxidant compounds by a reaction based on the cession of a hydrogen atom provided by the antioxidant agent. Kinetic studies show that this process occurs through a pseudo-first-order reaction which can be followed by measuring the decrease in absorbance as a function of time. The reaction described above between DPPH and an antioxidant can be represented as follows:
[DPPH*] + [AOH] --> [DPPH-H] + [AO*].
  • Preparation of the stock solution and DPPH working solution
A total of 0.101 g of DPPH was weighed into a 100 mL volumetric ball, and 50 mL of methanol was added and dissolved. Then, it was gauged with methanol and wrapped with aluminum so that it was not exposed to sunlight. After that, from the previous process, an aliquot of 10 mL was added to a 50 mL volumetric ball. Finally, it was gauged with methanol and wrapped with aluminum to avoid the destabilization of the DPPH reagent.
2.
Preparation of the stock solution and ascorbic acid workup
A total of 0.101 g of ascorbic acid was weighed into a 100 mL volumetric ball, and 50 mL of methanol was added and dissolved. Then, it was gauged with methanol and wrapped with aluminum. After that, from the previous process, an aliquot of 2.50 mL of the ascorbic acid stock solution was poured into a 100 mL balloon. Finally, it was gauged with methanol and wrapped with aluminum.

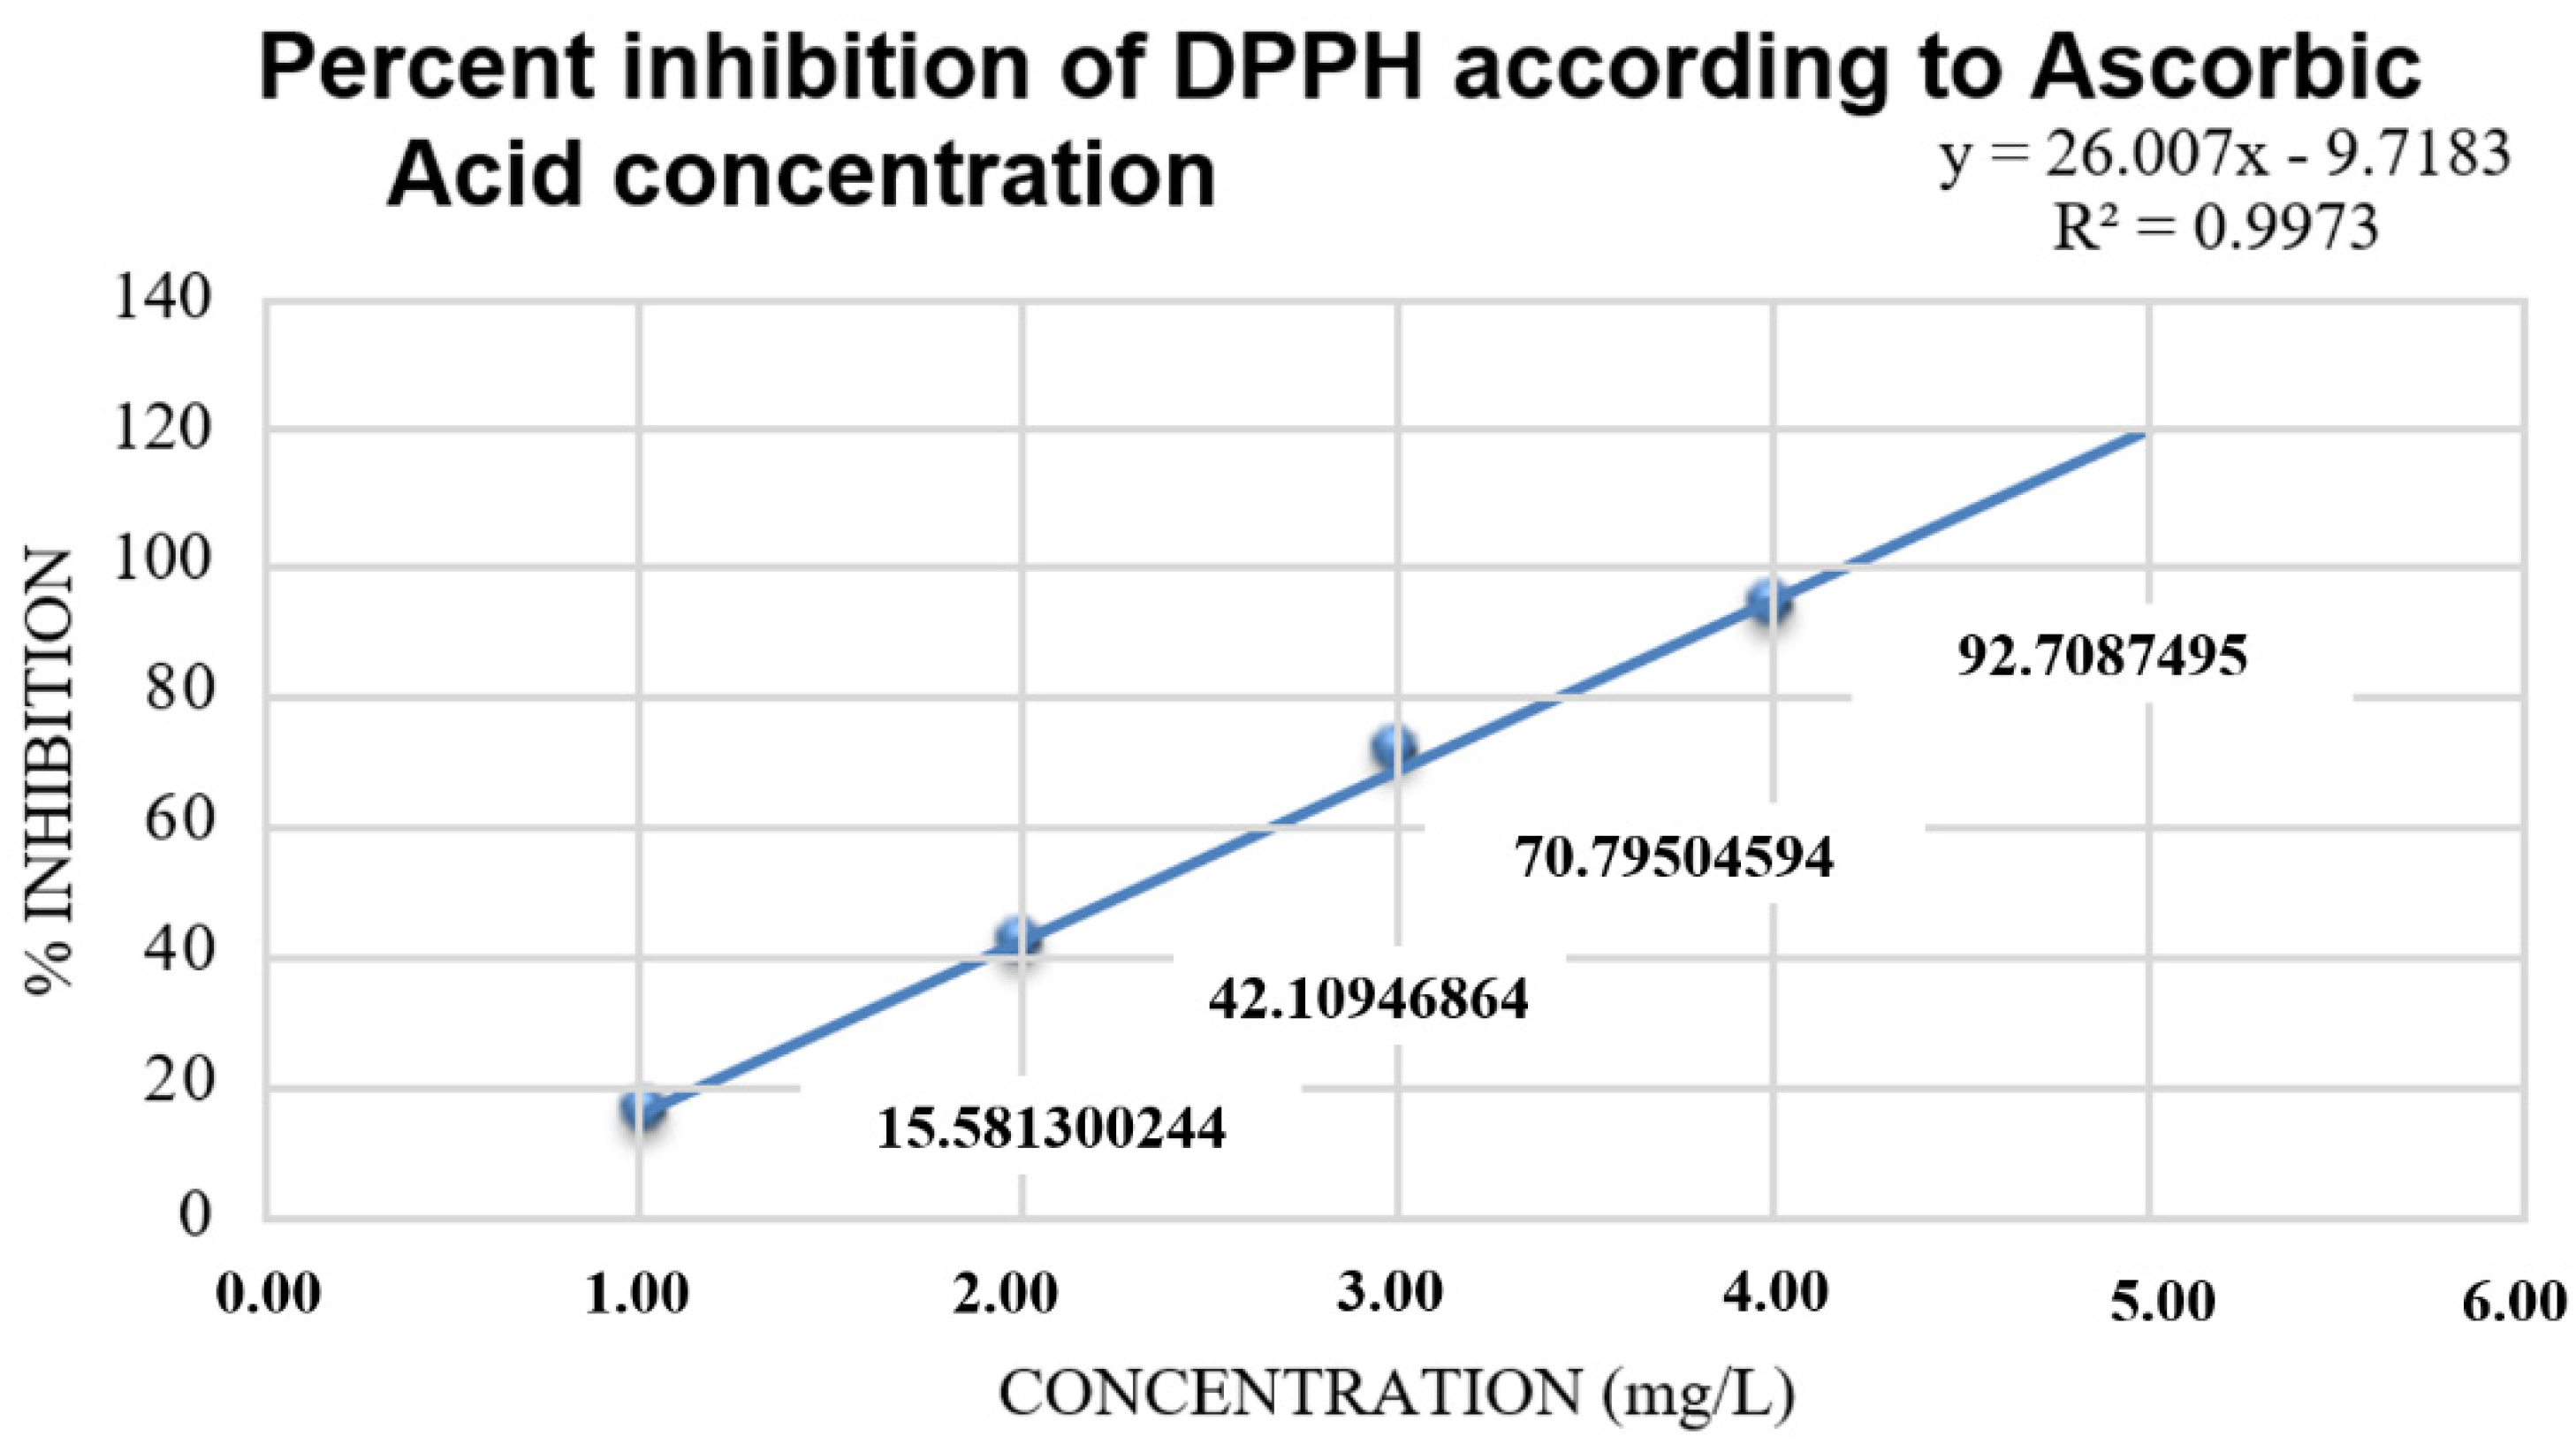
4.4.6. Preparation of the Ascorbic Acid Curve

The detail for the preparation of the ascorbic acid curve is shown in Table 1.

Preparation of the DPPH Inhibition Percentage Curve of the Red and Yellow Peel Extracts of Nephelium lappaceum

The detail for the preparation of the DPPH curve is shown in Table 2.

Concentration of Ascorbic Acid and Nephelium lappaceum Peels

A formula was used to determine the concentrations used during the DPPH test to use this data for the % inhibition graph. In the case of ascorbic acid concentrations, the following equation was used:
Concentration = [Ascorbic Acid (25.25 mg/L)] × Aliquot
Volumen total patrόn (6 mL)
Whereas, for Nephelium lappaceum shells, the following equation was used:
Concentration = [Ascorbic Acid] × Aliquot
Volumen total patrόn (3 mL)

Equation of the % Inhibition of DPPH

It allows us to determine the percentage of DPPH inhibition of N. lappaceum peel samples and ascorbic acid.
% Inhibition = (AbsBcont&ol %Abssolvent) % (AbsSTD%Absblank) × 100
AbsBcon&ol%Abssolvente
Abs B. control: Absorbance of dissolution control blank
Abs solvent: Absorbance of solvent without DPPH
Abs STD: Standard absorbance or sample with DPPH
Abs blank: Absorbance of ascorbic acid + Solvent are DPPH

4.4.7. Thin Plate Chromatography

Determination of the Mobile Phase for Thin Layer Chromatography (See Appendix A)

Four solvents at different proportions were used for three tests to obtain the mobile phase. A silica gel plate was used as the stationary phase to determine the mobile phase. The mixtures and proportions in each test were as follows:
  • Ethyl acetate: Dichloromethane: Hexane (4:4:2);
  • Ethyl acetate: Dichloromethane (60:40);
  • Ethyl acetate: Methanol (90:10).
Figure A1 in Appendix A shows the behavior of the mobile phases when they were placed in a UV chamber at 254 nm. The first chromatographic plate, Ethyl acetate: Dichloromethane: Hexane, had the best separation between the three extracts (Dichloromethane, Hexane, and Methanol). In plate number 2, Ethyl acetate: Dichloromethane, in the first column (Dichloromethane), it was observed that it did not present a good displacement, causing some overlapping of the secondary metabolites of the Nephelium lappaceum peel; in the second column (Hexane) it was observed that it did not have a good displacement or separation; but in the third column (Methanol) it did have a good displacement and separation.
In plate number 3, Ethyl acetate: Methanol, it could be observed that none of the three columns had an adequate displacement and separation of the three extracts. Therefore, the first test was selected as the mobile pass since it presented the best separation in the three extracts.

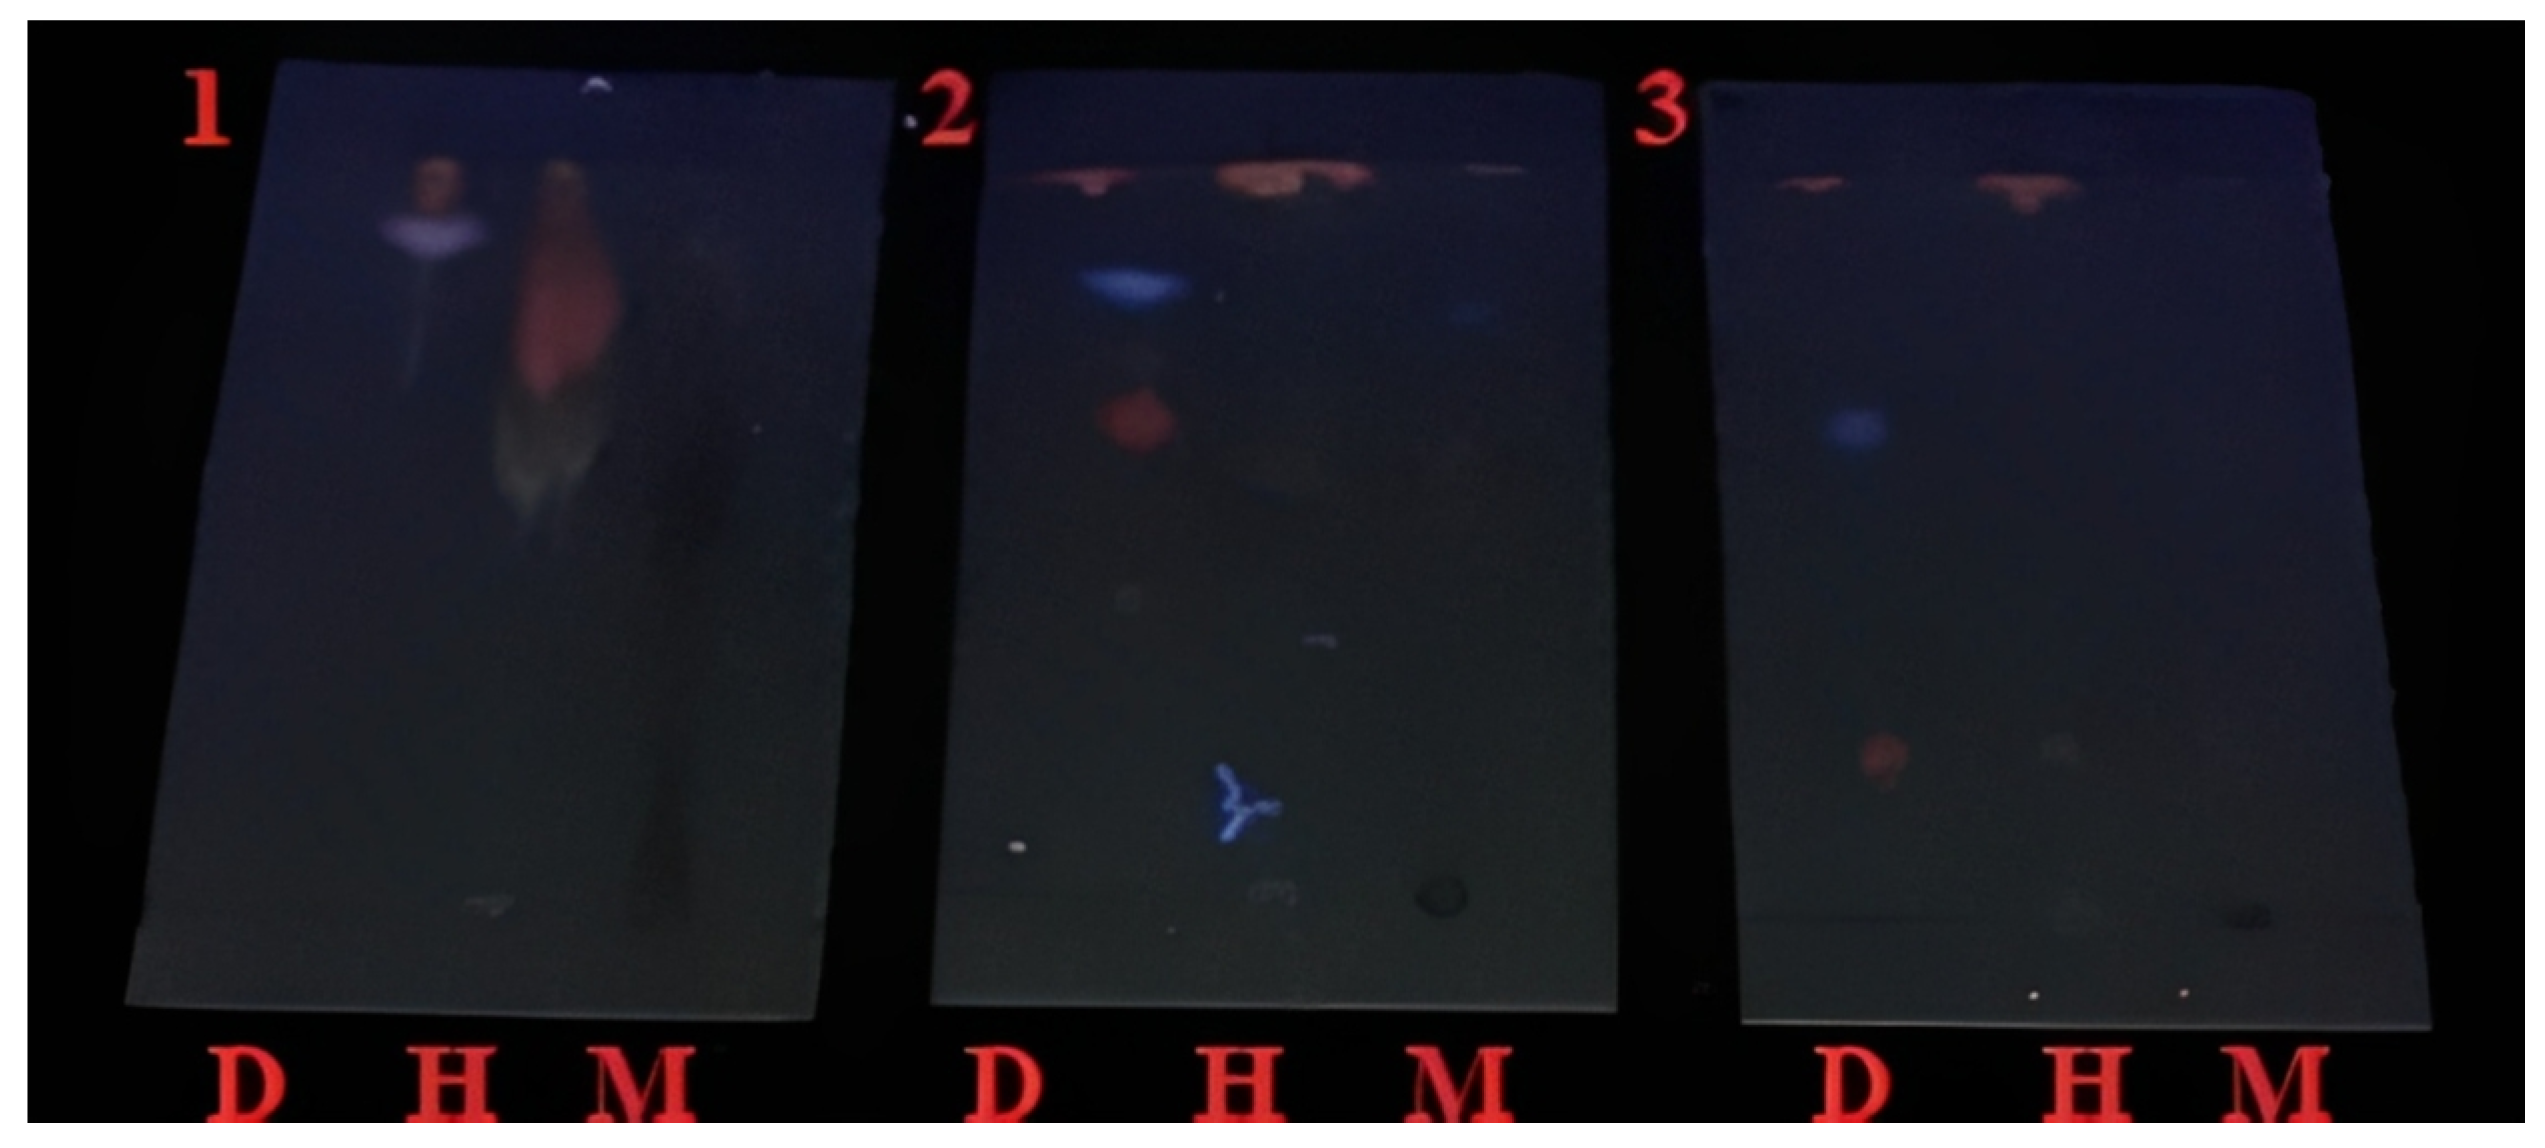
Tests by Thin Layer Chromatography (See Table A1 and Table A2 in Appendix A)

It allowed the identification of the secondary metabolites found in the red and yellow Nephelium lappaceum shells through various tests or assays that, using a specific color change, indicated whether it was positive for the presence of the metabolite.

4.4.8. UV/Visible Spectroscopy

UV/visible spectra were performed with the solvent methanol. Regarding the expected absorbance range due to the presence of polyphenols in the Nephelium lappaceum shells being between 550–460 nm in the visible region, while in the ultraviolet region, between 280–270 nm, in the case of the aromatic systems, it would be around 200 nm, and finally, the conjugated aromatic systems would be observed between 255–354 nm. In Figure A2 in Appendix A, we can see that the result of the UV absorbance range of the red shell was a peak of 255 nm, within the expected range due to the presence of polyphenolic substances with conjugated systems. In the case of Figure A3 in Appendix A, it can be observed that it presents the same absorbance range as the previous spectrum, 255 nm. Therefore, it is within the expected range in the presence of polyphenolic substances with conjugated systems.

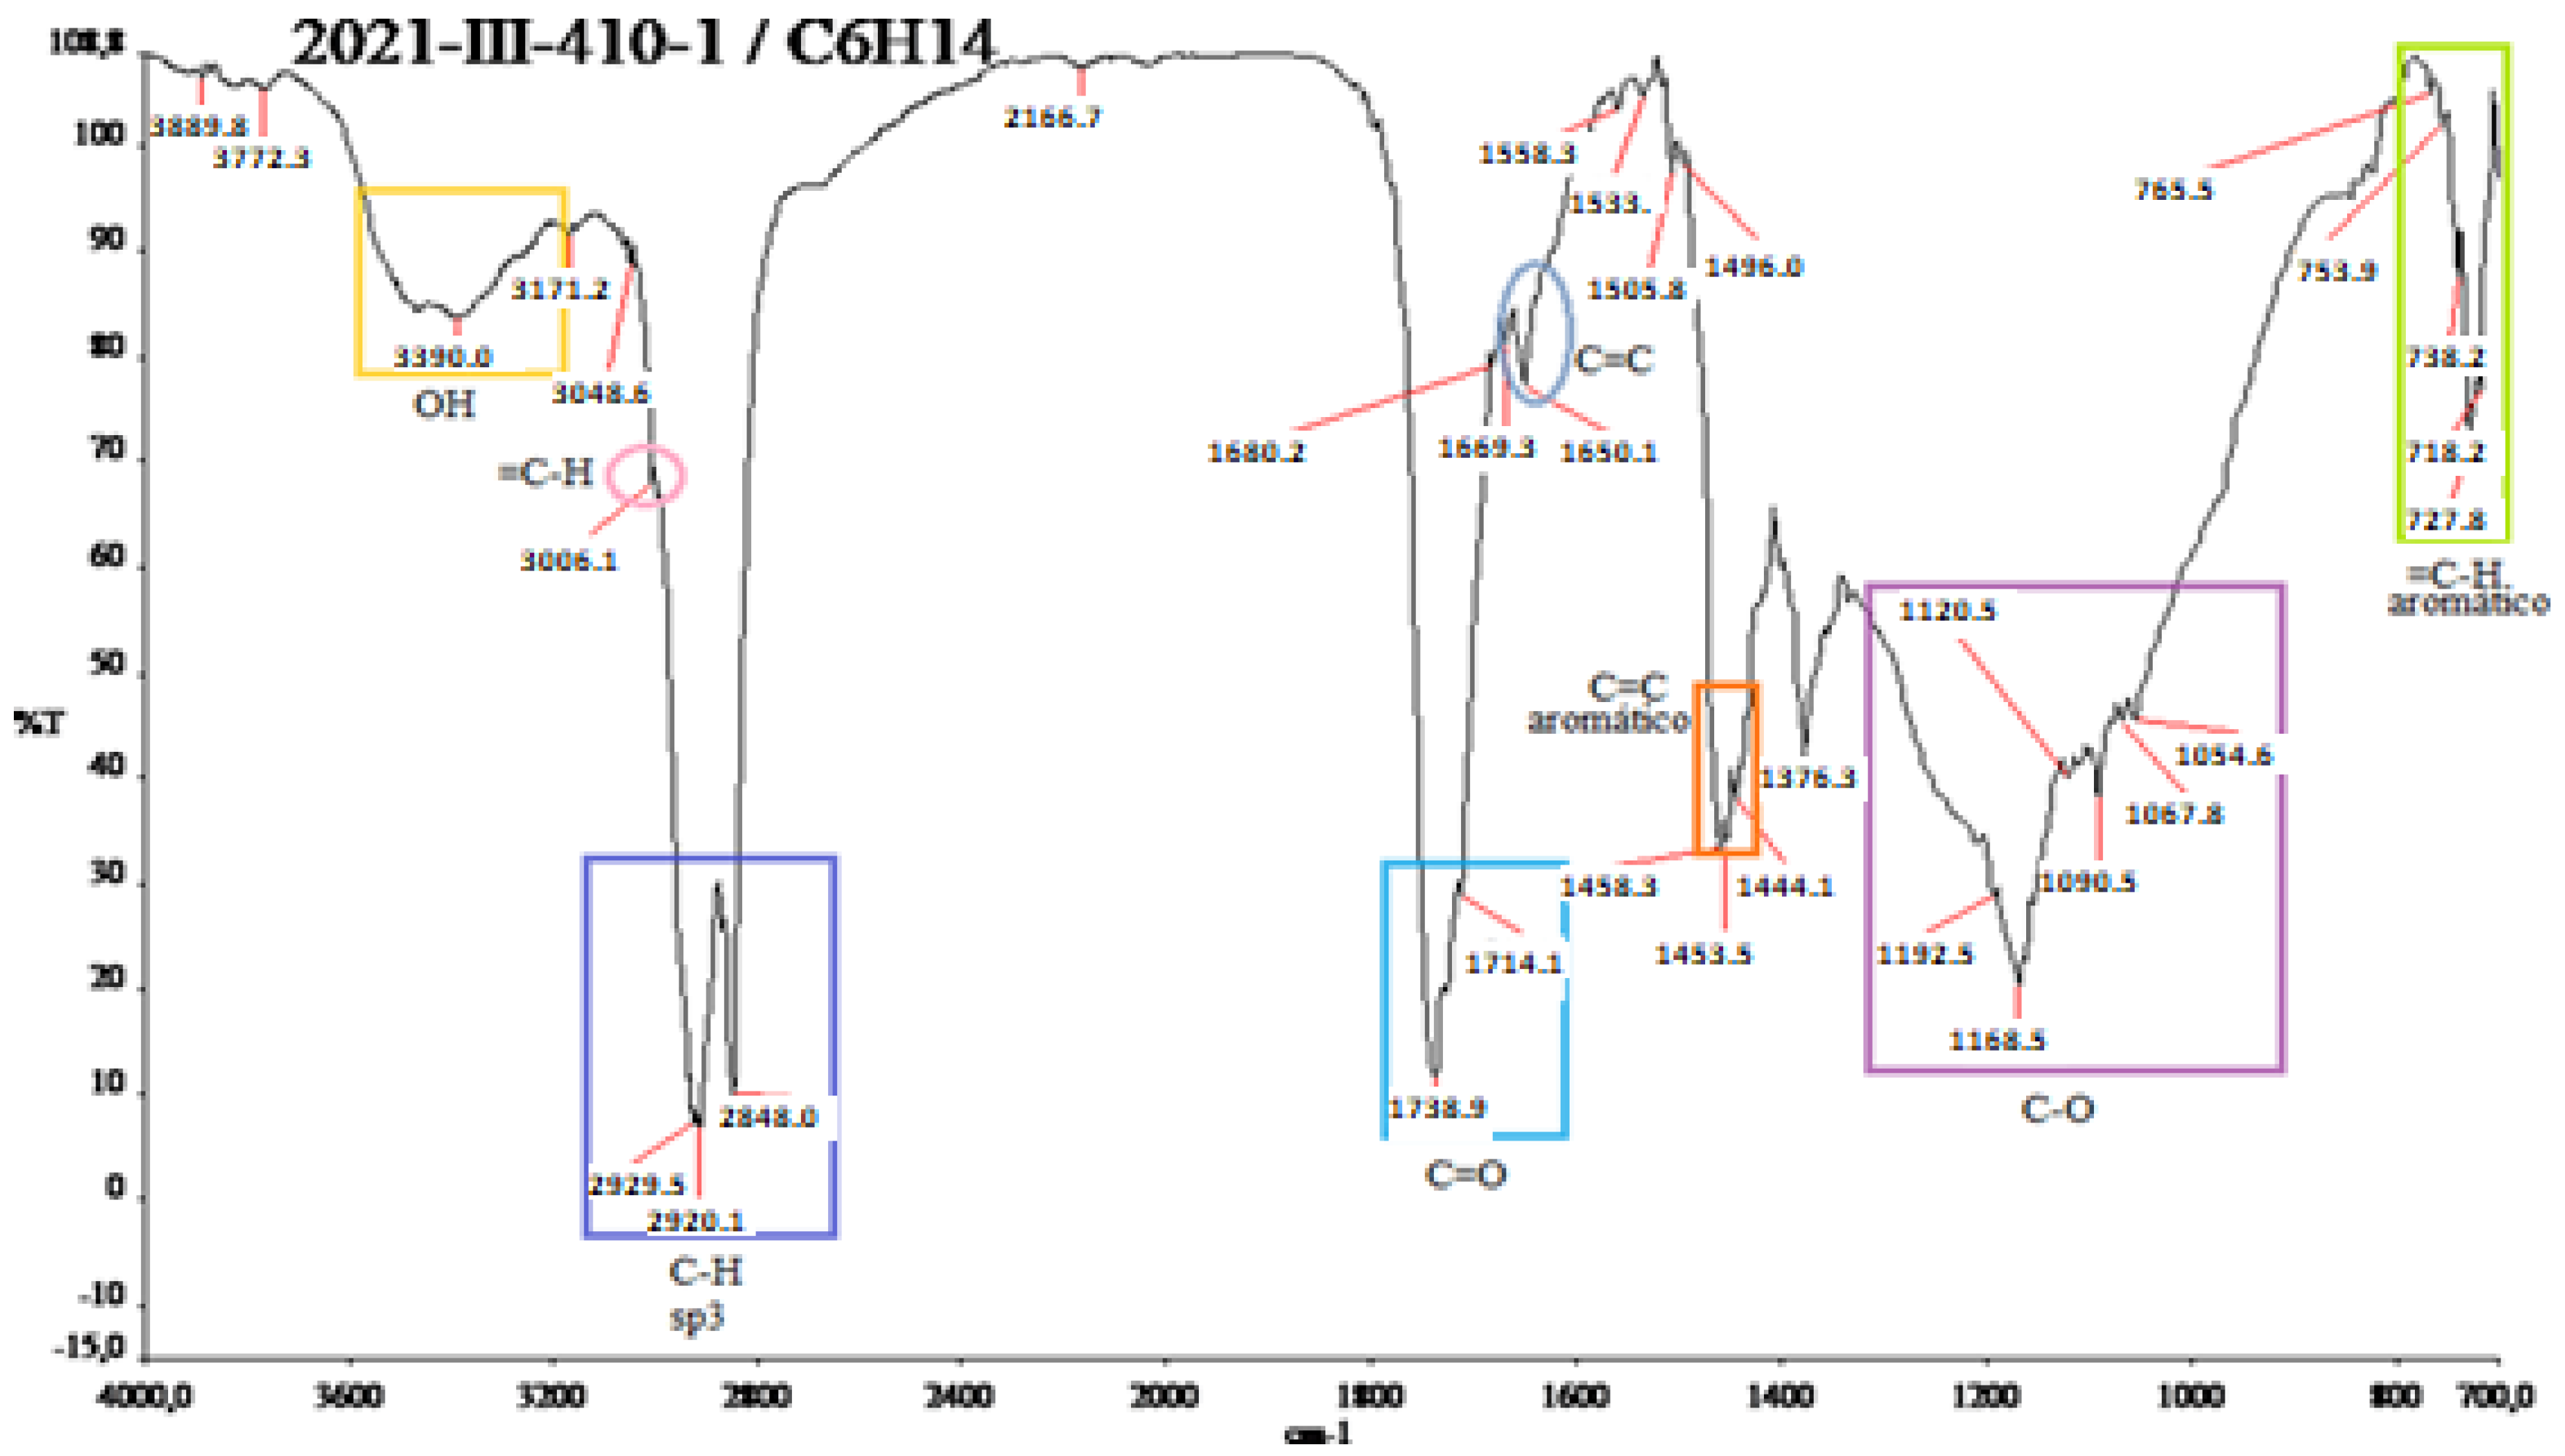
4.4.9. Infrared Spectroscopy

Samples of the diluted red and yellow shells were sent to the infrared to measure the infrared radiation absorption of the samples to obtain and identify the functional groups present in the Nephelium lappaceum “rambutan” shells. In Figure A4 in Appendix A, several functional groups are observed. Among them are OH groups at 3390.0 cm−1 due to the presence of phenolic groups and alcohols; in the range of 3006.1 cm−1, there is an alkene group (double bond); in the range 2929.3–2848.0 cm−1 in the C-H sp3, there are alkyl groups overlapped by the aromatics. However, they replicate at the end of the IR between 700–800 cm−1; in 1400 cm−1, the phenol is located at 1738.9 cm−1. In addition, an ester is observed without pointing between 1738.9–1714.1 cm−1 and a ketone at 1714.1 cm−1.
Figure A5 in Appendix A is similar to the previous spectrum but with a slight displacement product of the solvent Dichloromethane and its polarity change. It is impossible to read the double bond because the band is entirely broadened, shielding it. The following functional groups can be observed: OH groups at 3381.3 cm−1, in the range of 2920.1–2851.6 cm−1; in C-H sp3, there are alkyl groups; esters at 1738.2 cm−1; ketone at 1696.6 cm−1 has a lower range and aromatics between 700–800 cm−1 and at 1400 cm−1.
In Figure A6 in Appendix A, the methanolic spectrum is shielded, so it cannot be observed very well. Figure A7 in Appendix A is very similar to those of the red shell. Several functional groups are observed: OH groups at 3326.0 cm−1, in the range 2923.3–2848.7 cm−1 at the C-H.
Figure A8 in Appendix A shows several functional groups: OH groups at 3390.2 cm−1. In the range 2923.9–2852.1 cm−1 in the C-H sp3, there are alkyl groups overlapped by aromatics but replicated at the end of the IR between 700–800 cm−1. At 1400 cm−1, the carbonyl is located at 1739.6 cm−1.

4.4.10. Gas Chromatography

Gas Chromatography of the Red Shell of Nephelium lappaceum

In Figure A9 in Appendix A, the Nephelium lappaceum extract’s hexane gas chromatography has retention times with significant peaks ranging from 18.725 min to 25.706 min. In Figure A10 in Appendix A, the gas chromatography of the Nephelium lappaceum extract of red peel Dichloromethane shows significant peaks at 24.153 and 24.731 min. Figure A11 in Appendix A, in the gas chromatography of Nephelium lappaceum extract in methanol, significant peaks ranging from 2.392 min to 12.815 min were obtained.

Gas Chromatography of Nephelium lappaceum Yellow Shell

In Figure A12 in Appendix A, gas chromatography of the Nephelium lappaceum extract in Hexane shows significant peaks ranging from 18.716 min to 25.674 min. In Figure A13 in Appendix A, the gas chromatography of the Nephelium lappaceum extract in Dichloromethane, peaks ranging in retention times from 16 min to 26 min were observed, where the retention times 19.381 and 24.072 min predominated.

4.4.11. Mass Spectroscopy

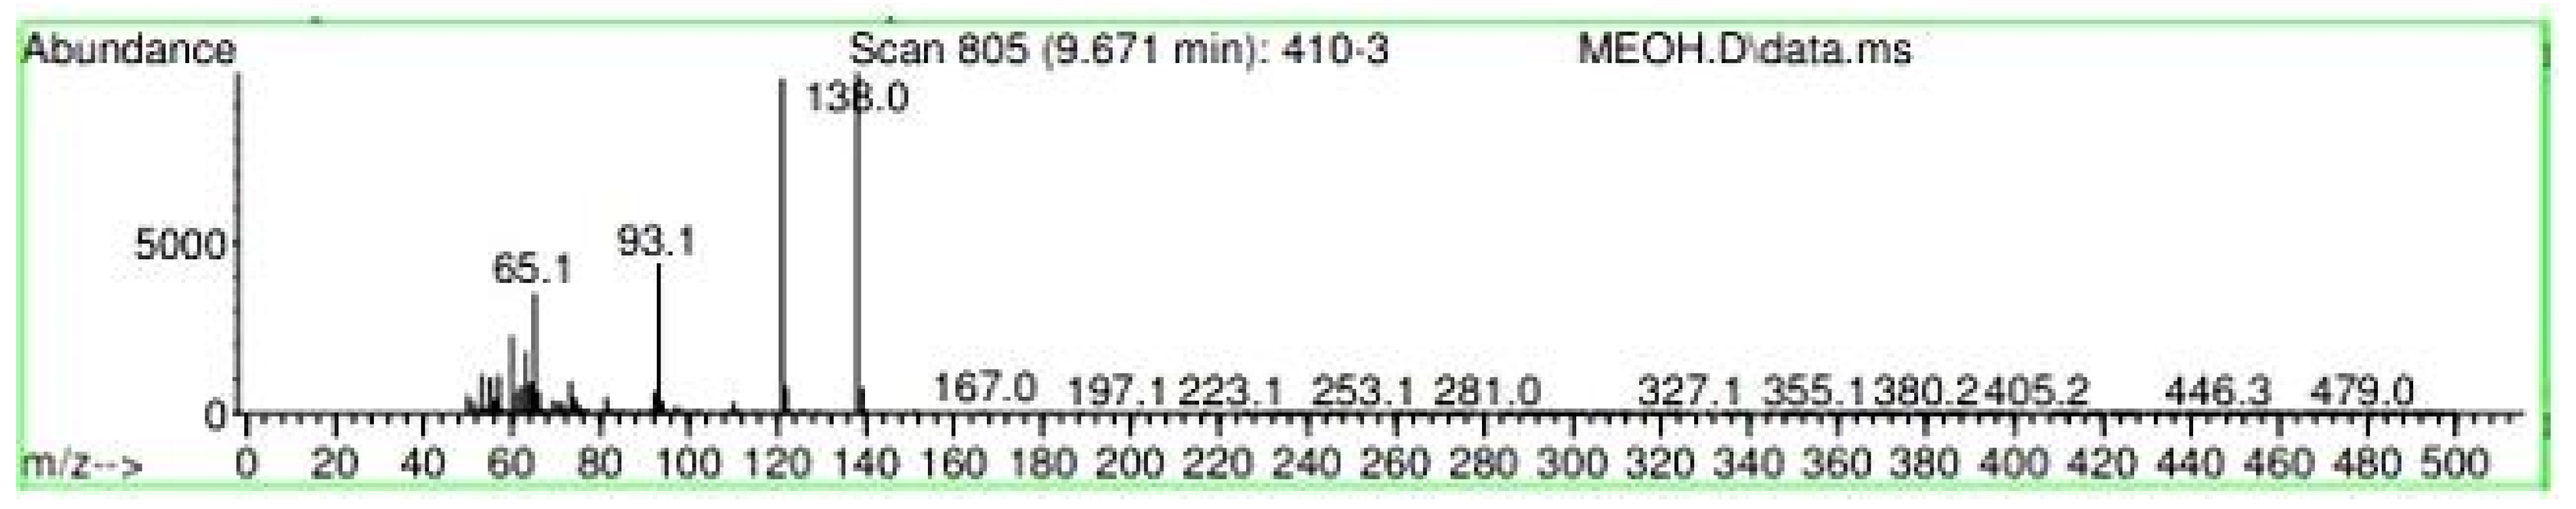
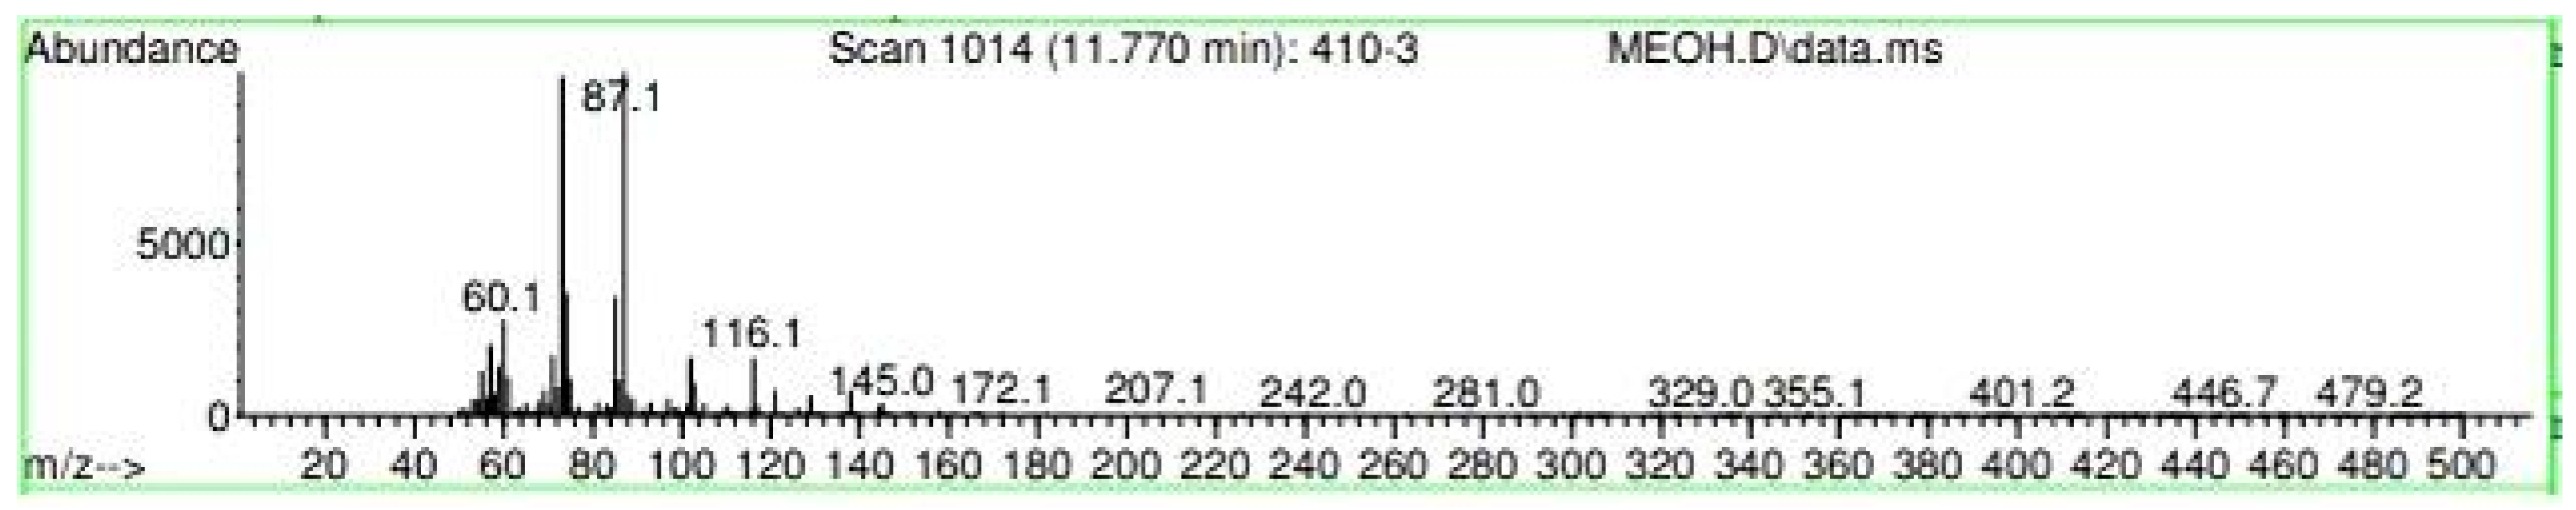
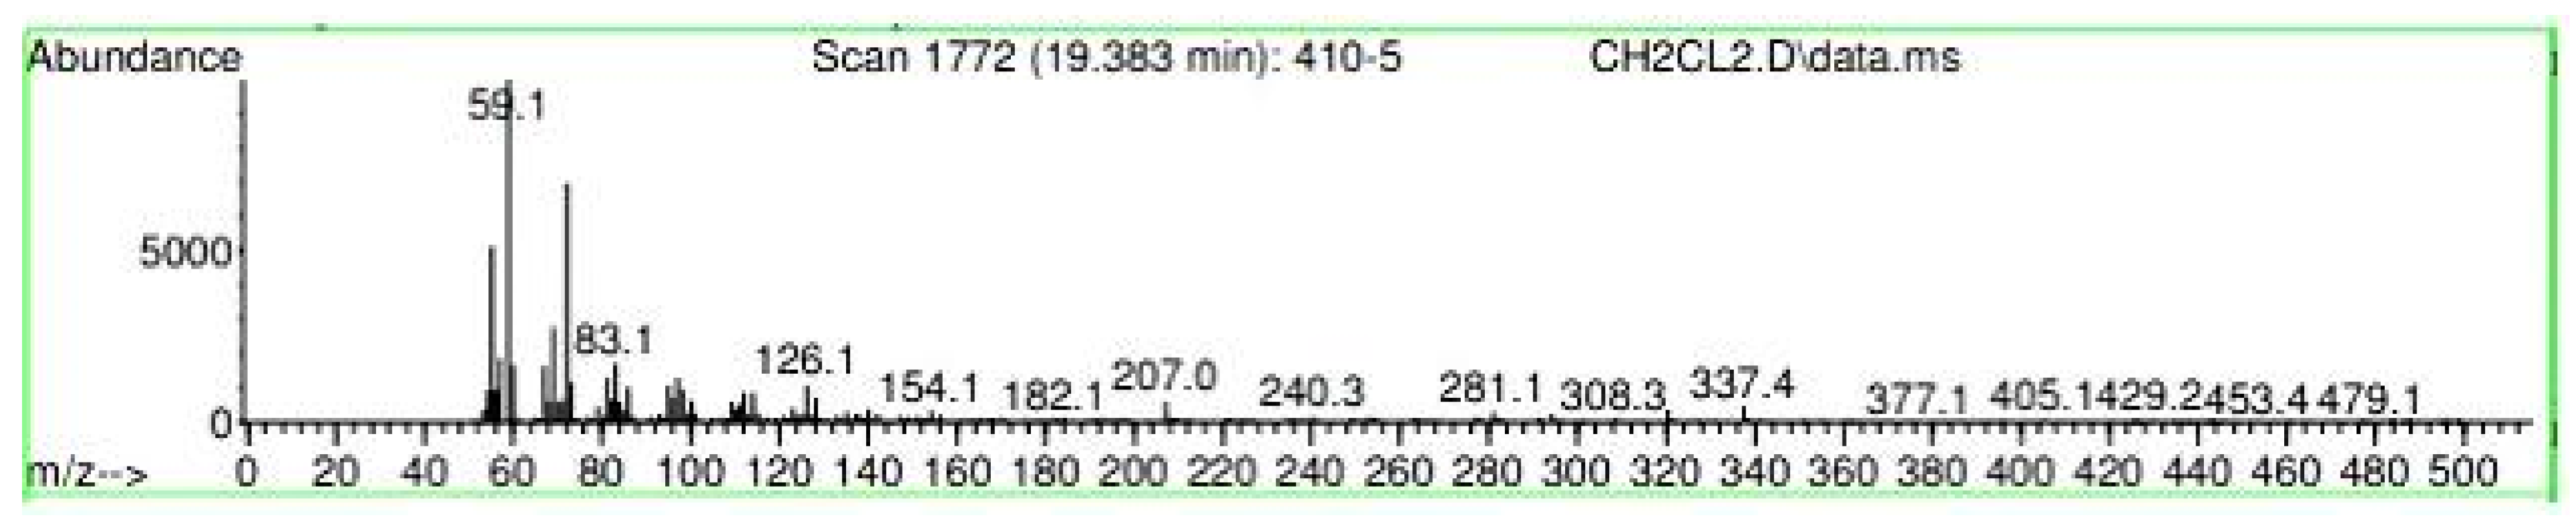
Mass Spectroscopy of the Red Shell of Nephelium lappaceum

Appendix A shows the outcomes of mass spectroscopy of the red shell of Nephelium lappaceum. In Figure A14, the Eicosane molecule has a retention time of 17.555 min, a percent area of 3.25%, and an m/z of 429.1. Figure A15 shows a retention time of 18,720 min, a percentage area of 7.84%, and an m/z 281.1 Eicosane Derivatives. In Figure A16, a retention time of 24.113 min, a percentage area of 27.09%, and an m/z of 412.4 can be observed when the Stigmasterol molecule is found. Figure A17 shows a retention time of 24.716 min, a percentage area of 4.38%, and an m/z of approximately 430 for the Sitosterol molecule. In Figure A18, a retention time of 25.148 min, a percentage area of 7.68%, and an m/z of 451.1 can be observed when the α-Amyrin molecule is found. In Figure A19, with a retention time of 25.710 min, a percent area of 14.35%, and an m/z of 451.2 is the α-Amyrin molecule. Figure A20 shows a retention time of 24.153 min, a percentage area of 51.77 %, and m/z of 412.4 for the ellagic acid glycoside molecule. Figure A21 shows a retention time of 24.736 min, a percent area of 15.41%, and an m/z of 430 for the Sitosterol molecule. In Figure A22, a retention time of 25.158 min, a percent area of 4.75%, and an m/z of 451.0 can be observed when the α-Amyrin molecule is found. Figure A23 shows a retention time of 25,700 min, a percent area of 5.99%, and m/z of about 430 yields an isomer of Amyrin. Figure A24 shows a retention time of 6.849 min, a percentage area of 31.49%, and an m/z 126 molecules related to Flavonoids are obtained. In Figure A25, a retention time of 9.671 min, a percentage area of 17.80%, and an m/z 138.0 molecule derived from Flavonoids type 3-hydroxy ketone can be observed in fractionation. In Figure A26, a retention time of 11.770 min, a percentage area of 20.62%, and an m/z of 172 are found derivatives related to glycosides in the molecules with free OH groups.

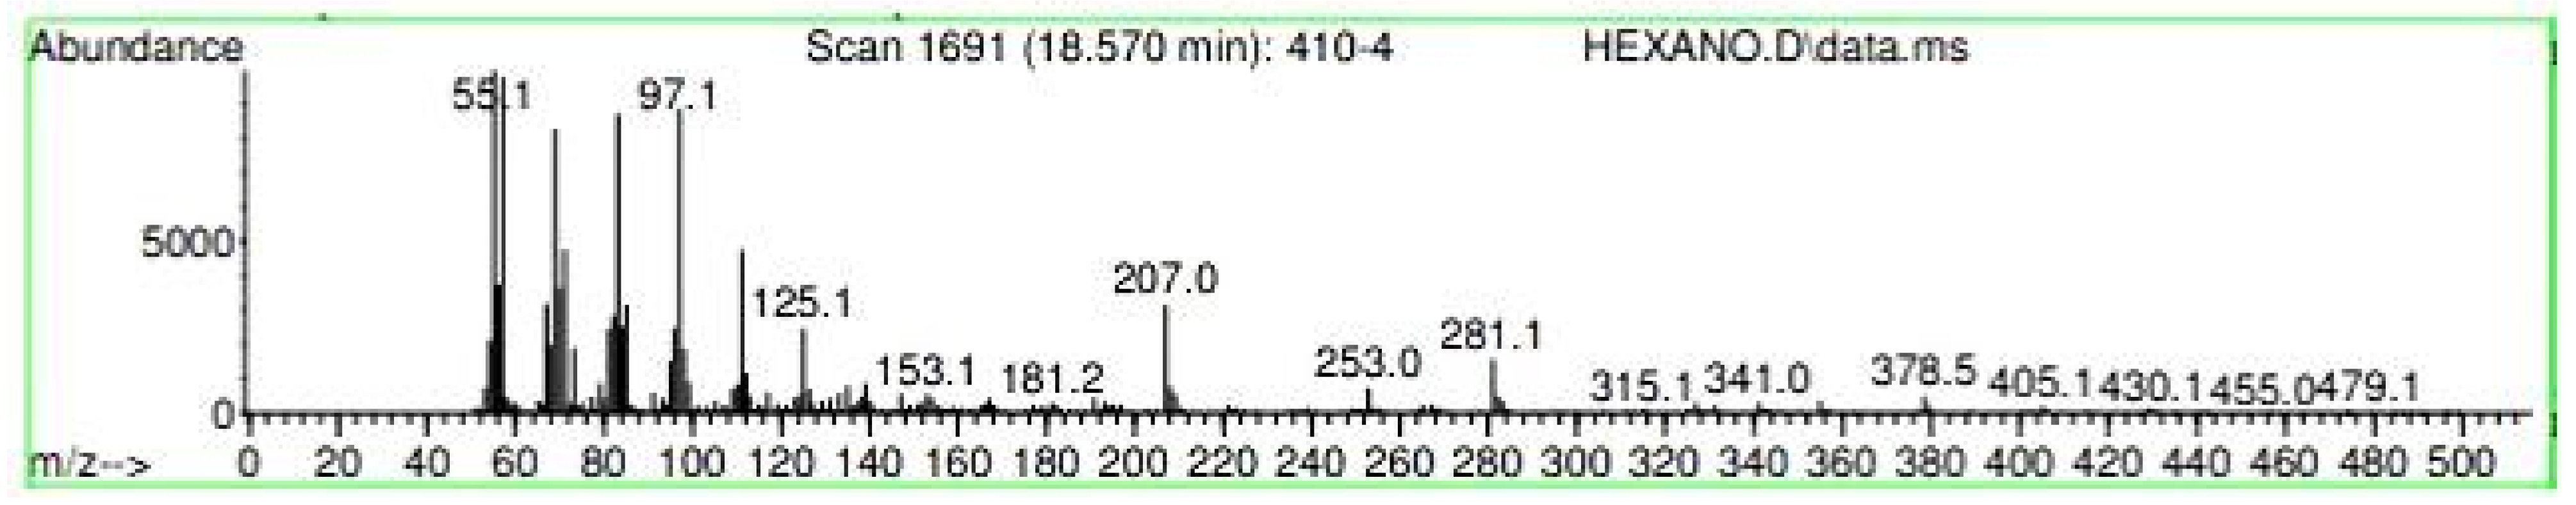
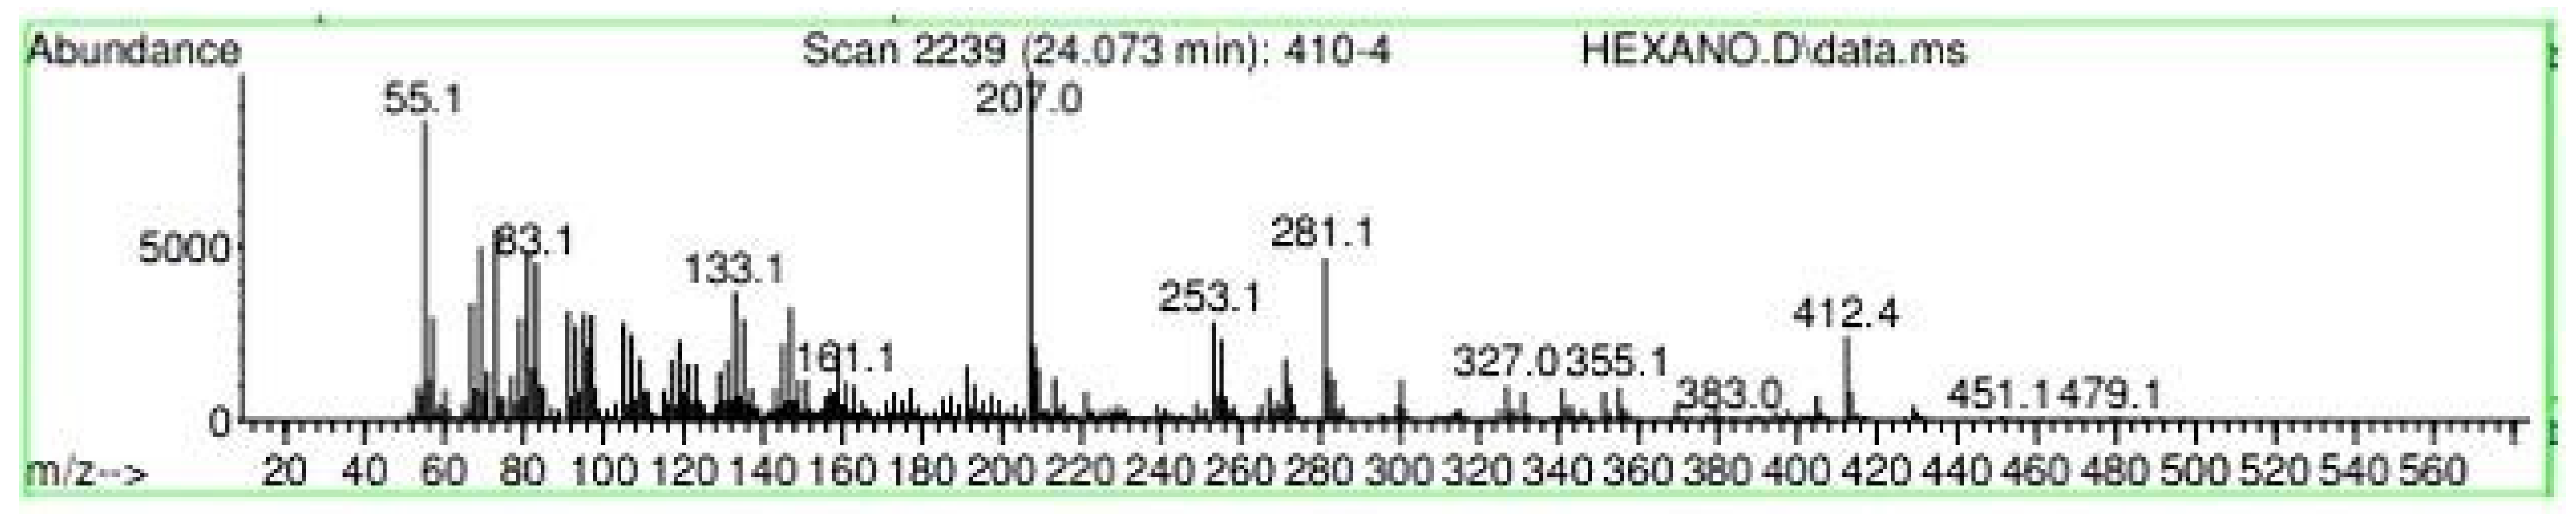
Mass Spectroscopy of the Yellow Shell of Nephelium lappaceum

Appendix A shows the outcomes of mass spectroscopy of the yellow shell of Nephelium lappaceum. In Figure A27, we can observe a retention time of 18.570 min, a percentage area of 12.55%, and an m/z of 378.5 in the presence of the Heneicosanol molecule. Figure A28 shows a retention time of 18,720 min, a percent area of 9.70%, and an m/z of 429.1 in the Eicosane molecule. Figure A29 shows a retention time of 20.036 min, a percentage area of 15.52%, and an m/z 431.1 in the presence of an Eicosanol derivative. Figure A30 shows a retention time of 21.864 min, a percent area of 19.04%, and an m/z of 416.4 Tocopherol (Vitamin E). Figure A31 shows a retention time of 24.073 min, a percent area of 18.82%, and an m/z of 451 for Eicosane Derivatives. In Figure A32, the Steroid Precursor has a retention time of 25.670 min, a percent area of 24.37%, and an m/z of 429.2. Figure A33 shows a retention time of 19.383 min, a percentage area of 65.21%, and an m/z of 334 fractions of the Geraniin molecule. Figure A34 shows a retention time of 24.073 min, a percentage area of 34.79%, and an m/z 427 corresponding to the Stigmasterol molecule.

4.4.12. Test DPPH

The results for the antioxidant capacity using DPPH are shown for the ascorbic acid (Table 3), Nephelium lappaceum red peel extract (Table 4) and Nephelium lappaceum yellow peel extract (Table 5).

Reference to the Inhibition Percentages of Ascorbic Acid and the Extract of Nephelium lappaceum

The mixed results support that both extracts of Nephelium lappaceum have higher antioxidant capacity compared to ascorbic acid, with the yellow peel of Nephelium lappaceum being predominant in antioxidant activity (Figure 3, Figure 4 and Figure 5).

5. Conclusions

Nephelium lappaceum presented high concentrations of antioxidants, which is an advantage for free radical scavenging. A literary study of Nephelium lappaceum peels and the extraction of the main components of Nephelium lappaceum using reflux equipment and a rotary evaporator was carried out to be later identified by thin layer chromatography with the support of reagents. It was possible to determine the structure of the different secondary metabolites using different electronic media. When analyzing the comparison of the results of the DPPH tests, it was obtained as a result that the yellow Nephelium lappaceum peel has great antioxidant power. A pharmaceutical preparation was made, which were the red and yellow Nephelium lappaceum peel capsules for preventive use of oxidative stress.
DPPH tests were performed with both shells since the ability to react and donate with other compounds is only quantified by the absorbances seen in the different UV/visible spectra. The correct equipment handling and the necessary precautions before ascorbic acid guarantee a good result favoring the correct calibration curve.
For the DPPH test with methanol extracts, an activated carbon filter was used for a better UV/visible reading so that the extract’s color did not interfere with the absorption reading of the samples. The Vanillin test was performed very carefully because sulfuric acid can react with the primary medium, so test tubes that have not previously been in contact with essential substances should be used. DPPH and ascorbic acid were handled with great care because they are photosensitive, so they can become unstable and affect the procedure if they are exposed to sunlight for too long.

Author Contributions

Conceptualization, M.D.R., A.E.L.G., E.A.C. and L.R.Y.; methodology, M.D.R., A.E.L.G., E.A.C. and L.R.Y.; software, M.D.R., A.E.L.G., E.A.C. and L.R.Y.; validation, M.D.R., A.E.L.G., E.A.C. and L.R.Y.; formal analysis, M.D.R., A.E.L.G., E.A.C. and L.R.Y.; investigation, M.D.R., A.E.L.G., E.A.C. and L.R.Y.; resources, M.D.R., A.E.L.G., E.A.C. and L.R.Y.; data curation, M.D.R., A.E.L.G., E.A.C. and L.R.Y.; writing—original draft preparation, M.D.R., A.E.L.G., E.A.C., L.R.Y., A.A.-R., S.D.-A.-A. and J.A.Y.; writing—review and editing, M.D.R., A.E.L.G., E.A.C., L.R.Y., A.A.-R., S.D.-A.-A. and J.A.Y.; visualization, M.D.R., A.E.L.G., E.A.C., L.R.Y., A.A.-R., S.D.-A.-A. and J.A.Y. All authors have read and agreed to the published version of the manuscript.

Funding

This research received no external funding.

Institutional Review Board Statement

Not applicable.

Informed Consent Statement

Not applicable.

Data Availability Statement

The data presented in this study are available on request.

Conflicts of Interest

The authors declare no conflict of interest.

Appendix A

Figure A1. Plate chromatography with UV light at 254 nm.
Sustainability 15 05188 g0a1
Figure A2. UV/Visible absorption spectrum of the red shell of N. lappaceum.
Sustainability 15 05188 g0a2
Figure A3. UV/Visible absorption spectrum of the yellow shell of N. lappaceum.
Sustainability 15 05188 g0a3
Figure A4. IR spectra of the red shell of N. lappaceum with hexane solvent.
Sustainability 15 05188 g0a4
Figure A5. IR spectrum of the red shell of N. lappaceum with the solvent dichloromethane.
Sustainability 15 05188 g0a5
Figure A6. IR spectra of the red shell of N. lappaceum with the solvent methanol.
Sustainability 15 05188 g0a6
Figure A7. IR spectrum of the yellow shell of N. lappaceum with hexane solvent.
Sustainability 15 05188 g0a7
Figure A8. IR spectrum of the yellow shell of N. lappaceum with the solvent dichloromethane.
Sustainability 15 05188 g0a8
Figure A9. Gas chromatography of N. lappaceum with hexane solvent.
Sustainability 15 05188 g0a9
Figure A10. Gas chromatography of N. lappaceum with the solvent Dichloromethane.
Sustainability 15 05188 g0a10
Figure A11. Gas chromatography of N. lappaceum with the solvent methanol.
Sustainability 15 05188 g0a11
Figure A12. Gas chromatography of N. lappaceum with hexane solvent.
Sustainability 15 05188 g0a12
Figure A13. Gas chromatography of N. lappaceum with the solvent dichloromethane.
Sustainability 15 05188 g0a13
Figure A14. Mass spectroscopy of N. lappaceum extract with Hexane solvent.
Sustainability 15 05188 g0a14
Figure A15. Mass spectroscopy of N. lappaceum extract with Hexane solvent.
Sustainability 15 05188 g0a15
Figure A16. Mass spectroscopy of N. lappaceum extract with Hexane solvent.
Sustainability 15 05188 g0a16
Figure A17. Mass spectroscopy of N. lappaceum extract with Hexane solvent.
Sustainability 15 05188 g0a17
Figure A18. Mass spectroscopy of N. lappaceum extract with Hexane solvent.
Sustainability 15 05188 g0a18
Figure A19. Mass spectroscopy of N. lappaceum extract with Hexane solvent.
Sustainability 15 05188 g0a19
Figure A20. Mass spectroscopy of the N. lappaceum extract with the solvent Dichloromethane.
Sustainability 15 05188 g0a20
Figure A21. Mass spectroscopy of the N. lappaceum extract with the solvent Dichloromethane.
Sustainability 15 05188 g0a21
Figure A22. Mass spectroscopy of the N. lappaceum extract with the solvent Dichloromethane.
Sustainability 15 05188 g0a22
Figure A23. Mass spectroscopy of the N. lappaceum extract with the solvent Dichloromethane.
Sustainability 15 05188 g0a23
Figure A24. Mass spectroscopy of the N. lappaceum extract with the solvent methanol.
Sustainability 15 05188 g0a24
Figure A25. Mass spectroscopy of the N. lappaceum extract with the solvent methanol.
Sustainability 15 05188 g0a25
Figure A26. Mass spectroscopy of the N. lappaceum extract with the solvent methanol.
Sustainability 15 05188 g0a26
Figure A27. Mass spectroscopy of N. lappaceum extract with Hexane solvent.
Sustainability 15 05188 g0a27
Figure A28. Mass spectroscopy of N. lappaceum extract with Hexane solvent.
Sustainability 15 05188 g0a28
Figure A29. Mass spectroscopy of N. lappaceum extract with Hexane solvent.
Sustainability 15 05188 g0a29
Figure A30. Mass spectroscopy of N. lappaceum extract with Hexane solvent.
Sustainability 15 05188 g0a30
Figure A31. Mass spectroscopy of N. lappaceum extract with Hexane solvent.
Sustainability 15 05188 g0a31
Figure A32. Mass spectroscopy of N. lappaceum extract with Hexane solvent.
Sustainability 15 05188 g0a32
Figure A33. Mass spectroscopy of N. lappaceum extract with Dichloromethane solvent.
Sustainability 15 05188 g0a33
Figure A34. Mass spectroscopy of the N. lappaceum extract with the solvent Dichloromethane.
Sustainability 15 05188 g0a34
Table A1. Identification tests for the presence of secondary metabolites from the red shell of Nephelium lappaceum.
TestOutcomeReport
Concentrated ammoniaPositive for coumarinSustainability 15 05188 i001
Reagent
Liebermann Burchard
Positive for tripertene
(presence of green tone)
Sustainability 15 05188 i002
VanillinPositive for glycosides
(presence of pink-purplish tone)
Sustainability 15 05188 i003
Iron (III) Chloride AssayPositive to tannins
(presence of dark blue tone)
Sustainability 15 05188 i004
Table A2. Identification tests for the presence of secondary metabolites of Nephelium lappaceum yellow peel.
TestOutcomeReport
Concentrated ammoniaPositive for coumarinSustainability 15 05188 i005
Lieberman Bürchard ReagentPositive for tripertene
(presence of green tone)
Sustainability 15 05188 i006
VanillinPositive for glycosides
(presence of pink–purplish tone)
Sustainability 15 05188 i007
Iron (III) Chloride AssayPositive for tannins (presence of dark blue tone)Sustainability 15 05188 i008

References

  1. Halim, H.R.; Hapsari, D.P.; Junaedi, A.; Ritonga, A.W.; Natawijaya, A.; Poerwanto, R.; Sobir; Widodo, W.D.; Matra, D.D. Metabolomics dataset of underutilized Indonesian fruits; rambai (Baccaurea motleyana), nangkadak (Artocarpus nangkadak), rambutan (Nephelium lappaceum) and Sidempuan salak (Salacca sumatrana) using GCMS and LCMS. Data Brief 2019, 23, 103706. [Google Scholar] [CrossRef] [PubMed]
  2. Tsong, J.L.; Goh, L.P.; Gansau, J.A.; How, S.-E. Review of Nephelium lappaceum and Nephelium ramboutanake: A High Potential Supplement. Molecules 2021, 26, 7005. [Google Scholar] [CrossRef] [PubMed]
  3. Lim, T.K. Nephelium lappaceum. In Edible Medicinal and Non-Medicinal Plants: Volume 6, Fruits; Lim, T.K., Ed.; Springer: Dordrecht, The Netherlands, 2013; pp. 62–71. [Google Scholar]
  4. Muhtadi; Primarianti, A.U.; Sujono, T.A. Antidiabetic Activity of Durian (Durio zibethinus Murr.) and Rambutan (Nephelium lappaceum L.) Fruit Peels in Alloxan Diabetic Rats. Procedia Food Sci. 2015, 3, 255–261. [Google Scholar] [CrossRef] [Green Version]
  5. Kumar, B.; Smita, K.; Cumbal, L.; Angulo, Y. Fabrication of silver nanoplates using Nephelium lappaceum (Rambutan) peel: A sustainable approach. J. Mol. Liq. 2015, 211, 476–480. [Google Scholar] [CrossRef]
  6. Bhattacharjee, P.; Das, S.; Das, S.K.; Chander, S. Rambutan (Nephelium lappaceum L.): A potential fruit for industrial use, serving nutraceutical, livelihood interests and enhancing climate resilience. S. Afr. J. Bot. 2022, 150, 26–33. [Google Scholar] [CrossRef]
  7. Gapsari, F.; Darmadi, D.B.; Setyarini, P.H.; Izzuddin, H.; Madurani, K.A.; Tanji, A.; Hermawan, H. Nephelium lappaceum Extract as an Organic Inhibitor to Control the Corrosion of Carbon Steel Weldment in the Acidic Environment. Sustainability 2021, 13, 12135. [Google Scholar] [CrossRef]
  8. Sukmandari, N.S.; Dash, G.K.; Jusof, W.H.W.; Hanafi, M. A Review on Nephelium lappaceum L. Res. J. Pharm. Technol. 2017, 10, 2819–2822. [Google Scholar]
  9. Thitilertdecha, N.; Teerawutgulrag, A.; Rakariyatham, N. Antioxidant and antibacterial activities of Nephelium lappaceum L. extracts. LWT Food Sci. Technol. 2008, 41, 2029–2035. [Google Scholar] [CrossRef]
  10. Hernández-Hernández, C.; Aguilar, C.N.; Rodríguez-Herrera, R.; Flores-Gallegos, A.C.; Morlett-Chávez, J.; Govea-Salas, M.; Ascacio-Valdés, J.A. Rambutan (Nephelium lappaceum L.): Nutritional and functional properties. Trends Food Sci. Technol. 2019, 85, 201–210. [Google Scholar] [CrossRef]
  11. Thitilertdecha, N.; Chaiwut, P.; Saewan, N. In vitro antioxidant potential of Nephelium lappaceum L. rind extracts and geraniin on human epidermal keratinocytes. Biocatal. Agric. Biotechnol. 2020, 23, 101482. [Google Scholar] [CrossRef]
  12. Torgbo, S.; Sukatta, U.; Kamonpatana, P.; Sukyai, P. Ohmic heating extraction and characterization of rambutan (Nephelium lappaceum L.) peel extract with enhanced antioxidant and antifungal activity as a bioactive and functional ingredient in white bread preparation. Food Chem. 2022, 382, 132332. [Google Scholar] [CrossRef] [PubMed]
  13. Thitilertdecha, N. Storage Effect on Phenolic Compounds and Antioxidant Activity of Nephelium lappaceum L. Extract. Cosmetics 2022, 9, 33. [Google Scholar] [CrossRef]
  14. Xuan, C.L.; Wannavijit, S.; Outama, P.; Lumsangkul, C.; Tongsiri, S.; Chitmanat, C.; Doan, H.V. Dietary inclusion of rambutan (Nephelium lappaceum L.) seed to Nile tilapia (Oreochromis niloticus) reared in biofloc system: Impacts on growth, immunity, and immune-antioxidant gene expression. Fish Shellfish Immunol. 2022, 122, 215–224. [Google Scholar] [CrossRef] [PubMed]
  15. Vargas-Calvo, A. Descripción morfológica y nutricional del fruto de rambután (Nephelium lappaceum). Agron. Mesoam. 2003, 14, 201–206. [Google Scholar] [CrossRef] [Green Version]
  16. Aruoma, O.I. Free radicals, oxidative stress, and antioxidants in human health and disease. J. Am. Oil Chem. Soc. 1998, 75, 199–212. [Google Scholar] [CrossRef] [PubMed]
  17. Betteridge, D.J. What is oxidative stress? Metabolism 2000, 49, 3–8. [Google Scholar] [CrossRef]
  18. Yaribeygi, H.; Atkin, S.L.; Sahebkar, A. A review of the molecular mechanisms of hyperglycemia-induced free radical generation leading to oxidative stress. J. Cell. Physiol. 2019, 234, 1300–1312. [Google Scholar] [CrossRef]
  19. Leopoldini, M.; Russo, N.; Toscano, M. The molecular basis of working mechanism of natural polyphenolic antioxidants. Food Chem. 2011, 125, 288–306. [Google Scholar] [CrossRef]
  20. Scalbert, A.; Johnson, I.T.; Saltmarsh, M. Polyphenols: Antioxidants and beyond. Am. J. Clin. Nutr. 2005, 81, 215S–217S. [Google Scholar] [CrossRef] [Green Version]
  21. Costa, M.; Losada-Barreiro, S.; Paiva-Martins, F.; Bravo-Díaz, C. Polyphenolic Antioxidants in Lipid Emulsions: Partitioning Effects and Interfacial Phenomena. Foods 2021, 10, 539. [Google Scholar] [CrossRef]
  22. Hernández, C.; Ascacio-Valdés, J.; De la Garza, H.; Wong-Paz, J.; Aguilar, C.N.; Martínez-Ávila, G.C.; Castro-López, C.; Aguilera-Carbó, A. Polyphenolic content, in vitro antioxidant activity and chemical composition of extract from Nephelium lappaceum L. (Mexican rambutan) husk. Asian Pac. J. Trop. Med. 2017, 10, 1201–1205. [Google Scholar] [CrossRef] [PubMed]
  23. Thitilertdecha, N.; Teerawutgulrag, A.; Kilburn, J.D.; Rakariyatham, N. Identification of Major Phenolic Compounds from Nephelium lappaceum L. and Their Antioxidant Activities. Molecules 2010, 15, 1453–1465. [Google Scholar] [CrossRef] [PubMed] [Green Version]
  24. Estrada-Gil, L.; Contreras-Esquivel, J.C.; Flores-Gallegos, C.; Zugasti-Cruz, A.; Govea-Salas, M.; Mata-Gómez, M.A.; Rodríguez-Herrera, R.; Ascacio-Valdés, J.A. Recovery of Bioactive Ellagitannins by Ultrasound/Microwave-Assisted Extraction from Mexican Rambutan Peel (Nephelium lappaceum L.). Molecules 2022, 27, 1592. [Google Scholar] [CrossRef] [PubMed]
  25. Geske, D.H.; Maki, A.H. Electrochemical Generation of Free Radicals and Their Study by Electron Spin Resonance Spectroscopy; the Nitrobenzene Anion Radical. J. Am. Chem. Soc. 1960, 82, 2671–2676. [Google Scholar] [CrossRef]
  26. Li, J.; Li, Y.; Xiong, Z.; Yao, G.; Lai, B. The electrochemical advanced oxidation processes coupling of oxidants for organic pollutants degradation: A mini-review. Chin. Chem. Lett. 2019, 30, 2139–2146. [Google Scholar] [CrossRef]
  27. McCord, J.M. The evolution of free radicals and oxidative stress. Am. J. Med. 2000, 108, 652–659. [Google Scholar] [CrossRef]
  28. Gebicki, J.M. Oxidative stress, free radicals and protein peroxides. Arch. Biochem. Biophys. 2016, 595, 33–39. [Google Scholar] [CrossRef]
  29. Żukowski, P.; Maciejczyk, M.; Waszkiel, D. Sources of free radicals and oxidative stress in the oral cavity. Arch. Oral Biol. 2018, 92, 8–17. [Google Scholar] [CrossRef]
  30. Castro, J.D.S.; das Virgens, C.F. Thermal decomposition of Nephelium lappaceum L. peel. J. Therm. Anal. Calorim. 2019, 138, 3541–3549. [Google Scholar] [CrossRef]
  31. Isacfranklin, M.; Yuvakkumar, R.; Ravi, G.; Kumar, P.; Saravanakumar, B.; Velauthapillai, D.; Alahmadi, T.A.; Alharbi, S.A. Biomedical application of single anatase phase TiO2 nanoparticles with addition of Rambutan (Nephelium lappaceum L.) fruit peel extract. Appl. Nanosci. 2021, 11, 699–708. [Google Scholar] [CrossRef]
  32. Phuong, N.N.M.; Le, T.T.; Van Camp, J.; Raes, K. Evaluation of antimicrobial activity of rambutan (Nephelium lappaceum L.) peel extracts. Int. J. Food Microbiol. 2020, 321, 108539. [Google Scholar] [CrossRef]
  33. Mirghani, M.E.S. Rambutan (Nephelium lappaceum) Fats. In Fruit Oils: Chemistry and Functionality; Ramadan, M.F., Ed.; Springer International Publishing: Cham, Switzerland, 2019; pp. 273–280. [Google Scholar]
  34. Rakariyatham, K.; Zhou, D.; Rakariyatham, N.; Shahidi, F. Sapindaceae (Dimocarpus longan and Nephelium lappaceum) seed and peel by-products: Potential sources for phenolic compounds and use as functional ingredients in food and health applications. J. Funct. Foods 2020, 67, 103846. [Google Scholar] [CrossRef]
  35. Tingting, Z.; Xiuli, Z.; Kun, W.; Liping, S.; Yongliang, Z. A review: Extraction, phytochemicals, and biological activities of rambutan (Nephelium lappaceum L.) peel extract. Heliyon 2022, 8, e11314. [Google Scholar] [CrossRef]
  36. Temitope, O.A.; Oluwatoyin, T.O. Biodiversity of Sapindaceae in West Africa: A checklist. Int. J. Biodivers. Conserv. 2012, 4, 326–331. [Google Scholar]
  37. Zhang, W.; Lin, J.; Li, J.; Zheng, S.; Zhang, X.; Chen, S.; Ma, X.; Dong, F.; Jia, H.; Xu, X.; et al. Rambutan genome revealed gene networks for spine formation and aril development. Plant J. 2021, 108, 1037–1052. [Google Scholar] [CrossRef] [PubMed]
  38. Fila, W.; Johnson, J.; Edem, P.; Odey, M.; Ekam, V.; Ujong, U.; Eteng, O. Comparative anti-nutrients assessment of pulp, seed and rind of rambutan (Nephelium lappaceum). Ann. Biol. Res. 2012, 3, 5151–5156. [Google Scholar]
  39. Arias-Cruz, M.E.; Velásquez-Ramírez, H.A.; Mateus-Cagua, D.; Chaparro-Zambrano, H.N.; Orduz-Rodríguez, J.O. El rambután (Nephelium lappaceum), frutal asiático con potencial para Colombia: Avances de la investigación en el piedemonte del Meta. Rev. Colomb. Cienc. Hortícolas 2016, 10, 262–272. [Google Scholar]
  40. Vargas-Calvo, A. Síntomas asociados con altas concentraciones de boro en rambután (Nephelium lappaceum). Agron. Mesoam. 2009, 20, 121–126. [Google Scholar] [CrossRef]
  41. Yingsanga, P.; Wattanakulpakin, P. Storage quality of Spinterned and non-Spinterned Rongrien Rambutan. In Proceedings of the II Southeast Asia Symposium on Quality Management in Postharvest Systems 1088, Vientiane, Laos, 4–6 December 2013; pp. 141–144. [Google Scholar]
  42. Kedare, S.B.; Singh, R.P. Genesis and development of DPPH method of antioxidant assay. J. Food Sci. Technol. 2011, 48, 412–422. [Google Scholar] [CrossRef] [Green Version]
  43. Bondet, V.; Brand-Williams, W.; Berset, C. Kinetics and Mechanisms of Antioxidant Activity using the DPPH.Free Radical Method. LWT Food Sci. Technol. 1997, 30, 609–615. [Google Scholar] [CrossRef]
  44. Munteanu, I.G.; Apetrei, C. Analytical Methods Used in Determining Antioxidant Activity: A Review. Int. J. Mol. Sci. 2021, 22, 3380. [Google Scholar] [CrossRef] [PubMed]
Figure 1. Cáscara roja del N. lappaceum.
Sustainability 15 05188 g001
Figure 2. Cáscara amarilla del N. lappaceum.
Sustainability 15 05188 g002
Figure 3. Reference to the percentage inhibition of DPPH in ascorbic acid.
Sustainability 15 05188 g003
Figure 4. Percent inhibition of DPPH with N. lappaceum extract.
Sustainability 15 05188 g004
Figure 5. Percentage inhibition of DPPH with N. lappaceum extract.
Sustainability 15 05188 g005
Table 1. Quantity of reagents to be used for the ascorbic acid curve.
Time
(Minutes)
StandardWorking Volume Ascorbic Acid (mL)Volume MeOH (mL)Volume DPPH (mL)Concentration (mg/L)
0:00:0010.204.801.000.837
0:02:0020.404.601.001.673
0:04:0030.604.401.002.510
0:06:0040.804.201.003.347
0:08:0051.004.001.004.183
0:10:00Blank control0.005.001.00
---Blank3.003.000.00
---MeOH0.006.000.00
Table 2. Quantity of reagents to be used to perform the % DPPH inhibition of Nephelium lappaceum peel extracts.
Time
(Minutes)
SampleVolume Extract (mL)Volume MeOH (mL)Volume DPPH (mL)
0:00:0010.201.801.00
0:01:0020.401.601.00
0:02:0030.601.401.00
0:03:0040.801.201.00
0:04:0051.001.001.00
0:05:00Blank control0.002.001.00
0:06:00Blank2.001.000.00
---MeOH0.003.000.00
Table 3. Absorbance results and % inhibition of DPPH and ascorbic acid.
StandardAliquotConcentrationAbsorbance% Inhibition
10.401.680.361115.5813024
20.602.530.228342.1094686
30.803.370.084770.7950459
41.004.21−0.02592.7087495
Blank control 0.4391
Blank −0.0615
MeOH −0.0615
Table 4. Absorbance results and % inhibition of DPPH and Nephelium lappaceum red peel extract.
StandardAliquotConcentrationAbsorbance% Inhibition
10.400.0130.09563.7820
20.600.0200.08973.8084
30.800.0270.08183.8438
41.000.0340.07673.8666
51.200.0400.07023.8957
Blank control 0.8755
Blank 0.0469
MeOH −0.0181
Table 5. Absorbance results and % inhibition of DPPH and Nephelium lappaceum yellow peel extract.
StandardAliquotConcentrationAbsorbance% Inhibition
10.200.0070.09231.8700
20.400.0130.08721.8828
30.600.0200.07511.9132
40.800.0270.06821.9305
51.000.0340.06361.9420
Blank control 0.7768
Blank 0.0405
MeOH −0.0203
Disclaimer/Publisher’s Note: The statements, opinions and data contained in all publications are solely those of the individual author(s) and contributor(s) and not of MDPI and/or the editor(s). MDPI and/or the editor(s) disclaim responsibility for any injury to people or property resulting from any ideas, methods, instructions or products referred to in the content.

