Article

Effect of a Circular Cylinder on Hydrodynamic Characteristics over a Strongly Curved Channel

1
School of Economics and Management, Zhejiang Ocean University, Zhoushan 316022, China
2
School of Naval Architecture, Ocean and Civil Engineering, Shanghai Jiao Tong University, Shanghai 200240, China
3
Ocean College, Zhejiang University, Hangzhou 310058, China
4
The Engineering Research Center of Oceanic Sensing Technology and Equipment, Ministry of Education, Zhoushan 316021, China
5
Donghai Laboratory, Zhoushan 316021, China
6
Yuhang District Emergency Management Bureau, Hangzhou 311121, China
*
Authors to whom correspondence should be addressed.
Sustainability 2023, 15(6), 4890; https://doi.org/10.3390/su15064890
Submission received: 15 November 2022 / Revised: 6 March 2023 / Accepted: 6 March 2023 / Published: 9 March 2023
(This article belongs to the Special Issue Sustainable Solutions for Hydraulic Engineering)

Abstract

:
Curved channels are one of the most fundamental units of natural or artificial channels, in which there are different kinds of obstacles; these include vegetation patches, bridge piles, electrical tower foundations, etc., which are all present over a channel bend, and can significantly alter the hydrodynamic characteristics of a channel when compared to a bare bed. In this study, laboratory experiments and numerical simulations were combined to investigate the effect of a circular cylinder on the flow characteristics of a 180-degree U-shaped curved channel. Experimental data, including on water depth and three-dimensional velocity, which was obtained by utilizing acoustic Doppler velocimetry (ADV), were used to calibrate and verify the simulation results of the Reynolds-Averaged Navier–Stokes (RANS) model in the FLOW-3D software. Numerical results show that a larger cylinder diameter leads to an overall greater depth-averaged velocity at the section, a greater shear stress acting on the banks on which the cylinder is placed, and a greater increase in the depth-averaged velocity along the concave bank compared to that along the convex bank. When the diameter of the cylinder placed at the 90° section increases, two weaker circulations with the same direction are found near the water surface; for the submerged one, the two weaker circulations appear at the further downstream section, unlike the emergent one. The degree of variation degree in the shear stress acting on the banks is larger than that of the flowrate. As the flowrate increases or the radius of curvature decreases, the secondary flow intensity correspondingly elevates. However, the curvature radius of the curved channel plays a more important role in the secondary flow intensity than the flowrate does. For both the emergent and submergent cylinders, the large cylinder produces a greater secondary flow strength, but the emergent one has a greater secondary flow strength than the submergent one. In summary, the present study provides valuable knowledge on the hydrodynamics of flow around emergent and submergent structures over a curved channel, which could improve the future design of these structures.

1. Introduction

Rivers are commonly curved in nature, and the flow in a curved channel (also called a curved flow) follows a helicoidal path and initiates a secondary circulation; this is able to significantly affect the primary flow motion and, in turn, influence pollutant dispersion and sediment transport [1,2]. Therefore, it is of great significance to investigate the hydrodynamic characteristics of flow in curved channels for river management, port construction, water diversion, the prevention of sediment erosion, improvements in river navigation and so on. Since Thomson firstly reported the existence of a spiral flow pattern in bend channels in 1876 [3], many studies have been devoted to understanding the hydrodynamic characteristics of a curved channel via using theoretical derivation, field observations, laboratory measurements, and numerical simulations. For example, analytical formulas have been proposed to qualitatively predict the secondary circulation and resulting bottom topography of channels [4,5]. In addition, it has been found that the channel curvature ratio CR (channel width B/curvature radius R) can affect the location and strength of the secondary circulation [6]. As the CR values decrease, the strength of the secondary circulation is improved [7,8]. Blanckaert and Graf [9] experimentally revealed that two cells of circulation appear at the cross-section of a curved channel: one is the classical helical motion that is located at the center-region cell, and the other weaker one is found in the outer corner (concave bank). By using the three-dimensional nonhydrostatic Reynolds-Averaged Navier–Stokes (RANS) model, Zeng et al. [10] concluded that the turbulent kinetic energy in the channel bend is significantly larger than that at the entrance and the exit, and that the bathymetry over the bend regions could significantly change the streamwise velocity, secondary circulation, and turbulent energy, among others. van Balen et al. [11] used the results of Large Eddy Simulation (LES) to prove that turbulence anisotropy contributes to the formation of the outer-bank secondary cell in a 180-degree open channel bend. Vaghefi et al. [12] indicated that the maximum shear stress occurs from the entrance of the bend to the bend apex area near the inner wall. These studies have provided new insights on flow over smooth curved channels.
For natural rivers or artificial channels, there are different kinds of obstacles that are present over a channel bend. The differences in the flow characteristics between a curved channel and a straight channel lead to the redistribution of shear stress in the bed and in the subsequent scouring patterns [13]. For example, vegetation is commonly found in the waterways and floodplains of natural rivers, and increases the overall flow resistance and water depth, changes the velocity distribution, reduces the bed shear stress, and reduces the capacity for bedload transport [14]. Spur dikes, which are hydraulic engineering structures, are often placed in the outer (concave) bank of a channel bend to control the bank scour and its lateral migration [15]. Both vegetation and spur dikes have been proven to considerably alter the flow field and bed topography in a channel bend [16,17]. In addition, other structures, including emergent types (bridge pile and electrical tower foundation) and submerged types (fish habitat structures and water intakes), are commonly placed in a curved channel [18]. Few studies have focused on the above-mentioned structures in a curved channel. Masjedi et al. [15] tested the scour prevention measures around an oblong pier over a 180-degree flume bend. Korkmaz and Emiroglu [19] reported the scouring patterns of bridge abutments that extended from an inner or outer bank, and found that the maximum scour depth around the abutments placed on the outer bank was 1.45 times that of the scour depth on the inner bank. However, little attention has been paid to investigating the effects of a circular cylinder placed in the middle of a curved channel. In addition, the dynamics response of a bluff body with flow can be used to harvest energy [20,21,22]. The effect of secondary circulation from curved channels on this energy harvesting mechanism behind a bluff body also requires further study.
In the present study, experimental laboratory and numerical simulations were combined to elucidate the impact of a rigid circular cylinder on curved channel flow, including streamwise velocity distribution, streamline distribution, depth-averaged velocity distribution and average secondary flow intensity. For numerical simulations, although LES (large-eddy simulation) and DNS (direct numerical simulation) can resolve the large-scale anisotropy of turbulence, the expensive computational cost limits their engineering applications [23,24]. Therefore, instead, the RANS models in the FLOW-3D software were selected for this study. As previous studies indicated [25,26,27], the widely used RANS models are unable to accurately simulate the flow separation around bluff bodies (such as cylinders), as well as the vortex-shedding frequency. Therefore, the mean flow quantities for a circular cylinder placed over a curved channel are our main focus. The reliability and accuracy of the numerical model was firstly verified by corresponding laboratory experiments. Then, the effects of emergent and submergent cylinders, the flowrate, and the curvature radius of the flume on flow features over a curved channel were numerically discussed. This paper is organized as follows. In Section 2, the experimental and numerical setup with the corresponding parameters are described in detail. The results and discussions are provided in Section 3. Finally, the main conclusions are provided in Section 4.

2. Materials and Methods

2.1. Experimental Setup

Laboratory experiments were carried out in a 180-degree U-shaped recirculating Plexiglas flume with the placement of a circular cylinder, as shown in Figure 1, in the Ocean Engineering Laboratory of Zhoushan Campus, Zhejiang University, China. The flume is 33 m in length, 40 cm wide and 40 cm high, with a constant slope of 0.005. The flume is composed of three parts: a 12 m long inlet straight reach, a 180-degree U-shaped curved reach with a central curvature radius R of 1.4 m, and a 16 m long outlet straight reach. The inlet length is long enough to produce fully a developed flow in the curved region of the flume. A series of honeycomb grids were installed at the entrance of the flume to stabilize the flow and prevent the formation of large-scale flow disturbances. In the study, the inflow discharge Q was set as 30 L/s, and the downstream water depth was fixed at 35 cm using an adjustable tailgate.
In the experiments, a Nortek Vectrino ADV (Nortek AS, Vangkroken 2, N-1351 Rud, Norway) was adopted to measure three-dimensional instantaneous velocities (x—longitudinal direction, y—transverse direction, and z—vertical direction), i.e., streamwise velocity (u), transverse velocity (v) and vertical velocity (w), where the x and y directions are relative to the curved channel. The ADV sampling volume was 0.09 cm3 and measured the flow velocity 5 cm below the tip of the probe. The velocity range of the ADV measurements was set to ±1 m/s, with an accuracy of ±0.5% for the measured value. The noise in the velocity measurements (=0.4 cm/s) was determined in still water [17]. The sampling frequency of the ADV was 25 Hz, and the measurement time of each point was set to 120 s, which is sufficient in order to obtain stable statistics for flow data, as Yang et al. [17] suggested.
Two smooth and rigid circular cylinders (15 cm in diameter), were made of Plexiglass with different heights, i.e., 10 cm (submerged, smaller than local water depth) and 40 cm (emergent, larger than local depth). For experiments, one cylinder was placed at the centerline of three different locations, namely at 0°, 90°, or 180° sections (see Figure 1b). In each case, five specific sections (0°, 45°, 90°, 135° and 180°) were selected for velocity measurements, and in each section, three vertical lines (10 cm, 20 cm and 30 cm from the inner wall) were chosen with three measuring points at each vertical line (2 cm, 12 cm and 18 cm from the bed). Since the Doppler noise and air bubbles could have interfered with the acoustic signal and deteriorate the quality of the measured data, data processing was required in order to obtain reliable data. In this study, the SNR (signal to noise ratio) had to be above 20 and the COR (correlation coefficient) had to be above 70 for the measured data [28]. Furthermore, the raw data were de-spiked using the algorithm suggested by Goring and Nikora [29]. The flow depth was measured using water level gauges at three vertical locations (y/B = 0.25, y/B = 0.5 and y/B = 0.75, where y = 0 is at the convex bank and B is the channel width) for each cross-section along the flume. Since the curvature radius of bend R (=1.4 m) was small, the flow depths along the transverse direction were approximately the same. According to the flow conditions at the 0° section, the Reynolds numbers Re and Froude numbers Fr were approximately 130,000 and 0.178, respectively, which meant that the flow belonged to the turbulent and subcritical flow regime, as is commonly found in natural situations.

2.2. Numerical Analysis Using FLOW-3D

To simulate the curve channel flow, FLOW-3D, a commercial software with the ability to solve transient and free-surface flows, was adopted. In FLOW-3D, the finite volume method (FVM) in a Cartesian, staggered grid is employed to solve the Reynolds’ average Navier–Stokes (RANS) equations. The fractional area–volume obstacle representation (FAVOR) technique in FLOW-3D is a unique feature that can simulate flow patterns in embedded geometry without changing the mesh [27]. In addition, the Volume of Fluid (VOF) is used to track the free surface [28,29]. This code has been validated extensively for various fluid flow problems in both academic and engineering applications [30,31,32].
In this study, the water depth, streamwise velocity and secondary flow, with and without a circular cylinder, were numerically studied using FLOW-3D. The numerical domains were based on the experimental channel mentioned above. The mesh size is crucial for the accuracy and efficiency of the numerical simulations. For the mesh size, we referred to several previous studies [33,34,35,36], in which the range in the mesh size is between 1/15 D and 1/8 D, where D is the diameter of the cylinder. Therefore, the minimum grid size chosen was approximately 1/15 D in our study, based upon the balance of the computational cost and the simulation accuracy. FLOW-3D software automatically determines the best time step to ensure the stability of the numerical model.
In the computational domain (Figure 2), cylinders with two different diameters D (4 cm and 15 cm) were selected as simulation cases. For the larger one (D = 15 cm), the mesh size was set as 1 cm (=1/15 D) at the regions of four diameters (4 D) in front of the cylinder and 8 D behind the cylinder. At the rest parts of the computational domain, the mesh size was 2 cm. Around the cylinder, the minimum dimensionless wall distance from a mesh center [ Δ x + = u * Δ x ν , Δ y + = u * Δ y ν , Δ z + = u * Δ z ν ] was approximately equal to 75, where Δ x , Δ y and Δ z are the wall distance from a mesh center along the x, y and z directions, and ν is the kinematic viscosity of water. Along the side wall, Δ x + , Δ y + and Δ z + were equal to 150. In comparison to the mesh size of 8 mm in the cylinder region, the difference in the streamwise velocity was less than 3%, suggesting that the adopted mesh size was sufficient to show the detailed flow patterns. On the other hand, for the smaller one (D = 4 cm), the nested meshes were used to facilitate the computation (see the inset figure in Figure 2). The size was set as 2.5 mm (1/16 D) only in the regions of 1 D in front of the cylinder and 2 D behind the cylinder. For the regions between 1 D and 2 D in front of the cylinder and between 2 D and 4 D behind the cylinder, the mesh size was 5 mm (1/7.5 D). For the regions between 2 D and 4 D in front of the cylinder and between 4 D and 8 D behind the cylinder, the mesh size was 1 cm (1/3.75 D). In the remaining parts of the computational domain, the mesh size was set as 2 cm. Around the cylinder, the minimum dimensionless wall distance from a mesh center for Δ x + ,   Δ y + and Δ z + was approximately equal to 38, and along the side wall, Δ x + ,   Δ y + and Δ z + were roughly 150. If the mesh size was decreased by 20%, the difference in the longitudinal velocity was less than 3%. The mesh size adopted is comparable (or even better) to that used in the previous study [6]. Therefore, the current mesh sizes were enough to obtain the detailed features of the mean flow fields.
The boundary conditions shown in Figure 2 for the inflow were set as the flowrate, and for the outflow the water depth and pressure were specified. For the free water surface, the atmospheric pressure was assigned. Two inter-block junctions with a straight and curved reach were defined as the symmetrical condition [36]. In addition, a no-slip condition was applied to the wall boundaries and cylinder surface.
The simulation ran for 600 s to ensure the attainment of steady state conditions. For turbulence closure models, the renormalization group (RNG) k-ε model, known to describe low-intensity turbulence flows and flows with strong shear regions more accurately [37,38,39], was selected. The RNG model systematically removes all small scales of motion from the governing equations by considering their effects in terms of a larger scale motion and a modified viscosity [40]. The comparisons made between the streamwise velocity profiles and the secondary circulation flow on a bare bed of a curved channel from the FLOW-3D results can refer to [41]; this is not repeated here.

3. Results and Discussions

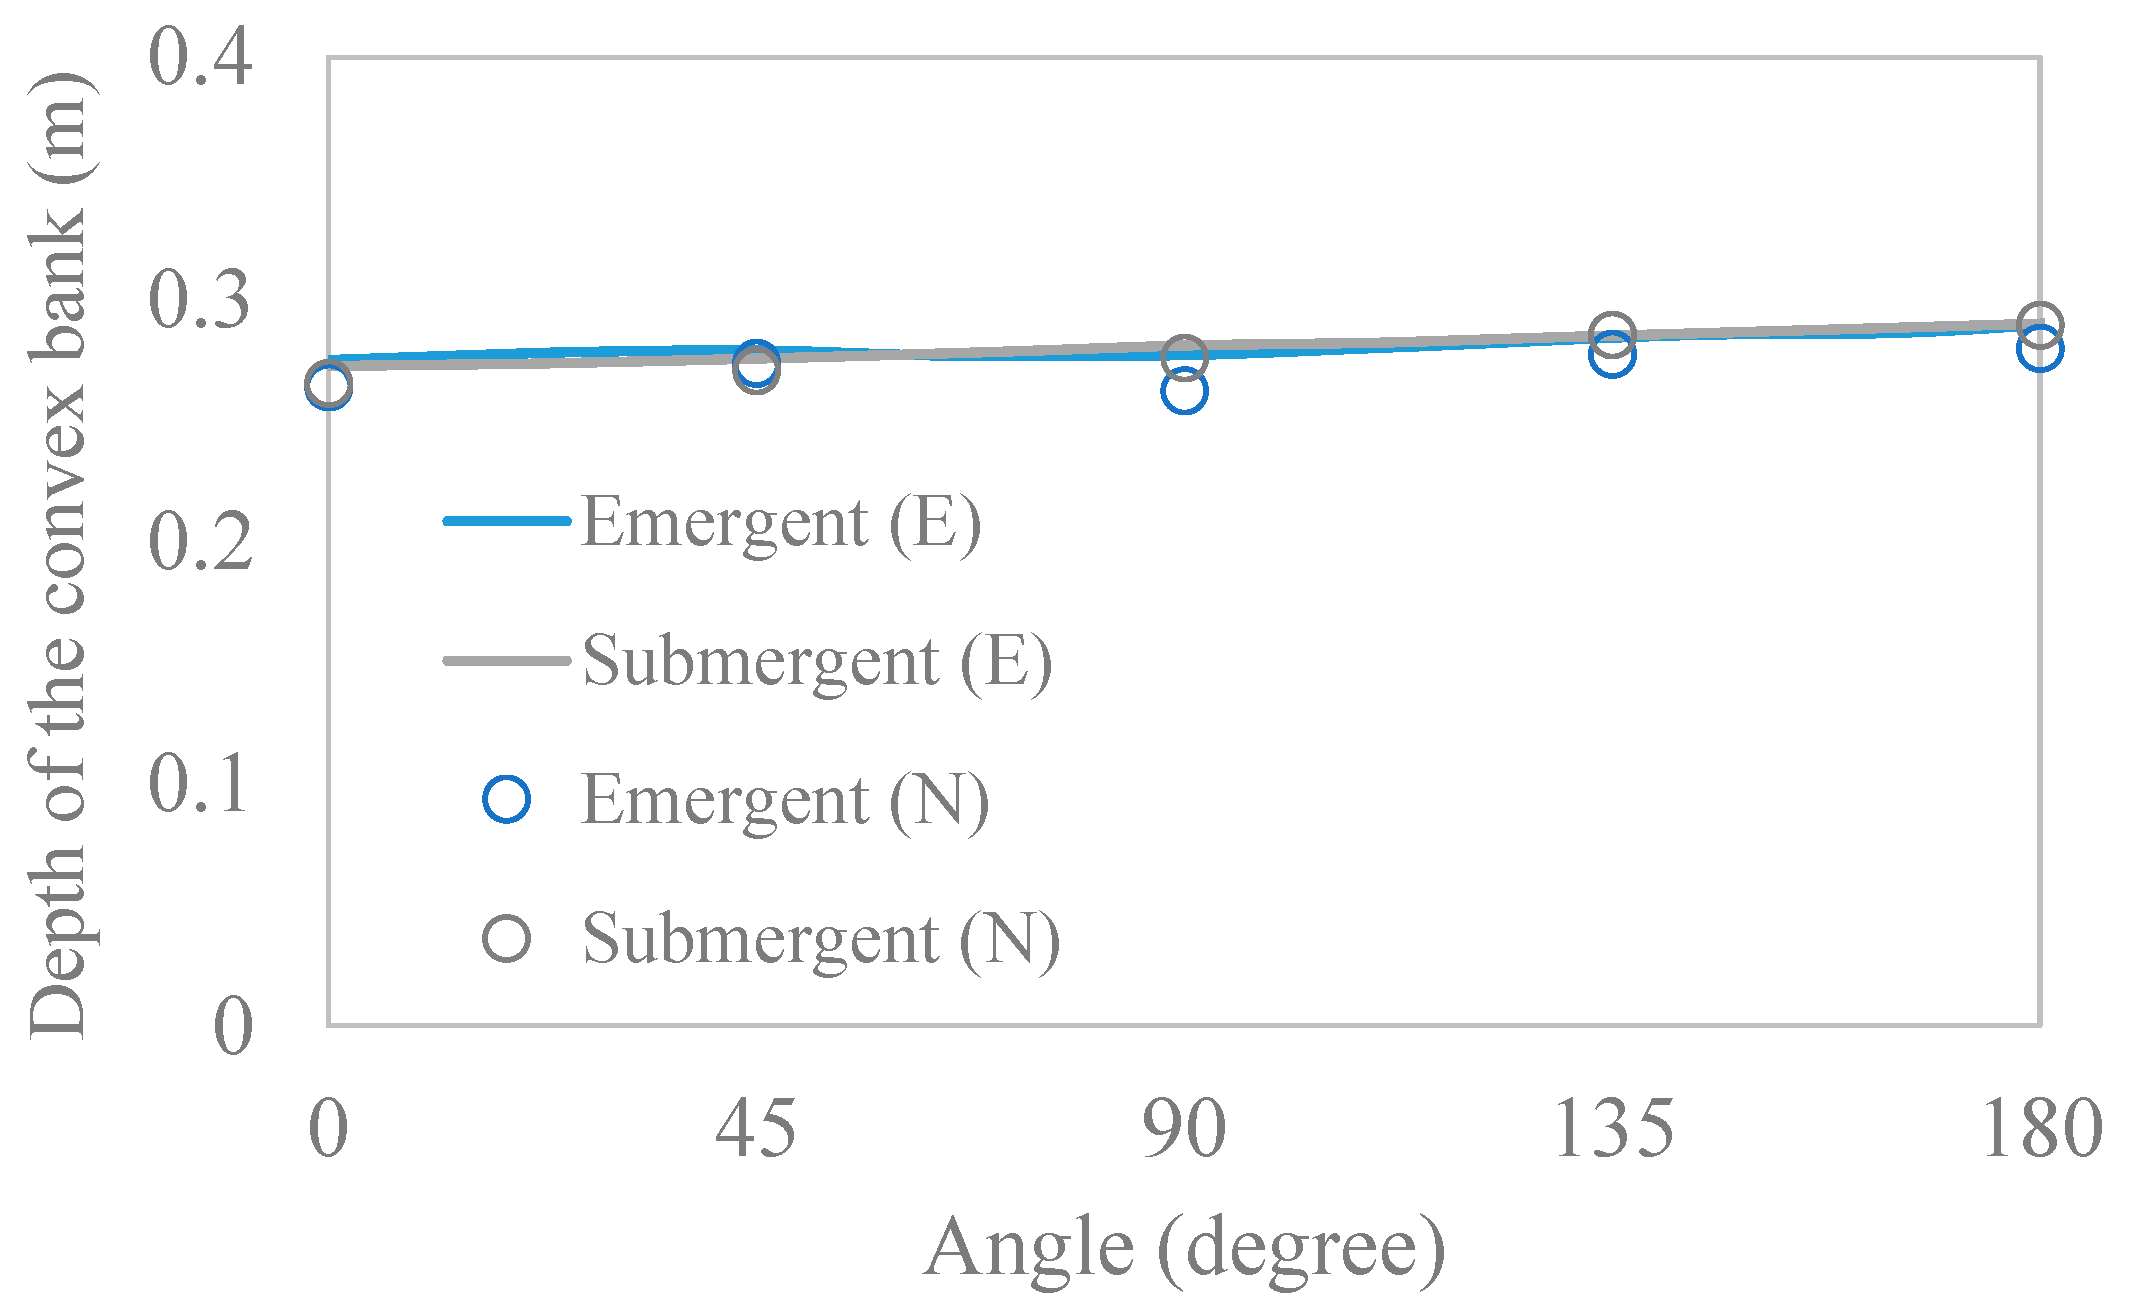
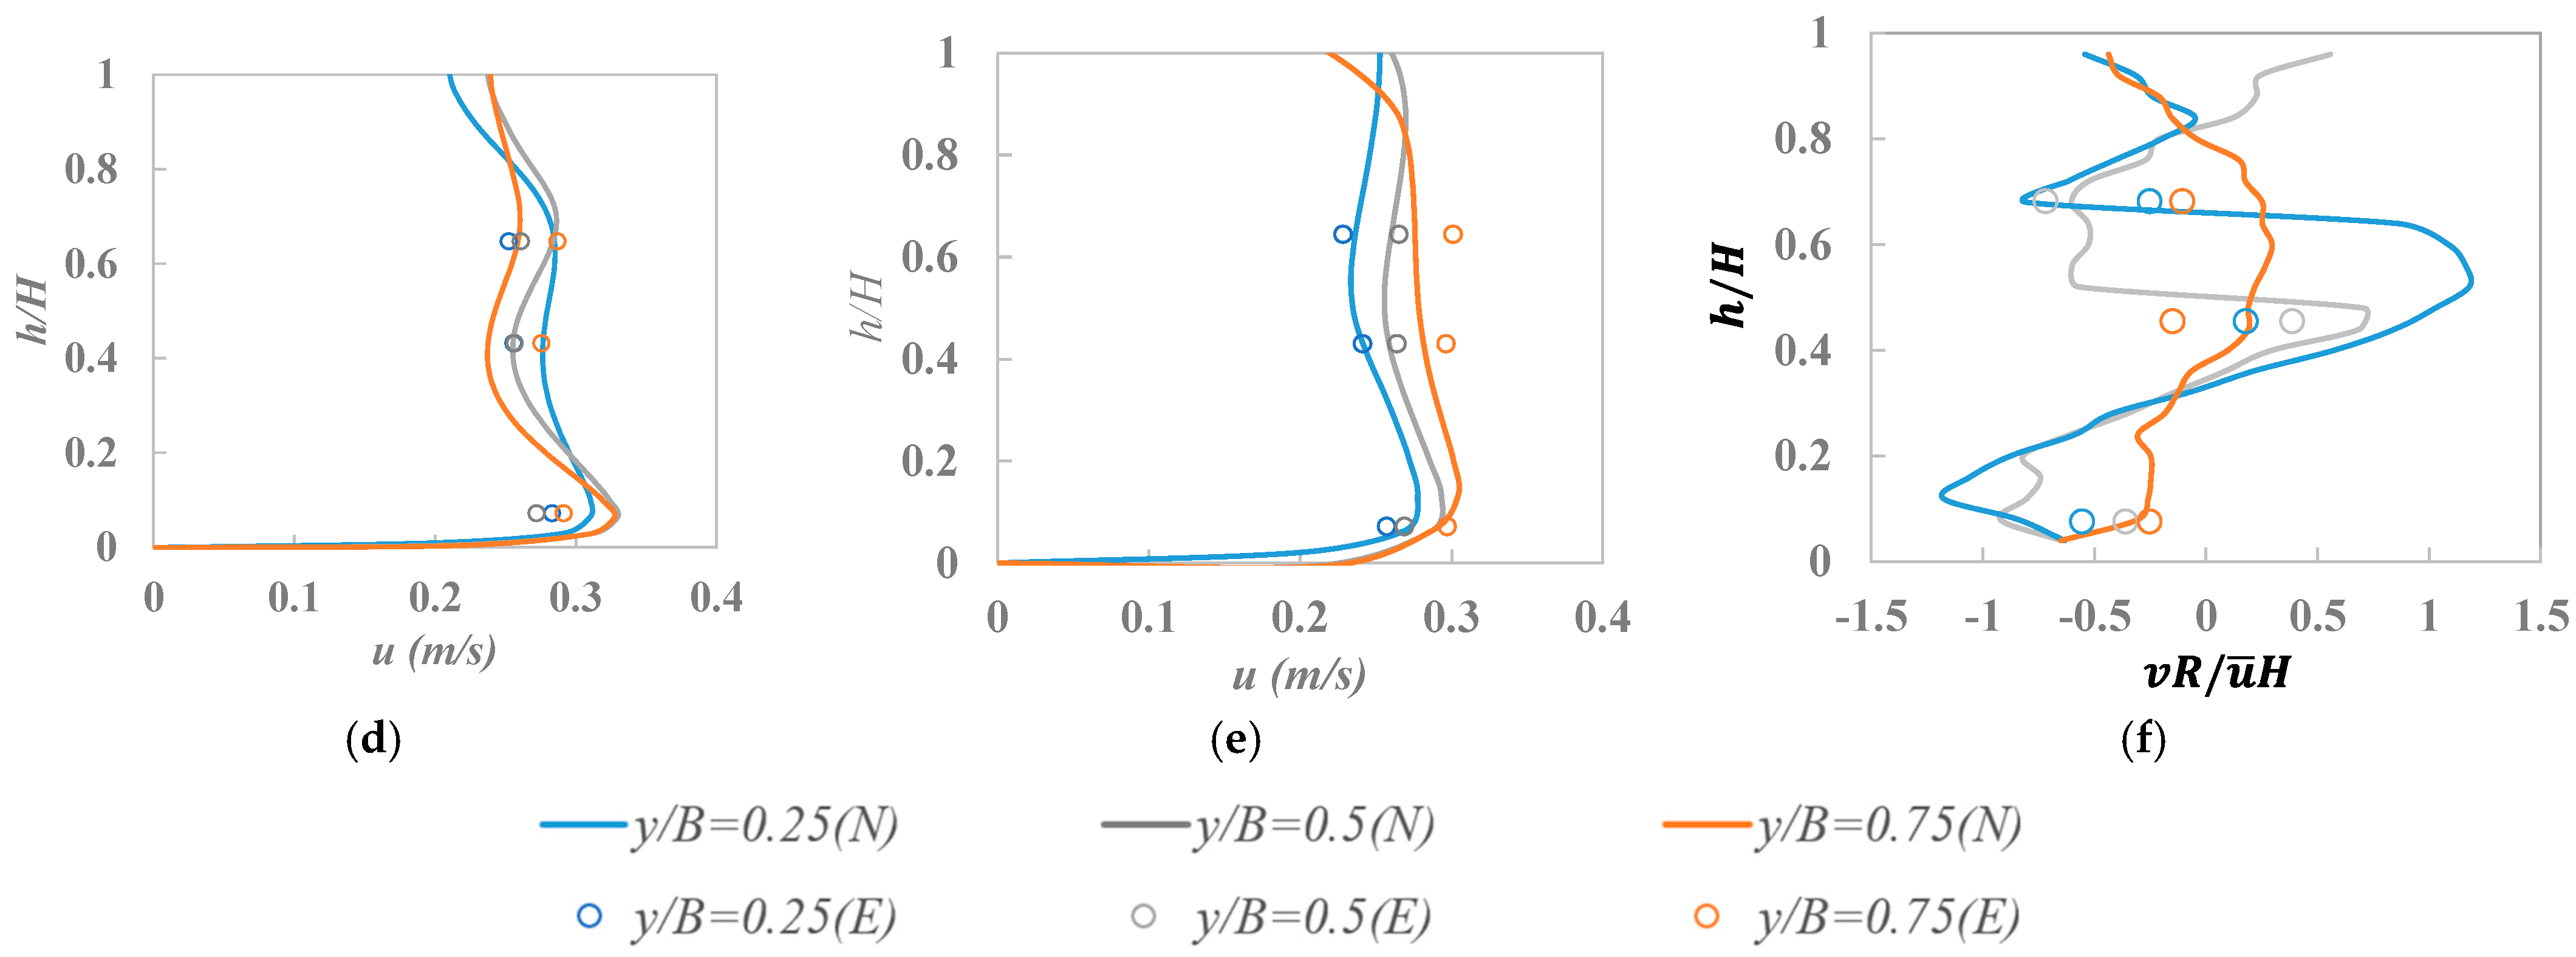
3.1. Model Calibration and Verification

In this study, the three-dimensional numerical model carried by FLOW-3D was calibrated with the experimental data that were collected in the 180-degree U-shaped curved channel. The roughness height ks in the FLOW-3D simulations was adjusted until the numerical results were close to the experimental data. The roughness height ks = 0.001 m matched well with the experimental data that represented water depth and the streamwise velocity profiles, which were averaged in 5 s, as shown in Figure 3, Figure 4 and Figure 5 (the cylinder placed in the 90° section as an example). Due to the small quantity of flow and the small radius of curvature, the transverse variations in the water depth were small and almost negligible. The depths of the convex bank between the measurements and simulations are compared in Figure 3. The mean relative error (MRE) is used to assess the accuracy of the numerical model, which is given by the following:
M R E = s i m u l a t i o n m e a s u r e m e n t m e a s u r e m e n t × 100 % .
The MRE values were 3.60% and 1.42% for the emergent and submergent cases, respectively. For streamwise velocity comparisons, the MRE values for the emergent (Figure 4) and submergent (Figure 5) cases were 6.84% and 5.32%, respectively, suggesting that the numerical model with the present mesh setting can accurately simulate the motions of curved channel flows with a circular cylinder. Figure 4f and Figure 5f present the comparison of the secondary flow distributions made between the measurements and simulations, where the X-axis is v R / u ¯ H , the Y-axis is h / H , H is the water depth, and u ¯ is the average longitudinal velocity. When the calculated values ( v R / u ¯ H ) distribute on the same side of v R / u ¯ H   = 0, i.e., all v R / u ¯ H values are larger or smaller than zero, it means that the direction of transverse velocity is the same at this position. In other words, there is no secondary flow. Once the calculated values ( v R / u ¯ H ) fall on the two sides of v R / u ¯ H = 0, a secondary flow exists. In addition, the secondary flow is stronger as the slope of the transverse velocity distribution increases [41]. The comparisons show that the measurements generally follow the same trend as the simulations. Since the transverse velocity is usually small (less than 5 cm/s), the presence of the ADV probe (even though the measurement point is located at 5 cm below the probe) somehow affects the secondary circulation.
As Lin et al. [41] mentioned, two factors are possibly responsible for the discrepancy between the simulation and measurements, which are as follows: (1) the RNG turbulence model assumes isotropic turbulence, which is not feasible for the curved channel flow, and (2) the channel slope may not be constant along the flow course. Overall, the calibrated numerical model can reproduce the flow patterns well, and so can be used to elucidate the flow patterns of a circular cylinder over a curved channel for different factors in the following sections.

3.2. Distribution of Normalized Depth-Averaged Velocity over a Curved Channel

Figure 6 shows the normalized depth-averaged velocity UD/U (UD is the depth-averaged velocity, and U is the average velocity of the 0° section) averaged in 5 s when the emergent and submerged cylinders with different diameters are placed at the 90° section, respectively. The bare bed result in Figure 6a is provided for comparison purposes. Similar to previous studies [7,8,17], the velocity is faster near the convex bank at the beginning of the curved channel, and the core region of maximum velocity obviously shifts toward the concave bank at the 90° and 180° sections.
Figure 6b–e shows that the presence of a circular cylinder generally does not affect the depth-averaged velocity distribution at the regions that have a distance larger than 2 D from its upstream. However, the placement of the cylinder reduces the depth-averaged velocity of its upstream and downstream sides (recirculation zone), increases the depth-averaged velocity of its lateral sides significantly, and leads to a greater increase in the depth-averaged velocity along the convex bank compared to that along the concave bank. For the emergent cylinder with a diameter of 4 cm (D/B = 0.1), the velocity increase area on the concave side of the channel is greater than that on the convex side, as demonstrated in Figure 5b. On the contrary, for the cylinder with a diameter of 15 cm (D/B = 0.375, Figure 6c), the velocity increase range is larger on the convex side of the channel, and the maximum value of the curved channel flow is continuously adjusted from the convex side to the concave side along the channel bend. On the other hand, for the submerged cylinder (height h’ = 0.1 m), the depth-averaged velocity is reduced after the 120° section (Figure 6d,e). The increase in the submerged cylinder diameter complicates the curved channel flows and redistributes the depth-averaged velocity. Behind the cylinder, the cylinder with a diameter of 15 cm (D/B = 0.375) leads to a greater increase in the depth-averaged velocity on the concave bank, and a greater reduction in the depth-averaged velocity on the convex bank, compared to that with a diameter of 4 cm (D/B = 0.1).

3.3. Streamwise Velocity and Circulation Distribution for Different Diameter of an Emergent Cylinder

Figure 7 presents the streamwise velocity and cross-stream circulation distributions for a bare bed, and an emergent circular cylinder with a diameter of 4 cm (D/B = 0.1) or 15 cm (D/B = 0.375) placed at the 90° section of the curved channel, respectively. The bare bed case used for comparison reveals that two opposite circulations are produced at the 90° section (Figure 7a—90°), where one (also called the center-region cell) is stronger and occupies larger lower and left regions (convex bank); the other one (also called the outer-bank cell) is weaker and exists at the small upper and right regions (concave bank), as Blanckaert and Graf [9] mentioned. The strength of the two circulations gradually becomes comparable at the 135° and 180° sections, as shown in Figure 7a—135° and 180°. For the presence of an emergent cylinder at the 90° section, it can be seen that the magnitude of the streamwise velocity is proportional to the diameter of the cylinder. This is because a larger cylinder decreases the number of cross-section areas that flow can pass through, leading to greater streamwise velocity. Furthermore, the streamwise velocity along the convex bank is greater than that along the concave bank at the 90° section, and there is a greater reduction in streamwise velocity along the upper convex bank and a greater increase in streamwise velocity along the lower part of convex bank at the 180° section. In addition, the combined effects of the cylindrical wake vortex and curved channel flow complicate the streamwise velocity distribution at the 135° section. When the cylinder diameter increases, the streamwise velocity at the bottom and convex bank of the 135° section increases rapidly, but the streamwise velocity at the upper part of the 135° section decreases markedly.
In terms of secondary circulation structures, the center-region cell disappears because the emergent cylinder occupies the 90° section (Figure 7c—90°). Furthermore, as the cylinder diameter increases, two weaker circulations with the same direction appear in the upper part of the 135° section (Figure 7c—135° and 180°); however, this merges into one upper cell at the 180° section. The appearance of the two weak circulations is probably due to the interaction of the side wall and the outer-bank cell, which is worth further study in the future. As the cylinder diameter increases, the center of the center-region cell moves closer to the bottom of the 180° section with the decreased intensity, and the center of the outer-bank cell center moves to the concave bank with decreasing strength as well. Results show that the streamline formed behind a larger cylinder has a stronger interaction with the curve channel, which leads to the formation of an asymmetric circulation pair behind the cylinder. On the other hand, for a smaller cylinder, the circulation pair behind it still performs symmetrical patterns, similar to the circulation patterns in a straight channel. Figure 7d,e present the water surface streamlines behind an emergent cylinder of two different sizes. Results show that the streamlines (Figure 7e) formed behind a larger cylinder have a stronger interaction with the curve channel, which leads to oscillating streamlines due to vortex shedding and the formation of an asymmetric circulation pair behind the cylinder. On the other hand, for a smaller cylinder (Figure 7d), the wake region is small and the circulation pair behind it performs symmetrical patterns.

3.4. Streamwise Velocity and Circulation Distribution for Different Diameter of a Submerged Cylinder

Figure 8 demonstrates the streamwise velocity and streamline distribution for a submerged cylinder placed at the 90° section with two different diameters. Since the submerged cylinder occupies less volume than the emergent one, it has less influence on the hydrodynamics of the curve channel flows. Similar to the emergent cylinder, the submerged cylinder reduces flow conveyance areas at the 90° section, and the streamwise velocity significantly increases in comparison to the bare bed. In addition, the larger diameter of a submerged cylinder results in a greater increase in the streamwise velocity along the convex bank compared to that along the concave bank at the 90° section. At the 135° and 180° sections, the streamwise velocity decreases at the upper part of the convex bank, but increases at the lower part of the convex bank and the upper part of the concave bank.
In terms of cross-section circulation, for the smaller submerged cylinder, a clockwise circulation structure appears near the concave side tip of the cylinder, and an anti-clockwise circulation structure still exists on the concave bank of the bare bed’s section. On the other hand, when the cylinder diameter increases to 15 cm (D/B = 0.375), clockwise circulations are observed on the upper part of the cylinder and on the concave bank, respectively; however, the circulation intensity near the water surface of the concave bank becomes very weak. With the increase in the submerged cylinder diameter, the strength of the center-region cell circulation also increases, the circulation center moves upward to the middle region of the convex bank, and the outer-bank cell circulation moves outward with decreased strength at the 135° section. At the 180° section, the center of the center-region cell circulation shifts to the convex wall continuously, while the center of the outer-bank cell circulation moves closer to the concave bank. Notably, for the larger submerged cylinder, the outer-bank cell breaks into two circulation cells with the same direction, as shown in Figure 8—180°.

3.5. Effect of Flowrate

Figure 9 presents the depth-averaged velocity distribution for Q = 15 L/s and Q = 45 L/s when a 4 cm diameter emergent cylinder is placed at the 90° section. Compared with the case of Q = 30 L/s in Figure 6b, it is noted that the depth-averaged velocity distribution shows a similar trend for different flow rates. At the 0° section, the maximum velocity appears near the concave bank. Gradually, the region of maximum velocity shifts to the concave bank at the 45° section. At the 90° section, the presence of the cylinder reduces the cross-section area, increasing the overall velocity. As the flowrate increases, the maximum velocity of the 90° section increases, and also the velocity near the concave bank is larger. In addition, the low velocity regions behind the cylinder extend to further downstream with the increases in the flowrate.
Figure 10 provides the circulation structure for Q = 15 L/s and Q = 45 L/s when a 4 cm diameter emergent cylinder is placed at the 90° section. In comparison with the case of Q = 30 L/s in Figure 6b, it is suggested that with the increase in the flowrate, the center-region cell circulation is dominant, and the outer-bank cell circulation becomes less obvious. In addition, the larger flowrate could also induce two weaker circulations behind the cylinder (the 135° and 180° sections).

3.6. Effect of Radius of Curvature

The depth-averaged velocity distribution when the emergent cylinder is placed at the 90° section under different curvature radii is demonstrated in Figure 11. The results show that the increase in the curvature radius leads to a greater depth-averaged velocity along the concave bank compared to that along the convex bank in the curved channel; this increase also leads to a longer cylinder wake, and a smaller depth-averaged velocity along the convex bank than that along the concave bank after the 180° section. Therefore, it can be concluded that when an emergent cylinder is placed at the 90° section, the smaller curvature radius delays the effect of a curved channel, and the maximum velocity region shifts to the outer bank after the 180° section.

3.7. Shear Stress Acting on the Banks

It is important to know how flow-induced shear stress acts on convex and concave banks. In this section, according to numerical simulations, information related to the ways in which shear stress acts on banks in different conditions is provided. Figure 12 shows the shear stress τ that acts on convex or concave banks for different flowrates Q and emergent cylinder diameters D. All τ values are non-dimensionalized by the shear stress τ 0 of Q = 30 L/s and of the bare bed. The results show that the τ / τ 0 values on the concave bank are all greater than those on the convex bank. Furthermore, as mentioned above, the presence of a larger cylinder reduces the flow conveyance area and increases the flow velocity around the cylinder, elevating the shear stress τ acting on the bank. As seen in Figure 12, at the same flowrate Q, the larger cylinder leads to greater levels of shear stress τ on convex and concave banks. For Q = 30 L/s, the τ / τ 0 values are increased by three times for D = 15 cm in comparison with the bare bed case. In terms of the same size of cylinder (D = 4 cm), the flowrate is sensitive to the τ / τ 0 values. When the Q value is reduced by 50%, the τ / τ 0 values become one-third of the original value. On the other hand, if the Q value is double, the τ / τ 0 values are 2.5 times larger than the original value. The degree of variation in the τ / τ 0 values is larger than that of the flowrate. Therefore, when a cylinder is placed over a curved channel, the changes in the shear stress that acts on the banks should be considered.

3.8. Strength of Secondary Flow

To evaluate the strength of the secondary flow, the formula proposed by Shukry [42] is adopted herein, in which the average secondary flow strength S for a specific cross-section can be represented as follows:
S = i K l a t e r a l i K m a i n
where i is the grid point, K l a t e r a l = v 2 + w 2 represents the kinetic energy of the lateral flow, and K m a i n = u 2 + v 2 + w 2 represents the kinetic energy of the main flow. The secondary flow strength S is provided in Figure 13 for different a cylinder height, diameter, flow discharge, and the radius of curvature. In Figure 13a, the secondary flow strength S for the emergent cylinder with a diameter of 4 cm and placed at the 90° section is compared with different flow conditions, and the bare bed case is also provided for comparison. For the bare bed case, the S value reaches its peak at the 90° section among the five selected cross-sections, similar to the results in [8]. As the flowrate increases or the radius of curvature decreases, the secondary flow intensity correspondingly elevates, as [8] revealed. Once the flowrate is increased by 50%, the peak S value is increased by 4.3%; on the other hand, when the radius of curvature is decreased by 50%, the peak S value is elevated by 20.6%. Therefore, according to the simulation results, the increase in the radius of the curvature results in a greater S compared to that which the increase in the flowrate achieves, implying that the radius of curvature plays a more important role in affecting the flow patterns than the flowrate does. For all cases, the S value reaches its maximum at the 90° section. However, for the case of Q = 30 L/s and R = 0.7 m, the S value at the 135° section is still comparable as the peak value, and the S value declines slowly in comparison with other conditions. Figure 12b presents the secondary flow strength S with when a circular cylinder of a different size is placed at the 90° section for Q = 30 L/s and R = 1.4 m. For both emergent and submergent cylinders, the larger cylinder produce a greater secondary flow strength. For example, for the emergent cylinder, the peak S value for D = 15 cm is 14.4% larger than that for D = 4 cm. For the submergent cylinder h = 0.1 m, the peak S value for D = 15 cm is 21.7% larger than that for D = 4 cm. On the other hand, the emergent one has a greater secondary flow strength S than the submergent one. For instance, at the cylinder diameter D = 15 cm, the peak S value for an emergent cylinder is 25.2% larger than that for h = 0.1 m, but this increases to 33.1% for D = 4 cm in the same conditions. However, for a larger cylinder, the maximum secondary flow strength appears later (at the 135° section) than that for a smaller cylinder (at the 90° section). At the 180° section, the average secondary flow intensity remains basically unchanged. For the submergent cylinder, the increase in the cylinder height causes a greater average secondary flow intensity at the 90° section, a greater reduction in the average secondary flow intensity at the 135° section, and an average secondary flow intensity at the 180° section is approximately the same as the 135° section. For both the emergent and submergent cylinders, the large cylinder produces a greater secondary flow strength, with approximately 15% more for D (=15 cm)/D (=4 cm), but the emergent one has a greater secondary flow strength than the submergent one, with a roughly 10~33% increase.

4. Conclusions

In this study, the effect of a circular cylinder on the hydrodynamics of a curved channel flow was investigated. Based on the numerical results from FLOW-3D simulations, the hydrodynamic characteristics of a curved channel flow, such as streamwise velocity distribution, cross-section streamline distribution, depth-averaged velocity distribution and average secondary flow intensity, were analyzed. The conclusions are drawn as follows.
  • The presence of a cylinder will change the hydrodynamic characteristics of the curved channel flow, which has a complex relationship with the diameter of the cylinder. A larger cylinder diameter leads to an overall greater streamwise velocity at the section in which the cylinder is placed, and also a greater increase in the streamwise velocity along the concave bank compared to that along the convex bank.
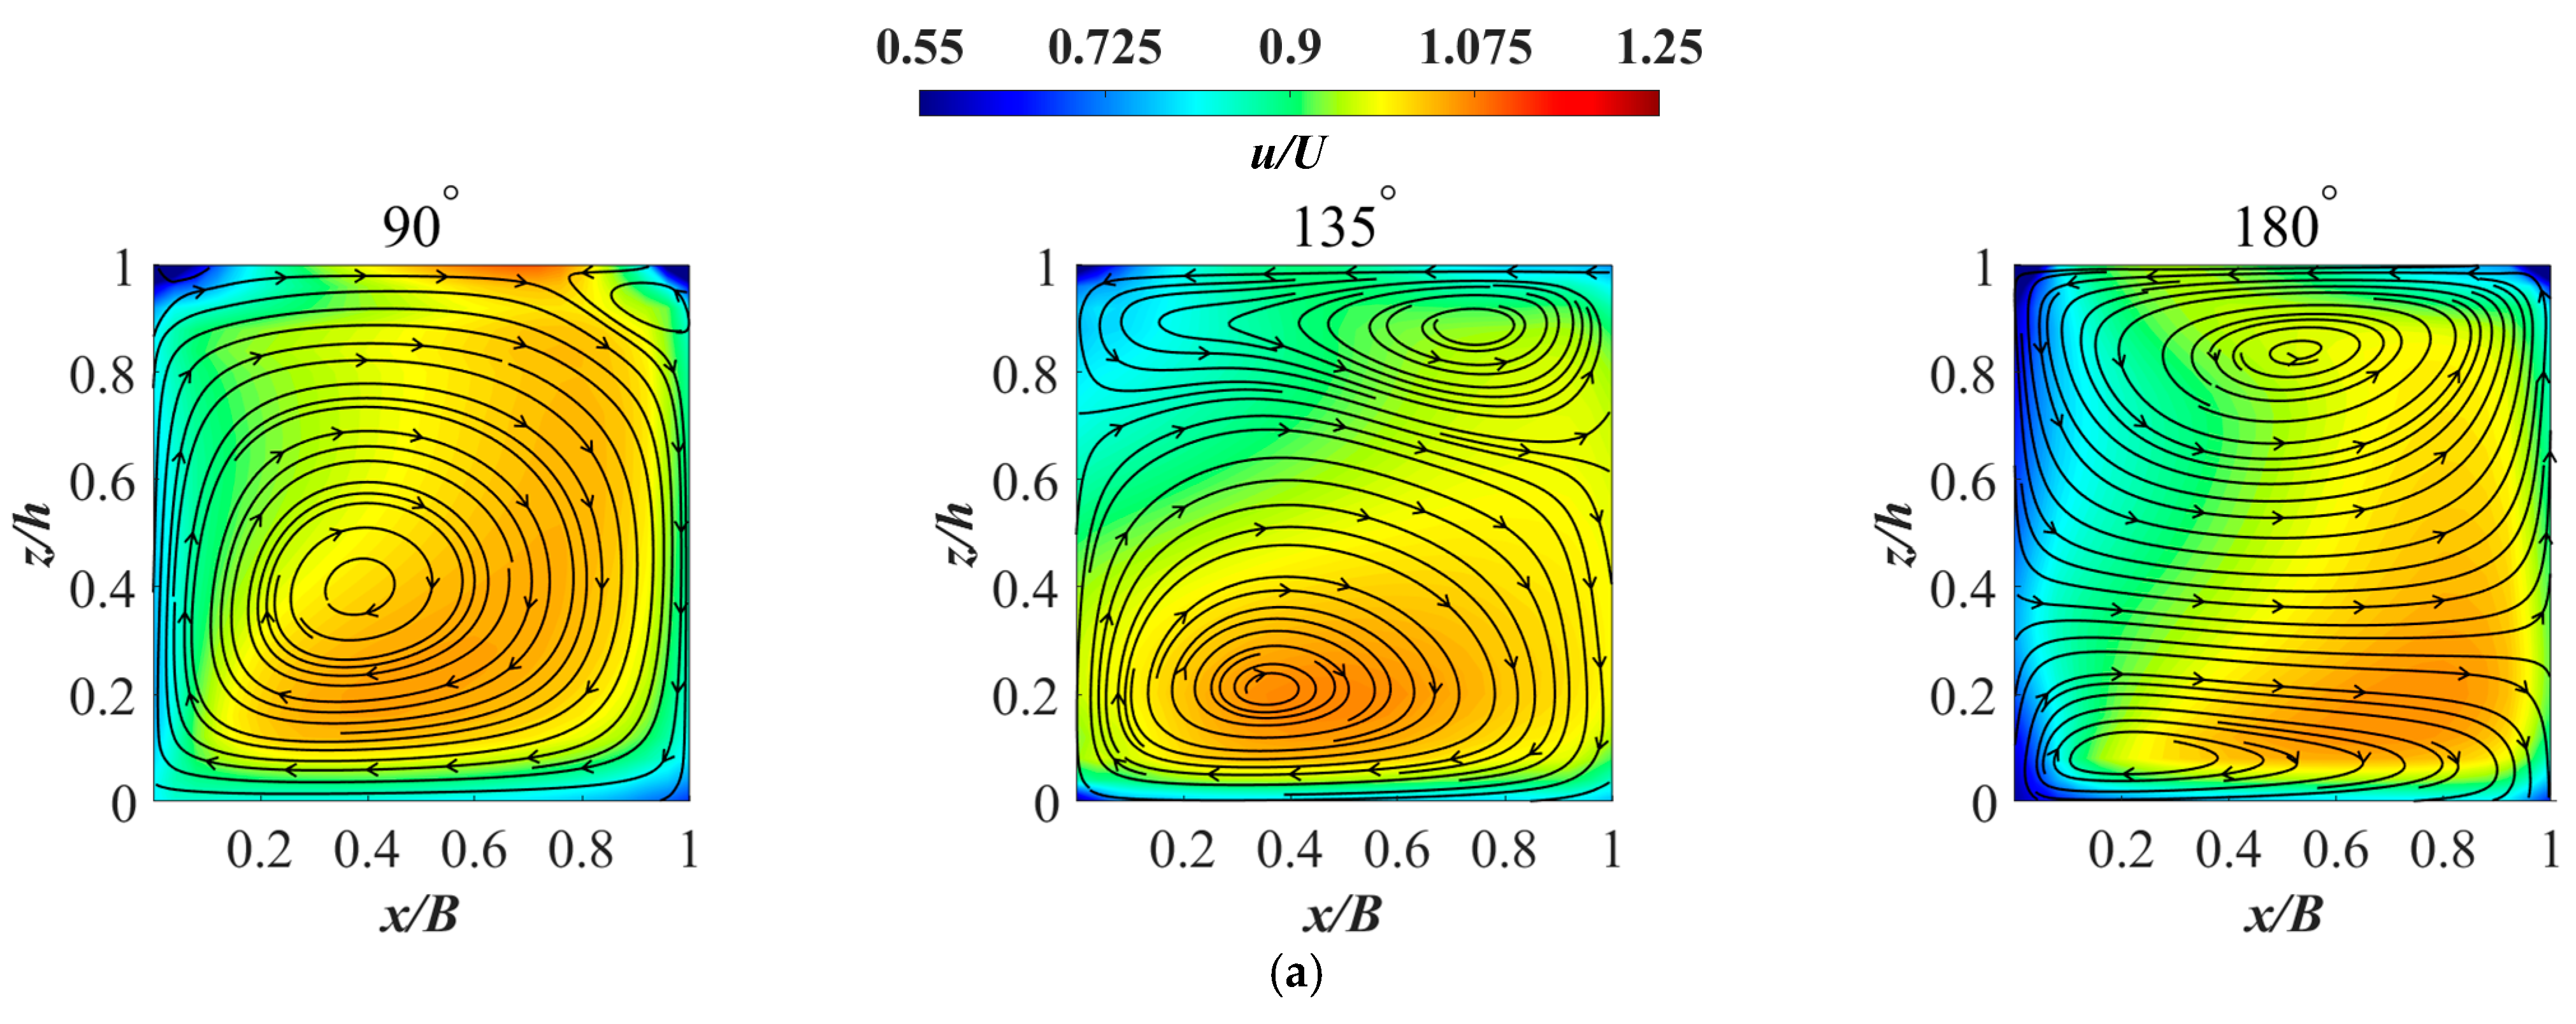
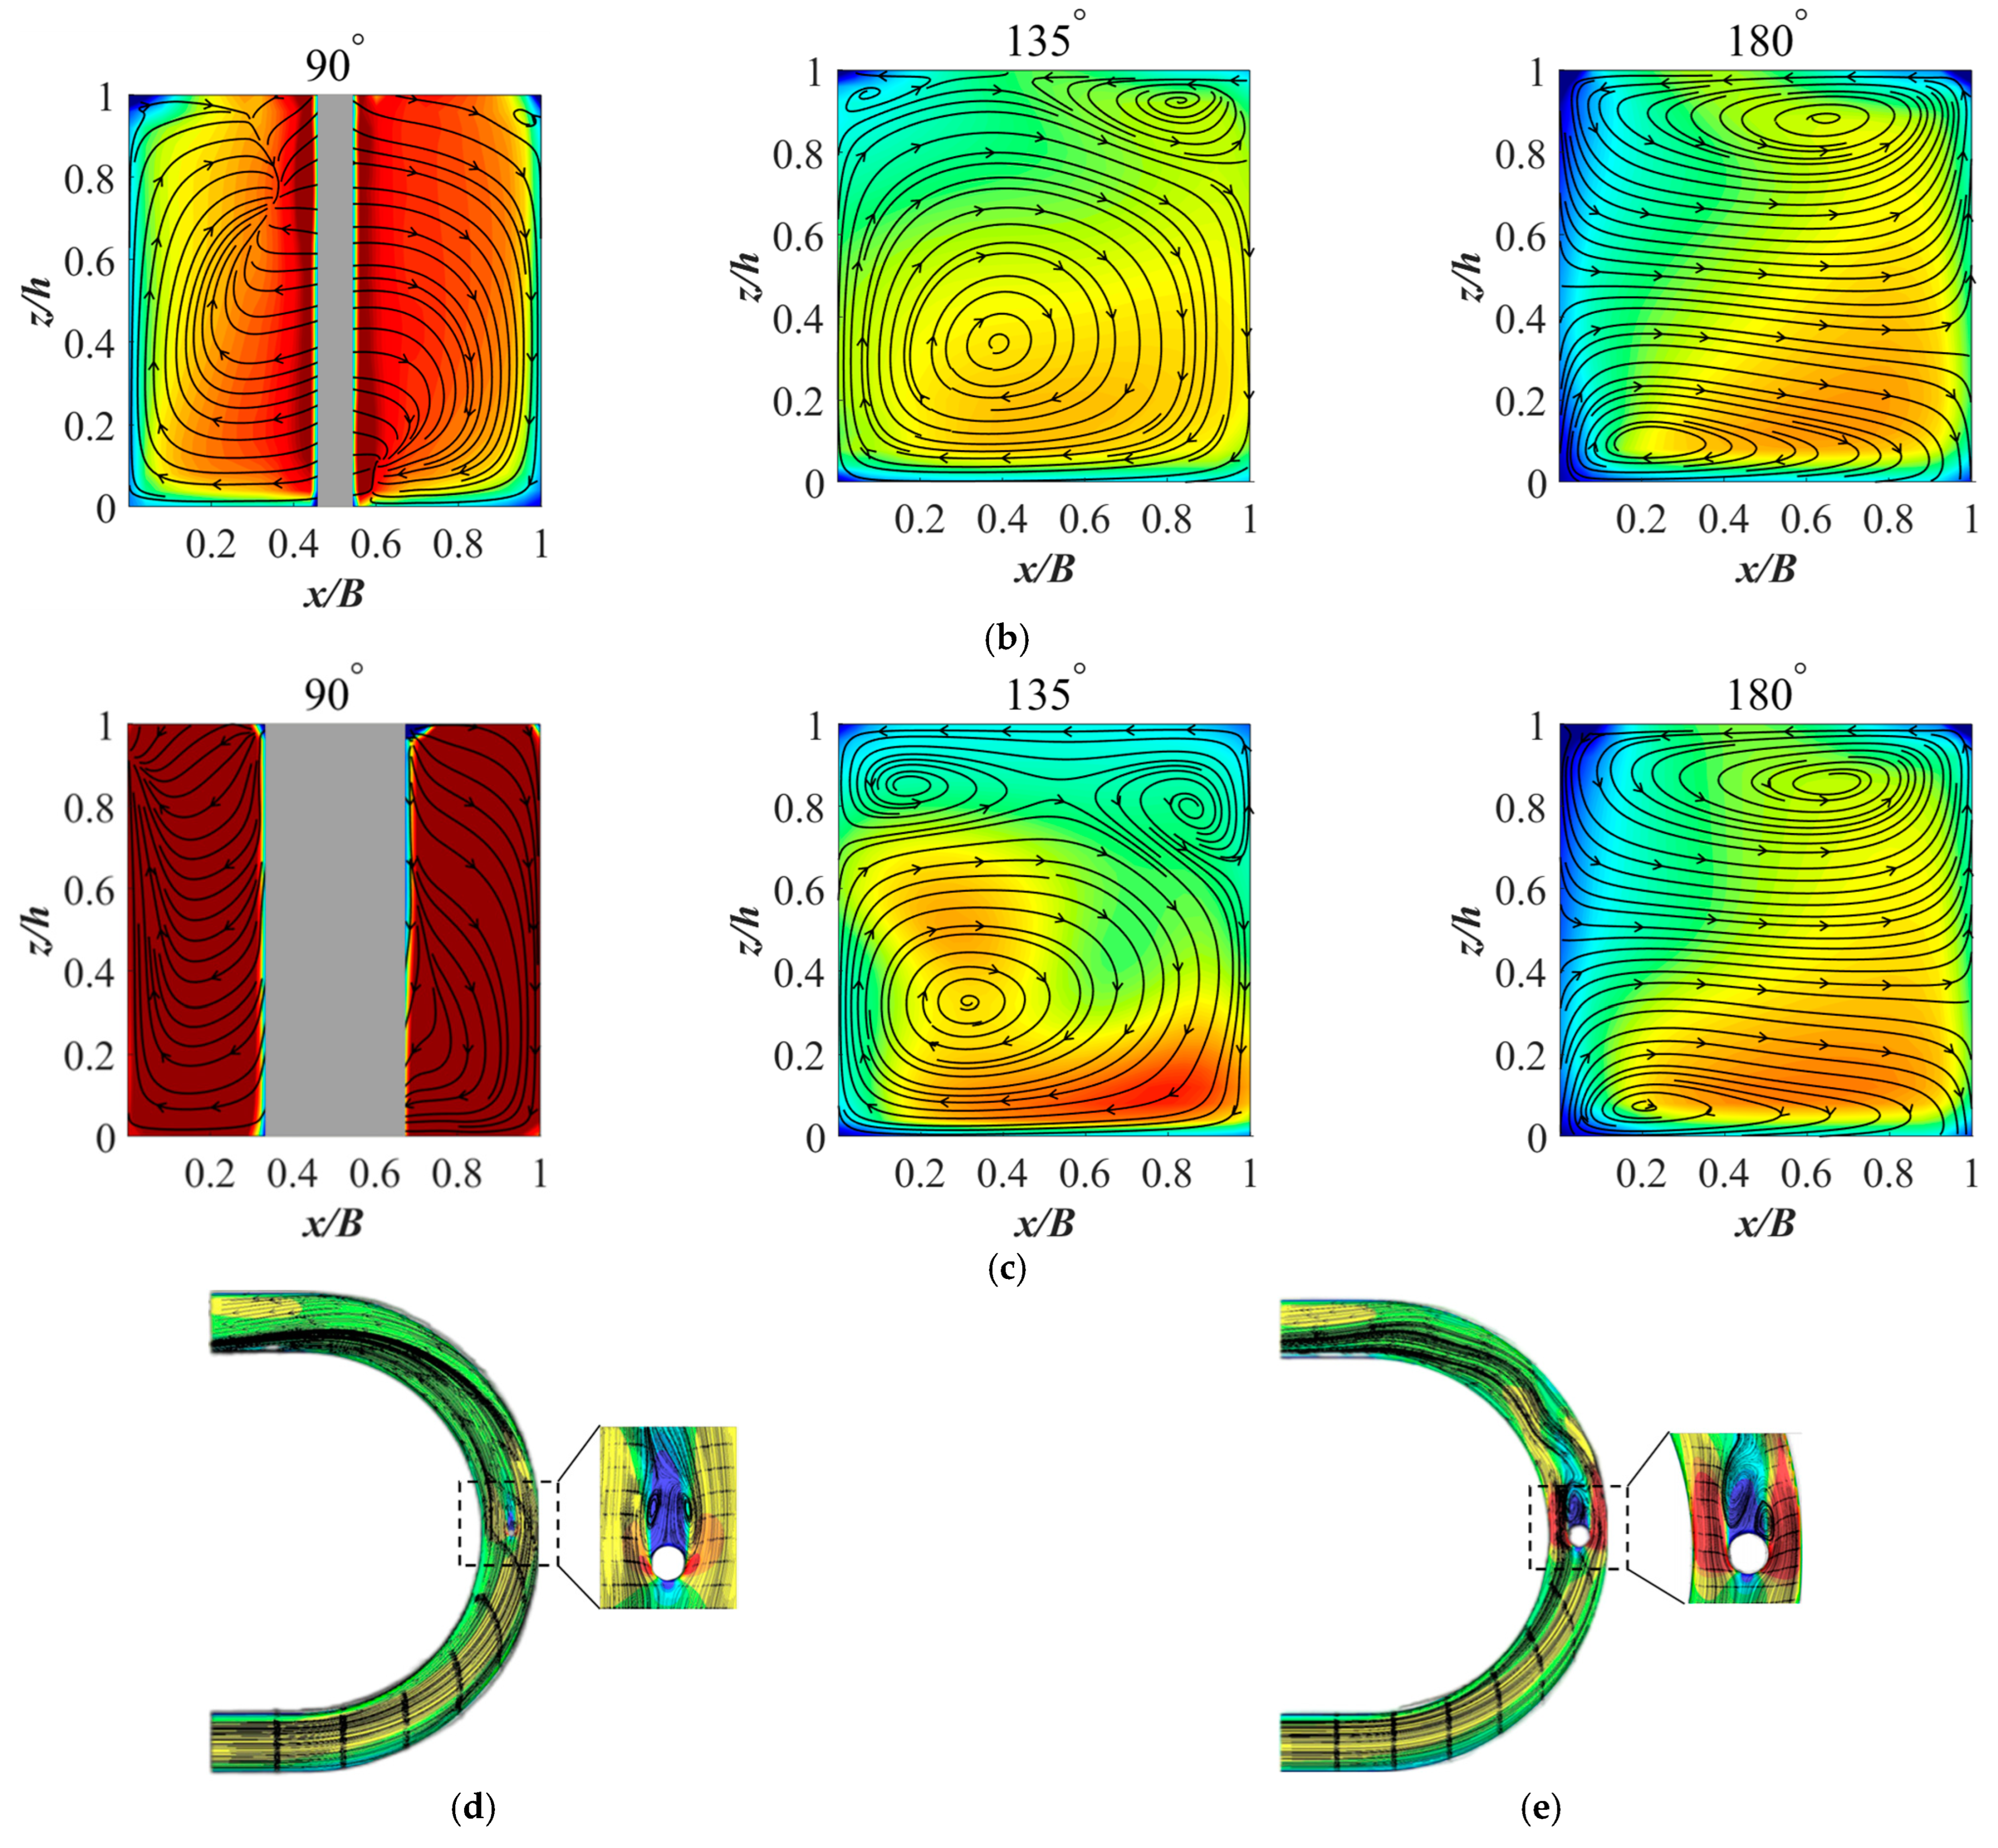
  • When the diameter of the cylinder that is placed at the 90° section increases, the two weaker circulations with the same direction are found near the water surface, and for the submerged one, the two weaker circulations appear at the section further downstream than the emergent one.
  • As the flowrate increases, the maximum streamwise velocity of the 90° section increases, and the streamwise velocity near the concave bank is also larger. In addition, the low-velocity regions behind the cylinder extend further downstream with an increase in the flowrate.
  • The shear stress τ / τ 0 values on the concave bank are all greater than those on the convex bank for different conditions. The presence of a larger cylinder reduces the flow conveyance area and increases the flow velocity around the cylinder, elevating the shear stress τ acting on the bank. The degree of variation in the τ / τ 0 values is larger than that of the flowrate. Therefore, when a cylinder is placed over a curved channel, the changes in the shear stress acting on the banks should also be considered.
  • As the flowrate increases or the radius of curvature decreases, the secondary flow intensity correspondingly elevates. When the flowrate is increased by 50%, the maximum secondary flow intensity is increased by 4.3%; on the other hand, when the radius of curvature is decreased by 50%, the maximum secondary flow intensity is elevated by 20.6%. These results reveal that the radius of curvature plays a more important role than the flowrate does. For both emergent and submergent cylinders, the large cylinder produces a greater secondary flow strength, approximately 14.4 to 21.7% for D (=15 cm)/D (=4 cm) at different cylinder submergence levels; however, the emergent one has a greater secondary flow strength than the submergent one by 25~33% depending on the cylinder diameter.
In summary, the present study provides valuable knowledge on the hydrodynamics of flow around emergent and submergent structures over a curved channel, which could improve the future design for these structures.
This study has some shortcomings. The major one is the turbulent model (RANS) adopted in this study. As mentioned in the introduction, the RANS models are unable to accurately simulate the flow separation around bluff bodies (such as cylinders), as well as the vortex-shedding frequency. In the future, in order to meet the computational capability, LES or DNS, which can resolve the large-scale anisotropy of turbulence, should be used to show more detailed flow structures. The curvilinear meshes around the cylinder can also be adopted to calculate the forces acting on the cylinder. In addition, more measurement points and force measurements on the cylinder are required to show flow circulation patterns along a curved channel. In addition, for practical applications, measurements or simulations with more cylinders present are necessary, in order to analyze their effects on hydrodynamics or sediment transport over a curved channel.

Author Contributions

Conceptualization, S.J.; Methodology, S.J. and Y.-T.L.; Laboratory Measurement, Y.H., Y.-T.L. and M.H.; Data Analysis, Y.H., Y.-T.L., B.S. and M.H.; Software, Y.H.; Writing—Original Draft Preparation, Y.H. and Y.-T.L.; Writing—Review and Editing, S.J. and B.S.; Funding Acquisition, S.J. and Y.-T.L. All authors have read and agreed to the published version of the manuscript.

Funding

This research was funded by Zhejiang Provincial Natural Science Foundation of China (Grant No. LY20A020009) and Science Foundation of Donghai Laboratory (Grant No. DH-2022KF01016).

Institutional Review Board Statement

Not applicable.

Informed Consent Statement

Not applicable.

Data Availability Statement

All data generated or analyzed during this study are included in this article.

Acknowledgments

The authors thank the laboratory instrument (U-Shaped Hydraulic Flume) of Ocean College of Zhejiang University for support.

Conflicts of Interest

The authors declare no conflict of interest.

References

  1. Shaheed, R.; Mohammadian, A.; Yan, X. A review of numerical simulations of secondary flows in river bends. Water 2021, 13, 884. [Google Scholar] [CrossRef]
  2. Engelund, F. Flow and bed topography in channel bends. J. Hydraul. Div. Am. Soc. Civ. Eng. 1974, 100, 1631–1648. [Google Scholar] [CrossRef]
  3. Thomson, J. On the origin of windings of rivers in alluvial plains. Proc. Math. Phys. Eng. Sci. 1876, 25, 5–8. [Google Scholar]
  4. De Vriend, H.J.; Struiksma, N. Flow and bed deformation in river bends. In River Meandering; Elliot, C.M., Ed.; ASCE: New York, NY, USA, 1984; pp. 810–828. [Google Scholar]
  5. Odgaard, A.J. Meander flow model. I: Development. J. Hydraul. Eng. 1986, 112, 1117–1135. [Google Scholar] [CrossRef]
  6. Wang, M.; Avital, E.; Korakianitis, T.; Williams, J.; Ai, K. A numerical study on the influence of curvature ratio and vegetation density on a partially vegetated U-bend channel flow. Adv. Water Resour. 2021, 148, 103843. [Google Scholar] [CrossRef]
  7. Hsieh, T.-Y.; Yang, J.-C. Investigation on the suitability of two-dimensional depth-averaged models for bend-flow simulation. J. Hydraul. Eng. 2003, 129, 597–612. [Google Scholar] [CrossRef]
  8. Kashyap, S.; Constantinescu, G.; Rennie, C.D.; Post, G.; Townsend, R. Influence of channel aspect ratio and curvature on flow, secondary circulation, and bed shear stress in a rectangular channel bend. J. Hydraul. Eng. 2012, 138, 1045–1059. [Google Scholar] [CrossRef]
  9. Blanckaert, K.; Graf, W.H. Momentum transport in sharp open-channel bends. J. Hydraul. Eng. 2004, 130, 186–198. [Google Scholar] [CrossRef]
  10. Zeng, J.; Constantinescu, G.; Blanckaert, K.; Weber, L. Flow and bathymetry in sharp open-channel bends: Experiments and predictions. Water Resour. Res. 2008, 44, W09401. [Google Scholar] [CrossRef]
  11. van Balen, W.; Uijttewaal, W.S.J.; Blanckaert, K. Large-eddy simulation of a mildly curved open-channel flow. J. Fluid Mech. 2009, 630, 413–442. [Google Scholar] [CrossRef] [Green Version]
  12. Vaghefi, M.; Akbari, M.; Fiouz, A.R. An experimental study of mean and turbulent flow in a 180 degree sharp open channel bend: Secondary flow and bed shear stress. KSCE J. Civ. Eng. 2016, 20, 1582–1593. [Google Scholar] [CrossRef]
  13. Masjedi, A.; Bejestan, M.S.; Efsandi, A. Reduction of local scour at a bridge pier fitted with a collar in a 180 degree flume bend. J. Hydrodynam. B 2010, 22, 646–650. [Google Scholar] [CrossRef]
  14. Järvelä, J. Flow resistance of flexible and stiff vegetation: A flume study with natural plants. J. Hydrol. 2002, 269, 44–54. [Google Scholar] [CrossRef]
  15. Fazli, M.; Ghodsian, M.; Salehi Neyshabouri, S.A.A. Scour and flow field around a spur dike in a 90° bend. Int. J. Sediment. Res. 2008, 23, 56–68. [Google Scholar] [CrossRef]
  16. Vaghefi, M.; Ghodsian, M.; Salehi Neyshabouri, S.A.A. Experimental study on scour around a T-shaped spur dike in a channel bend. J. Hydraul. Eng. 2012, 136, 498–509. [Google Scholar] [CrossRef]
  17. Yang, Y.; Lin, Y.T.; Ji, X.Y. Hydrodynamic characteristics of flow over emergent vegetation in a strongly curved channel. J. Hydraul. Res. 2021, 3, 240–257. [Google Scholar] [CrossRef]
  18. Sadeque, M.A.; Rajaratnam, N.; Loewen, M.R. Flow around cylinders in open channels. J. Hydraul. Eng. 2008, 134, 60–71. [Google Scholar] [CrossRef]
  19. Korkmaz, M.; Emiroglu, M.E. Local scour at a bridge abutment along a curved channel. In Institution of Civil Engineers-Bridge Engineering; ICE Publishing: London, UK, 2022. [Google Scholar] [CrossRef]
  20. Hu, Y.; Yang, B.; Chen, X.; Wang, X.; Liu, J. Modeling and experimental study of a piezoelectric energy harvester from vortex shedding-induced vibration. Energy Convers. Manag. 2018, 162, 145–158. [Google Scholar] [CrossRef]
  21. Latif, U.; Uddin, E. Experimental investigation of energy harvesting in the wake of a bluff body. J. Renew. Sustain. Ener. 2020, 12, 033301. [Google Scholar] [CrossRef]
  22. Envelope, I.; Madaro, F.; Rizzi, F.; Vittorio, M.D. Comprehensive experimental study on bluff body shapes for vortex-induced vibration piezoelectric energy harvesting mechanisms. Energy Convers. Manag. X 2022, 13, 100174. [Google Scholar] [CrossRef]
  23. Moussaed, C.; Salvetti, M.V.; Wornom, S.; Koobus, B.; Dervieux, A. Simulation of the flow past a circular cylinder in the supercritical regime by blending RANS and variational-multiscale LES models. J. Fluids Struc. 2014, 47, 114–123. [Google Scholar] [CrossRef] [Green Version]
  24. Jiang, H.; Cheng, L. Large-eddy simulation of flow past a circular cylinder for Reynolds numbers 400 to 3900. Phys. Fluids 2021, 33, 034119. [Google Scholar] [CrossRef]
  25. Catalano, P.; Wang, M.; Iaccarino, G.; Moin, P. Numerical simulation of the flow around a circular cylinder at high Reynolds numbers. Int. J. Heat Fluid Flow 2003, 24, 463–469. [Google Scholar] [CrossRef]
  26. Shao, J.; Zhang, C. Numerical analysis of the flow around a circular cylinder using RANS and LES. Int. J. Comut. Fluid Dyn. 2006, 20, 301–307. [Google Scholar] [CrossRef]
  27. Stoesser, T.; Ruether, N.; Reidar, N.; Olsen, B. Calculation of primary and secondary flow and boundary shear stresses in a meandering channel. Adv. Water Resour. 2010, 33, 158–170. [Google Scholar] [CrossRef]
  28. Kraus, N.C.; Lohrmann, A.; Cabrera, R. New acoustic meter for measuring 3D laboratory flows. J. Hydraul. Eng. 1994, 120, 406–412. [Google Scholar] [CrossRef]
  29. Goring, D.G.; Nikora, V.I. Despiking acoustic doppler velocimeter data. J. Hydraul. Eng. 2002, 128, 117–126. [Google Scholar] [CrossRef] [Green Version]
  30. Hirt, C.W. Volume-fraction techniques: Power tools for wind engineering. J. Wind Eng. Ind. Aerodyn. 1993, 46–47, 327–338. [Google Scholar] [CrossRef]
  31. Hirt, C.W.; Nichols, B.D. Volume of fluid (VOF) method for the dynamics of free boundaries. J. Comput. Phys. 1981, 39, 201–225. [Google Scholar] [CrossRef]
  32. Glatzel, T.; Litterst, C.; Cupelli, C.; Lindemann, T.; Moosmann, C.; Niekrawietz, R.; Streule, W.; Zengerle, R.; Koltay, P. Computational fluid dynamics (CFD) software tools for microfluidic applications—A case study. Comput. Fluids 2008, 37, 218–235. [Google Scholar] [CrossRef]
  33. Wang, S.; Yang, S.; He, Z.; Li, L.; Xia, Y. Effect of inclination angles on the local scour around a submerged cylinder. Water 2020, 12, 2687. [Google Scholar] [CrossRef]
  34. Zhou, J.; Venayagamoorthy, S.K. Impact of ambient stable stratification on gravity currents propagating over a submerged canopy. J. Fluid Mech. 2020, 898, A15. [Google Scholar] [CrossRef]
  35. Lin, Y.-T.; Ye, Y.-Q.; Han, D.-R.; Chiu, Y.-J. Propagation and Separation of Downslope Gravity Currents over Rigid and Emergent Vegetation Patches in Linearly Stratified Environments. J. Mar. Sci. Eng. 2022, 10, 308. [Google Scholar] [CrossRef]
  36. Zhou, J.; Venayagamoorthy, S.K. Numerical simulations of intrusive gravity currents interacting with a bottom-mounted obstacle in a continuously stratified ambient. Environ. Fluid. Mech. 2017, 17, 191–209. [Google Scholar] [CrossRef]
  37. Vaghefi, M.; Faraji, B.; Akbari, M.; Eghbalzadeh, A. Numerical investigation of flow pattern around a T-shaped spur dike in the vicinity of attractive and repelling protective structures. J. Braz. Soc. Mech. Sci. 2018, 40, 93. [Google Scholar] [CrossRef]
  38. Qamar, M.Z.; Verma, M.K.; Meshram, A.P.; Isaac, N. Numerical simulation of desilting chamber using Flow 3D. In River and Coastal Engineering; Water Science and Technology Library; Jha, R., Singh, V.P., Singh, V., Roy, L., Thendiyath, R., Eds.; Springer: Cham, Switzerland, 2022; p. 117. [Google Scholar] [CrossRef]
  39. Bai, Y.; Song, X.; Gao, S. Efficient investigation on fully developed flow in a mildly curved 180° open-channel. J. Hydroinform. 2014, 16, 1250–1264. [Google Scholar] [CrossRef]
  40. Gholami, A.; Akhtari, A.A.; Minatour, Y.; Bonakdari, H.; Javadi, A.A. Experimental and numerical study on velocity fields and water surface profile in a strongly-curved 90 degrees open channel bend. Eng. Appl. Comp. Fluid Mech. 2014, 8, 447–461. [Google Scholar] [CrossRef] [Green Version]
  41. Lin, Y.-T.; Yang, Y.; Chiu, Y.-J.; Ji, X. Hydrodynamic characteristics of flow in a strongly curved channel with gravel beds. Water 2021, 13, 1519. [Google Scholar] [CrossRef]
  42. Shukry, A. Flow around bends in an open flume. Trans. Am. Soc. Civil Eng. 1950, 115, 751–788. [Google Scholar] [CrossRef]
Figure 1. The experimental flume: (a) Picture of the 180-degree U-shaped flume; (b) Schematic diagram of cylinder placed at the 90° section.
Sustainability 15 04890 g001
Figure 2. Computational domain with the main boundary conditions. Note: the inset figure shows the nested meshes for a smaller cylinder.
Sustainability 15 04890 g002
Figure 3. Comparisons of simulated and measured water depth for Q = 30 L/s. Note: “E” and “N” represent experimental and numerical results, respectively.
Sustainability 15 04890 g003
Figure 4. Comparisons of simulated (solid line) and measured (circle symbols) streamwise velocity profiles for an emergent circular cylinder placed at the 90° section: (a) 0° section, (b) 45° section, (c) 90° section, (d) 135° section, (e) 180° section, and (f) secondary circulation distribution at the 135° section.
Sustainability 15 04890 g004aSustainability 15 04890 g004b
Figure 5. Comparisons of simulated (solid line) and measured (circle symbols) streamwise velocity profiles for a submergent circular cylinder placed at 90° section: (a) 0° section, (b) 45° section, (c) 90° section, (d) 135° section, (e) 180° section, and (f) secondary circulation distribution at the 135° section.
Sustainability 15 04890 g005
Figure 6. Depth-averaged velocity distribution when a circular cylinder is placed at 90° section: (a) Bare bed; (b) Emergent cylinder, D = 4 cm (D/B = 0.1); (c) Emergent cylinder, D = 15 cm (D/B = 0.375); (d) Submerged cylinder, D = 4 cm (D/B = 0.1); (e) Submerged cylinder, D = 15 cm (D/B = 0.375).
Sustainability 15 04890 g006
Figure 7. Dimensionless streamwise velocity and streamline distribution at different cross-sections for an emergent cylinder: (a) bare bed, (b) D/B = 0.1, (c) D/B = 0.375, and water surface streamline around an emergent cylinder: (d) D/B = 0.1 and (e) D/B = 0.375.
Sustainability 15 04890 g007aSustainability 15 04890 g007b
Figure 8. Dimensionless streamwise velocity and streamline distribution at different cross-sections for a submerged cylinder: (a) D/B = 0.1, (b) D/B = 0.375.
Sustainability 15 04890 g008aSustainability 15 04890 g008b
Figure 9. Depth-averaged velocity distribution when a 4 cm diameter emergent cylinder is placed at the 90° section: (a) Q = 15 L/s and (b) Q = 45 L/s.
Sustainability 15 04890 g009
Figure 10. Dimensionless streamwise velocity and streamline distribution when cylinder is placed at the 90° section: (a) Q = 15 L/s and (b) Q = 45 L/s.
Sustainability 15 04890 g010
Figure 11. Depth-averaged velocity distribution when a 4 cm diameter emergent cylinder is placed at the 90° section: (a) R = 0.7 m and (b) R = 2.1 m.
Sustainability 15 04890 g011
Figure 12. Comparison of shear stress acting on convex and concave banks ( τ 0 is the shear stress acting on the convex bank of Q = 30 L/s and bare bed).
Sustainability 15 04890 g012
Figure 13. Comparisons of the strength of secondary flow: (a) the emergent circular cylinder with a diameter of 4 cm placed at the 90° section and (b) a circular cylinder placed at the 90° section for Q = 30 L/s and R = 1.4 m.
Sustainability 15 04890 g013
Disclaimer/Publisher’s Note: The statements, opinions and data contained in all publications are solely those of the individual author(s) and contributor(s) and not of MDPI and/or the editor(s). MDPI and/or the editor(s) disclaim responsibility for any injury to people or property resulting from any ideas, methods, instructions or products referred to in the content.

