Article

The Effect of Plant Diversity and Soil Properties on Soil Microbial Biomass and Activity in a Novel Ecosystem

by
Wojciech Bierza
1,
Gabriela Woźniak
1,*,
Agnieszka Kompała-Bąba
1,
Franco Magurno
1,
Monika Malicka
1,
Damian Chmura
2,
Agnieszka Błońska
1,
Andrzej M. Jagodziński
3,4 and
Zofia Piotrowska-Seget
1,*
1
Institute of Biology, Biotechnology and Environmental Protection, Faculty of Natural Sciences, University of Silesia in Katowice, Jagiellońska 28 Street, 40-032 Katowice, Poland
2
Institute of Environmental Protection and Engineering, University of Bielsko-Biala, Willowa 2 Street, 43-309 Bielsko-Biała, Poland
3
Institute of Dendrology, Polish Academy of Sciences, Parkowa 5 Street, 62-035 Kórnik, Poland
4
Department of Game Management and Forest Protection, Faculty of Forestry and Wood Technology, Poznań University of Life Sciences, 71D Wojska Polskiego Street, 60-625 Poznań, Poland
*
Authors to whom correspondence should be addressed.
Sustainability 2023, 15(6), 4880; https://doi.org/10.3390/su15064880
Submission received: 15 February 2023 / Revised: 2 March 2023 / Accepted: 7 March 2023 / Published: 9 March 2023
(This article belongs to the Special Issue The Provision of Ecosystem Services in Response to Habitat Change)

Abstract

:
Plant–microbial relations have not yet been fully disclosed in natural or seminatural ecosystems, nor in novel ecosystems developing spontaneously on post-coal mine heaps. The aim of this study was to determine which factor, biotic (plant taxonomic diversity vs. plant functional diversity) or abiotic (physicochemical substrate parameters), affects the biomass of soil microbial communities the most, as well as soil in situ respiration in novel ecosystems. The study was carried out on unreclaimed plots selected according to four different combinations of taxonomic and functional plant diversity. Additionally, plots on a reclaimed heap served as a comparison between the two management types. The biomass of several soil microbial groups was analysed using phospholipid fatty acids profiles. We detected that soil microbial biomass was more impacted by abiotic parameters (explaining 23% of variance) than plant diversity (explaining 12% of variance). Particularly, we observed that substrate pH was the most important factor shaping microbial community biomass, as shown in the RDA analysis. The highest microbial biomass was found in plots with low taxonomic and functional diversity. This finding can be explained by the fact that these plots represented a more advanced phase of vegetation development in the early stages of plant succession.

1. Introduction

Interactions between plants and microorganisms constitute an integral element of every terrestrial ecosystem. The microbial community in the rhizosphere is the most abundant and diverse subset of the soil microbiome. Co-evolution of plants and microorganisms has led to the formation of specific relations that allow both partners to support their growth and development [1]. Plants affect microbial biomass and diversity by supporting the soil with carbon fixed through the photosynthetic process. They allocate about 20–30% of carbon to their underground parts, and a significant fraction (up to 30%) is further delivered to the rhizosphere as direct root deposition through exudation, sloughed root cap cells, or via mycorrhiza [2,3,4]. Root exudation contains easily assimilable compounds, such as sugars, organic acids, and amino acids, that stimulate microbial growth and decomposition of soil organic matter which, in turn, increases the pool of nutrients available to plants. Plant investment in soil carbon allocation is rewarded with an increased amount of easily accessible elements, particularly nitrogen and phosphorus, and improved tolerance to abiotic stresses, such as drought, salinity and the presence of toxic compounds [5].
Plant diversity can increase the metabolic efficiency of microorganisms and reduce their metabolic quotient (respiration to biomass ratio) by providing diverse resources through root exudates and litter [6,7,8]. A global meta-analysis indicated that the microbial biomass, fungi/bacteria ratio, and microbial respiration increased in soils under plant mixture compared to monocultures [9]. This pattern was observed in different ecosystem types, such as forests, grasslands, and arable fields [10]. However, some studies have shown negative or no response of soil microbial diversity and biomass to increased plant diversity [11,12].
Taxonomic diversity expressed, among several indices, by the Shannon–Wiener species diversity index (H′), is the main measure of biodiversity that takes into account the whole number of species in a given community and permits following their changes over time. Many past studies examined the effects of plant taxonomic diversity on soil microbial communities. However, by considering only the taxonomic diversity, it is possible to overlook species’ functional attributes necessary to understand a variety of ecological functions of species constituting communities. This also applies to processes responsible for the dynamics of species occurrence and community assembly, as well as implications of biodiversity changes to ecosystem functions [13]. Both taxonomic and functional plant diversity influences biomass and structure of soil microbial communities determining the functioning of the belowground system [14,15]. Plant species with different functional traits could produce litter with different mineral and lignin contents. The quantity and quality of litter result in significant differences in soil pH, soil fertility, diversity and biomass of soil microbial communities [16].
Not all aspects of the interaction mentioned above are fully investigated in seminatural ecosystems. Much less is known about plant–microorganism relationships in areas transformed by industrial activity, such as mining, that resulted in the removal of existing vegetation, soil degradation and aggravated water conditions [17,18,19,20]. Such activities lead to the emergence and subsequent development of novel ecosystems [21,22]. In such environments, the species composition, significantly different from the surrounding non-industrial habitats, includes plant and fauna communities and the associated saprophyte organisms established as a result of natural processes of recruitment and colonisation without human intervention [18,23,24,25]. Coal post-mining sites represent an important element of Central European landscapes, particularly in the Silesian Upland region in southern Poland. As a side effect of mining activities, huge amounts of excavated material are accumulated in waste heaps where the mineral substrates in such environments are characterised by low water-holding capacity, poor nutrient concentrations, or high temperatures. These unusual chemical and physical properties create a harsh and unfavourable condition for the colonisation and growth of plants [26,27,28]. Interestingly, these novel ecosystems provide an opportunity to study the processes of primary succession on a substrate with very low initial biological activity and the build-up of relationships between soil microorganisms and plants [29].
The mechanisms ruling the establishment of novel ecosystems developing on newly established mineral habitats, particularly the relations between the taxonomic and functional plant diversity and associated microbial communities, are almost unknown and may differ from trends observed in other ecosystems. Therefore, the aim of this study was to determine which factor, biotic (plant taxonomic diversity vs. plant functional diversity) or abiotic (physicochemical substrate parameters), affects the biomass and structure of soil microbial communities the most, as well as soil in situ respiration on hard coal spoil heaps.

2. Materials and Methods

2.1. Study Area

The study area is situated in the Katowice Upland—a central part of the Silesian Upland (southern Poland). This region is under a temperate climate, with an annual rainfall of 600–800 mm and the highest mean temperature of 14–16 °C in July. In the Silesian Upland, western winds dominate. The number of days with mists ranges from 30 to 100, and cloud cover is approximately 60–80% (Skurczyńska and Leśniok, 2008). The fieldwork was conducted and samples collected from the Zabrze Sośnica Makoszowy coal mine heap (50°16′22″ N, 18°44′43″ E). The beginnings of the Sośnica Makoszowy heap deposition date back to the second half of 1906. This still active coal mine heap occupies an area of approximately 170 hectares and is located at an altitude of over 310 m above sea level. It is almost 2 km long, 900 m wide, and its height reaches up to 30 m. In addition, research was carried out on the Kostuchna heap (50°11′4″ N, 19°0′33″ E), which is subject to reclamation. The reclamation process includes the reduction of topographic heterogeneity by remodelling the surface, the addition of 20–30 cm of topsoil, and after that, planting of soil-stabilising plant species, as well as fertility-enhancing plants such as legumes [30].

2.2. Criteria for Selection and Sampling of Vegetation Plots

Two plant diversity indices were considered as criteria for plot selection: the Shannon–Wiener species diversity (H′) as a representative of taxonomic diversity, and the functional dispersion (FDis) as a representative of functional diversity. The Shannon–Wiener diversity index takes into account both the number of species in a given plot and the number of individuals of a given species. It is one of ecology’s most popular biodiversity indices [31]. Functional dispersion, calculated on the functional traits, is a measure of a low level of habitat filtering and a high level of competition [32]. It can handle any number and type of traits (including more traits than species), is not strongly influenced by outliers, and can consider species’ relative abundances [33]. For FDis calculation, the functional traits of the plant species recorded in the study area were extracted from the open access Plant Traits Databases (TRY) [34]. In total, 35 plant traits, available to all the species commonly recorded in the study area, were selected (see Table S1), to assess the functional dispersion of the vegetation plots. Following Kleyer et al.’s [35] suggestion, traits represent three main aspects of plant behaviour: persistence, regeneration and dispersibility. In our case, the two formers mainly were included because they play a more crucial role in the colonization of brownfield sites. In addition, morphological traits (e.g., height), physiological traits (e.g., the content of N and C elements in plant tissues), regenerative traits and species habitat preference (Ellenberg indicator values for light, moisture, trophy, salinity) were taken into account. Furthermore, affinity to a particular sociological group and origin of species (native vs. alien) was considered.
The plants’ Shannon–Wiener index was calculated using the vegan package, whereas FDis was computed based on species abundances and plant traits used by means of the algorithm implemented in the FDis package [33].
In June 2019, a preliminary investigation of the study area was conducted to record the composition of a high number of vegetation plots. Data from field studies conducted in 2016 on spontaneous vegetation on the heap were also available [36]. In the structure of plant communities that developed spontaneously on coal mine spoil heaps, a relatively wide range of plant species can be found. A list of the most common species was published by Błońska et al. [37]. For our investigation, we focused on plots where the dominant or co-dominant species was an expansive native grass, Calamagrostis epigejos, often found in post-mining sites. Other plant species frequently found in the study plots include: Arrhenatherum elatius, Centaurea stoebe, Chamaenerion palustre, Festuca arundinacea, F. rubra, Medicago lupulina, M. sativa, Melilotus alba, Phragmites australis and Tussilago farfara. Individual plots were composed of 3 to 11 plant species, mostly of native origin. In each plot, between 11 and 28 specimens (an average of 18 specimens) of C. epigejos were recorded.
Based on the H′ index and FDis values, 12 unreclaimed plots were selected among those recorded in the field investigation. The vegetation plots were chosen to represent four combinations of taxonomical and functional diversity: 3 plots were characterised by high taxonomic and functional diversity (HH), 3 plots by high taxonomic and low functional diversity (HL), 3 plots by low taxonomic and high functional diversity (LH), and 3 plots by low taxonomic and functional diversity (LL). The H′ index values ranged from 0.68 to 1.84, while for FDis from 0.18 to 0.35 in the selected plots. According to these ranges, we considered the diversity values as follows: for taxonomic diversity, values of the H′ index higher than 1.5 were considered high, while values below 1.3 were considered low. For functional diversity, FDis values higher than 0.32 were considered high, while FDis values lower than 0.30 were considered low (see Table 1). Additionally, 3 plots were established on the reclaimed heap (R), to serve as a comparison between the two types of management (unreclaimed and reclaimed). In total, 15 plots with the shape of a circle (3 m radius), divided into five categories (the four combinations of taxonomic-functional diversity plus the group of reclaimed plots) were available for sampling. A diagram summarizing the selection of the 15 test plots is shown in Figure 1. For each combination of taxonomic and functional diversity, the selected plots differed significantly in H′ and FDis indices. These differences were tested by Permutational ANOVA and Approximative (Monte Carlo) Nemenyi–Damico–Wolfe–Dunn test for multiple comparisons.
In July 2019, 3 cores of the substrate (50 cm long × 50 cm wide × 20 cm deep), representing single samples for each plot, were collected for laboratory analyses. For each core, 100 g of substrate was stored in plastic bags at −20 °C and later used for phospholipid fatty acids (PLFA) analysis. The remaining amount of substrate was kept for physicochemical analyses.

2.3. Substrate Physicochemical Analyses

Substrate samples for the physicochemical analyses were air-dried in the laboratory to constant weight at room temperature and sieved (through 2 mm or 0.25 mm mesh, depending on the analysis). Substrate pH was measured after 24 h of equilibration in a 1:2.5 substrate/solution ratio (in both water and 1 M KCl) using a glass electrode, and electrical conductivity (EC) was measured in 1:5 substrate/water ratio. Soil organic carbon content (SOC) was determined by the Turin method modified by Simakov [38] and total N (TN) by the Kjeldahl method [39]. Total Kjeldahl nitrogen is the sum of the organic bounded nitrogen groups and the ammonium-nitrogen. The content of available forms of phosphorus (P2O5) was estimated according to the Polish Norm PN-R-04023:1996 based on the Egner–Riehm method. The available Mg (MgO) concentration was measured using the Schachtschabel method by extraction in 0.0125 M calcium chloride solution [40]. Exchangeable cations (K+, Na+) were extracted with 1 M ammonium acetate at pH 7.0 [41]. The concentration of available Mg and exchangeable cations were determined using flame absorption spectrometry (Thermo Scientific iCE 3500, Thermo Fisher Scientific, Waltham, MA, USA). Substrate moisture was determined in situ using the ML3 ThetaKit soil moisture portable sensor (Delta-T Devices, Cambridge, UK).

2.4. Substrate Respiration (Rs) Measurements

The in situ substrate respiration (Rs) measurements were performed on the selected vegetation plots using a portable infrared gas analyser (IRGA) connected to a soil respiration chamber (TARGAS-1 and SRC-2; PP Systems, Amesbury, MA, USA). The soil respiration chamber covered a surface area of 78 cm2 and an enclosed volume of 1171 cm3. The edge of the soil respiration chamber was inserted into the substrate to a depth of 1–2 cm. The detailed measurement procedure is described in Woźniak et al. [42].

2.5. Analysis of Microbial Community Structure Using PLFA

The community structure of soil/substrate microorganisms was assessed using a protocol for a PLFA analysis described by Pennanen et al. [43] with minor modifications. Briefly, lipids were extracted from 2 g of a substrate using a one-phase mixture of chloroform, methanol, and citrate buffer (1:2:0.8, v/v/v). The total lipid extract was fractionated into neutral lipids, glycolipids and phospholipids using silica solid-phase extraction columns (Supelco Silica Tube, 3 mL, 500 mg, Sigma-Aldrich, St. Louis, MO, USA) by eluting with chloroform, acetone and methanol, respectively. The methanol fraction was reduced to dryness under nitrogen. The eluted phospholipids were derivatised by mild alkaline methanolysis to generate fatty acid methyl esters (FAMEs). FAMEs were first analysed by an Agilent 7820A GC (Agilent Technologies, Santa Clara, CA, USA) gas chromatography system with an Agilent HP-Ultra 2 capillary column (cross-linked 5% phenyl-methyl silicone; 25 m, 0.20 mm ID; film thickness 0.33 μm). Hydrogen was used as a carrier gas. FAMEs were then detected using a flame ionisation detector (FID) and identified using the MIDI-MIS software (Sherlock TSBA6 library; MIDI Inc., Newark, DE, USA). Nonadecanoic acid (19:0) was used as the internal standard to calculate the individual fatty acid concentration. Total biomass (TotPLFA) was calculated as the sum of all extracted PLFAs [44].
The sum of fatty acids i14:0, i15:0, a15:0, i16:0, 17:0, i17:0, and a17:0 was used to determine the biomass of Gram-positive bacteria [44,45,46]. To determine the biomass of Gram-negative bacteria, 16:1ω7t, cy17:0, and cy19:0 was used [46]. The distribution of 10Me 17:0 and 10Me 18:0 was chosen to calculate the biomass of actinomycetes, and 18:2ω6,9 was used to assess the biomass of saprophytic fungi [44,45]. The fatty acid 16:1ω5 was chosen as a marker for arbuscular fungi, while 18:1ω9 represented saprophytic and potentially ectomycorrhizal fungi [46]. Bacterial biomass was calculated based on fatty acids of bacterial origin. The ratios of the biomass of Gram-positive bacteria to the biomass of Gram-negative bacteria and the bacterial to fungal fraction were also calculated.
The Shannon–Wiener diversity index (H′), Evenness (E), Simpson dominance index (D) and Margalef richness index (DS) were employed to assess the soil microbial PLFA diversity.
Shannon–Wiener diversity index, H′ = −∑Pi(lnPi), where Pi = ni/N
Evenness, E = H′/Hmax = H′/lnS
Simpson dominance index, D = ∑Pi2
Margalef richness index, DS = (S − 1)/lnN
where ni is the nmol g−1 d.w. of a certain PLFA; N is the sum of all PLFAs in a sample, expressed as nmol g−1 d.w.; H′ is observed diversity; Hmax is maximum diversity for a given number of PLFAs and S is the total number of microbial PLFAs.

2.6. Statistical Analysis

To examine variations among various levels of taxonomical and functional diversity, substrate data were subjected to principal components analysis (PCA). The PCA showed which substrate parameters contributed the most to overall variation in substrate data. Prior to the analysis, the variables were scaled.
The PERMANOVA test was used to check significant differences in the matrix of substrate variables among five diversity levels by the function vegan::adonis2. For detailed analysis, non-parametric tests were employed. To find the differences between five diversity levels, the Kruskal–Wallis test was conducted, and in the case of significant results, the Conover procedure was performed for multiple comparisons.
The redundancy analysis (RDA) was performed to examine the influence of soil parameters on the PLFA community. The backward and stepwise model selection was run using permutation tests (999 iterations). To examine how biotic data explains PLFAs diversity, nonmetrical multidimensional scaling (NMDS) based on the Euclidean measure was performed. The distance measure was chosen based on the value of stress. The lowest value was in the Euclidean distance case, which yielded stress lower than 0.1, which indicated a good fit. In order to show the impact of studied explanatory variables on the PLFAs community, passive projection was produced using vector fitting onto ordination. As explanatory variables, the following parameters were taken into account: the diversity indices (Simpson dominance index, Simpson diversity index, Shannon–Wiener index, and Evenness), standardised PLFA in % of participation of particular microbial taxa (Gram-positive, Gram-negative, actinomycetes, saprotrophic fungi and ectomycorrhizal fungi), respiration and nutrient stress markers. The significance was tested using 999 permutations of the Monte Carlo test.
A Venn diagram was produced to show variance partitioning in explaining PLFAs diversity by the substrate parameters and vegetation data, including species composition expressed by site scores along the first two axes of PCA and taxonomic diversity (Shannon–Wiener index) and functional diversity (functional dispersion).
For a detailed analysis of differences in biotic data among diversity levels, the Kruskal–Wallis test was followed by the Conover test for pairwise comparisons. In the case of biotic data, nanomoles per gram of dry soil were compared.

3. Results

3.1. Substrate Physicochemical Parameters

All the measured parameters except for EC were significantly different between the five plot categories (Table 2). The HH plots were characterised by significantly higher substrate reaction (pH in H2O and KCl) and SOM content compared to other plot types. Moreover, the concentration of exchangeable cations of Na+ and K+, as well as available phosphorus (P2O5), were highest in HH and R plots. In contrast, in terms of total nitrogen and SOM content, R plots had the lowest values. The PCA explained 51% of substrate properties variation in the studied plots. According to the PCA, pH in H2O and in KCl, as well as SOM and total nitrogen, accounted for most of the soil variation, whereas electrolytic conductivity and exchangeable cations of K+ accounted for the lowest fraction of variation (Figure 2). The categories of plots representing different combinations of taxonomic and functional diversity differed significantly from plots belonging to the R site in overall soil data (r2 = 0.5047, pseudo-F = 10.19, p < 0.001). The HH, HL, LH and LL overlapped in PCA ordination, which indicated their similarity (Figure 2).

3.2. PLFA Biomass

The highest values for total PLFA biomass, reaching >160 nmol PLFA g−1 d.w., were observed for samples obtained from reclaimed (R) plots (Figure 3). Among the other plots, the highest total PLFA biomass was characterised by the LL and LH plots. Relatively lower values of Gram-negative bacteria biomass were obtained in HH and HL plots. A similar trend was observed for Gram-positive bacterial biomass, which was generally higher. Gram-positive to Gram-negative bacterial ratio was higher than 1 in all the studied plots (Table 3). The lowest ECM biomass values were found in the HH and HL plots. On the other hand, the AMF biomass was significantly higher in the R site, without significant differences among HH, HL, LH and LL categories. The lowest saprophytic fungi biomass was recorded for HL plots, while the lowest actinomycete biomass was measured in the HH plots. Considering the bacteria-to-fungi ratio, we did not find any significant differences between the plot types. Moreover, there were no significant differences in diversity indices, with the exception of the Margalef index, which was lower in R plots. Reclaimed plots were also characterised by higher indices of nutrient stress markers (Table 2).

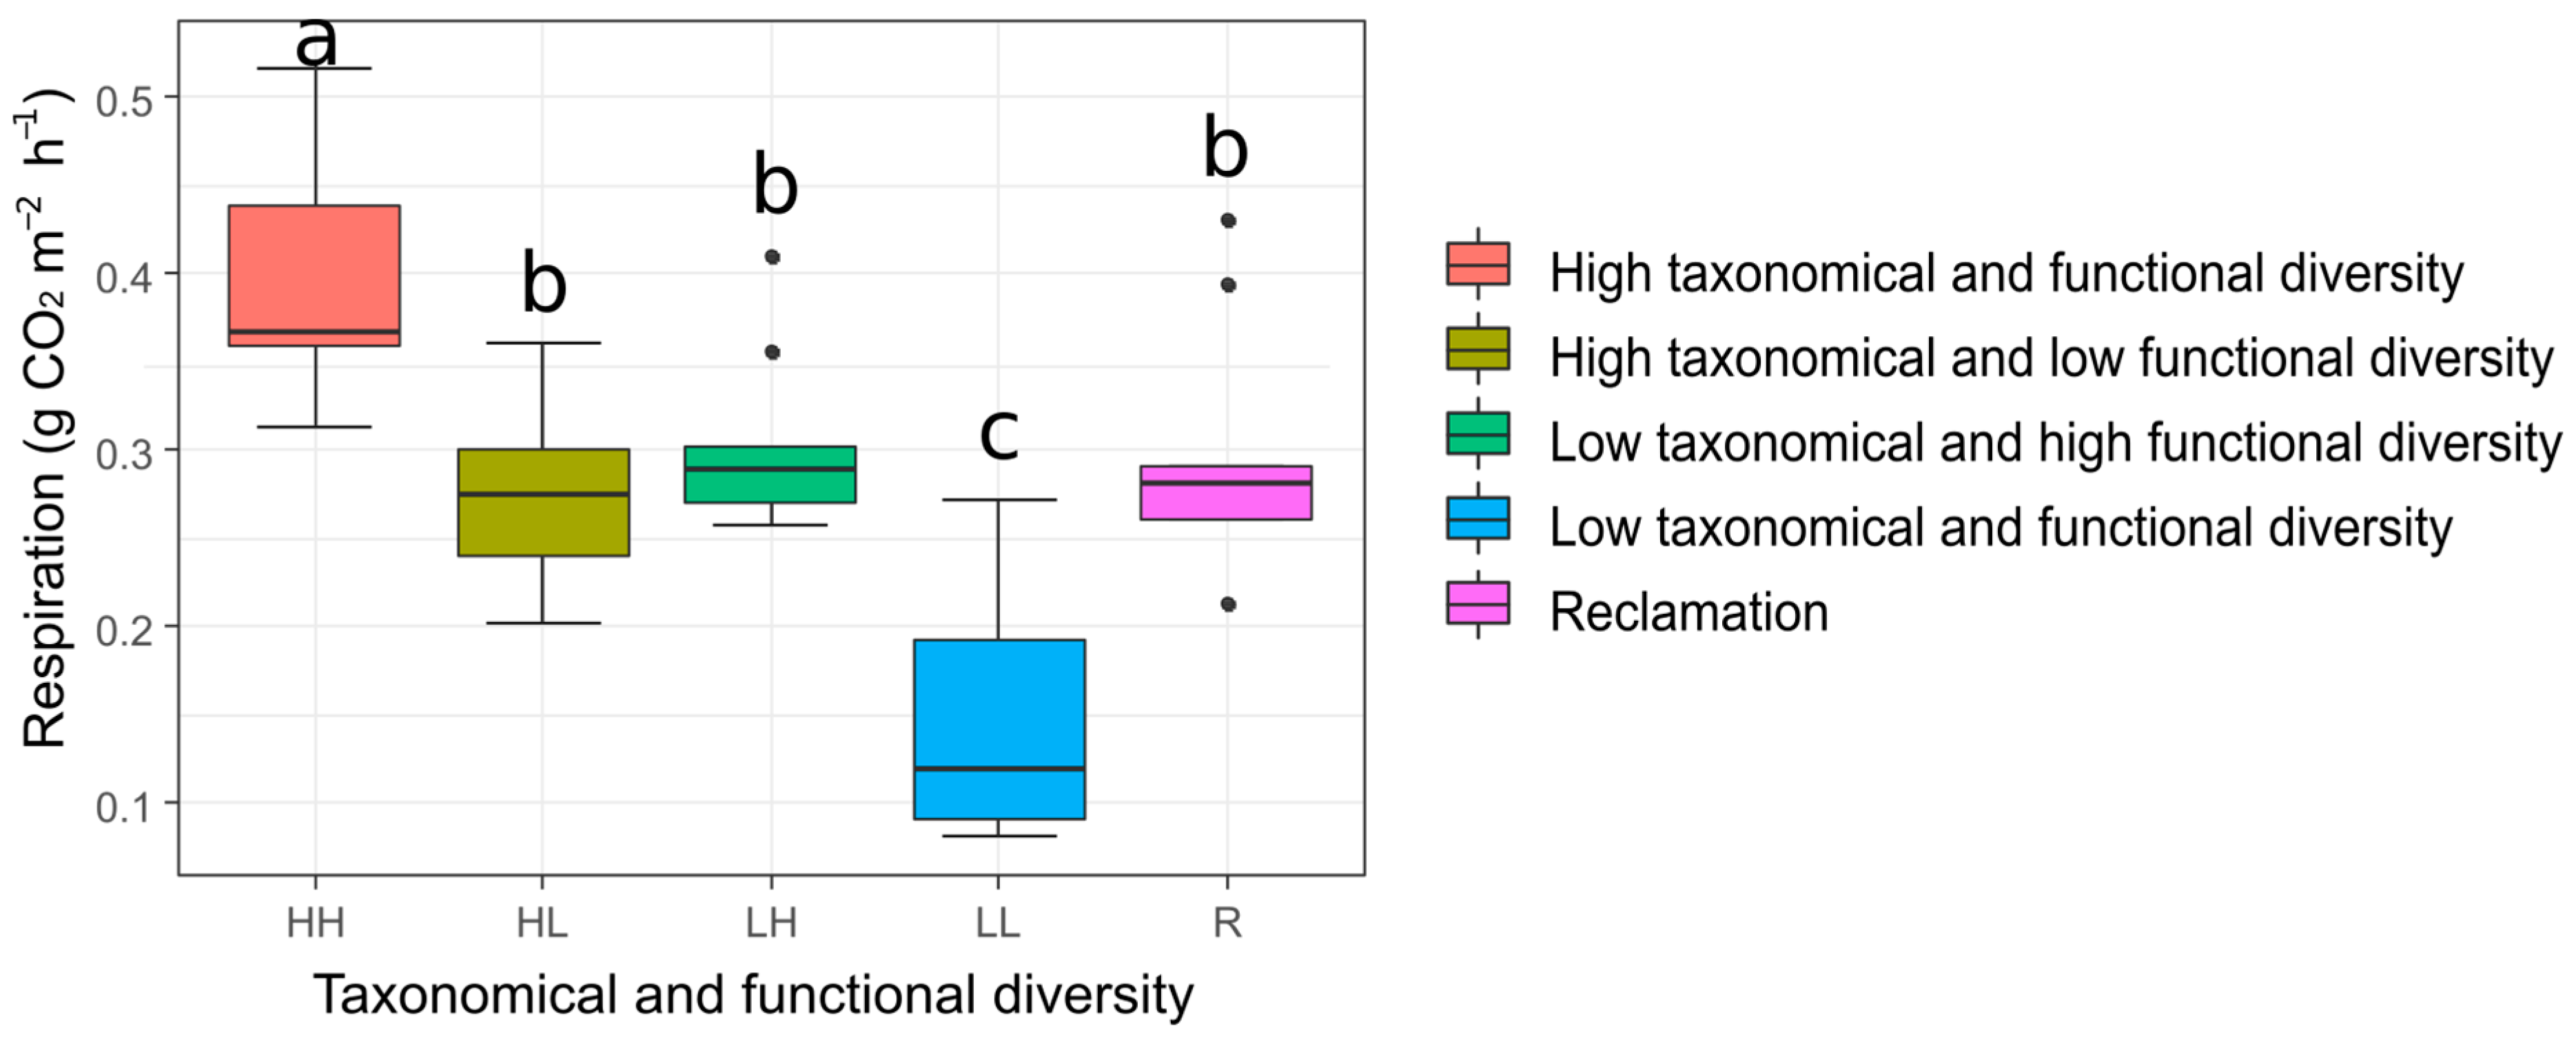
3.3. Soil Respiration

Soil respiration (Rs) differed significantly between investigated plot categories (Figure 4). The HH plots were characterised by a significantly higher value of average Rs compared to the other plots, while the lowest average Rs were found in LL plots.

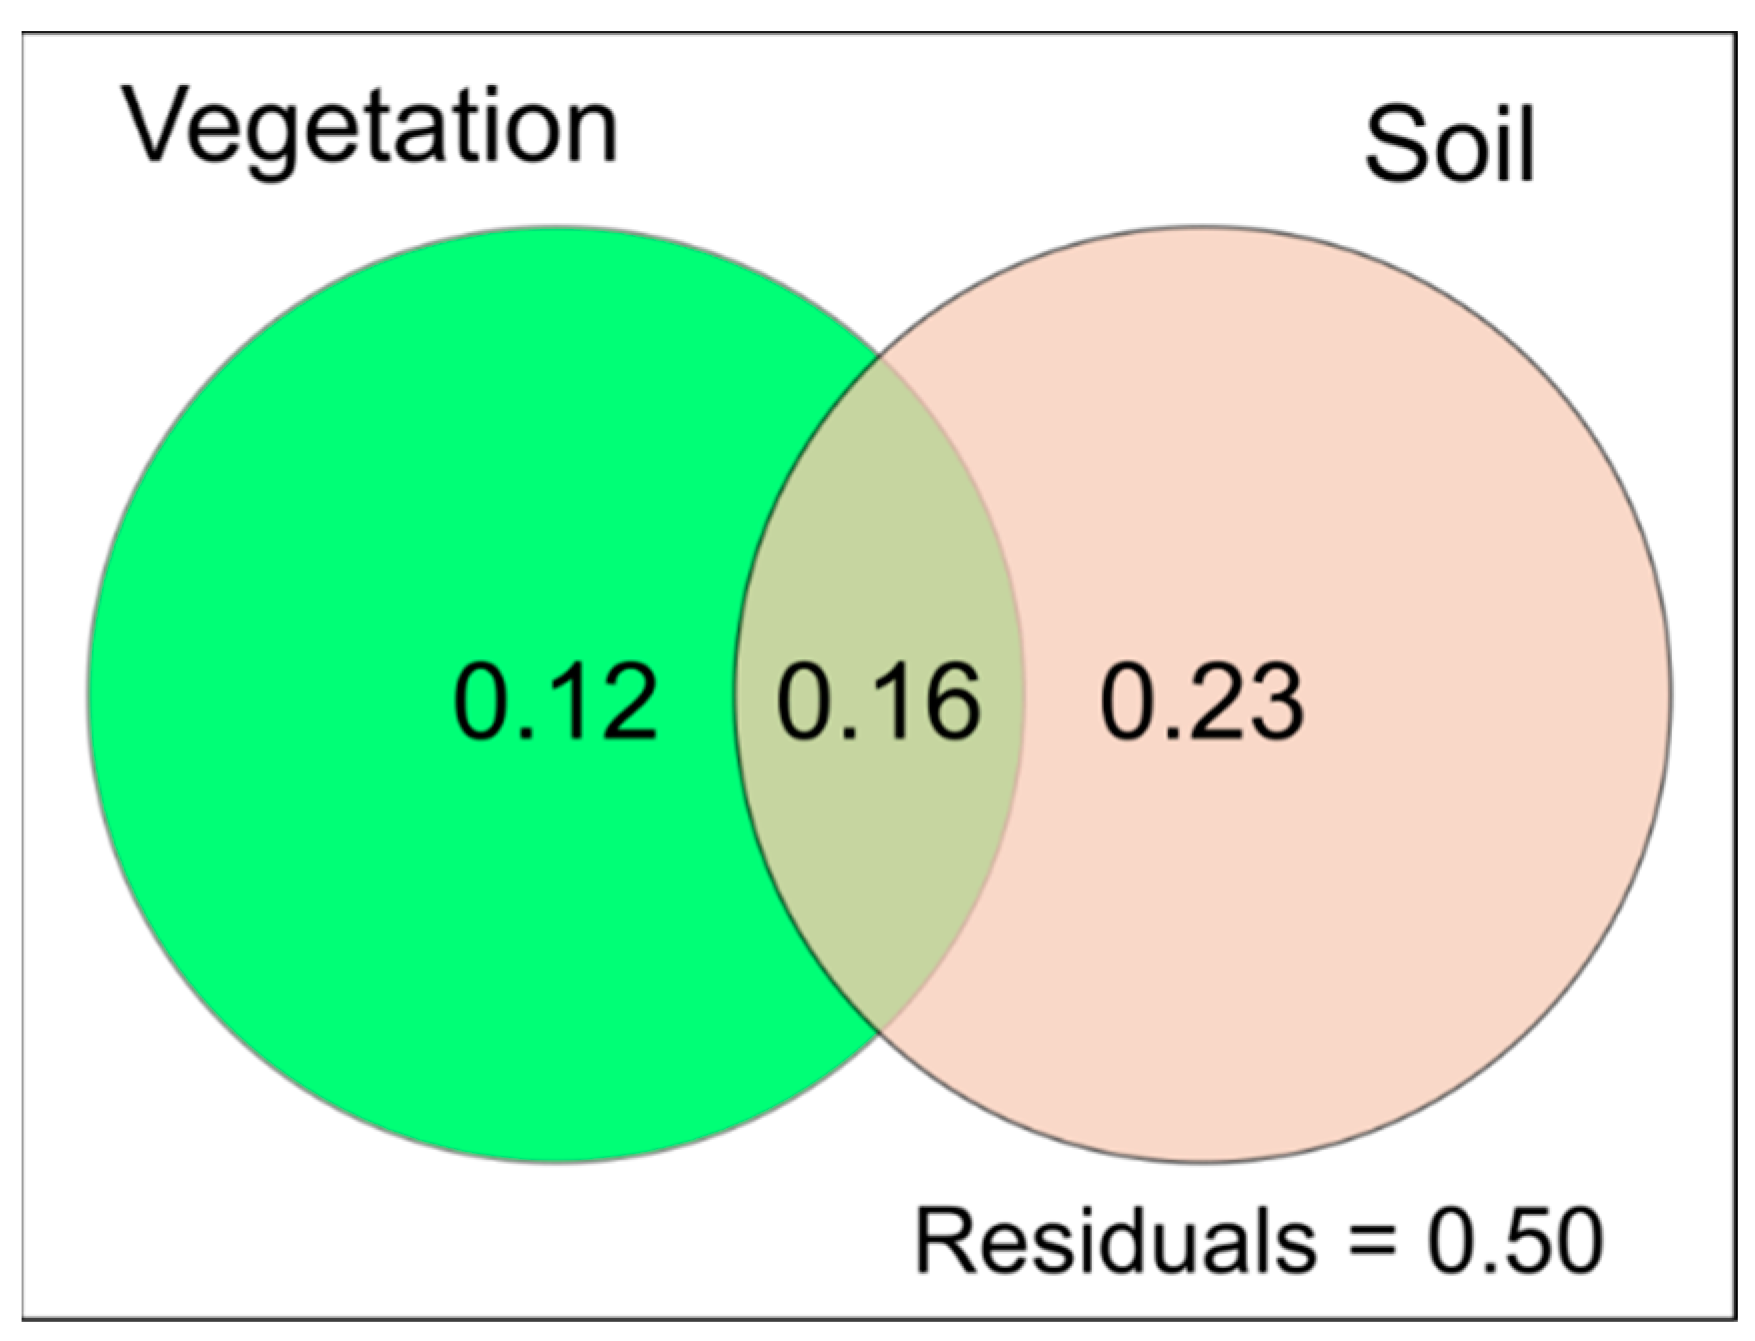
3.4. Relationships between Substrate Physicochemical Parameters, Plant Diversity and PLFA Profiles

Redundancy (RDA) analysis was conducted to identify relationships between physicochemical factors, plant diversity and PFLA profiles (Figure 5). According to RDA, only four soil parameters explained PLFAs variation significantly. These were pH in KCl, EC, available Mg and SOM content. The pH and EC ordinate plots correlated along the first RDA axis, whereas available Mg and SOM were correlated with the second RDA axis. Reclaimed plots were associated with higher available Mg, exchangeable Na+ and available phosphorus (P2O5). The pH explained the greatest PLFAs variation across plant diversity levels.
The NMDS ordination clearly separated the plot microbial communities under reclamation management from those unreclaimed. On the other hand, we did not find differences between the unreclaimed plot categories. The eleven biotic variables (biomass of investigated groups of microorganisms, diversity indices, stress markers and soil respiration) significantly explained the PLFA patterns (Figure 6). The highest respiration values and nutrient stress markers were associated with R plots.
According to the Venn diagram (Figure 7) showing the variance partition explaining microbial biomass, substrate parameters accounted for 23% (adjusted r2 = 0.52), vegetation diversity for 12% (adjusted r2 = 0.8), and interactions between the two for 16% (adjusted r2 = 0.50) of microbial biomass.

4. Discussion

Ecosystem functioning (e.g., carbon cycle, nutrient cycle), as well as the ecosystem services delivered, depend on the overall diversity of living organisms [13,47,48]. Until now, most research on the interaction between plant communities and belowground microorganisms was conducted in natural and seminatural habitats and took into account mainly taxonomical diversity [49,50]. Although every plant species contributes to ecosystem processes, the magnitude of individual species’ contribution can vary considerably, depending on the baggage of functional traits carried. Moreover, different species found in a plant community might possess a common set of functional traits that enable them to utilise accessible resources in a similar way despite representing different taxonomical units [51]. The current geological epoch—the Anthropocene—inspired us to study the relationships between plant communities of different taxonomical and functional diversity and microorganism communities in novel ecosystems developing on de novo established post-mineral excavation habitats.

4.1. Explanatory Ability of Functional Traits

The selection of functional traits to explain and assess species diversity has been a matter of discussion for a long time [52,53,54,55]. One approach adopted in several studies assumes the use of numerical analyses for the detection of all traits that are important for the function of interest [56]. An alternative approach suggests the setup of a database with the traits dedicated to the specific research hypothesis formulated to solve the scientific problem [34,53,57,58,59]. The latest approach was also applied in our studies, considering only those traits available for all the plant species recorded. To assess functional diversity, we included traits from the TRY database [35] related to persistence, regeneration, and dispersal taken. These play a crucial role in the colonization of brownfield sites, adaptation to different forms of stress that species suffer in hostile habitats (e.g., life strategies, life span, EIVs, species nutrient requirements, plant nitrogen fixation capacity), as well as regeneration after disturbances and occupation of new open sites (niches) (e.g., plant vegetative regeneration capacity, clonal growth organs, storage organs). Results of previous studies conducted on coal mine spoil heaps revealed that the significance of different plant traits varies along the phases of vegetation development, and is associated with ecosystem functions such as productivity, photosynthesis and resource acquisition or conservation [60]. In our studies, FDis was higher in plots that represent earlier stages of succession on post-coal mine heaps (namely HH and LH plots) when all the species able to pass through the dispersal barrier can start to occupy open niches. The high FDis values may reflect the divergence of species that start to assemble. Later, the plant’s functional diversity declines as filters, other than dispersal barrier, start to play an important role, e.g., environmental filters, such as salinity, drought, soil texture; or biotic filters, such as strong competition by perennial forbs and expansive grasses that started to play the role of dominant species in plots). A decline in FDis during later stages of succession may reflect the convergence of plant community traits on resources used and competition strategies [61].
The quality of results obtained using analysis of traits can be influenced by the limited group of plants studied, e.g., only herbaceous or only woody plants, excluding mosses and lichens, as well as the accessibility of plant traits in databases [62]. In our studies, we took into account both the number of species as well as the number of individuals of a given species. We also took into account the completeness of traits accessible to all species occurring in plots.

4.2. Soil Microorganisms and Physicochemical Substrate Parameters

Microorganism communities strongly depend on both biotic and abiotic soil factors. Among the latter, soil pH is recognized as the major factor influencing the activity and diversity of soil microorganisms [63,64]. Our results confirmed the pH of the substrate as the most important factor shaping the microbial communities, explaining most of the PLFAs’ variation among the different plot types in the RDA analysis. Similar results were obtained by Urbanová et al. [29] when analysing the development of the bacterial community during spontaneous succession on post-brown coal mining heaps. Soil pH tends to decrease in the presence of plant vegetation (e.g., vegetation dominated by legumes or trees such as Pinus sylvestris or Betula pendula) due to the production of organic acids as a consequence of litter transformation, as well as the release of root exudates [65,66].
Soil pH regulates phosphorus availability and concentrations of anions that compete with P ions [67]. In our study, the biggest pool of available P was observed in the HH plot, characterised by the highest substrate pH. Furthermore, the results of the RDA analysis showed that the amount of available P was positively correlated with the amount of 16:1ω5 fatty acid, which is a marker of AMF. However, the decline in AMF biomass under no P limitation has been reported across independent field experiments [68] as a consequence of reduced amounts of carbohydrates allocated from plants to AMF [69]. On the other hand, other publications reported that additional P input increased the relative AMF biomass [70,71]. The effects of P on AMF biomass may depend on the P availability in soils of different ecosystems. In our study, the available P content was relatively low; thus, microorganisms were limited in terms of P content. Therefore, a slight increase in P availability in coal mines stimulates AMF proliferation [72], which is indicated by the positive correlation between AMF biomass and available P content [73] (Figure 4).
In our study, SOC was correlated with the second RDA axis. However, it should be noted that most of the carbon present in the spoil material was related to coal particles of geogenic origin that are not available to microorganisms [74,75]. Therefore, despite the high organic carbon content (8–24%), the substrate in the investigated plots might have low amounts of available carbon sources for microorganisms, contributing to the lack of correlation between SOC and the soil microorganism biomass.

4.3. Interactions between Plant Taxonomic and Functional Diversity and Soil Microorganisms

For a long time, plant species diversity was assessed based on taxonomic features. Taxonomic diversity alone, omitting the functional traits, could fail to explain plant contribution to the functioning of the belowground system because several significant effects of plants on abiotic and biotic substrate parameters might be overlooked.
In our previous studies on enzyme activity of the substrate under grasses (Calamagrostis epigejos, Poa compressa) and herbs (Daucus carota, Tussilago farfara), we detected that the soil physicochemical parameters had a greater impact on the biochemical activity in the substrate than biomass and plant species diversity on hard coal heaps [74]. Similarly, Borymski et al. [76], studying the structure of microbial communities in the rhizosphere of plants grown on heavy metal contaminated soils, did not observe the effect of plants on PLFAs profiles. They suggested that the impact of environmental factors, such as pH and water content, masked the positive effects of plant exudates on microbial communities. In contrast, a dominant effect of Silene vulgaris on the structure of soil microbial community in heavy metal contaminated sites was detected by Pacwa-Płociniczak et al. [77]. Kozdrój and Van Elsas [78] found that artificial root exudates reduced the bacterial community diversity towards domination of r-strategists in soil exposed to Pb, Zn and Cd. However, in those studies, only single individuals of selected plant species were investigated. Neither the taxonomic nor the functional diversity of the vegetation communities were considered.
The higher biomass of most microbial groups in our plots with low taxonomic and functional diversity (namely LL plots) may be surprising since previous studies suggest that high plant biodiversity should increase soil microbial communities’ biomass and diversity [7,9,79,80,81]. However, the hypothesis that links plant and microbial diversity can be challenged in an ecosystem undergoing the early stages of vegetation succession. In our study, plots HH and HL represent an earlier stage of vegetation development than plots LH and LL. Moreover, this was confirmed by the changes in substrate pH. As already mentioned, substrate pH tends to decrease over time. Those findings are in agreement with previous studies, which have shown that the plant diversity of communities formed in earlier stages of succession may be higher than the diversity of climax communities [82]. Prach [83], in long-term studies conducted on coal mine heaps, found that most plant species were recorded only in the first few years of succession. These early communities found in the first 12 years were characterized by low abundance of individuals per species and very high diversity. Furthermore, Prach [84] pointed out that the highest diversity of ruderal or weedy species was recorded at the beginning of succession in abandoned urban sites before some species became dominant, competitively excluding the other species. Horn and MacArthur [85], as well as Horn [86], stated that there are no technical limits to the number of species that co-occur in a mosaic environment in the early stages of succession; the increase in plant species diversity depends on whether species can occupy new open sites. High migration to open sites means that over time fewer empty patches will be available for colonisation by newly arriving species, thus limiting the possibility of further increases in diversity. Later, plant diversity declines under strong competition from robust forbs and grasses.
Therefore, once established that plots characterised by low taxonomic diversity (LL and LH) represent a late stage of succession compared to the HH and HL plots, we suggest that the prolonged exposure over time of soil microbial communities to plant root exudates and litter in LL and LH plots had a stimulating effect on the development of biomass and activity of soil microbial communities. Moreover, as stated by Kompała-Bąba et al. [74], C. epigejos (the dominant species in the LL and LH plots), because of its extensive root system, has a greater influence on the microbial activity of the substrate than other plants on spoil heaps.
The reclaimed plots (R) were characterised by the highest microbial biomass, which is associated with the reclamation treatments carried out in the form of soil overburden and soil-stabilising plants, including legumes. Similar results for reclaimed heaps were obtained in studies of heaps after lignite mining [87,88,89].
In our study, we found no significant changes in soil microbial diversity between plots with different taxonomic and plant functional diversity. However, Woźniak et al. [60] showed that differences in microbial diversity were detected in a broader chronosequence, covering vegetation development stages from initial succession to the forest stage. The lack of significant differences in microbial diversity between the different types of plots may also be due to the limited pool of microorganisms that are able to colonise the poor substrate at the initial stages of succession. Furthermore, PLFA analysis has a relatively low resolution, and in-depth molecular studies could reveal existing differences in microbial biodiversity [90].
The PLFA ratio of (i15:0 + i17:0)/(a15:0 + a17:0) and iso/anteiso have been used as indicators of physiological stress on bacteria [91]. Reclaimed plots had the highest stress rates, which is associated with competition between microorganisms for organic substrates and nutrients, as reclaimed plots had the highest soil microbial biomass and the lowest N content. Muhammad et al. [92] also indicated that higher N content reduces stress in soil microbial communities in soil treated with biochar. The high levels of stress markers in the reclaimed plots may also be related to a lack of adaptation of the soil microorganisms that arrived with the soil overburden to the harsh environment of the spoil heap.

4.4. Soil Respiration

Soil respiration (Rs) is considered a good estimator of overall biological activity and a descriptor of soil quality [93,94]. Plants play an important role in regulating Rs as they are the main channels through which carbon enters the soil [48,95]. Vegetation, due to the chemical composition of belowground roots, root exudates, and above-ground biomass and litter, determines the abundance and activity of soil microbes, as well as soil respiration. However, in this study, the low rate of respiration in LL plots may be related to the low pH of the substrate, in agreement with the results of Sitaula et al. [96], which found that soils with a pH of 3.0 produced up to 12 times less CO2 than soils with a pH of 4.0. It also confirms the high rate of respiration in the HH plots, where the substrate pH was above 7.

5. Conclusions

The analysis of the newly established relationships between plant species composition and microbial communities is essential for understanding the functioning of novel ecosystems. Our studies revealed that the plant taxonomic and functional diversity poses challenges in the identification of the dynamic patterns of relationships between aboveground and belowground biota and their relative impacts on ecosystem processes taking place on coal mine heaps.
Opposite to our expectations, soil microbial biomass was more impacted by abiotic parameters (e.g., pH, EC, available Mg, SOM content) (explaining 23% of variance), than plant diversity (explaining 12% of variance). We detected the higher biomass of most microbial groups in plots with low taxonomic and functional diversity. This phenomenon can be explained by the fact that these plots represent a more advanced phase of vegetational development in the early stages of plant succession.
In light of our findings and the insufficient information regarding, e.g., the diversity of microorganisms, as well as the quantity and quality of root exudates, the relation between functional and taxonomic plant diversity and soil microbial communities of developing novel ecosystems needs further studying.
Leaving heaps after hard coal mining to spontaneous succession enables colonizing by species with functional traits that enable them to effectively utilise scarce nutrients and create self-sustained ecosystems. The knowledge gained can assist in planning/supporting the remediation of brownfields based on sets of native species that can help accelerate the ecological processes occurring in these wastelands.

Supplementary Materials

The following supporting information can be downloaded at: https://www.mdpi.com/article/10.3390/su15064880/s1, Table S1: List of functional traits used to calculate the functional diversity of plants.

Author Contributions

Conceptualization, F.M. Z.P.-S. and G.W.; methodology, M.M., A.K.-B. and W.B.; validation, A.K.-B., A.B. G.W. and F.M.; formal analysis, W.B. D.C. and A.K.-B.; investigation, A.B., M.M. and W.B.; resources, Z.P.-S.; data curation, W.B. and A.K.-B.; writing—original draft preparation, W.B.; writing—review and editing, G.W., F.M., A.K.-B., A.M.J. and Z.P.-S.; visualization, D.C. and W.B.; supervision, Z.P.-S.; project administration, Z.P.-S.; funding acquisition, Z.P-S and A.M.J. All authors have read and agreed to the published version of the manuscript.

Funding

This work was supported by The National Science Centre in Poland, Grant Number: 2017/25/B/NZ8/02449 (Ocena zależności pomiędzy funkcjonalną różnorodnością roślin, strukturą zespołów mikroorganizmów i bilans węgla w czasie spontanicznej sukcesji na terenach poprzemysłowych z wykorzystaniem analiz metatranskryptomicznych).

Institutional Review Board Statement

Not applicable.

Informed Consent Statement

Not applicable.

Data Availability Statement

Not applicable.

Acknowledgments

We gratefully thank the referees who provided helpful comments on our article. We would like to thank Monika Szalbot and Paulina B.A. Zieleźnik-Rusinowska who helped us with laboratory work.

Conflicts of Interest

The authors declare no conflict of interest.

References

  1. Bardgett, R.D.; Van Der Putten, W.H. Belowground biodiversity and ecosystem functioning. Nature 2014, 515, 505–511. [Google Scholar] [CrossRef]
  2. Kaiser, C.; Kilburn, M.R.; Clode, P.L.; Fuchslueger, L.; Koranda, M.; Cliff, J.B.; Solaiman, Z.M.; Murphy, D.V. Exploring the transfer of recent plant photosynthates to soil microbes: Mycorrhizal Pathway vs Direct Root Exudation. N. Phytol. 2015, 205, 1537–1551. [Google Scholar] [CrossRef] [PubMed]
  3. Lorenz, K.; Lal, R.; Shipitalo, M.J. Stabilized soil organic carbon pools in subsoils under forest are potential sinks for atmospheric CO2. For. Sci. 2011, 57, 19–25. [Google Scholar]
  4. Turner, B.L.; Lambers, H.; Condron, L.M.; Cramer, M.D.; Leake, J.R.; Richardson, A.E.; Smith, S.E. Soil microbial biomass and the fate of phosphorus during long-term ecosystem development. Plant Soil 2013, 367, 225–234. [Google Scholar] [CrossRef]
  5. Terrer, C.; Phillips, R.P.; Hungate, B.A.; Rosende, J.; Pett-Ridge, J.; Craig, M.E.; van Groenigen, K.J.; Keenan, T.F.; Sulman, B.N.; Stocker, B.D.; et al. A trade-off between plant and soil carbon storage under elevated CO2. Nature 2021, 591, 599–603. [Google Scholar] [CrossRef]
  6. Fanin, N.; Hättenschwiler, S.; Barantal, S.; Schimann, H.; Fromin, N. Does variability in litter quality determine soil microbial respiration in an amazonian rainforest? Soil Biol. Biochem. 2011, 43, 1014–1022. [Google Scholar] [CrossRef]
  7. Lange, M.; Eisenhauer, N.; Sierra, C.A.; Bessler, H.; Engels, C.; Griffiths, R.I.; Mellado-Vázquez, P.G.; Malik, A.A.; Roy, J.; Scheu, S.; et al. Plant diversity increases soil microbial activity and soil carbon storage. Nat. Commun. 2015, 6, 6707. [Google Scholar] [CrossRef] [Green Version]
  8. Steinauer, K.; Chatzinotas, A.; Eisenhauer, N. Root Exudate Cocktails: The link between plant diversity and soil microorganisms? Ecol. Evol. 2016, 6, 7387–7396. [Google Scholar] [CrossRef] [Green Version]
  9. Chen, C.; Chen, H.Y.H.; Chen, X.; Huang, Z. Meta-analysis shows positive effects of plant diversity on microbial biomass and respiration. Nat. Commun. 2019, 10, 1332. [Google Scholar] [CrossRef] [Green Version]
  10. Chen, C.; Chen, H.Y.H.; Chen, X. Functional diversity enhances, but exploitative traits reduce tree mixture effects on microbial biomass. Funct. Ecol. 2020, 34, 276–286. [Google Scholar] [CrossRef]
  11. Johnson, D.; Phoenix, G.K.; Grime, J.P. Plant community composition, not diversity, regulates soil respiration in grasslands. Biol. Lett. 2008, 4, 345–348. [Google Scholar] [CrossRef] [Green Version]
  12. Rottstock, T.; Joshi, J.; Kummer, V.; Fischer, M. Higher plant diversity promotes higher diversity of fungal pathogens, while it decreases pathogen infection per plant. Ecology 2014, 95, 1907–1917. [Google Scholar] [CrossRef] [Green Version]
  13. Jarzyna, M.A.; Jetz, W. Taxonomic and functional diversity change is scale dependent. Nat. Commun. 2018, 9, 2565. [Google Scholar] [CrossRef] [Green Version]
  14. Mariotte, P.; Vandenberghe, C.; Meugnier, C.; Rossi, P.; Bardgett, R.D.; Buttler, A. Subordinate plant species impact on soil microbial communities and ecosystem functioning in grasslands: Findings from a removal experiment. Perspect. Plant Ecol. Evol. Syst. 2013, 15, 77–85. [Google Scholar] [CrossRef]
  15. Eisenhauer, N.; Beßler, H.; Engels, C.; Gleixner, G.; Habekost, M.; Milcu, A.; Partsch, S.; Sabais, A.C.W.; Scherber, C.; Steinbeiss, S.; et al. Plant diversity effects on soil microorganisms support the singular hypothesis. Ecology 2010, 91, 485–496. [Google Scholar] [CrossRef]
  16. Reich, P.B.; Oleksyn, J.; Modrzynski, J.; Mroziński, P.; Hobbie, S.E.; Eissenstat, D.M.; Chorover, J.; Chadwick, O.A.; Hale, C.M.; Tjoelker, M.G. Linking litter calcium, earthworms and soil properties: A common garden test with 14 tree species. Ecol. Lett. 2005, 8, 811–818. [Google Scholar] [CrossRef]
  17. Cardinale, B.J.; Duffy, J.E.; Gonzalez, A.; Hooper, D.U.; Perrings, C.; Venail, P.; Narwani, A.; MacE, G.M.; Tilman, D.; Wardle, D.A.; et al. Biodiversity loss and its impact on humanity. Nature 2012, 486, 59–67. [Google Scholar] [CrossRef] [Green Version]
  18. Frouz, J.; Roubíčková, A.; Heděnec, P.; Tajovský, K. Do Soil Fauna Really Hasten Litter Decomposition? A meta-analysis of enclosure studies. Eur. J. Soil Biol. 2015, 68, 18–24. [Google Scholar] [CrossRef]
  19. Jagodziński, A.M.; Dyderski, M.K.; Gȩsikiewicz, K.; Horodecki, P. Tree- and stand-level biomass estimation in a Larix decidua Mill. Chronosequence. Forests 2018, 9, 587. [Google Scholar] [CrossRef] [Green Version]
  20. Kompała-Bąba, A.; Sierka, E.; Dyderski, M.K.; Bierza, W.; Magurno, F.; Besenyei, L.; Błońska, A.; Ryś, K.; Jagodziński, A.M.; Woźniak, G. Do the dominant plant species impact the substrate and vegetation composition of post-coal mining spoil heaps? Ecol. Eng. 2020, 143, 105685. [Google Scholar] [CrossRef]
  21. Hobbs, R.J.; Higgs, E.S.; Hall, C.M. Novel Ecosystems: Intervening in the New Ecological World Order; Wiley Blackwell: Hoboken, NJ, USA, 2013; ISBN 9781118354186. [Google Scholar]
  22. Rotherham, I.D. Recombinant Ecology—A Hybrid Future? Springer: Cham, Switzerland, 2017; ISBN 978-3-319-49796-9. [Google Scholar]
  23. Hobbs, R.J.; Arico, S.; Aronson, J.; Baron, J.S.; Bridgewater, P.; Cramer, V.A.; Epstein, P.R.; Ewel, J.J.; Klink, C.A.; Lugo, A.E.; et al. Novel Ecosystems: Theoretical and management aspects of the new ecological world order. Glob. Ecol. Biogeogr. 2006, 15, 1–7. [Google Scholar] [CrossRef]
  24. Tropek, R.; Kadlec, T.; Hejda, M.; Kocarek, P.; Skuhrovec, J.; Malenovsky, I.; Vodka, S.; Spitzer, L.; Banar, P.; Konvicka, M. Technical reclamations are wasting the conservation potential of post-mining sites. a case study of black coal spoil dumps. Ecol. Eng. 2012, 43, 13–18. [Google Scholar] [CrossRef]
  25. Tropek, R.; Kadlec, T.; Karesova, P.; Spitzer, L.; Kocarek, P.; Malenovsky, I.; Banar, P.; Tuf, I.H.; Hejda, M.; Konvicka, M. Spontaneous succession in limestone quarries as an effective restoration tool for endangered arthropods and plants. J. Appl. Ecol. 2010, 47, 139–147. [Google Scholar] [CrossRef]
  26. Novák, J.; Prach, K. Vegetation succession in basalt quarries: Pattern on a landscape scale. In Applied Vegetation Science; John Wiley & Sons, Ltd.: Hoboken, NJ, USA, 2003; Volume 6, pp. 111–116. [Google Scholar]
  27. Řehounková, K.; Čížek, L.; Řehounek, J.; Šebelíková, L.; Tropek, R.; Lencová, K.; Bogusch, P.; Marhoul, P.; Máca, J. Additional disturbances as a beneficial tool for restoration of post-mining sites: A multi-taxa approach. Environ. Sci. Pollut. Res. Int. 2016, 23, 13745–13753. [Google Scholar] [CrossRef]
  28. Sharma, A.; Guinness, J.; Muyskens, A.; Polizzotto, M.L.; Fuentes, M.; Hesterberg, D. Spatial statistical modeling of arsenic accumulation in microsites of diverse soils. Geoderma 2022, 411, 115697. [Google Scholar] [CrossRef]
  29. Urbanová, M.; Kopecký, J.; Valášková, V.; Ságová-Marečková, M.; Elhottová, D.; Kyselková, M.; Moënne-Loccoz, Y.; Baldrian, P. Development of bacterial community during spontaneous succession on spoil heaps after brown coal mining. FEMS Microbiol. Ecol. 2011, 78, 59–69. [Google Scholar] [CrossRef] [Green Version]
  30. Jarosz, J. (Mineral and Energy Economy Research Institute, Polish Academy of Sciences, Kraków, Poland). Personal communication, 2019. [Google Scholar]
  31. Magurran, A.E. Ecological Diversity and Its Measurement; Springer: Berlin/Heidelberg, Germany, 1988. [Google Scholar]
  32. Hedberg, P.; Kozub, Ł.; Kotowski, W. Functional diversity analysis helps to identify filters affecting community assembly after fen restoration by top-soil removal and hay transfer. J. Nat. Conserv. 2014, 22, 50–58. [Google Scholar] [CrossRef]
  33. Laliberte, E.; Legendre, P. A Distance-based framework for measuring functional diversity from multiple traits. Ecology 2010, 91, 299–305. [Google Scholar] [CrossRef]
  34. Kattge, J.; Bönisch, G.; Díaz, S.; Lavorel, S.; Prentice, I.C.; Leadley, P.; Tautenhahn, S.; Werner, G.D.A.; Aakala, T.; Abedi, M.; et al. TRY Plant Trait Database—Enhanced coverage and open access. Glob. Chang. Biol. 2020, 26, 119–188. [Google Scholar] [CrossRef] [Green Version]
  35. Kleyer, M.; Bekker, R.M.; Knevel, I.C.; Bakker, J.P.; Thompson, K.; Sonnenschein, M.; Poschlod, P.; Van Groenendael, J.M.; Klimeš, L.; Klimešová, J.; et al. The LEDA traitbase: A database of life-history traits of the Northwest European flora. J. Ecol. 2008, 96, 1266–1274. [Google Scholar] [CrossRef]
  36. Woźniak, G.; Dyderski, M.K.; Kompała-Bąba, A.; Jagodziński, A.M.; Pasierbiński, A.; Błońska, A.; Bierza, W.; Magurno, F.; Sierka, E. Use of remote sensing to track postindustrial vegetation development. L. Degrad. Dev. 2021, 32, 1426–1439. [Google Scholar] [CrossRef]
  37. Błońska, A.; Kompała-Bąba, A.; Sierka, E.; Besenyei, L.; Magurno, F.; Frydecka, K.; Bierza, W.; Woźniak, G. Impact of selected plant species on enzymatic activity of soil substratum on post-mining heaps. J. Ecol. Eng. 2019, 20, 138–144. [Google Scholar] [CrossRef]
  38. Hristov, B.; Filcheva, E.; Ivanov, P. Organic matter content and composition of soils with stagnic properties from Bulgaria. Bulg. J. Soil Sci. 2016, 1, 26–32. [Google Scholar]
  39. Rutherford, P.M.; McGill, W.B.; Arocena, J.M.; Figueiredo, C.T. Total nitrogen. In Soil Sampling and Methods of Analysis; Carter, M.R., Gregoric, E.G., Eds.; CRC Press: Boca Raton, FL, USA, 2006; pp. 267–278. [Google Scholar]
  40. Staugaitis, G.; Rutkauskiene, R. Comparison of magnesium determination methods as influenced by soil properties. Zemdirbyste 2010, 97, 105–116. [Google Scholar]
  41. López-Marcos, D.; Martínez-Ruiz, C.; Turrión, M.B.; Jonard, M.; Titeux, H.; Ponette, Q.; Bravo, F. Soil carbon stocks and exchangeable cations in monospecific and mixed pine forests. Eur. J. For. Res. 2018, 137, 831–847. [Google Scholar] [CrossRef]
  42. Woźniak, G.; Kamczyc, J.; Bierza, W.; Błońska, A.; Kompała-Bąba, A.; Sierka, E.; Jagodziński, A.M. Functional ecosystem parameters: Soil respiration and diversity of mite (Acari, Mesostigmata) communities after disturbance in a Late Cambrian bedrock environment. L. Degrad. Dev. 2022, 33, 3343–3357. [Google Scholar] [CrossRef]
  43. Pennanen, T.; Frostegård, Å.; Fritze, H.; Bååth, E. Phospholipid fatty acid composition and heavy metal tolerance of soil microbial communities along two heavy metal-polluted gradients in coniferous forests. Appl. Environ. Microbiol. 1996, 62, 420–428. [Google Scholar] [CrossRef] [PubMed] [Green Version]
  44. Frostegård, A.; Bååth, E. The use of phospholipid fatty acid analysis to estimate bacterial and fungal biomass in soil. Biol. Fertil. Soils 1996, 22, 59–65. [Google Scholar] [CrossRef]
  45. Bååth, E.; Anderson, T.H. Comparison of soil fungal/bacterial ratios in a pH gradient using physiological and PLFA-based techniques. Soil Biol. Biochem. 2003, 35, 955–963. [Google Scholar] [CrossRef]
  46. Ushio, M.; Wagai, R.; Balser, T.C.; Kitayama, K. Variations in the soil microbial community composition of a tropical montane forest ecosystem: Does tree species matter? Soil Biol. Biochem. 2008, 40, 2699–2702. [Google Scholar] [CrossRef]
  47. Chapman, S.K.; Newman, G.S. Biodiversity at the plant-soil interface: Microbial abundance and community structure respond to litter mixing. Oecologia 2010, 162, 763–769. [Google Scholar] [CrossRef] [PubMed]
  48. Chen, X.; Chen, H.Y.H. Global effects of plant litter alterations on soil CO2 to the atmosphere. Glob. Chang. Biol. 2018, 24, 3462–3471. [Google Scholar] [CrossRef]
  49. Bardgett, R.D.; Bowman, W.D.; Kaufmann, R.; Schmidt, S.K. A Temporal approach to linking aboveground and belowground ecology. Trends Ecol. Evol. 2005, 20, 634–641. [Google Scholar] [CrossRef] [PubMed]
  50. Oelmann, Y.; Lange, M.; Leimer, S.; Roscher, C.; Aburto, F.; Alt, F.; Bange, N.; Berner, D.; Boch, S.; Boeddinghaus, R.S.; et al. Above- and belowground biodiversity jointly tighten the P cycle in agricultural grasslands. Nat. Commun. 2021, 12, 4431. [Google Scholar] [CrossRef] [PubMed]
  51. Naeem, S.; Tjossem, S.F.; Byers, D.; Bristow, C.; Li, S. Plant neighborhood diversity and production. Ecoscience 1999, 6, 355–365. [Google Scholar] [CrossRef]
  52. Díaz, S.; Cabido, M. Vive La Différence: Plant functional diversity matters to ecosystem processes. Trends Ecol. Evol. 2001, 16, 646–655. [Google Scholar] [CrossRef]
  53. Lefcheck, J.S.; Bastazini, V.A.G.; Griffin, J.N. Choosing and using multiple traits in functional diversity research. Environ. Conserv. 2015, 42, 104–107. [Google Scholar] [CrossRef] [Green Version]
  54. Mlambo, M.C. Not all traits are “functional”: Insights from taxonomy and biodiversity-ecosystem functioning research. Biodivers. Conserv. 2014, 23, 781–790. [Google Scholar] [CrossRef]
  55. Petchey, O.L.; Gaston, K.J. Functional diversity (FD), species richness and community composition. Ecol. Lett. 2002, 5, 402–411. [Google Scholar] [CrossRef]
  56. Petchey, O.L.; Gaston, K.J. Functional diversity: Back to basics and looking forward. Ecol. Lett. 2006, 9, 741–758. [Google Scholar] [CrossRef]
  57. Guerrero-Ramírez, N.R.; Mommer, L.; Freschet, G.T.; Iversen, C.M.; McCormack, M.L.; Kattge, J.; Poorter, H.; van der Plas, F.; Bergmann, J.; Kuyper, T.W.; et al. Global root traits (GRooT) database. Glob. Ecol. Biogeogr. 2021, 30, 25–37. [Google Scholar] [CrossRef]
  58. Enquist, B.J.; Condit, R.; Peet, R.K.; Schildhauer, M.; Thiers, B. The Botanical Information and Ecology Network (BIEN): Cyberinfrastructure for an integrated botanical information network to investigate the ecological impacts of global climate change on plant biodiversity. PeerJ Preprints. 2016, e2615v2. [Google Scholar] [CrossRef]
  59. de Bello, F.; Carmona, C.P.; Dias, A.T.C.; Götzenberger, L.; Moretti, M.; Berg, M.P. Handbook of Trait-Based Ecology; Cambridge University Press: Cambridge, UK, 2021; ISBN 9781108628426. [Google Scholar]
  60. Wozniak, G.; Markowicz, A.; Borymski, S.; Piotrowska-Seget, Z.; Chmura, D.; Besenyei, L. The relationship between successional vascular plant assemblages and associated microbial communities on coal mine spoil heaps. Community Ecol. 2015, 16, 23–32. [Google Scholar] [CrossRef] [Green Version]
  61. Hu, Y.-K.; Pan, X.; Liu, X.-Y.; Fu, Z.-X.; Zhang, M.-Y. Above- and belowground plant functional composition show similar changes during temperate forest swamp succession. Front. Plant Sci. 2021, 12, 658883. [Google Scholar] [CrossRef]
  62. Gilliam, F.S.; Roberts, M.R. The Herbaceous Layer in Forests of Eastern North America, 2nd ed.; Gilliam, F.S., Ed.; Oxford University Press: New York, NY, USA, 2003. [Google Scholar]
  63. Lauber, C.L.; Hamady, M.; Knight, R.; Fierer, N. Pyrosequencing-based assessment of soil pH as a predictor of soil bacterial community structure at the continental scale. Appl. Environ. Microbiol. 2009, 75, 5111–5120. [Google Scholar] [CrossRef] [PubMed] [Green Version]
  64. Rousk, J.; Bååth, E.; Brookes, P.C.; Lauber, C.L.; Lozupone, C.; Caporaso, J.G.; Knight, R.; Fierer, N. Soil bacterial and fungal communities across a pH gradient in an arable soil. ISME J. 2010, 4, 1340–1351. [Google Scholar] [CrossRef] [PubMed]
  65. Noll, M.; Wellinger, M. Changes of the soil ecosystem along a receding glacier: Testing the correlation between environmental factors and bacterial community structure. Soil Biol. Biochem. 2008, 40, 2611–2619. [Google Scholar] [CrossRef]
  66. Chodak, M.; Pietrzykowski, M.; Niklińska, M. Development of microbial properties in a chronosequence of sandy mine soils. Appl. Soil Ecol. 2009, 41, 259–268. [Google Scholar] [CrossRef]
  67. Hinsinger, P. Bioavailability of soil inorganic P in the rhizosphere as affected by root-induced chemical changes: A review. In Plant and Soil; Springer: Berlin/Heidelberg, Germany, 2001; Volume 237, pp. 173–195. [Google Scholar]
  68. Treseder, K.K. A Meta-analysis of mycorrhizal responses to nitrogen, phosphorus, and atmospheric CO2 in field studies. N. Phytol. 2004, 164, 347–355. [Google Scholar] [CrossRef] [Green Version]
  69. Smith, S.; Read, D. Mycorrhizal Symbiosis; Elsevier Ltd.: Amsterdam, The Netherlands, 2008; ISBN 9780123705266. [Google Scholar]
  70. Stefanowicz, A.M.; Zubek, S.; Stanek, M.; Grześ, I.M.; Rożej-Pabijan, E.; Błaszkowski, J.; Woch, M.W. Invasion of Rosa rugosa induced changes in soil nutrients and microbial communities of coastal sand dunes. Sci. Total Environ. 2019, 677, 340–349. [Google Scholar] [CrossRef]
  71. Wang, Z.; Yang, S.; Wang, R.; Xu, Z.; Feng, K.; Feng, X.; Li, T.; Liu, H.; Ma, R.; Li, H.; et al. Compositional and functional responses of soil microbial communities to long-term nitrogen and phosphorus addition in a calcareous grassland. Pedobiologia 2020, 78, 150612. [Google Scholar] [CrossRef]
  72. Treseder, K.K.; Allen, M.F. Direct nitrogen and phosphorus limitation of arbuscular mycorrhizal fungi: A model and field test. New Phytol. 2002, 155, 507–515. [Google Scholar] [CrossRef] [Green Version]
  73. Odebiri, O.; Mutanga, O.; Odindi, J. Deep learning-based national scale soil organic carbon mapping with Sentinel-3 data. Geoderma 2022, 411, 115695. [Google Scholar] [CrossRef]
  74. Kompała-Bąba, A.; Bierza, W.; Sierka, E.; Błońska, A.; Besenyei, L.; Woźniak, G. The role of plants and soil properties in the enzyme activities of substrates on hard coal mine spoil heaps. Sci. Rep. 2021, 11, 5155. [Google Scholar] [CrossRef]
  75. Stefanowicz, A.M.; Kapusta, P.; Błońska, A.; Kompała-Bąba, A.; Woźniak, G. Effects of Calamagrostis epigejos, Chamaenerion palustre and Tussilago farfara on nutrient availability and microbial activity in the surface layer of spoil heaps after hard coal mining. Ecol. Eng. 2015, 83, 328–337. [Google Scholar] [CrossRef]
  76. Borymski, S.; Cycoń, M.; Beckmann, M.; Mur, L.A.J.; Piotrowska-Seget, Z. Plant species and heavy metals affect biodiversity of microbial communities associated with metal-tolerant plants in metalliferous soils. Front. Microbiol. 2018, 9, 1425. [Google Scholar] [CrossRef] [Green Version]
  77. Pacwa-Płociniczak, M.; Płociniczak, T.; Yu, D.; Kurola, J.M.; Sinkkonen, A.; Piotrowska-Seget, Z.; Romantschuk, M. Effect of Silene vulgaris and heavy metal pollution on soil microbial diversity in long-term contaminated soil. Water. Air. Soil Pollut. 2018, 229, 13. [Google Scholar] [CrossRef] [Green Version]
  78. Kozdrój, J.; Van Elsas, J.D. Response of the bacterial community to root exudates in soil polluted with heavy metals assessed by molecular and cultural approaches. Soil Biol. Biochem. 2000, 32, 1405–1417. [Google Scholar] [CrossRef]
  79. Eisenhauer, N.; Milcu, A.; Sabais, A.C.W.; Bessler, H.; Brenner, J.; Engels, C.; Klarner, B.; Maraun, M.; Partsch, S.; Roscher, C.; et al. Plant diversity surpasses plant functional groups and plant productivity as driver of soil biota in the long term. PLoS One 2011, 6, e16055. [Google Scholar] [CrossRef] [Green Version]
  80. Zhang, C.B.; Ke, S.S.; Wang, J.; Ge, Y.; Chang, S.X.; Zhu, S.X.; Chang, J. Responses of microbial activity and community metabolic profiles to plant functional group diversity in a full-scale constructed wetland. Geoderma 2011, 160, 503–508. [Google Scholar] [CrossRef]
  81. Zhang, Y.; Peng, S.; Chen, X.; Chen, H.Y.H. Plant diversity increases the abundance and diversity of soil fauna: A meta-analysis. Geoderma 2022, 411, 115694. [Google Scholar] [CrossRef]
  82. Shafi, M.I.; Yarranton, G.A. Vegetational heterogeneity during a secondary (postfire) succession. Can. J. Bot. 1973, 51, 73–90. [Google Scholar] [CrossRef]
  83. Prach, K. Succession of vegetation on dumps from strip coal mining, N.W. Bohemia, Czechoslovakia. Folia Geobot. Phytotaxon. 1987, 22, 339–354. [Google Scholar] [CrossRef]
  84. Prach, K. Spontaneous Succession in Central-European man-made habitats: What information can be used in restoration practice. In Applied Vegetation Science; John Wiley & Sons, Ltd.: Hoboken, NJ, USA, 2003; Volume 6, pp. 125–129. [Google Scholar]
  85. Horn, H.S.; MacArthur, R.H. Competition among fugitive species in a harlequin environment. Ecology 1972, 53, 749–752. [Google Scholar] [CrossRef]
  86. Horn, H.S. The ecology of secondary succession. Annu. Rev. Ecol. Syst. 1974, 5, 25–37. [Google Scholar] [CrossRef]
  87. Baldrian, P.; Trögl, J.; Frouz, J.; Šnajdr, J.; Valášková, V.; Merhautová, V.; Cajthaml, T.; Herinková, J. Enzyme activities and microbial biomass in topsoil layer during spontaneous succession in spoil heaps after brown coal mining. Soil Biol. Biochem. 2008, 40, 2107–2115. [Google Scholar] [CrossRef]
  88. Józefowska, A.; Pietrzykowski, M.; Woś, B.; Cajthaml, T.; Frouz, J. The effects of tree species and substrate on carbon sequestration and chemical and biological properties in reforested post-mining soils. Geoderma 2017, 292, 9–16. [Google Scholar] [CrossRef]
  89. Mastrogianni, A.; Papatheodorou, E.M.; Monokrousos, N.; Menkissoglu-Spiroudi, U.; Stamou, G.P. Reclamation of lignite mine areas with Triticum aestivum: The dynamics of soil functions and microbial communities. Appl. Soil Ecol. 2014, 80, 51–59. [Google Scholar] [CrossRef]
  90. Frostegård, Å.; Tunlid, A.; Bååth, E. Use and misuse of PLFA measurements in soils. Soil Biol. Biochem. 2011, 43, 1621–1625. [Google Scholar] [CrossRef]
  91. Zhang, B.; Li, Y.; Ren, T.; Tian, Z.; Wang, G.; He, X.; Tian, C. Short-term effect of tillage and crop rotation on microbial community structure and enzyme activities of a clay loam soil. Biol. Fertil. Soils 2014, 50, 1077–1085. [Google Scholar] [CrossRef]
  92. Muhammad, N.; Dai, Z.; Xiao, K.; Meng, J.; Brookes, P.C.; Liu, X.; Wang, H.; Wu, J.; Xu, J. Changes in microbial community structure due to biochars generated from different feedstocks and their relationships with soil chemical properties. Geoderma 2014, 226–227, 270–278. [Google Scholar] [CrossRef]
  93. Doran, J.W.; Parkin, T.B. Defining and assessing soil quality. In Defining Soil Quality for a Sustainable Environment; John Wiley & Sons, Ltd.: Hoboken, NJ, USA, 2015; pp. 3–21. ISBN 9780891189305. [Google Scholar]
  94. Handa, I.T.; Aerts, R.; Berendse, F.; Berg, M.P.; Bruder, A.; Butenschoen, O.; Chauvet, E.; Gessner, M.O.; Jabiol, J.; Makkonen, M.; et al. Consequences of biodiversity loss for litter decomposition across biomes. Nature 2014, 509, 218–221. [Google Scholar] [CrossRef] [Green Version]
  95. Liang, J.; Crowther, T.W.; Picard, N.; Wiser, S.; Zhou, M.; Alberti, G.; Schulze, E.D.; McGuire, A.D.; Bozzato, F.; Pretzsch, H.; et al. Positive biodiversity-productivity relationship predominant in global forests. Science 2016, 354, aaf8957. [Google Scholar] [CrossRef] [Green Version]
  96. Sitaula, B.K.; Bakken, L.R.; Abrahamsen, G. N-fertilization and soil acidification effects on N2O and CO2 emission from temperate pine forest soil. Soil Biol. Biochem. 1995, 27, 1401–1408. [Google Scholar] [CrossRef]
Figure 1. Diagram showing the selection procedure for the 15 studied plots. Abbreviations: HH—high taxonomical and functional diversity; HL—high taxonomical and low functional diversity; LH—low taxonomical and high functional diversity; LL—low taxonomical and functional diversity; R—reclaimed plots.
Sustainability 15 04880 g001
Figure 2. Principal Components Analysis of soil variables: contribution of studied soil parameters (a) and ordination of plots along the first two components (b). Abbreviations: HH—high taxonomical and functional diversity; HL—high taxonomical and low functional diversity; LH—low taxonomical and high functional diversity; LL—low taxonomical and functional diversity; R—reclaimed plots.
Sustainability 15 04880 g002
Figure 3. Comparison in PLFA biomass (nmol PLFA g−1 d.w.) parameters among levels of taxonomical and functional diversity (Kruskal–Wallis’s chi-squared test). The values (medians ± quartile range and dots showing outliers) with the same letter do not differ at p < 0.05. Abbreviations: HH—high taxonomical and functional diversity; HL—high taxonomical and low functional diversity; LH—low taxonomical and high functional diversity; LL—low taxonomical and functional diversity; R—reclaimed plots.
Sustainability 15 04880 g003
Figure 4. Comparison of soil respiration among levels of taxonomical and functional diversity (Kruskal–Wallis chi-squared test). The values (medians ± quartile range and dots showing outliers) with the same letter do not differ at p < 0.05. Abbreviations: HH—high taxonomical and functional diversity; HL—high taxonomical and low functional diversity; LH—low taxonomical and high functional diversity; LL—low taxonomical and functional diversity; R—reclaimed plots.
Sustainability 15 04880 g004
Figure 5. The RDA analysis showing relationships between PLFA and environmental variables (a,b), including four significant ones * p < 0.05, ** p < 0.01 based on a permutation test. (a) Biplot showing PFLA profiles and environmental factors; (b) biplot showing categories of plots and environmental factors. Abbreviations: HH—high taxonomical and functional diversity; HL—high taxonomical and low functional diversity; LH—low taxonomical and high functional diversity; LL—low taxonomical and functional diversity; R—reclaimed plots.
Sustainability 15 04880 g005
Figure 6. (a) The passive projection of explanatory variables onto NMDS ordination based on PLFAs showing only significant variables; (b) distance between centroids of the different categories of plots representing different combinations of taxonomic and functional diversity in multi-dimensional Euclidean space. Explanations: (1) HH—high taxonomical and functional diversity; (2) HL—high taxonomical and low functional diversity; (3) LH—low taxonomical and high functional diversity; (4) LL—low taxonomical and functional diversity; (5) R—reclaimed plots. H′—Shannon–Wiener index; D—Simpson dominance index; DS—Margalef diversity index; E—Evenness; G+, G−—Gram-positive or Gram-negative bacterial biomass; iso.anteiso—iso/anteiso nutrient stress marker; i15/a15, i15:0 + i17:0/a 15:0 + a17:0— nutrient stress marker; Resp—soil respiration; AMF—arbuscular mycorrhizal fungi biomass; Actin.—Actinomycetes biomass.
Sustainability 15 04880 g006
Figure 7. Venn diagram showing variance partitioning among microbial biomass. The used variables explained 44% of the variation.
Sustainability 15 04880 g007
Table 1. Taxonomical diversity (H′), functional diversity (FDis) and number of specimens in plots with different levels of plant taxonomic and functional diversity (mean  ±  SE). No statistical differences are marked by the same letter in the same row (p  <  0.05).
HFDisNumber of Specimens
HH1.76 ± 0.07 a0.34 ± 0.00 bc49.67 ± 6.94
HL1.53 ± 0.03 ab0.29 ± 0.00 b40.00 ± 5.29
LH1.12 ± 0.07 bc0.33 ± 0.01 ac33.00 ± 4.58
LL0.81 ± 0.09 c0.22 ± 0.03 b28.67 ± 3.53
R1.17 ± 0.03 bc0.46 ± 0.01 ac12.27 ± 6.62
Abbreviations: plots with HH—high taxonomical and functional diversity; HL—high taxonomic, low functional diversity; LH—low taxonomical and high functional diversity; LL—low taxonomic and functional diversity; R—reclaimed plots.
Table 2. Substrate parameters of plots with different levels of plant taxonomic and functional diversity (mean  ±  SE) (Kruskal–Wallis test followed by post-hoc Conover test). No statistical differences are marked by the same letter in the same row (p  <  0.05).
HHHLLHLLR
pH H2O7.51 ± 0.17 a6.86 ± 0.19 b6.38 ± 0.57 b5.06 ± 0.37 c6.31 ± 0.12 bc
pH KCl7.20 ± 0.18 a6.41 ± 0.19 b5.77 ± 0.56 b4.49 ± 0.44 c5.41 ± 0.12 c
EC (mS cm−1)0.62 ± 0.19 a0.70 ± 0.27 a0.32 ± 0.07 a0.33 ± 0.08 a0.21 ± 0.02 a
NT (%)0.33 ± 0.06 b0.47 ± 0.03 a0.37 ± 0.02 b0.39 ± 0.01 b0.21 ± 0.01 c
SOM (%)16.31 ± 3.18 b23.59 ± 0.92 a20.07 ± 1.14 ab19.46 ± 0.91 ab8.32 ± 0.82 c
Mg ava. (mg kg−1)223.33 ± 29.10 d337.5 ± 9.02 b370.42 ± 18.25 a300.39 ± 19.96 c367.83 ± 3.14 a
P ava. (mg kg−1)31.03 ± 8.64 a2.97 ± 069 c5.57 ± 0.62 b4.51 ± 1.89 bc24.33 ± 2.76 a
Na+ (mg kg−1)127.69 ± 6.94 bc132.36 ± 7.95 bc143.69 ± 7.22 b119.56 ± 3.65 c232.18 ± 20.71 a
K+(mg kg−1)158.31 ± 15.17 bc160.31 ± 5.38 bc182.8 ± 15.19 b144.13 ± 10.16 c227.24 ± 3.55 a
Moisture (%)12.49 ± 1.08 a6.56 ± 0.80 b8.03 ± 1.01 b8.72 ± 1.24 b7.99 ± 0.49 b
Abbreviations: plots with HH—high taxonomical and functional diversity; HL—high taxonomic, low functional diversity; LH—low taxonomical and high functional diversity; LL—low taxonomic and functional diversity; R—reclaimed plots.
Table 3. Distribution of phospholipid fatty acid (PLFA) ratios and diversity indices (mean  ±  SE) (Kruskal–Wallis test followed by post-hoc Conover test). No statistical differences are marked by the same letter on the same row (p  <  0.05).
HHHLLHLLR
G+/G−1.22 ± 0.18 a1.42 ± 0.20 a1.30 ± 0.21 a1.57 ± 0.27 a1.13 ± 0.03 a
B/F1.56 ± 0.08 a2.01 ± 0.25 a1.84 ± 0.13 a1.96 ± 0.19 a1.74 ± 0.05 a
Simpson dominance index (D)0.11 ± 0.00 a0.11 ± 0.01 a0.11 ± 0.01 a0.10 ± 0.00 a0.10 ± 0.00 a
Shannon-Wiener diversity index (H′)2.38 ± 0.03 a2.42 ± 0.04 a2.42 ± 0.03 a2.45 ± 0.02 a2.45 ± 0.01 a
Evenness (E)0.77 ± 0.02 a0.80 ± 0.02 a0.76 ± 0.02 a0.81 ± 0.02 a0.77 ± 0.01 a
Margalef richness index (DS)5.01 ± 0.70 a5.27 ± 0.75 a4.66 ± 0.30 a5.62 ± 0.86 a3.23 ± 0.03 b
i15:0 + i17:0/a15:0 + a17:00.62 ± 0.06 c0.68 ± 0.09 c0.88 ± 0.04 b0.75 ± 0.06 bc1.29 ± 0.03 a
iso/anteiso1.49 ± 0.05 c1.56 ± 0.10 c1.80 ± 0.05 b1.78 ± 0.10 b2.03 ± 0.03 a
Abbreviations: plots with HH—high taxonomical and functional diversity: HL—high taxonomic, low functional diversity; LH—low taxonomical and high functional diversity; LL—low taxonomic and functional diversity; R—reclaimed plots, G+/G−—biomass ratio of Gram-positive to Gram-negative bacteria; B/F—bacteria to fungi biomass ratio.
Disclaimer/Publisher’s Note: The statements, opinions and data contained in all publications are solely those of the individual author(s) and contributor(s) and not of MDPI and/or the editor(s). MDPI and/or the editor(s) disclaim responsibility for any injury to people or property resulting from any ideas, methods, instructions or products referred to in the content.

