Abstract
Based on the Doppler weather radar and surface observations, the key mesoscale systems and features of the rainstorm structure during the period of the extreme precipitation in Henan province on 20 July 2021 are investigated. The results show that a nearly meso-α-scale West Henan Low Vortex (WHLV) near the Songshan Mountain, a surface mesoscale front, a horizontal shear convergence line in the lower troposphere and two strong low-level jets (LLJs) were the main mesoscale systems that triggered the extreme precipitation process. Many mesoscale vortices including meso-β-γ-scale vortices (i.e., meso-vortices) were found within the WHLV. Hourly precipitation over 50 mm was mostly caused by the storms with meso-vortices. In the heaviest precipitation stage of the Zhengzhou Storm (ZZS), a clear meso-vortex above 2 km AGL was identified with the diameter of 15–20 km and the vorticity of 1.0–2.0 × 10⁻³ s−1, while its lifetime was about 2 h. The low-level ambient airflows converged into the storm from the north, east and south, forming a strong low-level convergence that promoted the development of the storm. Strong convergence and uplift occurred along the east edge of the storm, while the strong easterly LLJ converged with the shallow outflow of the storm. The strongest updraft under 2 km AGL occurred at the northeast end of the storm when a short-lived meso-γ-scale vortex formed at that area. Both the strong low-level convergence and the merge of the convective cells from the east resulted in the eastward propagation of the ZZS.
1. Introduction
Torrential precipitation events account for the majority of severe weather events in China, and have been studied extensively for several decades (e.g., [1,2,3]). The mesoscale cyclonic vortexes accompanied by weak low pressure systems with horizontal scales of 300–1000 km are responsible for a considerable part of heavy precipitation events in China [3]. These meso-α-scale vortex systems are often named according to the areas where they originate and/or affect, such as the southwest vortex that originates in Southwest China [4]. The extreme heavy rainfall events in North China on 21 July 2012 [5] and during the period of 19–20 July 2016 [6,7,8,9] were mainly influenced by this type of vortex system. The extreme heavy precipitation over North China on 21 July 2012 was directly associated with the vortex coming from the Hetao region, which was an eastward propagating vortex with a horizontal scale of 700–800 km [10]. In the Yangtze–Huai River basin, Meiyu torrential precipitation events are mostly affected by meso-α-scale vortices with scales of several hundred kilometers [11,12,13,14], and the vortices initiated in the lower reaches of the Yangtze River during Meiyu season are mostly triggered in mountainous areas with horizontal scales of around 100–400 km [15]. The southwest vortex is a cyclonic low-pressure system with a horizontal scale of 300–500 km. It is the dominant mesoscale weather system responsible for torrential rainfall events in Southwest China and part of East China [4,16,17].
Henan, a province located in Northern China, experienced extreme precipitation with record-breaking daily accumulated precipitation at 20 national weather stations from 19 to 21 July 2021 [18]. Total precipitation at Zhengzhou meteorological station reached 645.6 mm from 0400 LST July 20 to 0400 LST July 21, and record-breaking hourly precipitation of 201.9 mm occurred during the period of 1600–1700 LST July 20 [19]. This extreme heavy precipitation event in Henan province caused 398 deaths and severe property damage. Many scientists have attempted to reveal the causes of the extreme heavy rainfall event from different perspectives (e.g., [18,19,20,21,22,23,24]). Similar to the August 1975 extreme precipitation event in Henan province [25], the July 2021 extreme heavy rainfall event occurred under the background of strong Western Pacific Subtropical High (WPSH), which extended as far north as 30° N, and abundant moisture was transported by the strong easterly low-level jet (LLJ) between the south of the WPSH and Typhoon In-Fa (No. 2106).
Reference [18] partially explained the extremeness of the July 2021 precipitation in Henan province through large-scale circulation analysis, pointing out that mesoscale vortices were the common circulation characteristics of such extreme events and mesoscale dynamic processes might have contributed significantly to the precipitation of such an intensity. Reference [19] indicated that there was a vortex located in the levels below 700 hPa in the western part of Henan province during the period from 17 to 21 July based on sounding data, and named it the Western Henan Low-Pressure Vortex (hereafter WHLV). Reference [19] pointed out that whether the record-breaking extreme precipitation at Zhengzhou weather station was associated with the WHLV remained unclear. The closed low pressure disappeared at 2000 LST 19 July and 2000 LST 20 July, which showed that the WHLV was not a strong and persistent vortex. Based on high-resolution simulation, [23] showed a persistent mesoscale cyclonic vortex that maintained from the morning of 19 July to the night of 20 July, while convection was triggered by convergence over the east-to-northeast of the vortex and the sufficient moisture supply was associated with the vortex. Therefore, it is necessary to analyze in detail the basic observational facts to reveal whether there existed mesoscale vortices and how they facilitate the extreme rainfall in Henan province. Furthermore, observations of other important mesoscale systems that affected the extreme heavy rainfall event in Henan province have not been well-investigated in previous studies, and thus more detailed analysis is also required.
Reference [26] proposed four key components of heavy precipitation, i.e., strong updraft, abundant moisture supply, high precipitation efficiency and long duration of high rainfall rate, and the long-lasting strong updraft is the most critical one. Reference [26] is the first study to point out that supercell is also a heavy-rain-producing storm type based on its tendency to have intense updrafts. Since then, the impact of supercells and/or mesoscale vortices embedded in convective systems on heavy precipitation has been emphasized [27,28,29,30,31]. The vertical pressure gradient force generated by the low pressure perturbation that is caused by a mesocyclone favors the maintenance of stable and strong updrafts, and meso-γ-scale vortices (i.e., meso-vortices) may also have similar effects. Some meso-vortices associated with extreme hourly precipitation in South China have been investigated [32,33,34,35]. The results suggest that the release of condensational latent heat induced by extreme rainfall could have contributed to the formation of meso-vortex [32,34]. Reference [23] illustrated a simulated well-organized meso-γ-scale vortex that was obvious in the planetary boundary layer during the Zhengzhou extreme rainfall event; yet, it has not been verified by observations.
The objective of this study is to reveal the mesoscale forcing and the features of the rainstorm structure in Henan province during the period of 0200–2000 LST 20 July 2021. Based on high-resolution radar and surface observations, the WHLV and surface mesoscale front are analyzed first and their impacts on the heavy precipitation are briefly presented. The meso-vortices embedded in the WHLV, which measured a few kilometers to dozens of kilometers in diameter and were likely responsible for intense hourly rainfall, are then described by radar observations. Finally, the mesoscale vortices and other structures of the Zhengzhou Storm (ZZS) that were conducive to strong updrafts and long duration of the storm are investigated using observations of two dual-polarization Doppler weather radars. Conclusions and discussion are presented in Section 6.
2. Data and Methodology
2.1. Surface Data
Surface 3-h observations including sea-level pressure, temperature at 2 m AGL, speed and direction of surface wind at 10 m AGL and hourly rainfall are provided by the National Meteorological Information Center (NMIC) of the China Meteorological Administration (CMA) (https://data.cma.cn/data/cdcdetail/dataCode/A.0012.0001.html (accessed on 1 August 2021)). Strict quality control has been performed to ensure the accuracy of these data.
Sea-level pressure, surface wind and temperature are interpolated to 0.01° × 0.01° grids and the gridded dataset is used in Section 3.1. Hourly precipitation collected at weather stations in the study region are accumulated to produce 6-hourly precipitation at 0800 LST and 1400 LST and 3-hourly precipitation at 1700 LST respectively. Additionally, data collected by three rain gauges with temporal resolution of 1-min and a minimum detection threshold of 0.1 mm are used to obtain the relationship between 1-min rainfall rate and the vortex intensity during the ZZS.
2.2. Doppler Radar Data
Raw radar data are provided by the NMIC of CMA. Observations of two polarimetric Doppler weather radars are employed in the present study to examine characteristics, structures and evolution of mesoscale convective systems and vortexes that had different scales, including the meso-α-scale vortex in the mountainous area in the west of Henan province and meso-β-scale vortexes embedded in the convective storm. The two radars in Zhengzhou and Luoyang are both S-band Doppler radars with a 10-cm wavelength. They are operated by CMA in the volume coverage pattern 21 mode that consists of nine elevations (i.e., 0.5, 1.5, 2.4, 3.3,4.3, 6.1 9.9, 14.6, and 19.6) with a volumetric update time of 6 min. The radar sites are marked with pentagons in all the figures in this study.
Three dimensional winds including horizontal and vertical winds are retrieved from the radar radial velocity observations using the software package PyDDA (A Pythonic Direct Data Assimilation Framework for Wind Retrievals) [36]. The wind data are at 6-min intervals with horizontal resolution of 1 km and vertical resolution of 200 m. The PyDDA software [36] has been encapsulated in Python language. It is able to assimilate radial velocity data from any number of radar sites and other sources of wind data. Basic quality control procedures are also conducted via PyDDA.
The key of the wind field retrieval method is to directly assimilate dual Doppler weather radar velocity data using a three-dimensional variational technique [37]. This technique is not only insensitive to boundary conditions and contaminated data, but also can be used for wind field retrieval in single radar coverage area. It can also improve the retrieval preciseness of vertical velocity by adding the inelastic vertical vorticity equation constraint [38].
3. Western Henan Low-Pressure Vortex
3.1. Surface Analysis
From 2000 LST 19 to 2000 LST 20 July 2021, Henan province was under the control of a low sea level pressure system with pressure increasing poleward, which is known as an inverted-trough in surface level (Figure 1, denoted with thick dark blue contours). From 0800 to 1700 LST 20 July 2021, the surface low pressure system moved eastward and also extended northward as a whole, while Zhengzhou city was situated in the northeastern part of the low pressure system. The low pressure center was located in the mountainous area of western Henan (marked by red “D” in Figure 1a–c). At 0800 LST, it was located in the north of the Songxian station (marked by “SX” in Figure 1a), and it moved about 40 km to the northeast during the period of 0800–1400 LST when the cyclonic convergence airflow was the most significant at the center of the low during this period. A closed isobaric contour at 1-hPa intervals could be found, and the maximum vorticity value was above 30 × 10−5 s−1 near the low pressure center at 0800 LST (Figure 1a, light magenta shadings and magenta solid lines in Figure 1). It is worth noting that there were several large positive vorticity centers with values of 20–30 × 10−5 s−1 in the east sector of the inverted trough during the period of 0800–1400 LST, indicating that heavy rainfall in Henan province mostly occurred with relatively high vorticity at the surface. Conventionally, to identify an extratropical cyclone, at least one closed contour at 2.5-hPa intervals of sea level pressure should be found on the surface chart accompanied with warm front and cold front ([39], Page 109); therefore, the low-pressure system shown in Figure 1 does not meet the criteria of extratropical cyclone, and thus it is called the WHLV in this study following [19].
The airflows with cyclonic rotation converged towards the center of the WHLV, leading to significant convergence in the surface (Figure 2, light blue shadings). Figure 2a shows that there were clear convergence centers located near both the center of the WHLV and at the east slopes of the Funiu Mountain (hereafter MFN, marked by “MFN” in Figure 1 and Figure 2) and the Songshan Mountain (hereafter MSS, marked by “MSS” in Figure 1 and Figure 2) at 0800 LST. The convergence at the east slope of the mountains was even stronger than that in the center of the WHLV with the divergence below −30 × 10−5 s−1 (purple contours in Figure 2a). The center of low-vortex moved eastward to the lower terrain between MFN and MSS at 1400 LST, when a very strong convergence center with minima below −40 × 10−5 s−1 formed (Figure 2b) due to the merge of the two convergence centers that were initially observed at the vortex center and the eastern slope of MFN, respectively, at 0800 LST (Figure 2a). Another significant convergence area was found in the east of MSS at 1400 LST. It was observed in the eastern slope of MSS at 0800 LST and moved westward later. The convergence intensified significantly and the high convergence area enlarged at 1400 LST.
The 6 h accumulated torrential precipitation that exceeded 50 mm during 0200–0800 LST (dots with different colors and sizes in Figure 1a and Figure 2a) was concentrated in the eastern slope of MFN and in the east part of MSS due to the remarkable convergence; yet, the intense precipitation of more than 200 mm only occurred near the low pressure center. During the period from 0800 to 1400 LST, the extreme heavy precipitation occurred in the east and north of MSS, where 6-h rainfall greater than 200 mm occurred at 11 stations (red dots in Figure 1b and Figure 2b). In addition, 6-h rainfall over 100 mm was observed in several stations near the center of the WHLV and on the southern slope of MSS, marked with yellow dots in Figure 1b and Figure 2b.
The streamlines show that the vortex in the mountainous area was replaced with a wind shear line accompanied by convergence between northerlies and southerlies during 1400–1700 LST (Figure 1b,c). At the same time, the sea level pressure in the southwest of Zhengzhou city was below 1005.5 hPa, while the pressure in the north of Zhengzhou was above 1007.5 hPa (Figure 1b,c). This suggests that there was an evident pressure gradient, which was the reason why the northerly wind intensified. Zhengzhou was located in the significant convergence area where northerly and southerly winds converged, and it was also in the relatively dense isotherm zone (solid red line in Figure 2b,c), i.e., in the weak quasi-stationary front zone.
The WHLV was located in the mountainous area of western Henan province; therefore, the northeastern part of Luoyang (between GY and MJ in Figure 1) was between the high pressure of WPSH and the low pressure of WHLV, and is located in the valley between Shanxi Plateau and MSS. Air flows were forced to accelerate through the valley. With the strong pressure gradient and orographically induced acceleration, the northeasterly LLJ formed.
Looking at pressure at 1700 LST (Figure 1c), it is found that the air pressure slightly increased in the northern part of MSS and the Zhengzhou region, where the precipitation had been the heaviest. Thereby, two meso-high systems (marked with blue “H” in Figure 1c) occurred on the north end of the surface inverted trough. The WHLV was not obvious on the surface pressure field at 1700 LST due to the existence of the meso-high in MSS area. At that time, the area near Zhengzhou was controlled by another meso-high (Figure 1c) and the pressure increased by 1–2 hPa, reaching 1007 hPa. The pressure increase was accompanied by extreme heavy precipitation (red and purple dots in Figure 1c). Meanwhile, the sea level pressure around Zhongmu station (marked with “ZM” in Figure 1) decreased, forming a mesoscale warm depression with the lowest pressure of 1004.5-hPa. The Zhengzhou meso-high and the Zhongmu meso-low caused obvious pressure gradient. As shown in the radar radial velocity image in Section 5.3, a shallow westerly outflow was generated by the pressure gradient force.
Persistent heavy rainfall in the north of Henan resulted in a relatively cold area. At 0800 LST, the surface air temperature near Zhengzhou was 24–25 °C, and there were no dense isotherms (Figure 2a). From 0800 to 1400 LST, the temperature dropped by 2 °C; and by 1400 LST, the temperature along the southern slope of Shanxi Plateau was between 22 °C and 23 °C, while the temperature over the almost-no-precipitation area in the south of Zhengzhou was higher than 26 °C (Figure 2b). In other words, the surface temperature to the north of Zhengzhou decreased slightly, while the temperature to its south increased significantly, forming a dense isotherm zone near Zhengzhou where a surface mesoscale front formed mainly due to the weak cold pool of heavy precipitation and radiation difference. The kinematics of frontogenesis diagnosed from ERA5 data [40] showed that the convergence of airflows in the lower troposphere played an important role in the frontogenesis [41]; thus, the significant convergent surface flow also contributed to frontogenesis apart from the cold pool and radiation difference. The mesoscale front was significant in the equivalent potential temperature field in the surface at 1400 LST (Figure 7a–d of [23]). During the time period from 1400 to 1700 LST, when the most intense hourly precipitation occurred, Zhengzhou was located right in the mesoscale front zone (Figure 2b,c).
Reference [19] also showed a cyclonic circulation below 700 hPa that measured 200 km in diameter in the upper-air observation chart. It was situated in the western mountainous area of Henan province from 0800 to 1400 LST 20 July. Its lifetime and covering area were essentially consistent with those of the WHLV obtained through the surface analysis as presented above.
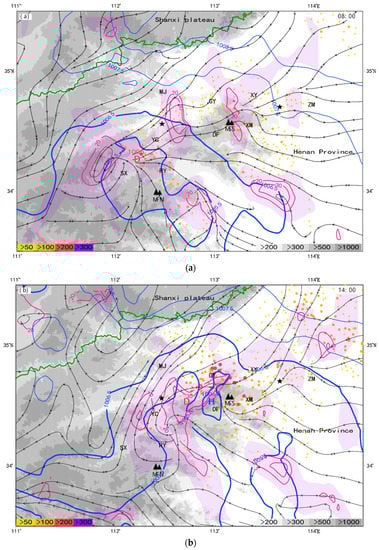
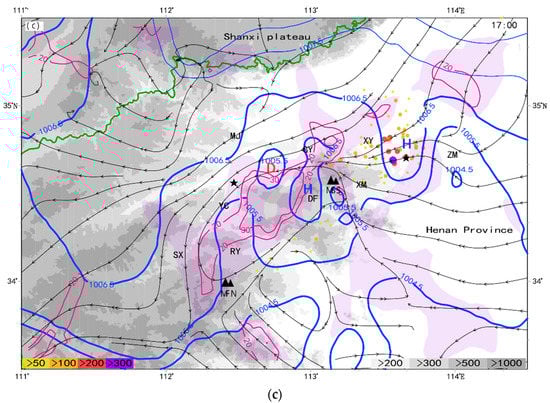
Figure 1.
Sea level pressure (dark blue contours, unit: hPa) and surface vertical vorticity (light magenta shadings for vorticity above 10 × 10−5 s−1, while magenta solid contours are at 10 × 10−5 s−1 intervals beginning at 2.0 × 10⁻⁵ s−1) superimposed on surface streamlines (black lines with arrows) at 0800 (a), 1400 (b) and 1700 (c) LST 20 July 2021. Red letter “D” refers to low-pressure center, and solid dots of different colors and sizes represent 6-h accumulated precipitation (a,b) and 3-h accumulated precipitation (c), yellow, orange, red and purple dots indicate 50 mm, 100 mm, 200 mm, and above 300 mm, respectively (color legend is in the lower left corner). The gray shadings from light to dark are for the terrain height, indicating 200 m, 300 m, 500 m, and above 1000 m, respectively. The two black pentagram on the left and right represent the locations of Luoyang and Zhengzhou radar sites, respectively. Surface meteorological stations are denoted as follows: SX is for Songxian station, RY for Ruyang station, MJ for Mengjin station, YC for Yichuan station, GY for Gongyi station, DF for Dengfeng station, XM for Xinmi station, and ZM for Zhongmou station. Mountains are marked with two black triangles, MSS for the Songshan Mountain, and MFN for the Funiu Mountain. The heavy green solid line indicates the provincial boundary between Shanxi and Henan. Radar sites, surface meteorological stations, mountains and provincial boundaries in figures of this article are all signed in the same way as Figure 1.
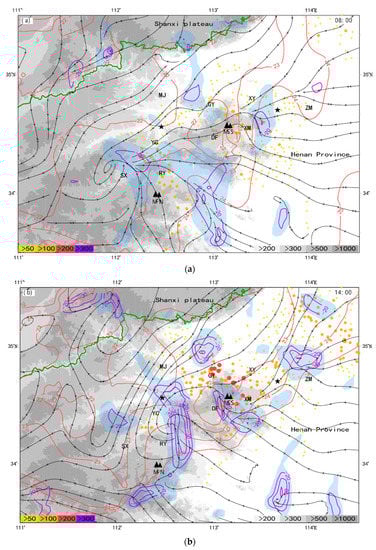
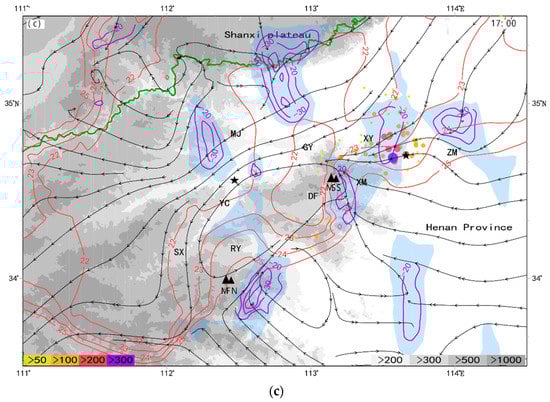
Figure 2.
Air temperature (red solid lines, unit: °C) and divergence (light blue shadings for divergence below −10 × 10−5 s−1, while purple solid contours are at 10 × 10−5 s−1 intervals starting from 20.0 × 10⁻⁵ s−1) at 0800 (a), 1400 (b) and 1700 (c) LST 20 July 2021 in the surface. All other symbols are the same as in Figure 1.
3.2. Evolution of the WHLV from Radar Observations
3.2.1. Spiral Rain Bands of the WHLV
From 0300 LST to 1300 LST 20 July 2021, the WHLV moved northeastward, and torrential precipitation occurred near the vortex center and in the areas of spiral strong reflectivity bands (Figure 3). At 0300 LST, the main reflectivity band was in the south side of the WHLV, rotating with the vortex and shifting from the south side of the vortex to the east side (Figure 3a1–c1). By 0930 LST, it arrived at the southern slope of MSS (Figure 3d1), where torrential rain was produced (gray and purple triangles in Figure 3). The second significant convective rain band developed in the northeast side of the WHLV at around 0800 LST (Figure 3c1) and evolved into a spiral band with high reflectivity at 0930 LST (Figure 3d1). The above two bands merged into a broad and strong convective system that appeared in the northeast of the WHLV at 1030 LST (Figure 3e1), bringing heavy rain to the northern slope of MSS, since it was maintained for more than four hours there. The 6-h precipitation exceeding 100 mm was observed from 0200 LST to 0800 LST in the mountainous area and its northeastern slope (orange dots in Figure 1a). Moreover, the 6-h precipitation at Gongyi station exceeded 200 mm at 1400 LST (red dots in Figure 1b), and nine stations near Gongyi and Yanshi in the northern part of MSS recorded intense precipitation of more than 50 mm h−1 from 1100 LST to 1200 LST (the purple triangles in Figure 3g1). The third band was a weak convective band initiated in the southwestern part of the WHLV at 0800 LST (Figure 3c1). It rotated with the vortex and developed into a strong quasi-linear convective system in the south of the WHLV after 1130 LST (Figure 3f1–h1). The fourth spiral reflectivity band was a narrow convective band lying directly in the north of the vortex at 1100 LST (Figure 3f1). It shifted westward and weakened in two hours (Figure 3f1–h1). The above four convective echo bands tended to converge and rotate into a center near Yinchen station (denoted by “YC” in Figure 3). Similar to the spiral rain bands of a tropical cyclone, the spiral bands rotated to the WHLV center, which moved toward the northeast slowly. According to the scales of these spiral bands, the diameter of the mesoscale WHLV is estimated to be about 200 km.
3.2.2. Cyclonic Rotating Flow and Low-Level Jet
At 0300 LST 20 July, the left-lower part of the radial velocity image of Luoyang radar (Figure 3a1) showed that the outbound and inbound maximum radial velocities were above 17 m s−1 on each side of the zero isodop (zero-velocity line), which was distributed in a pattern of identical to the Chinese word for “eight” (similar to an inverted “V”). This reveals that the airflows over the area to the southwest of Luoyang radar were cyclonically curved, and this was confirmed by the retrieved winds that shifted from southeasterlies to northeasterlies. The rotational wind pattern maintained until 1300 LST and the radial velocity weakened with time.
The most remarkable feature shown on the radial velocity images of Luoyang radar was the northeasterly LLJ (Figure 3), and the LLJ streak was lower than 1 km AGL. Note that this significant northeasterly airflow at the lower levels already existed at 0200 LST (figure not shown), and the LLJ was gradually thickening and strengthening with time (Figure 3a2–h2). The LLJ speed reached 14 m s−1 at the height of 0.2 km AGL, while the depth of the northeasterly winds greater than 12 m s−1 was 0.6 km at 0400 LST (Figure 4). The LLJ speed reached 27 m s−1 and the northeasterly winds larger than 12 m s−1 reached 1.8 km AGL at 1300 LST (Figure 4). The strong northerly LLJ played an essential role in the WHLV and its associated mesoscale systems. The effects of the LLJ are presented from the following three perspectives.
First, the most important factor was the LLJ’s contribution to the development and maintenance of the strong reflectivity bands located at the northeast foothill of MSS. On the one hand, the northerly airflow was forced to rise on the northern slope of the mountain, leading to a convergent uplift. The convergence center near Gongyi station on the northern slope of the mountain was also significant on the surface charts at 0800 LST and1400 LST (purple contours near the “GY” mark in Figure 2a,b). On the other hand, the convergence of the relatively cold northerly airflow and the warm southerly airflow strengthened the stationary mesoscale front, which extended from the eastern part of MSS to the east of Zhengzhou and was characterized by dense isotherms in the surface chart (Figure 2c).
Second, the LLJ initiated new spiral convective bands. As the northeasterlies strengthened, they collided with the southerlies on the southwest side of Luoyang radar site, where the terrain height was lower than that in the eastern part of MSS. The radial velocity image at 0800 LST showed that a discontinuous radial velocity line formed between inbound velocities and outbound velocities, and a weak convective echo line was then triggered by the convergence at the leading edge of the northeasterlies (Figure 3c1,c2). This was the initiation of the third convective band of the WHLV.
Third, the southeast boundary of the northeasterly LLJ extended southeastward with time and the farthest extensions were about 50 km towards the southeast and 30 km towards the south from 1200 LST to 1600 LST (Figure 5). At 1600 LST, most areas of MSS were controlled by the northeasterly airflow (Figure 5d). The northeasterly airflow that extended to the southeast can also be seen from the surface streamlines at 1700 LST, when a weak mesoscale high pressure formed in the MSS region (Figure 1c). After 1400 LST, the WHLV, including the low vortex center, was gradually controlled by the northeasterly cold airflow below 2 km AGL (Figure 5d); thus, the convective echoes in the WHLV almost dissipated (Figure 5c). As the northeasterly airflow thickened, strengthened and extended to the southeast, the lower layer of the WHLV was cut off as a whole by the northeasterly LLJ. Therefore, the WHLV gradually dissipated due to the LLJ effect. The only residual convective echo of the WHLV was the third convective echo band which extended from south of MSS to east of MFN at 1600 LST (Figure 5c). This echo band moved towards the southeast and strengthened, and its northern part gradually approached the severe storm that caused the extreme heavy precipitation in Zhengzhou (Figure 5b).
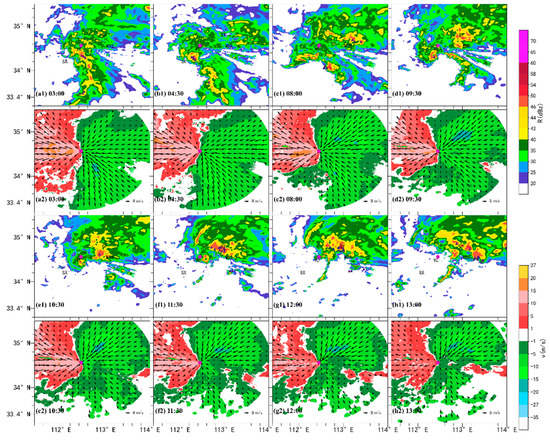
Figure 3.
Reflectivity (a1–h1) and radial velocity overlaid with retrieved winds (a2–h2) at 1.1 km AGL from Luoyang S-band Doppler weather radar at 0300 (a1,a2), 0430 (b1,b2), 0800 (c1,c2), 0930 (d1,d2), 1030 (e1,e2), 1130 (f1,f2), 1200 (g1,g2), 1300 (h1,h2) LST 20 July 2021. The arrows indicate winds. The purple dot denotes Luoyang radar site, and the purple triangles mark stations with hourly rainfall exceeding 50 mm.

Figure 4.
Maximum wind speed of the northeasterly LLJ (a) and the height of the LLJ (b) from 0200 to 1600 LST 20 July 2021. The blue curve in Figure b shows the maximum wind speed height, and the orange curve is the upper boundary (height of radar radial velocity of 12 m s−1) height.
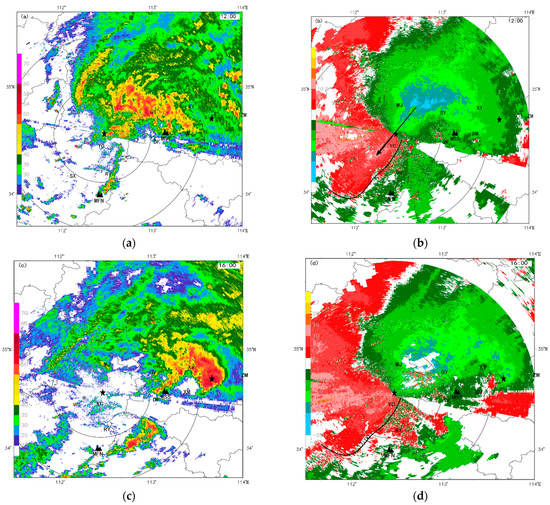
Figure 5.
Reflectivity (a,c) and radial velocity (b,d) at 0.5° elevation from Zhengzhou S-band Doppler weather radar at 1200 LST (a,b) and 1600 LST (c,d) 20 July 2021. The black arrow marks the northeasterly LLJ (b), the black thin solid line marks the east edge of the LLJ boundary at 1200 LST. The black pentagram mark the radar site, black double triangles and capital letters sign mountains and surface meteorological stations respectively.
4. Meso-Vortices That Caused Extreme Heavy Precipitation
As shown in Figure 6, most of high-reflectivity convective cells were accompanied by a mesoscale vortex, which was represented by a vorticity center (purple contours) and heavy precipitation (marked by purple triangles). The storm located between YC and SX showed a spiral-rotating distribution of reflectivity (Figure 6a) and its vertical maximum vorticity was above 15 × 10−4 s−1 (Figure 6b) at 0500 LST. The corresponding radar radial velocity images show a rotational velocity couplet (Figure 6b) composed of relatively large radial velocity centers toward and away from the radar site with the velocity difference of 25 m s−1, which reached the threshold of mesocyclone. The diameter of the velocity couplet was about 20 km, larger than that of a mesocyclone. Four stations near the rotational storm recorded heavy precipitation of more than 50 mm h−1 at 0500 LST (marked by purple triangles in Figure 6a). This storm was near the shear convergence line between the southerlies and the northerlies and located at the center of the WHLV (Figure 6b). Another storm with the reflectivity exceeding 45 dBZ and the maximum vorticity above 15 × 10−4 s−1 developed to the south of RY (Figure 6a,b, the first RY storm) at the same time. Thirty minutes later, the maximum vorticity increased to 20 × 10−4 s−1 and the storm brought precipitation of more than 50 mm h−1 at four stations at 0600 LST (Figure 6c,d). The first RY storm moved northwestward and it was located right on the shear and convergent line between the southwesterlies and the northeasterlies at 0612 LST (Figure 6e,f). The reflectivity image shows an arch-shaped pattern in the rotational flow (Figure 6e), which was demonstrated by the significant vorticity center and radial velocity couplet (Figure 6f). This rotational rain storm lasted more than two hours.
Two new convective cells with meso-vortices were initiated to the south of RY at 0612 LST (Figure 6e). The two storms near RY initiated and grew in the spiral rain bands of the WHLV. At 0730 LST, these two meso-vortex storms merged into a severe one with high reflectivity and large vorticity near RY (Figure 6g), and it was the second severe rainstorm near RY. This RY storm showed a convergent rotation structure at 1.5° elevation angle and the velocity difference was 25 m s−1 at 0730 LST (Figure 6h). After that, it moved northeastward with the WHLV spiral bands and brought precipitation of above 50 mm h−1 at three stations.
The horizontal scales of these rotational storms were 10–40 km, and the diameters of the vortex couplets were 10–30 km, which were larger than that of a mesocyclone, yet the rotational speed was equivalent to that of a mesocyclone. The reflectivity values of the storms with meso-vortices were obviously higher than those of other storms around the WLHV. The meso-vortices moved slowly and the storm lasted more than one hour. Extreme heavy precipitation of more than 50 mm h−1 was produced by these rotational storms near the WHLV center or embedded in the spiral bands around the WHLV. In addition, some storms with a meso-vortex lasted for more than two hours, resulting in accumulated precipitation of more than 100 mm.
There were also some meso-vortices detected by the Zhengzhou Doppler weather radar. Figure 7 shows four convective storms with meso-vortices located to the south and east of the Zhengzhou radar site at 1148 LST 20 July 2021. The reflectivity was above 50 dBZ, accompanied by vertical vorticity maxima. The white boxes in Figure 7b denote four radial velocity couplets of rotation with diameters (distance between inbound and outbound maxima in radial velocity field) of less than 10 km. It should be noted that these meso-vortices were asymmetric with inbound velocities significantly greater than the outbound because the environmental southerlies were stronger; in addition, the southwest vortex couplet showed two inbound velocity centers, with a maximum center of 21 m s−1 and a minimum center of 5 m s−1.
The two meso-vortices located to east of the Zhengzhou radar site can be treated as mesocyclones based on their scale and intensity. The southeastern vortex with the maximum velocity difference of 33 m s−1 and a diameter of 5.5 km was a mesocyclone of medium intensity, while the northeastern one that had the maximum speed difference of 26 m s−1 and a diameter of 2.8 km was a weak mesocyclone (Figure 7b). The former produced intense precipitation of about 70 mm h−1 that lasted for 2 h. Yet, the area of heavy precipitation above 50 mm h−1 measured less than 50 km2. The maximum vertical vorticity of these two vortexes was 20 × 10−4 s−1.
However, the two meso-vortices located to the southwest of the Zhengzhou radar site with radial velocity differences of 14–19 m s−1(Figure 7b) did not meet the threshold of mesocyclone; nevertheless, they also caused heavy precipitation that exceeded 50 mm h−1 (purple triangles in Figure 7a). In the next section, we will demonstrate that the two convective storms with meso-vortices merged and formed a new convective storm that produced the extreme heavy precipitation of more than 200 mm h−1 in Zhengzhou, which is known as the ZZS.
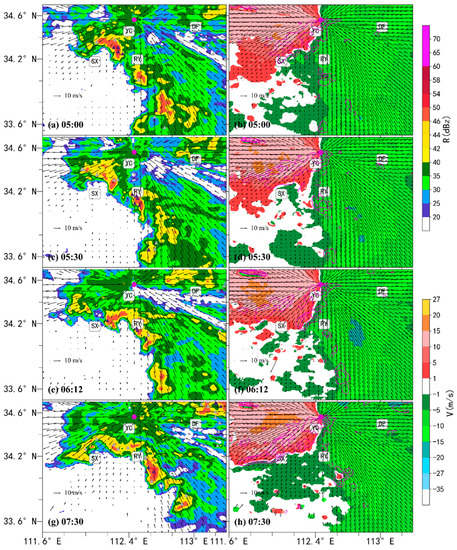
Figure 6.
Radar reflectivity (a,c,e,g) and radial velocity (b,d,f,h) at 1.1 km AGL from Luoyang Doppler weather radar on 20 July 2021 at 0500 LST (a,b), 0530 LST (c,d), 0612 LST (e,f), 0730 LST (g,h). The gray and purple triangles mark stations with hourly rainfall exceeding 30 mm and 50 mm, respectively. The horizontal wind vectors retrieved from Luoyang radar at the same height (the black arrows) are superimposed. Purple contours are the maximum vorticity under 6 km AGL at 10 × 10−4 s−1 intervals starting from 5 × 10⁻⁴ s−1.
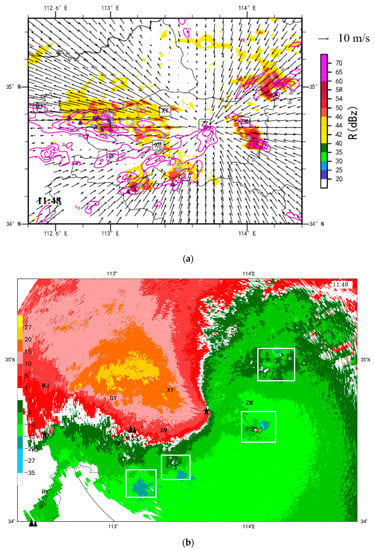
Figure 7.
Reflectivity (shadings, <40 dBZ omitted) and retrieved winds at 0.2 km AGL from Zhengzhou radar (a) and radial velocity at 1.5° elevation (b) from Zhengzhou radar at 1148 LST 20 July 2021. In Figure (a), the purple contours are for vertical maximum vorticity at 5 × 10⁻⁴ s−1 intervals starting from 5 × 10⁻⁴ s−1; triangles denote hourly rainfall (gray ≥ 30 mm and purple 50 ≥ mm). In Figure (b), white boxes mark meso-vortices. The black pentagram marks the radar site.
5. The Zhengzhou Storm
5.1. Formation of the Zhengzhou Storm
As presented above, the ZZS was formed by the merge of two convective storms with meso-vortices. Before merging to form the ZZS, the two storms with low-level meso-vortices were located in the east side of the WHLV and the south end of the northwest-southeast spiral rain band of the WHLV (Figure 7), respectively. The two convective storms developed in the southwesterly environmental airflow at 1148 LST, moved towards the northeast (Figure 8a) and were about to enter the convergence area of northeasterlies and southwesterlies. The storm in the east entered the shear convergence area at 1200 LST earlier than the one in the west, and showed an obvious cyclonic rotation feature (Figure 8b). The storm in the east then slowed down and entered the northerly airflow on the north side of the shear line during 1200–1230 LST, when the one in the west was still located in the southerlies and moved towards the northeast (Figure 8b). Due to different moving directions and speeds, the two storms eventually merged (Figure 8c). From 1230 to 1300 LST, with the southwesterlies extending northward, the shear convergence line also moved northward. The northeasterlies changed to easterlies, and the merged storm moved northward, approaching Xinmi station by 1300 LST and the area of reflectivity above 45 dBZ enlarged (Figure 8d). This merged severe storm is the ZZS, and it was located on the shear convergence area. At that time, the ZZS caused severe precipitation of more than 50 mm at nine stations near Xinmi with the maximum hourly rainfall of 87 mm.
After 1300 LST, the ZZS slowly moved northeastward. At 1400 LST, the strongest echo appeared in the shear convergence area, which was the southern part of the storm, and there was a meso-γ-scale vortex (Figure 8e). The high reflectivity shifted to the east side of the storm at 1500 LST, and the southern part of the storm was still in the shear convergence line (Figure 8f). At 1400 LST, another convective storm located to the southeast of the Zhengzhou radar site (ZZ) at 1230 LST started to move northeastward, and merged into the northern end of the ZZS at 1500 LST (Figure 8c–f). Following the merge and the development of the echoes near the shear convergence line on the south side of the storm, the ZZS changed from the east–west pattern at 1400 LST to the north–south pattern at 1500 LST (Figure 8e,f). As a result, most of the ZZS except its southern part was located in the southeasterlies after 1500 LST. As discussed above, the ZZS formed and developed in the mesoscale shear convergence line which was located at the east side of the WHLV, and the mesoscale line was likely to provide the vorticity background for the formation and maintenance of the meso-vortex structure of the ZZS. In fact, the southern part of the ZZS kept developing near the horizontal shear line till 1700 LST. In short, the ZZS formed and developed in the WHLV.
During the development of the ZZS, convective storms merged into it from different directions repeatedly. Strong echoes in the spiral rain band of the WHLV continually merged into the ZZS from the north during its northeastward movement from 1200 to 1500 LST (Figure 8). Additionally, there were also other convective storms from the west and newborn convective storms from the south merging into the ZZS (Figure 8e,f). These merging processes were of great importance for the development and maintenance of the ZZS. The storms merged from the northern, southwestern and southern sides of the ZZS were all embedded in the WHLV circulation.
The east boundary of the ZZS extended about 10 km eastward from 1300 LST to 1500 LST (Figure 8d–f). The northern part of the storm, which had already reached the Zhengzhou station at 1500 LST, extended more significantly eastward as the result of merging with another storm to the northeast of Zhengzhou (Figure 8e,f). The causes of the eastward propagation of the storm are as follows: (1) The easterly LLJ steered the storm to propagate eastward; (2) the ZZS merged with other convective storms from east. The mesoscale system critical for the eastward propagation of the ZZS was most likely to be the easterly LLJ. The importance of the extremely strong easterly LLJ has been investigated extensively in studies of moisture advection and updraft forcing by MSS [41]. According to the radial velocity observations of the Zhengzhou radar, the LLJ below 1 km AGL was very significant at 1330 LST with the maximum wind speed reaching 18 m s−1. The LLJ shifted from southeasterlies to easterlies after 1500 LST, when the LLJ speed increased to 21 m s−1 at 1500 LST and the maximum of the LLJ was 25 m s−1 from the radar radial velocity observations. The height of the maximum LLJ speed descended from 1000 m to 400 m AGL from 1300 LST to 1500 LST, and thus became an ultra-low-level jet.
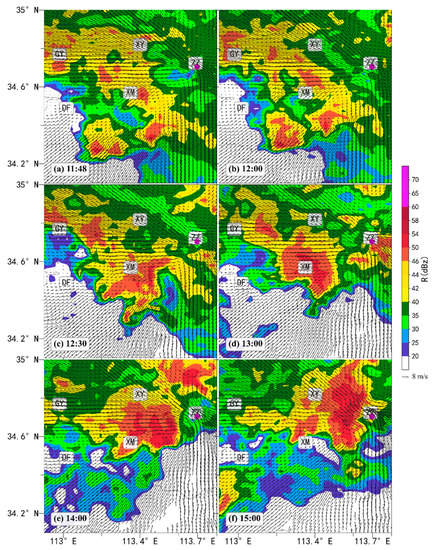
Figure 8.
Reflectivity (shaded, unit: dBZ) and retrieved wind vectors from Zhengzhou radar at 1 km AGL on 20 July 2021 at: 1148 LST (a), 1200 LST (b), 1230 LST (c), 1300 LST (d), 1400 LST (e), 1500 LST (f). The purple dot denotes the Zhengzhou radar site.
5.2. Meso-Vortex of the Zhengzhou Storm
In Figure 9, the dominant feature of the ZZS was the rotation on the south edge of the storm at 1630 LST, which was obvious in the retrieved wind field: the easterly winds were blowing towards the radar on the north side while the westerly winds were leaving the radar on the south side. In the corresponding vorticity field, there existed vorticity maxima at 2–6 km AGL in the southern part of the ZZS (purple contours in Figure 9), with the maximum vorticity of 20 × 10−4 s−1 at the height of 4 km AGL and high reflectivity (Figure 9b). Additionally, there was also significant convergence between westerlies and easterlies at the height of 2–4 km in the southern part of the storm (Figure 9b,c). The 2 km, 4 km and 6 km heights AGL correspond to 0.5–2.5° elevations of the Luoyang radar. In addition, a rotational velocity couplet can also be distinguished on the radial velocity image at 3.4° elevation of the Luoyang radar (about 8 km AGL, Figure omitted), showing that the vortex extended upward to at least 8 km AGL. At that time, the diameter of the vortex was about 16 km. The radial velocity differences of the vortexes were 26 m s−1 at 4 km AGL, 33 m s−1 at 6 km AGL and 23 m s−1 at 8 km AGL. As discussed above, there was a deep and strong meso-vortex in the ZZS (hereafter ZZSV), and the rotation was the most significant characteristic of the ZZS detected by the Luoyang radar. The Luoyang radar site is 110 km away from the Zhengzhou radar site; therefore, it was able to detect the ZZS structure above 2 km AGL very well.
The ZZSV lasted about 2 h during the period from 1536 LST to 1724 LST (red solid line in Figure 10). In fact, the vortex couplets were significant before 1536 LST. During its lifetime, the maximum radial velocity difference was 20–30 m s−1, which was comparable to that of mesocyclone. The vortex diameter was 15–20 km, larger than that of mesocyclone, and the corresponding vorticity value was 2–0–4.0 × 10⁻³ s−1. The maximum vorticity of 4.0 × 10⁻³ s−1 occurred at 1630 LST (Figure 10).
The ZZS caused not only the hourly extremely intense precipitation of 201.9 mm from 1600 LST to 1700 LST at Zhengzhou meteorological station (S1), but also extreme heavy precipitation in other regions within three hours. For example, hourly precipitation at S2 Station, 8 km southwest of S1, was 158 mm at 1600 LST, and hourly precipitation at S3 Station, 15 km northeast of S1, was 126.3 mm at 1800 LST (S1–S3 are marked in Figure 9). As is shown in Figure 10, with the slow movement of the ZZS, the three stations successively experienced extreme 1-min precipitation. The 1-min precipitation peak of 3.4 mm min−1 appeared at S2 station around 1530 LST, when the Luoyang radar detected significant rotation features of the ZZSV. S1 experienced two 1-min-precipitation peaks of more than 4 mm min−1. After 1704 LST, precipitation at S1 rapidly weakened and the 1-min precipitation peak at S3 Station subsequently occurred. During the time period of extreme 1-min precipitation, the vorticity of the ZZSV was intense. The peak of precipitation occurred about 10 min after the peak of vorticity of the ZZSV. The three peaks of 1-min precipitation were 4.4 mm, 4.7 mm and 3.3 mm, respectively. The heaviest and longest 1-min precipitation at S1 occurred after the occurrence of the maximum vorticity.
Theoretically, rotation is always associated with low pressure by way of the spin term. Thus, the ZZSV could force a low perturbation pressure in the middle and upper troposphere. A numerical simulation study has shown that the upward perturbation pressure gradient (dynamic acceleration) generated under the perturbation low pressure can enforce strong and steady updraft, and the acceleration of the updraft is equivalent to the buoyancy acceleration [42]. For the situation in strong mesoscale vortices, Coriolis force is negligible and the gradient wind balance relation can reduce to cyclostrophic balance, that is, the pressure gradient force is directed toward the axis of rotation and balances the centrifugal force [43]. Since the ZZSV is in equilibrium state, the low pressure value of the vortex center disturbance can be roughly estimated to be 0.9–2.2 hPa by using the cyclostrophic balance based on its rotating speed, which was 11.5–16.5 m s−1. Suppose the rotating speed is 14 m s−1: the radius of the vortex is 9000 m, which is the average value of the ZZSV during its 2-h lifetime, the air density is 0.81 kg m−3, which is about the air density at 4 km AGL, the pressure difference between the vortex center and the edge calculated from the cyclostrophic balance is 1.6 hPa, and the pressure difference is 2.2 hPa if the rotating speed is 16.5 m s−1 (the maximum rotation speed of the ZZSV). In this situation, the vertical upward motion at 4 km AGL would increase by 10–25 m s−1 within 6 min by considering only the perturbation pressure gradient force. The rough estimation above indicates that the quasi-steady meso-γ-scale vortex in the mid-troposphere was closely related to the minute-scale extreme heavy precipitation, especially the peak precipitation after 1630 LST, when the vortex developed to its strongest stage, and the meso-γ-scale vortex was the most critical structure.
In recent years, the relationship between meso-vortices and extreme precipitation has attracted extensive attention. In the previous studies [27,28,32,33,34,35], it is proposed that most of meso-vortices related to intense rainfall exist in the lower troposphere. In this extreme precipitation case in 2021, multiple mesoscale vortices in the lower troposphere were also found as presented in Section 4, while the dominant ZZSV developed in the middle and upper troposphere, which is similar to mid-level mesocyclones except the diameter. In fact, the diameter of the mesocyclone in the heavy-precipitation supercell that caused a tornado in 2007 in Anhui province also measured more than 10 km [44]. However, the above explanation lacks support of direct observational evidence of strong upward motion. Thereby, the effect of the meso-vortices on the formation of the extreme heavy precipitation in Zhengzhou needs to be further studied using numerical simulation methodology.
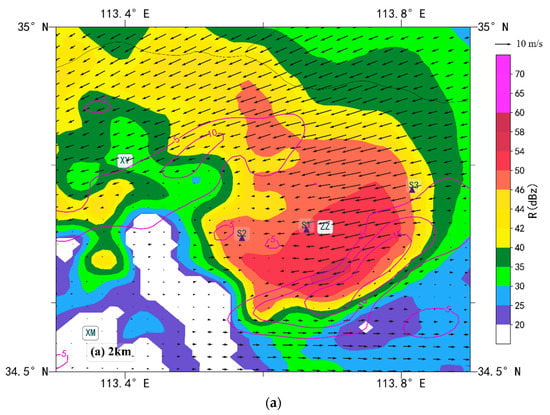
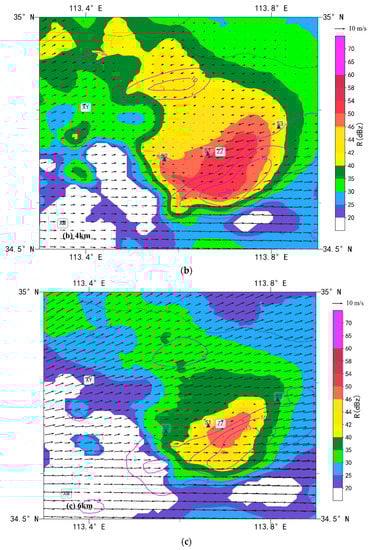
Figure 9.
Reflectivity (shaded, unit: dBZ) and retrieved winds from Luoyang radar at 2 km AGL (a), 4 km AGL (b), 6 km AGL (c) at 1630 LST 20 July 2021. The purple contours are for vertical vorticity at corresponding heights at 5 × 10⁻⁴ s−1 intervals starting from 5 × 10⁻⁴ s−1. “ZZ” represents the location of the Zhengzhou radar site. The purple triangles represent the locations of three surface rain stations, i.e., Zhengzhou(S1), Jiangang Reservoir(S2), and Shangdinglu Primary school (S3) used in Figure 10.

Figure 10.
Maximum vorticity of the ZZ meso-vortex estimated from radial velocity of Zhengzhou radar (red solid line) and 1-min rainfall at the three surface rain stations marked in Figure 9.
5.3. Low-Level Structure of the Zhengzhou Storm
The ZZS was right above the Zhengzhou radar site during the extreme heavy precipitation period (1600–1700 LST); therefore, the Zhengzhou radar could only detect the storm structure under 3 km AGL. Radial velocity convergence at 2–4 km AGL could only be detected with the Luoyang radar (Figure 9a), while the Zhengzhou radar observations provided a more detailed convergence structure (Figure 11 and Figure 12).
Airflows converged towards the storm from the north, east and south as shown on the retrieved wind images at 1.4 km AGL and below (Figure 11a,b and Figure 12a,b), and the storm was located in the convergence area except the western part. The strongest low-level convergence was less than −3.5×10⁻³ s−1 on the east side of the ZZS at 1600 LST (Figure 11d) and below −4.0×10⁻³ s−1 on its northeast side at 1654 LST (Figure 12d). Strong convergence formed mainly by the outflow of the ZZS and the easterly LLJ. The largest storm inflow was the easterly LLJ, and the radial velocity reached 24 m s−1 at the height of about 500 m AGL at 1600 LST (Figure 11e). As shown in the radar radial velocity images (Figure 11e and Figure 12e), the maximum westerly outflow with a speed of 18 m s−1 occurred at a height below 1000 m AGL (Figure 11c and Figure 12c). The ZZS caused a mesoscale high near the Zhengzhou radar site at 1700 LST in the surface (Figure 1c). A clear divergent airflow can be seen in the retrieved wind field under 1.4 km AGL at 1654 LST, corresponding to the divergence center of 2.0×10⁻³ s−1 and the downdraft zone at 1.4 km AGL (Figure 12b,d). The storm outflow intersected with the near-storm violent inflow, causing strong updraft of more than 3 m s−1 at 1.4 km AGL on the eastern part of the storm at 1600 LST (red shaded area in Figure 11b).
There was a mesoscale vortex with horizontal scale of less than 10 km on the northeast side of the storm at 1654 LST, and the vorticity at its center was 4.0 × 10⁻³ s−1 at 0.2 km AGL and 3.5 × 10⁻³ s−1 at 1.4 km AGL (Figure 12a,c, purple contours). At 2.0 km AGL, the vorticity decreased rapidly to 10 × 10−3 s−1, suggesting that the mesoscale vortex was largely located below 2 km AGL. The velocity couplet of the vortex first appeared at 1648 LST according to the Zhengzhou radar observations, and it evolved into a significant vortex velocity couplet by 1654 LST with the velocity difference of 34 m s−1 at 3.4° elevation and the diameter (distance between maximum inbound and outbound) of about 4 km (Figure 12e). In addition, a cyclonic structure appeared in the high ZDR area in the northern part of the storm (Figure 12f). The updraft at the northeastern part of the ZZS was violent, which was larger than 5 m s−1 at 1.4 km AGL at 1600 LST (Figure 11d) and reached 8 m s−1 at 1654 LST (Figure 12d). The location of the high vorticity was consistent with the location of the violent updraft. The updrafts on the eastern and southern parts of the storm at 1.4 km AGL maintained the speed of 2–3 m s−1 from 1600 LST to 1654 LST, while the speed of the updraft on the northeastern part of the storm increased from 5 m s−1 to 8 m s−1 along with the occurrence of the rotation, indicating that this smaller low-level vortex significantly enhanced the updraft.
The high radar reflectivity area of the ZZS with values above 50 dBZ was large, but the ZDR of 2–3 dB was observed only at the east edge of the storm (Figure 11f and Figure 12f). The ZDR large value area extended to the east, forming a bow shape at the outflow front of the ZZS that corresponded well with the strong convergence area and the low-level strong updraft area, suggesting that the strong updraft played a key role in the formation of relatively large-diameter raindrops in the ZZS. Observational studies based on raindrop size distribution [24,45] revealed that the average particle size of the extreme heavy precipitation in Zhengzhou was significantly larger than that in other areas during the same event and in other places of China during other heavy precipitation events. In addition, the number concentration of all kinds of particles including particles larger than 4 mm in size was unusually large in the ZZS and raindrops with a particle size above 2 mm contributed much more to the extreme precipitation.
Figure 13 shows the evolution of ZZS structures and the merging process of convective systems to the east of it. At 1654 LST, there was a small convective storm near ZM (ZM storm), which was located in the strong easterlies in the lower levels and was moving westward (Figure 12a). The height of the reflectivity core and the ZDR column (ZDR > 1 dB) of the ZM storm was lower than 3 km (Figure 13a,d), indicating that it was an ordinary cell storm with the updraft below 3 km height. At the same time, the ZZS extended eastward. At 1700 LST, the ZM storm merged into the ZZS (Figure 13b,e); thus, the height of ZDR column increased to 4 km AGL at the merging area (Figure 13e). Meanwhile, the corresponding reflectivity also enhanced significantly (Figure 13b), suggesting that the merging process greatly intensified the ZZS in 6 min and deepened the strong updraft of the ZZS. The 4-km reflectivity core and ZDR column were maintained after the process (Figure 13c,f). The merging area was near the lifting of the ZZS outflow and the strong easterly near the storm environmental inflow. The outflow boundary of the ZZS extended eastward by about 6.5 km from 1654 LST to 1712 LST. At 1654 LST, the outflow boundary (the intersected point of the outbound and inbound radial velocity) was located at the east leading edge of the ZZS, 6.5 km west of the ZM storm. Later, it reached the 4-km ZDR column at 1700 LST and moved to the east of the merged ZZS at 1712 LST, suggesting that the lifting of outflow boundary was of great importance for the maintenance of strong updraft after merging.
The storm propagated northeastward and the maximum updraft was located in the northeastern part of the ZZS. By 1730 LST, as the ZZSV collapsed, the ZZS separated from the mesoscale shear line, moved into the cold area on the north side of the surface mesoscale front, and then quickly dissipated.

Figure 11.
Reflectivity (a,c) and vertical velocity (color shadings in (b,d)) superimposed on wind vectors at 0.2 km AGL (a,b) and 1.4 km AGL (b,d), radial velocity (e) and differential reflectivity (f) at 3.4° elevation from Zhengzhou radar at 1600 LST 20 July 2021.Vertical vorticity in (a,c) and divergence in (b,d) (black lines) are both contoured at 5 × 10⁻⁴ s−1 intervals starting from 5 × 10⁻⁴ s−1.

Figure 12.
Reflectivity (a,c) and vertical velocity (color shadings in (b,d)) superimposed on wind vectors at 0.2 km AGL (a,b) and 1.4 km AGL (b,d), radial velocity (e) and differential reflectivity (f) at 3.4° elevation from Zhengzhou radar at 1654 LST 20 July 2021. Vertical vorticity in (a,c) and divergence in (b,d) (black lines) are both contoured at 5 × 10⁻⁴ s−1 intervals starting from 5 × 10⁻⁴ s−1.
Figure 13.
Vertical cross-sections of reflectivity (a–c), ZDR (d–f) and radial velocity (g–i) of the Zhengzhou storm to the east of Zhengzhou radar site (94° azimuth) at 1654 LST (a,d,g), 1700 LST (b,e,h) and 1712 LST (c,f,i) 20 July 2021.
6. Conclusions and Discussion
Based on observations of Doppler weather radars deployed at Luoyang and Zhengzhou and retrieved wind field from these two radars and surface observations, the key mesoscale systems and the storm structure of the extreme heavy precipitation in Henan on 20 July 2021 are investigated. The conclusions are as follows.
The key mesoscale forcings of the Henan extreme precipitation are summarized in Figure 14. The most important mesoscale system was the WHLV, which was characterized by cyclonic convergence flow, low pressure and spiral echo bands. The WHLV was located at the northwestern part of the inverted surface trough with a low-level shear convergence line on the east side of it. The convergence region of northeasterlies and southeasterlies and the mesoscale front at surface were located to the east of the WHLV. The northeasterly LLJ on the northwestern part of the WHLV with a height of maximum wind below 1 km AGL and a maximum wind speed of 27 m s−1 contributed to the intensification of precipitation and the mesoscale front. This LLJ also dominated the dissipation of the WHLV. The easterly LLJ to the east of the WHLV was of great importance for the eastward propagation and development of the ZZS.
The extreme precipitation occurred in the WHLV center and the spiral echo band area as well as the surface front zone to the east of the WHLV. The orographic lift of the LLJ enhanced the rainfall rate significantly at the north and east windward slopes of MSS and MFN.
The convective storms with mesoscale vortices whose horizontal scales were below 30 km produced the extreme heavy precipitation, with hourly rainfall exceeding 50 mm. The rotating speeds were generally below the threshold of mesocyclone; however, our results indicate that mesocyclones did exist. Two storms with meso-γ-scale vortices formed at the foothill of the southeastern part of MSS and then merged and developed violently to form the ZZS in the convergent shear line at 1300 LST near Xinmi (XM). The ZZS was located at the quasi-stationary surface front zone and surface confluence region.
Figure 15 illustrates the structure features associated with extreme heavy precipitation of the ZZS. The updraft of the ZZS was extremely strong due to various factors. First, a rough estimation indicates that the strong and long-lasting mesoscale-γ-vortices forced updrafts of 10–25 m s−1 in the middle troposphere. Second, the convergence between the strong easterly LLJ and the cold pool outflow of the ZZS resulted in vertical velocity increase of 2–3 m s−1 at low level. Third, a smaller low-level meso-γ-scale vortex on the northeast side of the storm enhanced the updraft by about 3 m s−1. The merging of convective storms surrounding the ZZS intensified the updraft significantly in a very short time. Meanwhile, due to strong lifting on the east side and the merging of other storms, the ZZS propagated eastward.
The extreme precipitation in Henan province on 20 July 2021 occurred under weak synoptic forcing of col pressure field, and the dominant weather systems were the weak low-pressure system at 500 hPa and the easterly wind shear at lower troposphere [20]; thus, the mesoscale systems dominated the formation of the intense rainstorms. The convective systems were organized by the WHLV and its associated mesoscale systems. Hourly precipitation over 50 mm was mostly caused by the storms with meso-vortices that had diameters of less than 30 km. The ZZS was formed by the merge of two convective storms with rotation, and there were two meso-γ-scale vortices in the ZZS at the extreme heavy precipitation stage. Therefore, vortices of different scales played important roles. The formation of mesoscale vortices and its relationship with extreme heavy rainfall need to be further studied in the future.
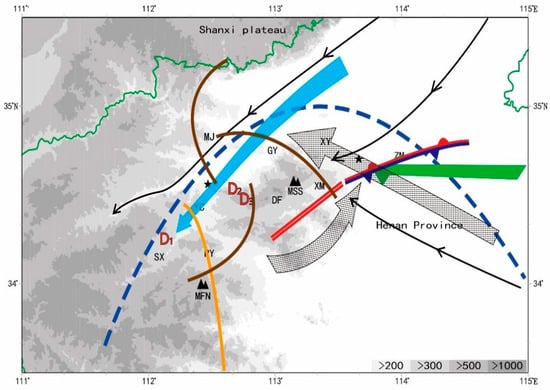
Figure 14.
Schematic illustration of the key mesoscale forcings of the Henan extreme precipitation. Henan was in a low pressure region in the surface (blue dashed line). The WHLV was located in the mountainous areas of western Henan; D1, D2 and D3 mark the center of the WHLV at 0800 LST, 1400 LST and 1700 LST, respectively; yellow and brown lines represent the initial positions of four spiral echo bands of the WHLV. The surface flows are depicted by black thin arrows, and a quasi-stationary surface front (conventional frontal symbol) was located to the east of MSS. The blue bold arrow indicates the northeasterly LLJ that invaded the west of the WHLV, and the green bold arrow represents the strong easterly LLJ in the east of MSS. The coarsely stippled arrows depict the jet flows at the height of 1–4 km AGL. A horizontal shear line (double red solid line) was located in the southeast of Zhengzhou. The gray shadings from light to deep are for the terrain height of 200 m, 300 m, 500 m and above 1000 m, respectively. The two black solid stars on the left and right represent the locations of Luoyang and Zhengzhou radar sites, respectively. Surface meteorological stations are denoted as follows: SX is for Songxian station, RY for Ruyang station, MJ for Mengjin station, YC for Yichuan station, GY for Gongyi station, DF for Dengfeng station, XM for Xinmi station and ZM for Zhongmou station. Mountains are marked by two black triangles, MSS represents the Songshan Mountain, and MFN represents the Funiu Mountain. The green line indicates the provincial boundary of Henan Province.
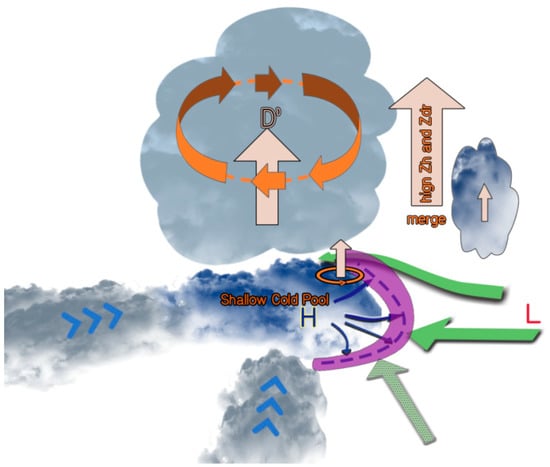
Figure 15.
Schematic representation of features associated with the Zhengzhou storm (ZZS) in the extreme heavy precipitation stage. The strong and long-lasting meso-vortex (orange thick arrow ellipse) measuring 15–20 km in diameter is the dominant feature of the storm. The strong and persistent meso-vortex produced a low pressure perturbation (marked by “D”) and then induced the perturbation pressure depression at the center of the meso-vortex (marked by “D”) and strong vertical updraft (light yellow upward arrow). The eastern half of the storm was surrounded by an extremely strong convergence and upward motion at the lower levels (purple shading), which was located at the interface of the convergent flow of the strong easterly LLJ (green bold arrow) and the outflow (blue thin arrow) of the storm cold pool (blue shading). This area was also located between the meso-high pressure under ZZS (marked by “H”) and the meso-low pressure to the east of ZZS (marked by “L”). Another small vortex under 2 km AGL measuring a few kilometers in diameter occurred at the northeast of the ZZS (orange thin arrow ellipse) and significantly enhanced the updraft (light yellow upward arrow at the center of the smaller vortex). Deepening ZDR column with high ZDR occurred at the leading edge of the ZZS when it moved eastward and merged with the convective cells to the east of it with relatively weak updraft. Some convective storms from the south and west merged into the ZZS (gray shaded areas with blue arrows).
Author Contributions
Conceptualization, X.W.; Methodology, L.F. and H.Z.; Software, L.F. and H.Z.; Validation, Y.Z.; Resources, X.Y. and A.S.; Data curation, X.W.; Writing—original draft, X.W.; Writing—review and editing, Y.Z.; Visualization, L.F., H.Z. and X.L.; Supervision, X.W.; Project administration, X.W.; Funding acquisition, X.W. All authors have read and agreed to the published version of the manuscript.
Funding
This research is sponsored by the National Natural Science Foundation of China (Grant Nos. U2142203, 41875058, 42175017), the National Key Research and Development Program of China (Grant No. 2022YFC3004104), and the Key Innovation Team of China Meteorological Administration (CMA2022ZD07).
Institutional Review Board Statement
Not applicable.
Informed Consent Statement
Not applicable.
Data Availability Statement
The experimental data used to support the findings of this study are available from the corresponding author upon request.
Conflicts of Interest
The authors declare no conflict of interest.
References
- Luo, Y.; Sun, J.; Li, Y.; Xia, R.; Du, Y.; Yang, S.; Zhang, Y.; Chen, J.; Dai, K.; Shen, X.; et al. Science and prediction of heavy rainfall over China: Research progress since the reform and opening-up of new China. J. Meteor. Res. 2020, 34, 427–459. [Google Scholar] [CrossRef]
- Meng, Z.; Zhang, F.; Luo, D.; Tan, Z.; Fang, J.; Sun, J.; Shen, X.; Zhang, Y.; Wang, S.; Han, W. Review of Chinese atmospheric science research over the past 70 years: Synoptic meteorology. Sci. China. Earth. Sci. 2019, 62, 46. [Google Scholar] [CrossRef]
- Tao, S.Y. Torrential Rain in China; Science Press: Beijing, China, 1980; 225p. [Google Scholar]
- Li, G.; Chen, J. New progresses in the research of heavy rain vortices formed over the Southwest China. Torrential Rain Disasters 2018, 37, 293–302. [Google Scholar] [CrossRef]
- Sun, J.; Chen, Y.; Yang, S.N.; Dai, K.; Chen, T.; Yao, R.; Xu, J. Analysis and thinking on the extremes of the 21 July 2012 torrential rain in Beijing. Part II: Preliminary causation analysis and thinking. Meteor. Mon. 2012, 38, 1267–1277. [Google Scholar] [CrossRef]
- Lei, L.; Sun, J.; He, N.; Liu, Z.; Zeng, J. A study on the mechanism for the vortex system evolution and development during the torrential rain event in North China on 20 July 2016. Acta. Meteor. Sin. 2017, 75, 685–699. [Google Scholar] [CrossRef]
- Li, H.; Wang, X.; Zhang, X. Analysis on extremity and characteristics of the 19 July 2016 severe torrential rain in the north of Henan Province. Meteor. Mon. 2018, 44, 1136–1147. [Google Scholar] [CrossRef]
- Xia, R.D.; Zhang, D.L. An observational analysis of three extreme rainfall episodes of 19–20 July 2016 along the Taihang Mountains in North China. Mon. Weather. Rev. 2019, 147, 4199–4220. [Google Scholar] [CrossRef]
- Zhao, S.X.; Sun, J.H.; Lu, R.; Fu, S. Analysis of the 20 July 2016 unusual heavy rainfall in North China and Beijing. Meteor. Mon. 2018, 44, 351–360. [Google Scholar] [CrossRef]
- Yu, X. Investigation of Beijing extreme flooding event on 21 July 2012. Meteor. Mon. 2012, 38, 1313–1329. [Google Scholar] [CrossRef]
- Fu, S.; Li, W.; Ling, J. On the evolution of a long-lived mesoscale vortex over the Yangtze River Basin: Geometric features and interactions among systems of different scales. J. Geophys. Res. Atmos. 2015, 120, 11889–11917. [Google Scholar] [CrossRef]
- Jiang, Y.; Wang, Y.; Chen, C.; He, H.; Huang, H. A numerical study of mesoscale vortex formation in the midlatitudes: The role of moist processes. Adv. Atmos. Sci. 2019, 36, 65–78. [Google Scholar] [CrossRef]
- Sun, J.; Zhao, S.; Xu, G.; Meng, Q. Study on a mesoscale convective vortex causing heavy rainfall during the mei-yu season in 2003. Adv. Atmos. Sci. 2010, 27, 1193–1209. [Google Scholar] [CrossRef]
- Zhai, G.; Zhou, L.; Wang, Z. Analysis of a group of weak small-scale vortexes in the planetary boundary layer in the mei-yu front. Adv. Atmos. Sci. 2007, 24, 399–408. [Google Scholar] [CrossRef]
- Yang, Y.; Gu, W.; Zhao, R.; Liu, J. The statistical analysis of low vortex during Meiyu season in the lower reaches of the Yangtze. J. Appl. Meteorol. Sci. 2010, 21, 11–18. [Google Scholar]
- Fu, S.-M.; Mai, Z.; Sun, J.-H.; Li, W.-L.; Ding, Y.; Wang, Y.-Q. Impacts of convective activity over the Tibetan Plateau on plateau vortex, southwest vortex, and downstream precipitation. J. Atmos. Sci. 2019, 76, 3803–3830. [Google Scholar] [CrossRef]
- Gao, S.T.; Zhao, S.X.; Zhou, X.P.; Sun, S.Q.; Tao, S.Y. Progress of research on sub-synoptic scale and mesoscale torrential rain systems. Chinese. J. Atmos. Sci. 2003, 27, 618–627. [Google Scholar] [CrossRef]
- Xu, J.; Li, R.; Zhang, Q.; Chen, Y.; Liang, X.; Gu, X. Extreme large-scale atmospheric circulation associated with the “21•7” Henan flood. Sci. China. Earth Sci. 2022, 65, 1847–1860. [Google Scholar] [CrossRef]
- Su, A.F.; Lü, X.N.; Cui, L.M.; Li, Z.; Xi, L.; Li, H. Prediction and test of optimal integrated precipitation based on similar spatial distribution of precipitation. Torrential Rain Disaster 2021, 40, 445–454. [Google Scholar] [CrossRef]
- Chyi, D.; He, L.F.; Wang, X.M.; Chen, S. Fine observation characteristics and thermodynamic mechanisms of extreme heavy rainfall in Henan on 20 July 2021. J. Appl. Meteor. Sci. 2022, 33, 1–15. [Google Scholar] [CrossRef]
- Chen, G.; Zhao, K.; Lu, Y.; Zheng, Y.; Xue, M.; Tan, Z.M.; Xu, X.; Huang, H.; Chen, H.; Xu, F.; et al. Variability of microphysical characteristics in the “21·7” Henan extremely heavy rainfall event. Sci. China Earth Sci. 2022, 65, 1861–1878. [Google Scholar] [CrossRef]
- Ran, L.K.; Li, S.W.; Zhou, Y.S.; Yang, S.; Ma, S.P.; Zhou, K.; Shen, D.D.; Jiao, B.F.; Li, N. Observational analysis of the dynamic, thermal, and water vapor characteristics of the “7.20” extreme rainstorm event in Henan Province. Chinese. J. Atmos. Sci. 2021, 45, 1366–1383. [Google Scholar] [CrossRef]
- Yin, J.F.; Gu, H.D.; Liang, X.D.; Miao, Y.; Sun, J.S.; Xie, Y.X.; Li, F.; Wu, C. A possible dynamic mechanism for rapid production of the extreme hourly rainfall in Zhengzhou City on 20 July 2021. J. Meteor. Res. 2022, 36, 6–25. [Google Scholar] [CrossRef]
- Zhang, X.; Yang, H.; Wang, X.M.; Shen, L.; Wang, D.; Li, H. Analysis on characteristic and abnormality of atmospheric circulations of the July 2021 extreme precipitation in Henan. Trans. Atmos. Sci. 2021, 44, 672–687. [Google Scholar] [CrossRef]
- Group Beijing. A diagnostic analysis about the “75.8” heavy rain in Henan. Acta Meteorol. Sin. 1979, 4, 44–45. [Google Scholar] [CrossRef]
- Doswell, C.A., III; Brooks, H.E.; Maddox, R.A. Flash flood forecasting: An ingredients-based methodology. Weather. Forecast. 1996, 11, 560–581. [Google Scholar] [CrossRef]
- Nielsen, E.R.; Schumacher, R.S. Dynamical insights into extreme short-term precipitation associated with supercells and mesovortices. J. Atmos. Sci. 2018, 75, 2983–3009. [Google Scholar] [CrossRef]
- Nielsen, E.R.; Schumacher, R.S. Observations of extreme short-term precipitation associated with supercells and mesovortices. Mon. Weather. Rev. 2020, 148, 159–182. [Google Scholar] [CrossRef]
- Smith, J.A.; Baeck, M.L.; Zhang, Y.; Doswell, C.A. Extreme rainfall and flooding from supercell thunderstorms. J. Hydrol. 2001, 2, 469–489. [Google Scholar] [CrossRef]
- Wu, F.F.; Yu, X.D.; Zhang, Z.G.; Zhou, X.G.; Wei, Y.Y. The characteristics of the mesocyclone and severe weather associated with convective storms. Meteor. Mon. 2012, 38, 1330–1338. [Google Scholar] [CrossRef]
- Zhai, G.; Zhang, H.; Shen, H.; Zhu, P.; Su, T.; Li, X. Role of a meso-γ vortex in meiyu torrential rainfall over the Hangzhou Bay, China: An Observational Study. J. Meteor. Res. 2015, 29, 966–980. [Google Scholar] [CrossRef]
- Li, M.X.; Luo, Y.L.; Zhang, D.L.; Chen, M.X.; Wu, C.; Yin, J.F.; Ma, R.Y. Analysis of a record-breaking rainfall event associated with a monsoon coastal megacity of South China using multisource data. IEEE Trans. Geosci. Remote Sens. 2020, 59, 6404–6414. [Google Scholar] [CrossRef]
- Yin, J.F.; Zhang, D.L.; Luo, Y.L.; Ma, R.Y. On the extreme rainfall event of 7 May 2017 over the coastal city of Guangzhou. Part I: Impacts of urbanization and orography. Mon. Weather Rev. 2020, 148, 955–979. [Google Scholar] [CrossRef]
- Zeng, Z.; Wang, D. On the local rain-rate extreme associated with a mesovortex over South China: Observational structures, characteristics, and evolution. Mon. Weather Rev. 2022, 150, 1075–1096. [Google Scholar] [CrossRef]
- Zhang, Q.Y.; Luo, Y.L.; Tang, Y.; Xu, X.; Yu, S.T.; Wu, C. Cause–effect relationship between meso-γ-scale rotation and extreme short-term precipitation: Observational analyses at minute and sub-kilometer scales. J. Meteorol. Res. 2022, 36, 539–552. [Google Scholar] [CrossRef]
- Jackson, R.; Collis, S.; Lang, T.; Potvin, C.; Munson, T. PyDDA: A Pythonic Direct Data Assimilation Framework for Wind Retrievals. J. Open Res. Softw. 2020, 8, 20. [Google Scholar] [CrossRef]
- Gao, J.; Xue, M.; Shapiro, A.; Droegemeier, K.K. A variational method for the analysis of three-dimensional wind fields from two Doppler radars. Mon. Weather. Rev. 1999, 127, 2128–2142. [Google Scholar] [CrossRef]
- Shapiro, A.; Potvin, C.K.; Gao, J. Use of a vertical vorticity equation in variational dual-Doppler wind analysis. J. Atmos. Oceanic Technol. 2009, 26, 2089–2106. [Google Scholar] [CrossRef]
- Shou, S.-W.; Li, S.-S.; Wang, S.-H.; Xu, H.-M.; Yu, Y.-B.; Zhao, Y.-D. Synoptic Analysis; Meteorological Press: Beijing, China, 2002; 325p. [Google Scholar]
- Hersbach, H.; Bell, B.; Berrisford, P.; Hirahara, S.; Horányi, A.; Muñoz-Sabater, J.; Nicolas, J.; Peubey, C.; Radu, R.; Schepers, D.; et al. The ERA5 global reanalysis. Q. J. R. Meteorol. Soc. 2020, 146, 1999–2049. [Google Scholar] [CrossRef]
- Chyi, D.; Wang, X.M.; Yu, X.D.; Zhang, J.H. Analysis on the development and maintenance mechanism of the extreme heavy rainfall in Henan on July 2021. Acta Meteorol. Sin. 2023, 81, 1–18. [Google Scholar] [CrossRef]
- Rotunno, R.; Klemp, J.B. The influence of the shear-induced pressure gradient on thunderstorm motion. Mon. Weather. Rev. 1982, 110, 136–151. [Google Scholar] [CrossRef]
- Markowski, P.; Richardson, Y. Mesoscale Meteorology in Midlatitudes; John Wiley & Sons: Hoboken, NJ, USA, 2010; 407p. [Google Scholar] [CrossRef]
- Yu, X. Observational investigation of a tornadic heavy precipitation supercell storm. Chin. J. Atmos. Sci. 2008, 32, 508–522. [Google Scholar] [CrossRef]
- Zhang, Z.; Qi, Y.C.; Li, D.H.; Zhao, Z.F.; Cui, L.M.; Su, A.F.; Wang, X.M. Raindrop size distribution characteristics of the extreme rainstorm event in Zhengzhou 20 July, 2021 and its impacts on radar quantitative precipitation estimation. Chin. J. Atmos. Sci. 2022, 46, 1002–1016. [Google Scholar] [CrossRef]
Disclaimer/Publisher’s Note: The statements, opinions and data contained in all publications are solely those of the individual author(s) and contributor(s) and not of MDPI and/or the editor(s). MDPI and/or the editor(s) disclaim responsibility for any injury to people or property resulting from any ideas, methods, instructions or products referred to in the content. |
© 2023 by the authors. Licensee MDPI, Basel, Switzerland. This article is an open access article distributed under the terms and conditions of the Creative Commons Attribution (CC BY) license (https://creativecommons.org/licenses/by/4.0/).