Article

The Role of Cities: Linking Integrated Assessment Models to Urban Solutions

by
Camila Callegari
1,*,
Tarik Tanure
2,
Ana Carolina Oliveira Fiorini
1,
Eduardo Haddad
3,
Edson Domingues
2,
Aline Magalhães
2,
Fernando Perobelli
4,
Alexandre Porsse
5,
André F. P. Lucena
1,
Eveline Vasquez-Arroyo
1,
Mariana Império
1,
Luiz Bernardo Baptista
1 and
Roberto Schaeffer
1
1
Energy Planning Program, Graduate School of Engineering, Universidade Federal do Rio de Janeiro (UFRJ), Centro de Tecnologia, Cidade Universitária, Ilha do Fundão, Rio de Janeiro 21941-914, Brazil
2
Center for Development and Regional Planning, Faculty of Economic Sciences, Universidade Federal de Minas Gerais (UFMG), Av. Presidente Antônio Carlos, 6627, Belo Horizonte 31270-901, Brazil
3
Department of Economics, Faculty of Economics, Administration, Accounting and Actuarial Science, Universidade de São Paulo (USP), Av. Prof. Luciano Gualberto, 908, FEA I, São Paulo 05508-900, Brazil
4
Department of Economics, Faculty of Economic Sciences, Universidade Federal de Juiz de Fora (UFJF), Campus Universitário, Juiz de Fora 36036-330, Brazil
5
Department of Economics, Faculty of Economic Sciences, Universidade Federal do Paraná (UFPR), Av. Prefeito Lothario Meissner, 632, Jardim Botânico, Curitiba 80060-000, Brazil
*
Author to whom correspondence should be addressed.
Sustainability 2023, 15(6), 4766; https://doi.org/10.3390/su15064766
Submission received: 14 December 2022 / Revised: 8 February 2023 / Accepted: 19 February 2023 / Published: 8 March 2023
(This article belongs to the Section Sustainable Urban and Rural Development)

Abstract

:
Cities play a fundamental role in reducing greenhouse gas emissions and advancing the 2030 Agenda for Sustainable Development. In this context, public authorities need tools to help in identifying the best set of available solutions for the urban environment. Here, we developed an approach to help decision makers in evaluating sustainable solutions, considering aspects such as emission rate, economic attractiveness, job creation, and local competitiveness in an intersectoral fashion. To rank the best solutions, we developed a new methodology that links integrated assessment models (IAMs) to the available solutions at the Innovation Observatory for Sustainable Cities (OICS) database and applied it to Brazil. Our results show that the solutions with the greatest impact were often related to new technologies, for example, renewable energy, which depends on institutional and financial arrangements that are beyond the administrative capacity of the vast majority of municipalities. Despite these limitations, Brazilian cities can act as regulators or provide financial incentives and advocacy to promote sustainable solutions in the urban environment.

1. Introduction

Cities are responsible for around 70% of the global carbon dioxide (CO2) emissions and global gross domestic product (GDP) while comprising about 50% of the global population [1,2]. The urban population is expected to nearly double by 2050 [1]. As a consequence, cities have increasingly concentrated populations, economic activities, social and cultural interactions, and environmental and humanitarian impacts [1]. Cities are both key emission sources and where climate change’s consequences are felt most severely [3]. Climate change has already impacted human health, livelihoods, and key infrastructure in urban settings, and climate change risks are expected to increase in the mid and long term [4]. Therefore, cities face challenges to deal with and opportunities to mitigate climate change.
Thus, cities play a crucial role in mitigating greenhouse gases (GHGs) and need to adapt to reduce the impact of climate change. Growing public and political awareness of climate impacts and risks has led many cities to include adaptation and mitigation in their policies and planning processes [4,5]. Several cost-effective technologies are available for urban climate action [6,7].
Nevertheless, real action often remains incipient without truly diagnosing the problem in cities due to short-term political decisions [8]. Therefore, decision support tools are needed to help decision makers in addressing local challenges while taking action toward climate change. Climate change action should be connected to the achievement of other Sustainable Development Goals (SDGs), since climate action can reduce risks and damage, and generate additional benefits such as innovation, health and wellbeing, food security, livelihood and biodiversity conservation, and reduction in the risks and damage [4].
Furthermore, the need for better-quality data is a critical element that hinders monitoring the achievement of sustainable urban development goals and global agendas such as the 2030 Agenda for Sustainable Development. As many countries have moved towards local-level decision making, there is a need for national monitoring systems that could support progress tracking and identifying setbacks using new approaches and techniques to support the formulation of evidence-informed policies. On the basis of this demand, many countries have developed platforms and observatories aimed at fostering sustainable urban development [9].
In Brazil, two platforms have had subsidies integrated with sustainable urban planning: the Sustainable Cities Platform (SCP) and the Innovation Observatory for Sustainable Cities (OICS). The SCP is an open- and free-access system that comprises thematic modules (best practices, indicators, and integrated urban planning, among others), provides methodologies and support materials for municipal management and planning, and guidelines, information, and news on urban sustainability and public policies [10]. The OICS is a virtual collaborative platform in the public domain that contains innovative and sustainable urban solutions contextualized to the national territory through typologies of urban regions [11]. In addition to providing inputs to policymakers, the OICS also seeks to inspire the public to lead more sustainable lives, and encourage the development of more resilient and humane cities [10].
Hence, in this paper, we aim to help decision makers in choosing and evaluating urban solutions for sustainable development. For this objective, we developed an integrated urban management analytical tool designed to assist cities in the implementation of the New Urban Agenda [1] and the 2030 Agenda for Sustainable Development [12]. The purpose of the tool is to allow for public managers, specialists, and other agents to access and choose from a broad set of sustainable urban solutions. To rank solutions, we developed a new methodology linking integrated assessment models (IAMs) to available solutions in the OICS. Special emphasis is given to the potential of solutions to help Brazil in achieving its nationally determined contributions (NDC) climate action plan.
A presentation of the methodology follows in Section 2, presenting models and scenarios used to create indicators to rank solutions. Section 3 presents the transformation of the model results into indicators, the ranking of the top solutions, and the selection of solutions according to the challenges. Afterwards, Section 4 presents a discussion highlighting political barriers to implementing solutions and policy recommendations, and Section 5 concludes the paper.

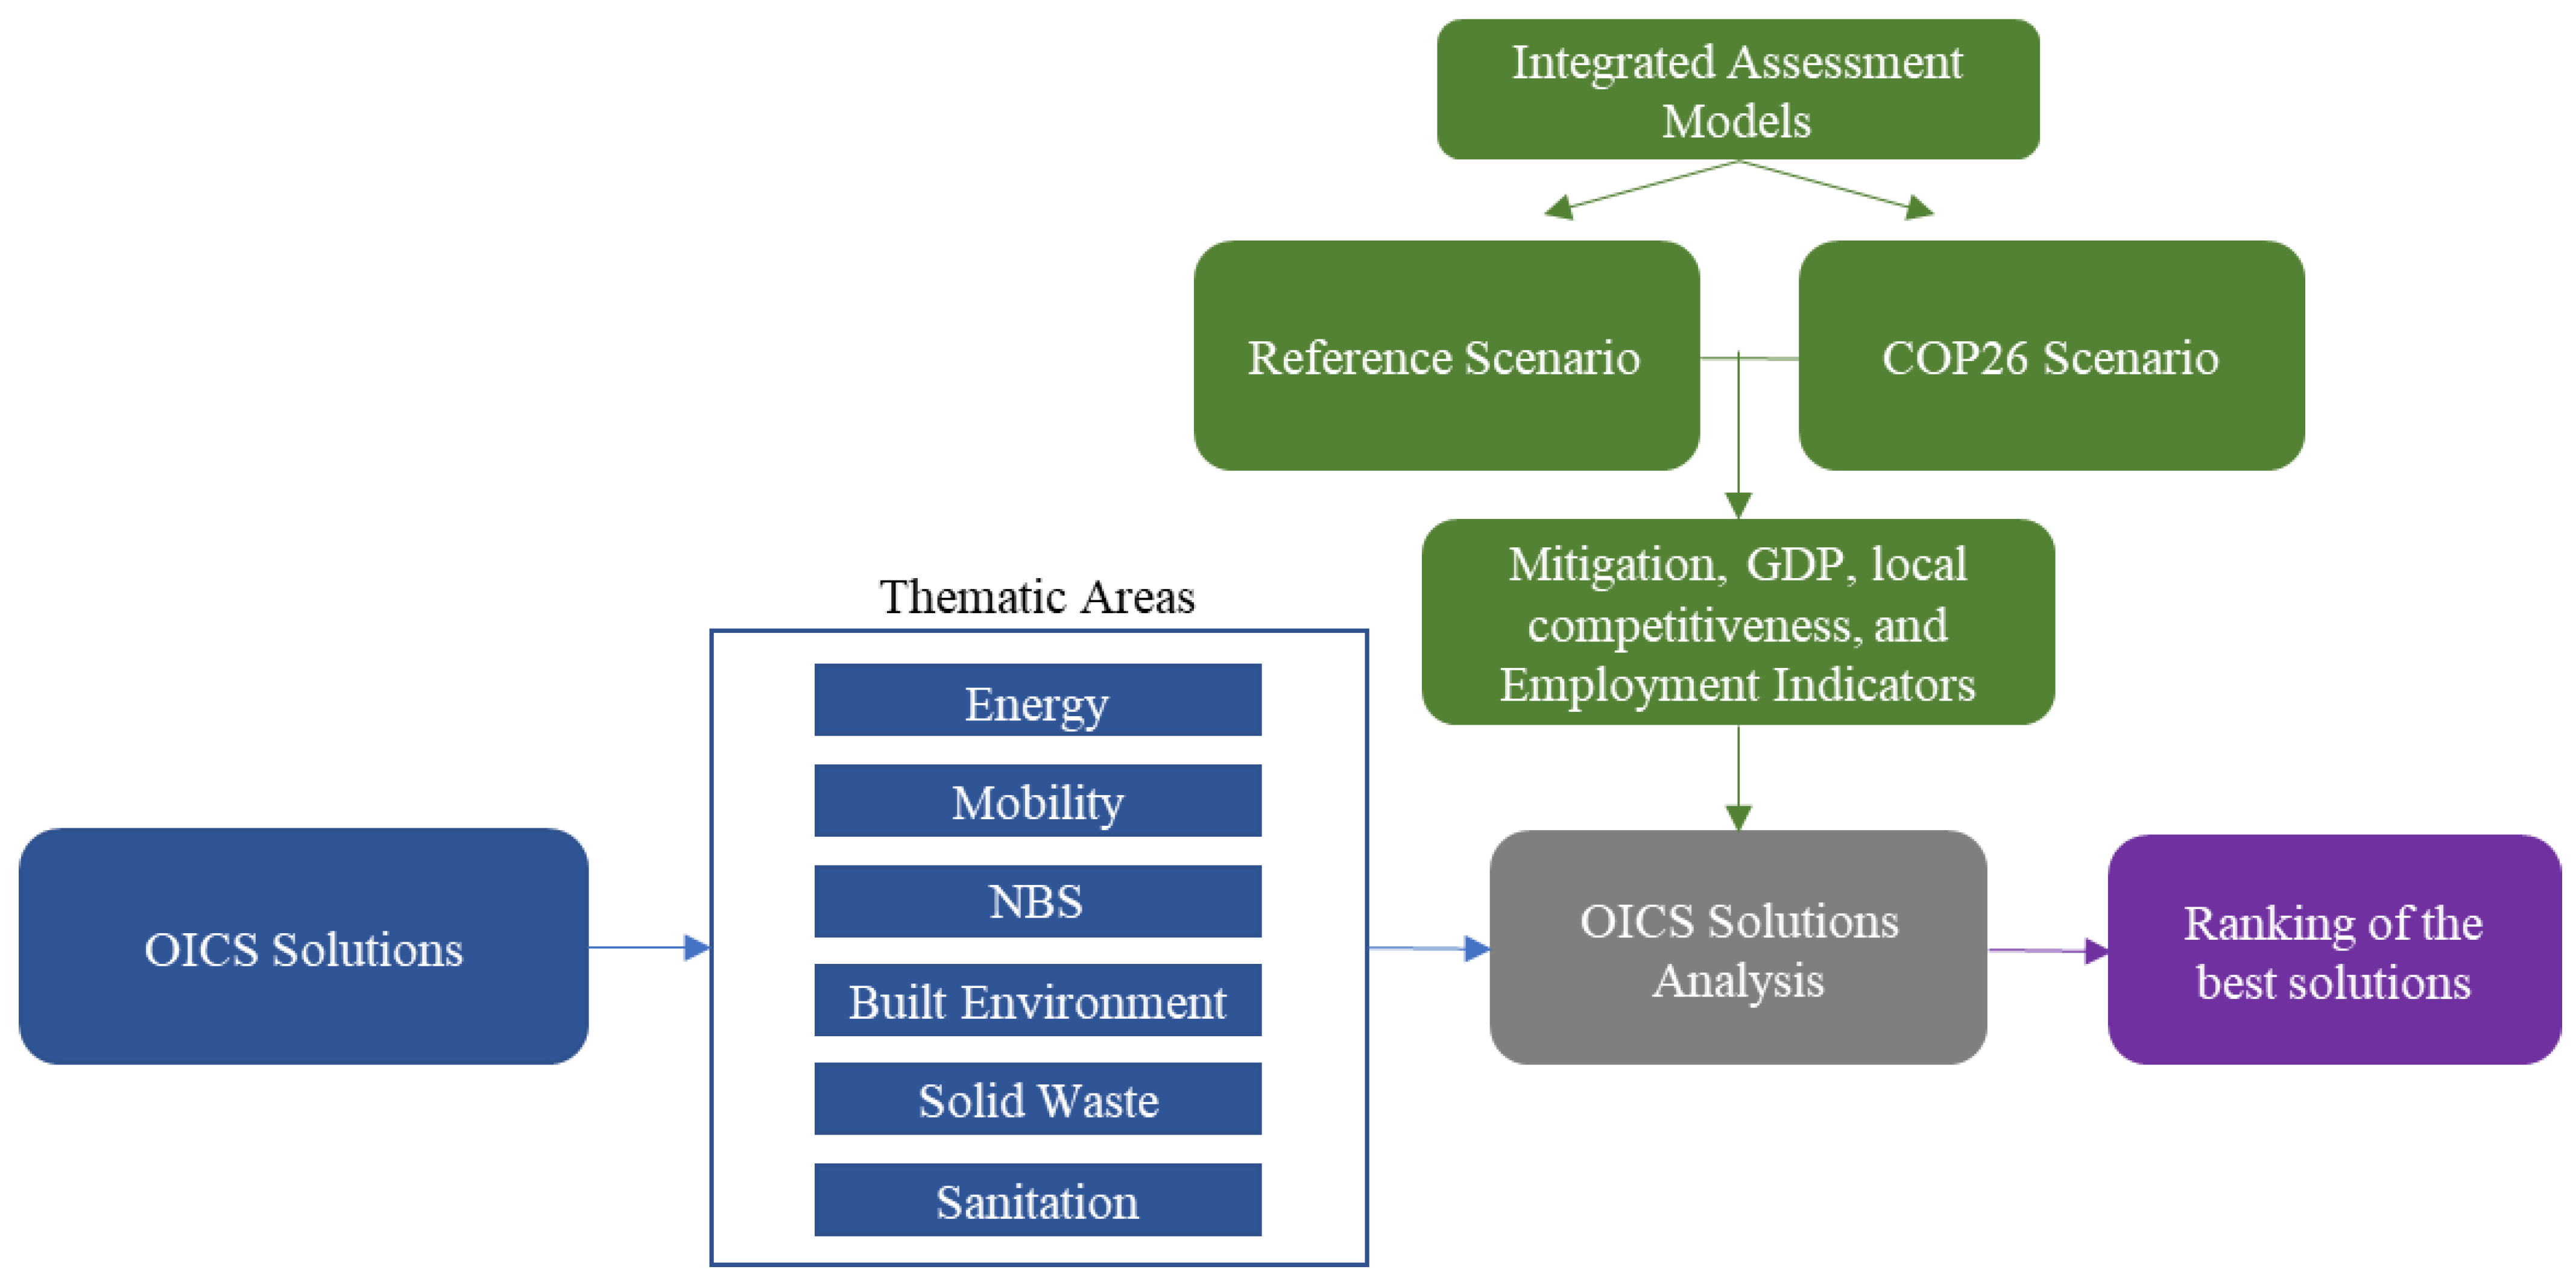
2. Materials and Methods

The methodology framework is presented in Figure 1. Initially, we evaluated the sustainable solutions in the OICS platform within their thematic areas. Through IAM, we simulated a sustainable economic trajectory in which solutions would be implemented, in contrast to business-as-usual trajectory. The simulation allowed for the development of mitigation potential and economic performance indicators. Then, we linked the indicators to the platform solutions in order to allow for the ranking of the available sustainable solutions in the OICS database. Ranking according to technical and economic criteria could help decision makers in selecting solutions that better meet local specificities.
The database has 295 solutions distributed in 6 thematic areas: (i) built environment, (ii) energy; (iii) mobility; (iv) sanitation: water; (v) sanitation: solid waste; (vi) nature-based solutions. The solutions in their respective areas are linked to the Sustainable Development Goals (SDGs) and, when implemented, contribute to the protection of the environment and climate, and thereby Brazil’s NDC (the Brazilian NDC reaffirmed its commitment to reducing total net greenhouse gas emissions by 37% in 2025 and by 43% by 2050. The NDC also set out the indicative objective of climate neutrality by 2060 [13]).
The present study reviews the OICS’ sustainable urban solutions and uses an integrated modeling exercise to create indicators for each one. The indicators help decision makers in selecting urban solutions and estimating the contribution of each solution to the fulfillment of the NDC. In this sense, we performed a simulation to project economic performance and GHG mitigation. From the perspective of sustainable integrated urban planning, a restrictive temporality was adopted in which the short, medium, and long terms correspond to 1 to 2, 3 to 5, and over 5 years, respectively. The study looks at the role that short-term solutions would play in contributing to climate neutrality by 2050.
The results of the projections were used for the elaboration of four impact indicators: emission mitigation potential, the level of economic activity, the level of employment, and the level of local competitiveness. For each indicator, solutions were classified following the structure developed in [14]. We then used the indicators to rank solutions to help decision makers.

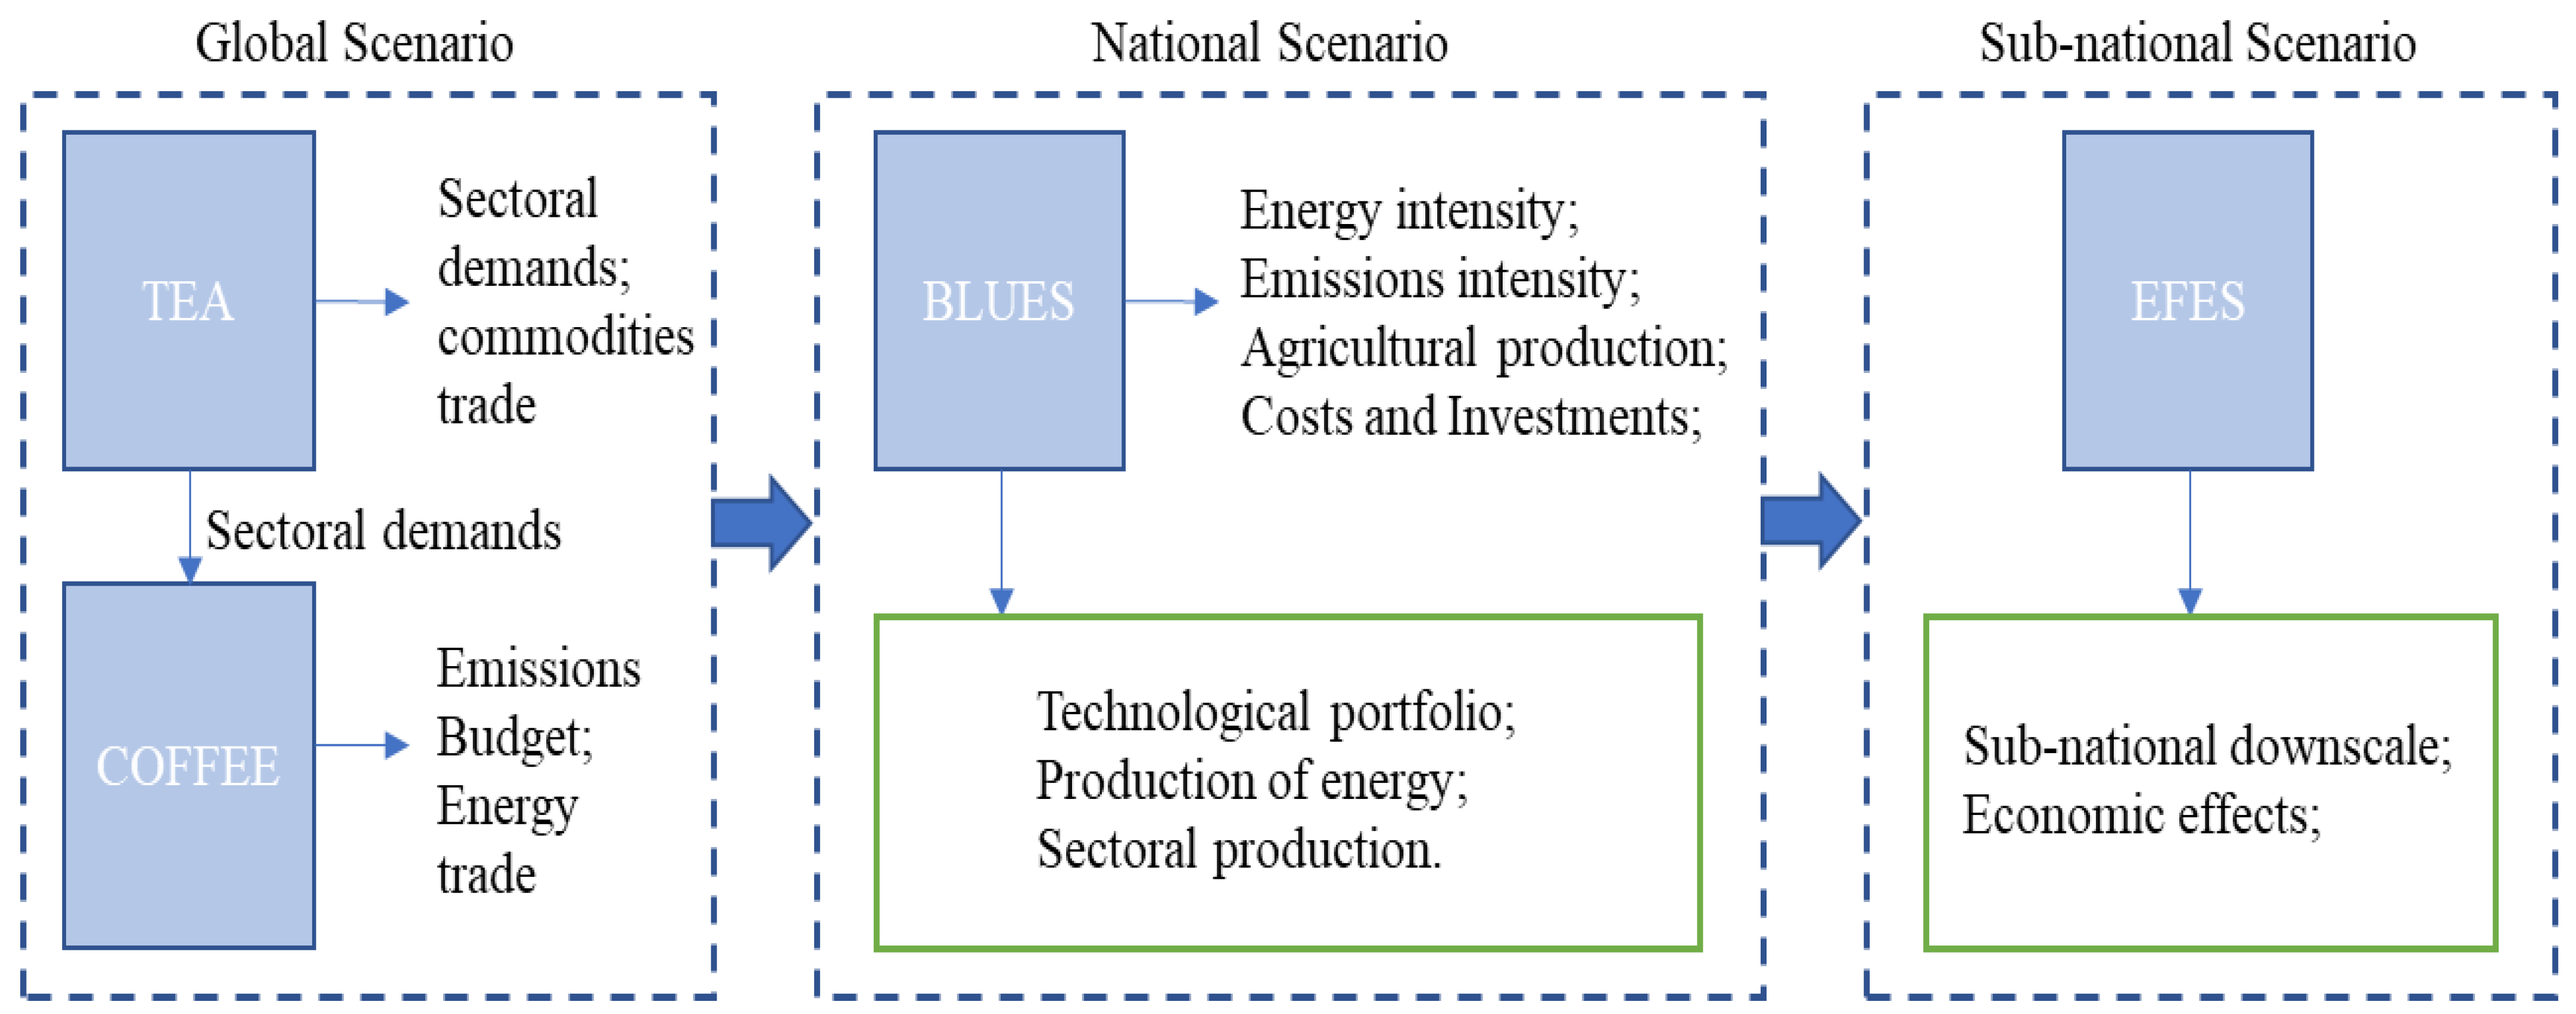
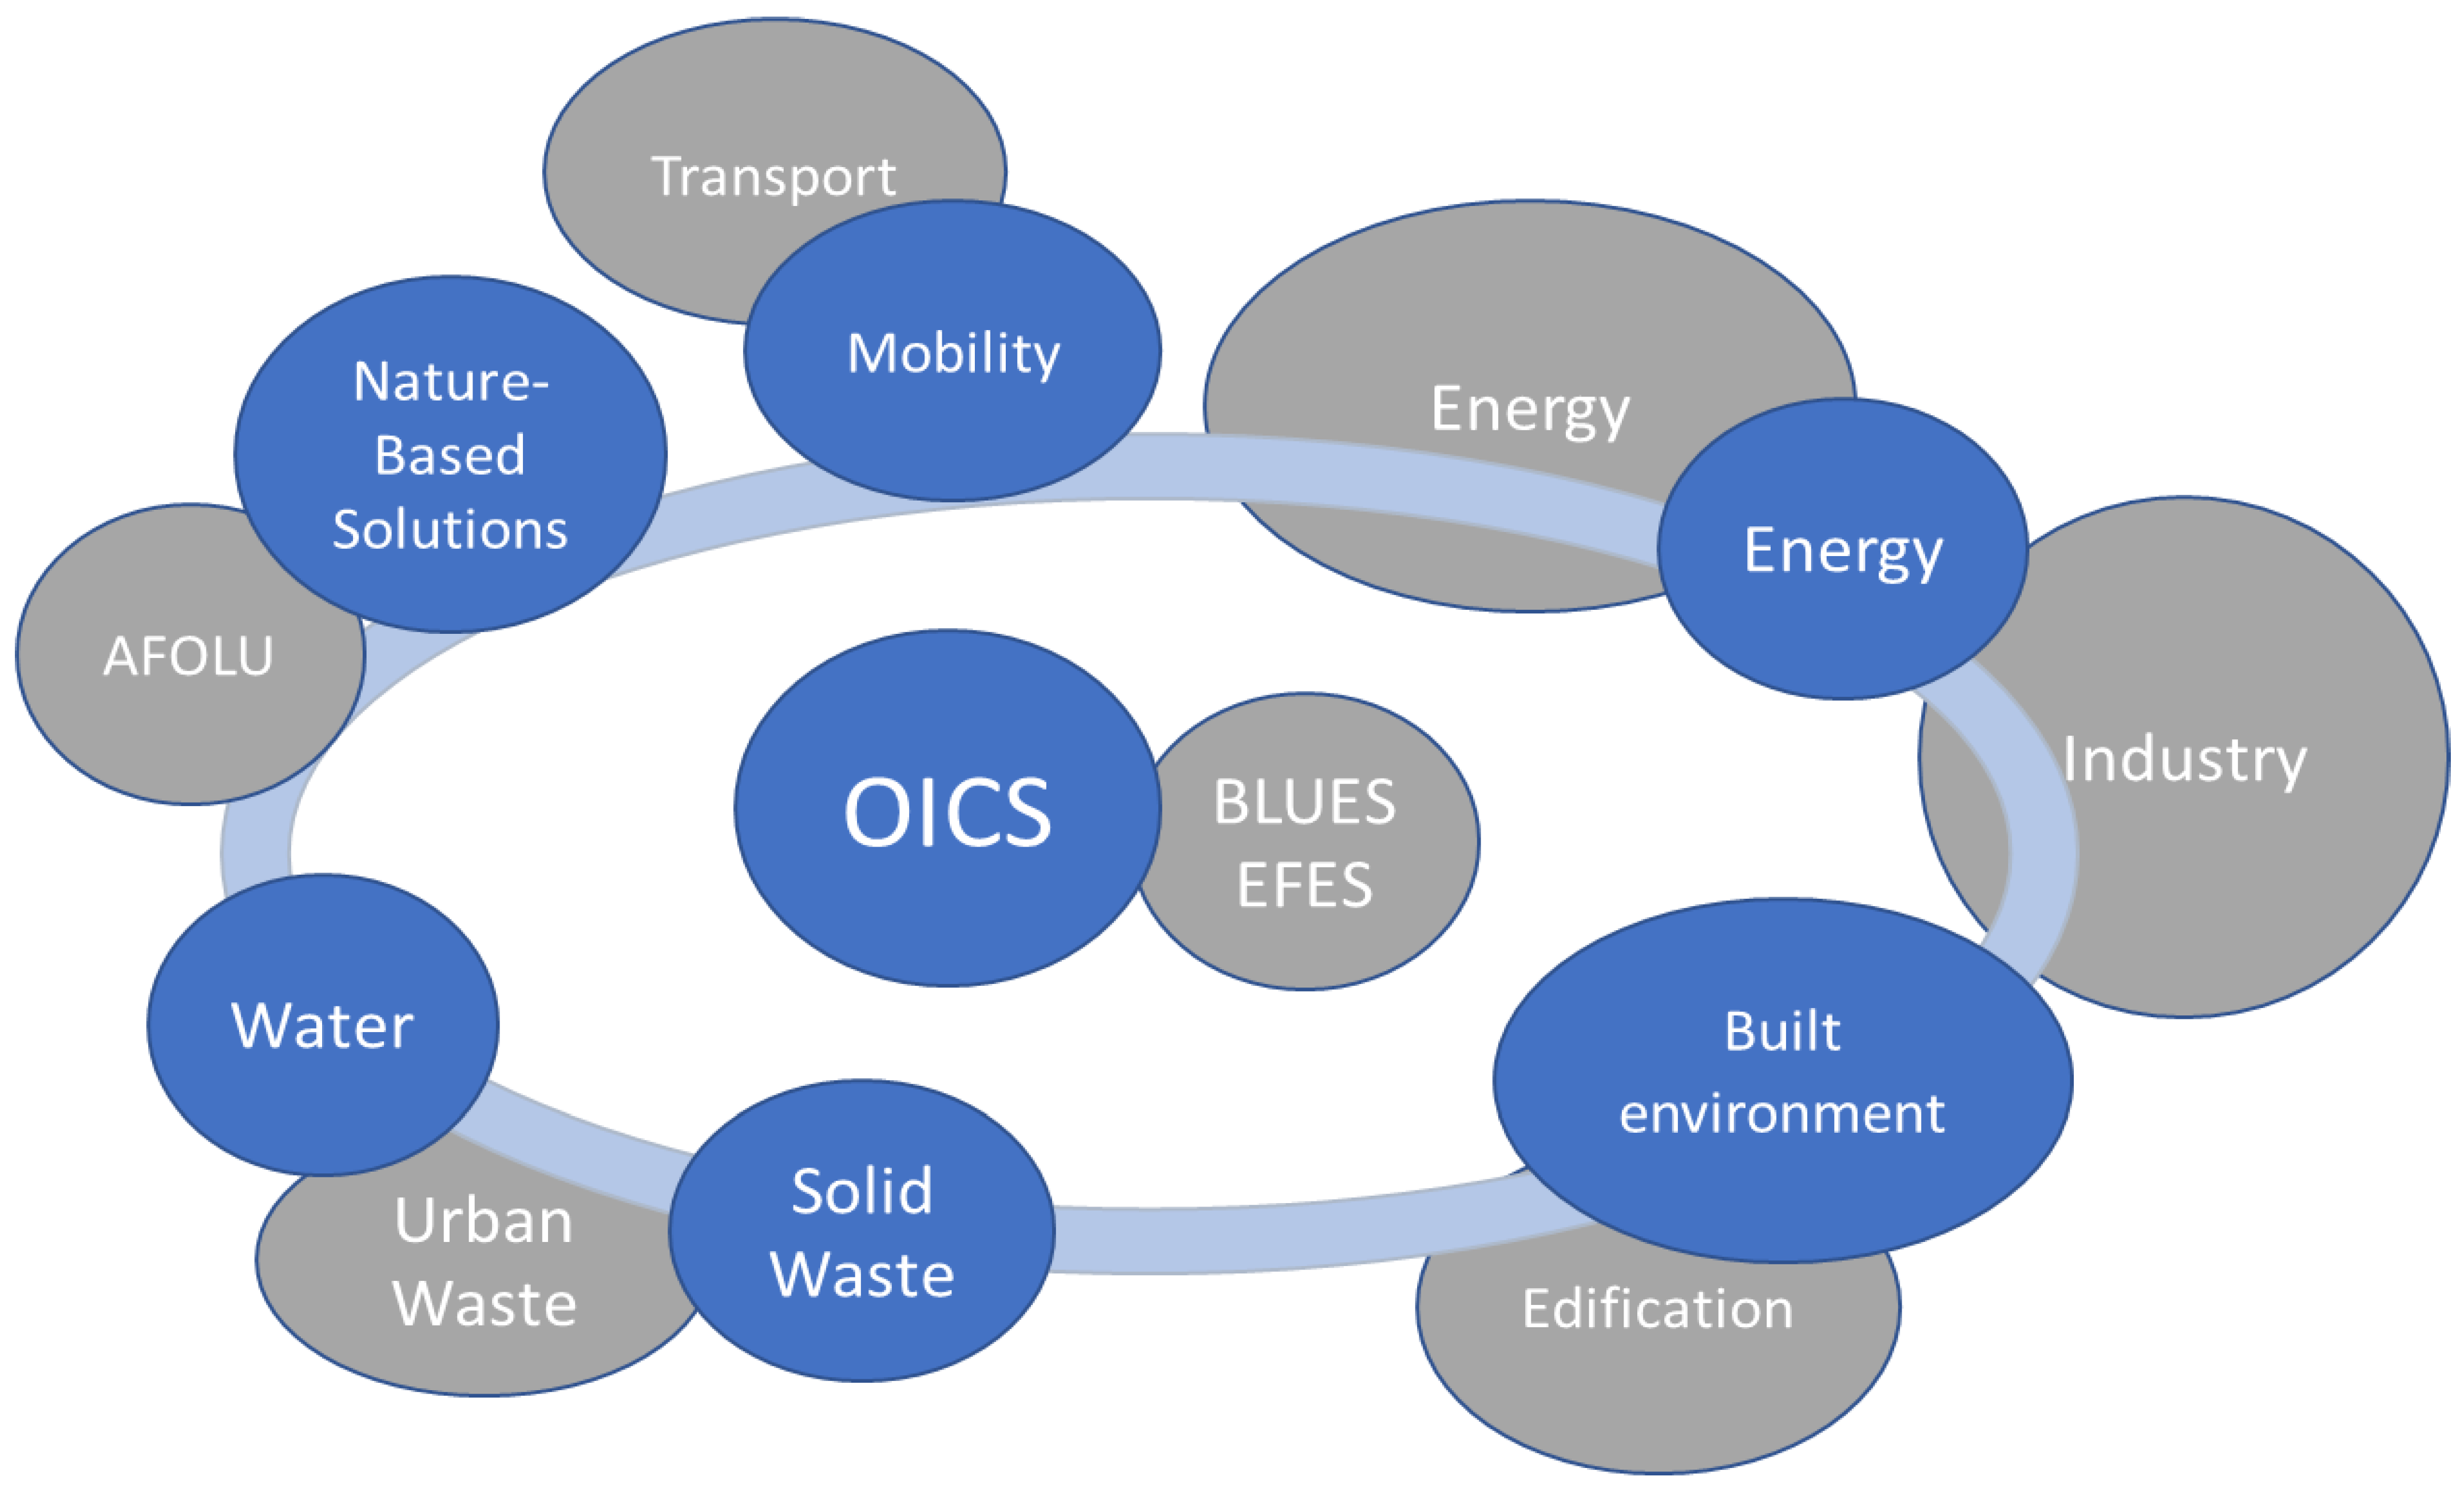
2.1. Models Used to Project Impact Indicators for Sustainable Urban Solutions

The IAM framework is widely used in studies that project alternative impacts related to different climatic and technological ambitions [4,15,16]. It can be used to assess the feasibility of long-term global and national mitigation scenarios, with assumptions ranging from relevant changes in the energy matrix to alternatives related to not requiring negative emissions [17]. The methodology uses conditioned optimization models with a detailed representation of energy systems, land use, water resources, and environmental and socioeconomic impacts.
The chosen scenarios represent energy transition pathways within a decarbonization context. They explore mitigation options to achieve a climatic outcome in terms of the global surface temperature rise threshold. The IAM toolset functions through assumptions linked to scenarios and produces regionally disaggregated results allowing for elaborating the impact indicators for each urban solution. Figure 2 presents the iterations performed in the IAM model (the modeling documentation can be found in [18,19,20,21,22,23]).
The Total Economy Assessment (TEA), a computable general equilibrium global model (CGE) with recursive dynamics [18], and the Computable Framework for Energy and the Environment (COFFEE) model, a bottom–up optimization tool with the technological detailing of energy and land use systems [19,20], provide inputs for the overall boundary conditions used in the Brazilian Land-Use and Energy System (BLUES) model.
BLUES, a bottom–up national optimization model, describes in greater detail conventional and mitigation technologies for the energy, land-use, and water-use sectors in the Brazilian macroregions, and their investments, and operation and maintenance costs. It produces results in terms of energy demand, emissions, and sectoral production [20,21]. The sectoral energy demand coefficients produced by the BLUES model were incorporated with EFES/TERM [22,23], a regional CGE model that uses sectoral energy intensity levels to project economic effects on a regional scale in Brazil.
The iteration between the BLUES and EFES models is guided by two narratives. The first represents a baseline scenario in which the economy maintains the current pattern, and the second, the COP26 scenario, is in compliance with the Brazilian NDC presented in 2022. The simulation results, in terms of the deviation between the base and COP26 scenarios, were used as a reference for the measurement of impact indicators. The economic sectors of the IAM modeling were compatible with the areas of intervention and with the thematic areas of the OICS solution database. Table A1 in Appendix A presents the compatibilization between sectors and solutions.
The use of indicators allows for measuring the benefits that solutions, once used in cities, could bring directly to society and the economic system, enabling public managers to classify solutions according to their characteristics. This encompasses the ability to generate jobs, contribute to economic growth, has effects on energy demand, and mitigates GHG emissions. The simulations of each scenario, based on the narratives described below, produced results at the national level for the five macroregions of Brazil. The narratives portray domestic actions and trends materialized through the implementation of sustainable urban development solutions.

2.1.1. Baseline Scenario (Business as Usual)

The baseline scenario follows the trend evolution of energy, land-use, socioeconomic, and technological systems in the domestic context, demonstrating the consequences of the continuity of sectoral trends and policies already implemented in the country. The following recent trends were imposed on the scenario building tools: (i) current and contracted installed capacities for power generation sources, refineries, distilleries, transmission, and electricity distribution assets; (ii) deforestation projection from 2021 to 2050, using the observed trends from 2010 to 2020 as the basis; (iii) coal-fired power plants contracted in the southern region; (iv) natural gas thermoelectric plants at the base (privatization of Eletrobras); (v) biodiesel blend mandate from B10 to B12 until 2050; (vi) mandate for anhydrous ethanol blend in gasoline between 2021 and 2050 according to the average production between 2010 and 2020; (vii) the absence of policies to encourage the electrification of the vehicle fleet; (viii) current agricultural production technologies and compliance with the low-carbon agricultural (ABC) plan; (ix) the decarbonization targets of the International Maritime Organization (IMO) and the International Air Transport Association (IATA) with emission reduction targets of 50% in 2050 for emissions in 2008 and 2005, respectively.
Considering these assumptions in the BLUES–EFES model, the baseline scenario optimizes the evolution of energy, land-use, water-resource, socioeconomic, and technological systems according to the minimal cost perspective. Additionally, in the simulation stage of the baseline scenario, the following were assumed: (i) the factor’s productivity is consistent with the GDP growth generated by the COFFEE–TEA model; (ii) the population by region (federative units) evolves according to projections of the Brazilian Institute of Geography and Statistics [24]; (iii) land productivity grows at 2.5% per year; (iv) labor productivity grows at 0.4% per year.

2.1.2. COP26 Scenario

The COP26 scenario seeks to assess the effects of meeting the goals announced by Brazil at the 26th Conference of the Parties to the United Nations Framework Convention on Climate Change. At the time, the Brazilian government committed itself to achieving net-zero GHG emissions by 2050, stopping deforestation from 2030 onwards, reducing methane emissions, and complying to and implementing NDC guidelines and other sectoral commitments by 2030. In addition, the COP26 scenario considers the decarbonization objectives of IMO and IATA from 2023, and the goals of the ABC+ Plan. The used actions and measures imply a change in the country’s energy demand. Therefore, the BLUES–EFES model considers changes in the technical coefficients of the economic sector’s energy demand. This change in energy demand did not occur in the baseline scenario. Moreover, the COP26 scenario assumes the following: (i) the factor’s productivity is consistent with the GDP growth generated by the COFFEE–TEA framework; (ii) the population by region (federative units) evolves according to projections of the Brazilian Institute of Geography and Statistics [24]; (iii) land productivity grows at 2.5% per year; (iv) labor productivity grows at 0.4% per year.
The COP26 trajectory comprises a series of technological and economic changes to ensure economic decarbonization and promote greater efficiency in resource use, especially energy. It simulates the expected impact of adopting the available sustainable solutions on the OICS platform. The adopted changes in energy efficiency reduce the sectoral production cost per unit, given the lower need for energy use. Cost reduction implies a reduction in market prices and positively impacts economic activity. In turn, greater economic activity affects the use of primary factors of production such as capital and labor. That is, economic growth occurs as a result of a more sustainable (less energy) and more efficient allocation of productive factors in an economy where deforestation is zero from 2030 onwards.
The economic growth projected in the COP26 scenario, in sectoral terms, reflects the production carried out with sustainable technologies linked to OICS urban solutions and, in line with the requirements of the green industry, is characterized by greater efficiency in resource use and emission reduction [25]. Furthermore, cities located close to advanced industrial zones could benefit from externalities (environmental and economic). Although the green industry is not within the scope of this work, there is an intrinsic relationship among the adoption of sustainable urban solutions, the green industry, and resource decoupling, evidencing the sustainable character of the projected economic growth.

2.2. Scoring and Ranking the Solutions of the OICS Platform

We used BLUES–EFES modeling results as the basis (in terms of the deviation between the baseline and COP26 scenarios) of classifying the indicators of mitigation potential, and the levels of economic activity, employment, and local competitiveness. The results, which represent a quantitative approach, were inserted into a scale of the degree of impact ranging from 1 (very low) to 5 (very high) on the basis of [14]. The impact degrees assigned to each indicator represent the level of the contribution of each solution concerning economic and mitigation criteria (Table 1).
The economic criterion considers indicators that measure the benefits that solutions, once applied in cities, could bring directly to society and the economic system, especially regarding the levels of economic activity in terms of GDP, employment, and local competitiveness. The indicators are linked to SDGs 8 and 10. SDG 8 focuses on promoting economic growth inclusively and sustainably, generating full, decent, and productive employment for all. SDG 10 aims to reduce inequality within and between countries with the goals of increasing income, empowerment, and social, economic, and political inclusion, and combating discrimination [26,27].
Moreover, regional competencies, measured with comparable previous experiences and positioned in the face of implemented success cases, were considered. The criterion aims to ascertain how thematic solutions can be seen as an opportunity for the competitiveness and positioning of cities in terms of sustainability on a global scale, given the regional technological and scientific skills.
The mitigation potential indicator measures the GHG emission reduction capacity associated with the adoption of OICS solutions; therefore, it is directly linked to SDG 13 and the achievement of the goals established by the Brazilian NDC. The energy availability impact indicator aligns with SDG 7, which aims to ensure universal, reliable, modern, and affordable access to energy services for society. This goes further, also aiming at the sustainability of the energy system through an increase in the participation of renewable energies in the global energy matrix and an improvement in energy efficiency rates [26,27].
The allocation of solutions by thematic area concerning economic sectors followed the strategy of compatibilization in Figure 3. Although there was no perfect alignment between the thematic areas of the OICS and the sectors considered in the BLUES–EFES model, the intersection between the two tools was quite close, especially for the transport, energy, and industrial sectors.
The assignment of impact grades to the solutions allows for the solutions to be ranked according to economic and technical criteria. The ranking was incorporated into the OICS. In this sense, public managers can use the platform to sort sustainable solutions and choose those that better meet local demands, whether contributing to greater job creation, economic growth, less energy demand, and, above all, a reduction in GHG emissions.

3. Results

This section presents the results in three subsections: first, the results obtained from the BLUES–EFES model are presented by thematic and intervention areas (Section 3.1). Next, Section 3.1.1 and Section 3.1.2 present the impact on socioeconomic and technical indicators, and the role of each sector. The highest-ranked OICS platform solutions are identified in Section 3.2. Lastly, Section 3.3 displays the best urban solutions per challenge.

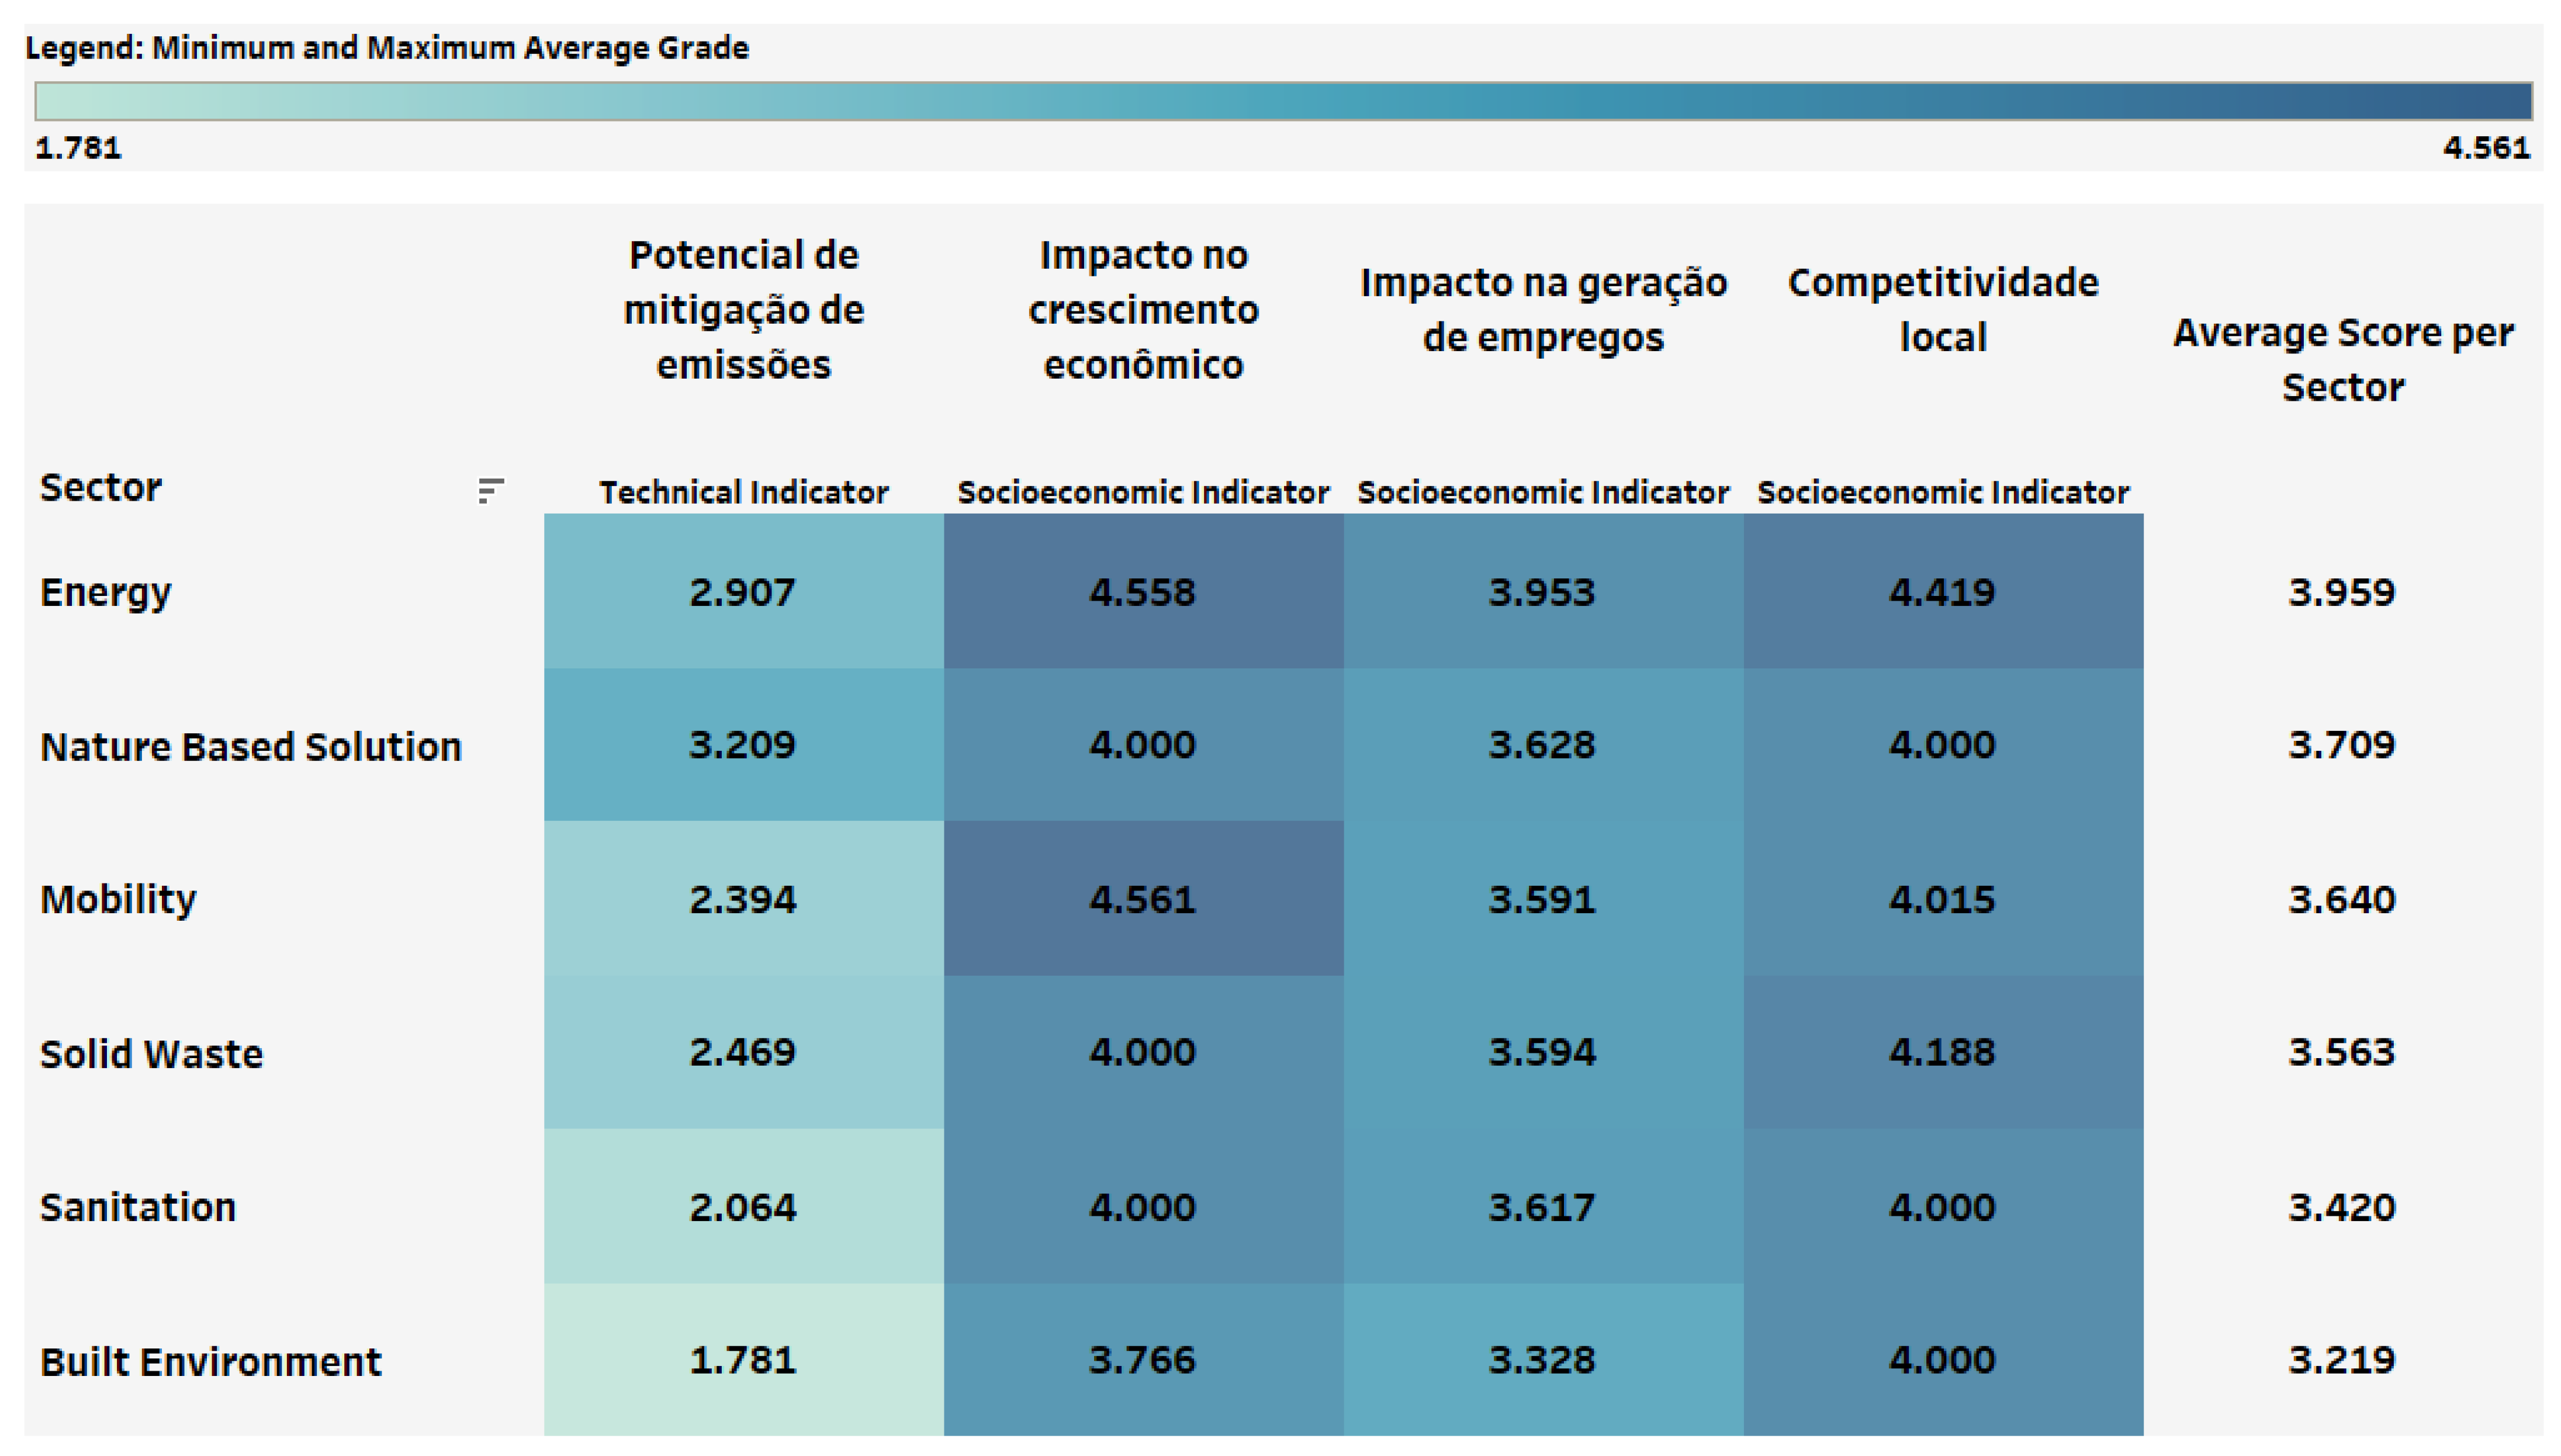
3.1. Translating IAM’s Results into Indicators

On the basis of the differences between the baseline and COP26 scenarios, impact indicators were generated to represent the effect of adopting a specific solution. For example, when it comes to the adoption of electromobility solutions, the indicators represent the effect that this technical change (COP26 scenario) has regarding internal combustion engine vehicles (baseline scenario).
As such, we estimated the socioeconomic and emission mitigation impacts for all thematic areas of OICS platform. Table 2 presents the results of the BLUES–EFES model in terms of emission mitigation, job creation, economic growth, and local competitiveness for thematic and intervention areas. Appendix A presents the compatibility between the modeling sectors and the OICS intervention areas.

3.1.1. The Role of Each Sector in Promoting Socioeconomic Growth

The OICS’s solutions, distributed within the respective thematic areas, have the potential to contribute to an increase in economic growth of 0.01% to 0.1%. In other words, the adoption of the solutions could result in a GDP increase in the order of 0.01% to 0.1% in the short term.
The results indicate that OICS’s solution could contribute to job creation. The employment results ranged from 0.01 to 0.04% in the short term; therefore, they were of a smaller magnitude than that of the projected impacts in terms of economic growth. The sectors and solutions that presented the best performance of GDP contribution, such as the energy sector and mobility, stood out. Thus, the solutions linked to distributed renewable electricity generation, smart and innovative electrical systems, and electromobility have greater potential for job creation in the urban environment.
The OICS’s solutions improved the local competitiveness indicator from 0.02 to 0.04%. The thematic area of energy stood out with solutions with a greater gain in capital and labor productivity. Solutions involving energy storage, energy management projects, mechanisms, and tools in the thematic area of energy, the energy use of waste in the thematic area of solid waste, and vehicles powered by biofuel solutions in the mobility area implied an increase of 0.04% in local competitiveness. On the other hand, solutions associated with nature-based solutions showed increases of around 0.02%; although positive, they showed the lowest potential contribution to local competitiveness.

3.1.2. The Potential Contribution of OICS Solutions for Emission Reduction

The OICS’s solution could contribute to mitigating GHG emissions in urban environments. In the case of the thematic areas of the built environment, mobility, and energy, we highlight the potential for reducing emissions of new building materials, electromobility, and intelligent and innovative electricity systems, respectively. In fact, less carbon-intensive options that replace concrete, and electricity replacing fossil fuels in heat process generation and mobility, play a central role in urban sustainability and a low-carbon transition in the economy.
The energy use of waste, technologies that reduce water consumption in buildings, and plans aimed at the adoption of nature-based mechanisms have the greatest potential for reducing emissions in the sectors of solid waste, sanitation, and nature-based solutions, respectively. Among the solutions with the greatest impact in these areas of intervention are the energy use of generated biogas in landfills, systems for the rational use of water in showers and toilets, and plans for the prevention, monitoring, and control of fires in urban and periurban areas.
From these results, grades were attributed regarding the ability of the solutions to contribute to emission reduction, economic growth, job creation, and competitiveness. Table 1 was used as a reference for this classification. Then, the solutions with their respective notes linked to the indicators were incorporated into the OICS platform, allowing for the solutions to be ranked. The following sections present the results of the ranking of the OICS solutions, and the best solutions by thematic area and challenge.

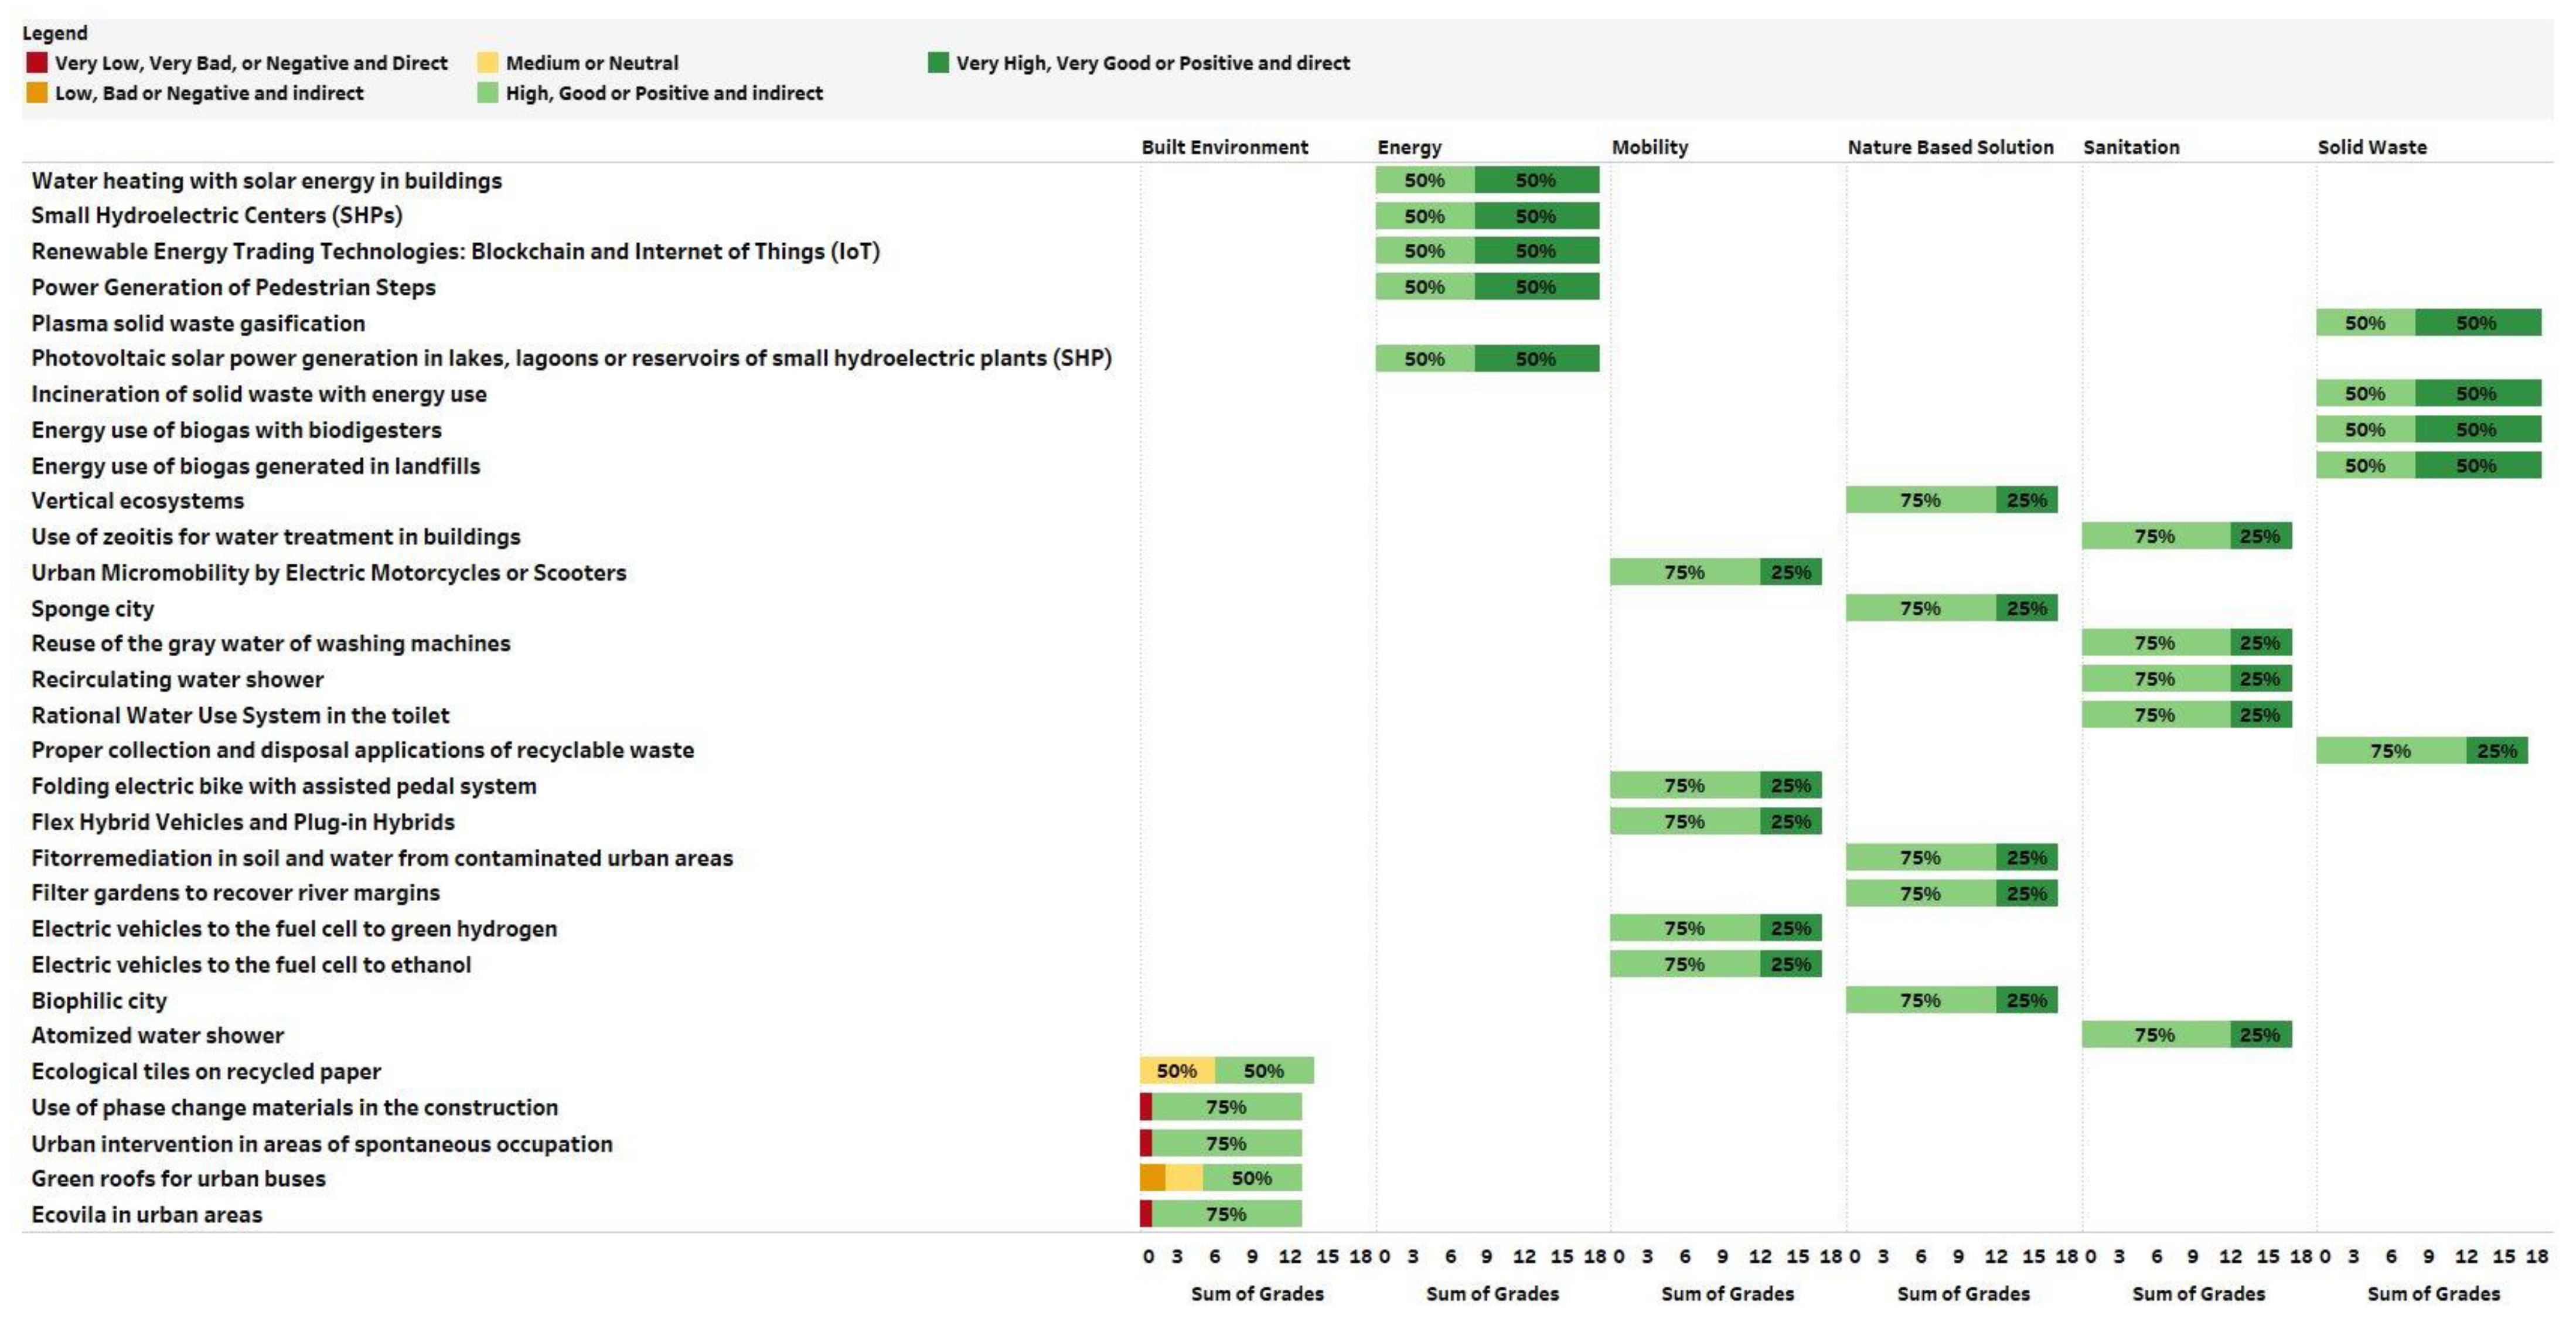
3.2. Ranking the Top Solutions at the Urban Level

Our results indicate that, of the OICS’s six thematic areas, the ones with the highest score were the energy sector followed by nature-based solutions and the mobility sector. Figure 4 shows the average of scores assigned to solutions grouped by thematic area and by indicator. In general, the solutions had an average impact ranging between neutral (3) and positive (4). The amplitude of the result between the sectors was low (3.9 to 3.2), with the energy sector having the highest score, and the built environment having the lowest score. There was, accordingly, a broad tendency for platform solutions to be consistent with various aspects of the Sustainable Development Goals such as emission rates, economic attractiveness, and job creation.
Among the most affected indicators, economic growth, job creation indices, and local competitiveness stood out, which illustrates the potential of sustainable solutions to increase the quantity and improve the quality of goods and services that society produces, and increase the number of employees. Regarding the potential for mitigating emissions, thematic area analysis reveals that nature-based solutions could especially contribute to achieving the COP26 scenario. Two main factors determined this result: (i) the natural power of plants to store CO2 and (ii) the structural changes in urban form proposed by some solutions.
For example, the vertical ecosystem, which was the best-ranked solution in nature-based solutions, is an innovative concept that includes vertical gardens and plant facades that remove CO2 compared to traditional solutions for urban facades [28]. Another solution is the concept of “biophilic cities” [28], which integrates nature into urban design and planning, redefining urban spaces for a more sustainable, green, and compact environment. As a consequence, nature-based solutions tend to achieve better performance regarding their potential to mitigate emissions compared to other sectors.
We also highlighted the top 5 solutions by thematic area (Figure 5). The highest-ranked solutions in the energy thematic area were related to the promotion of renewable sources in the urban environment and Internet of Things (IoT) technologies. In the second level, with the same score, the thematic area of solutions based on nature, sanitation, solid-waste management, and mobility stand out. Some of these solutions were the vertical ecosystem and sponge cities in the nature-based solution sector. Concerning sanitation solutions, the use of zeolite for water treatment, and the reuse and control system for water use were prominent. Appropriate collection and recycling, and the transformation of waste into energy are examples of solid-waste solutions. In terms of mobility, micromobility and electrification solutions are highlighted. Lastly, on a third level are the built environment solutions that include the promotion of ecological tiles, thermal building materials, and urban interventions.
In conclusion, our findings enable the integrative evaluation of urban sustainable solutions, taking into account four factors: greenhouse gas emission rate, economic attractiveness, job generation, and local competitiveness.

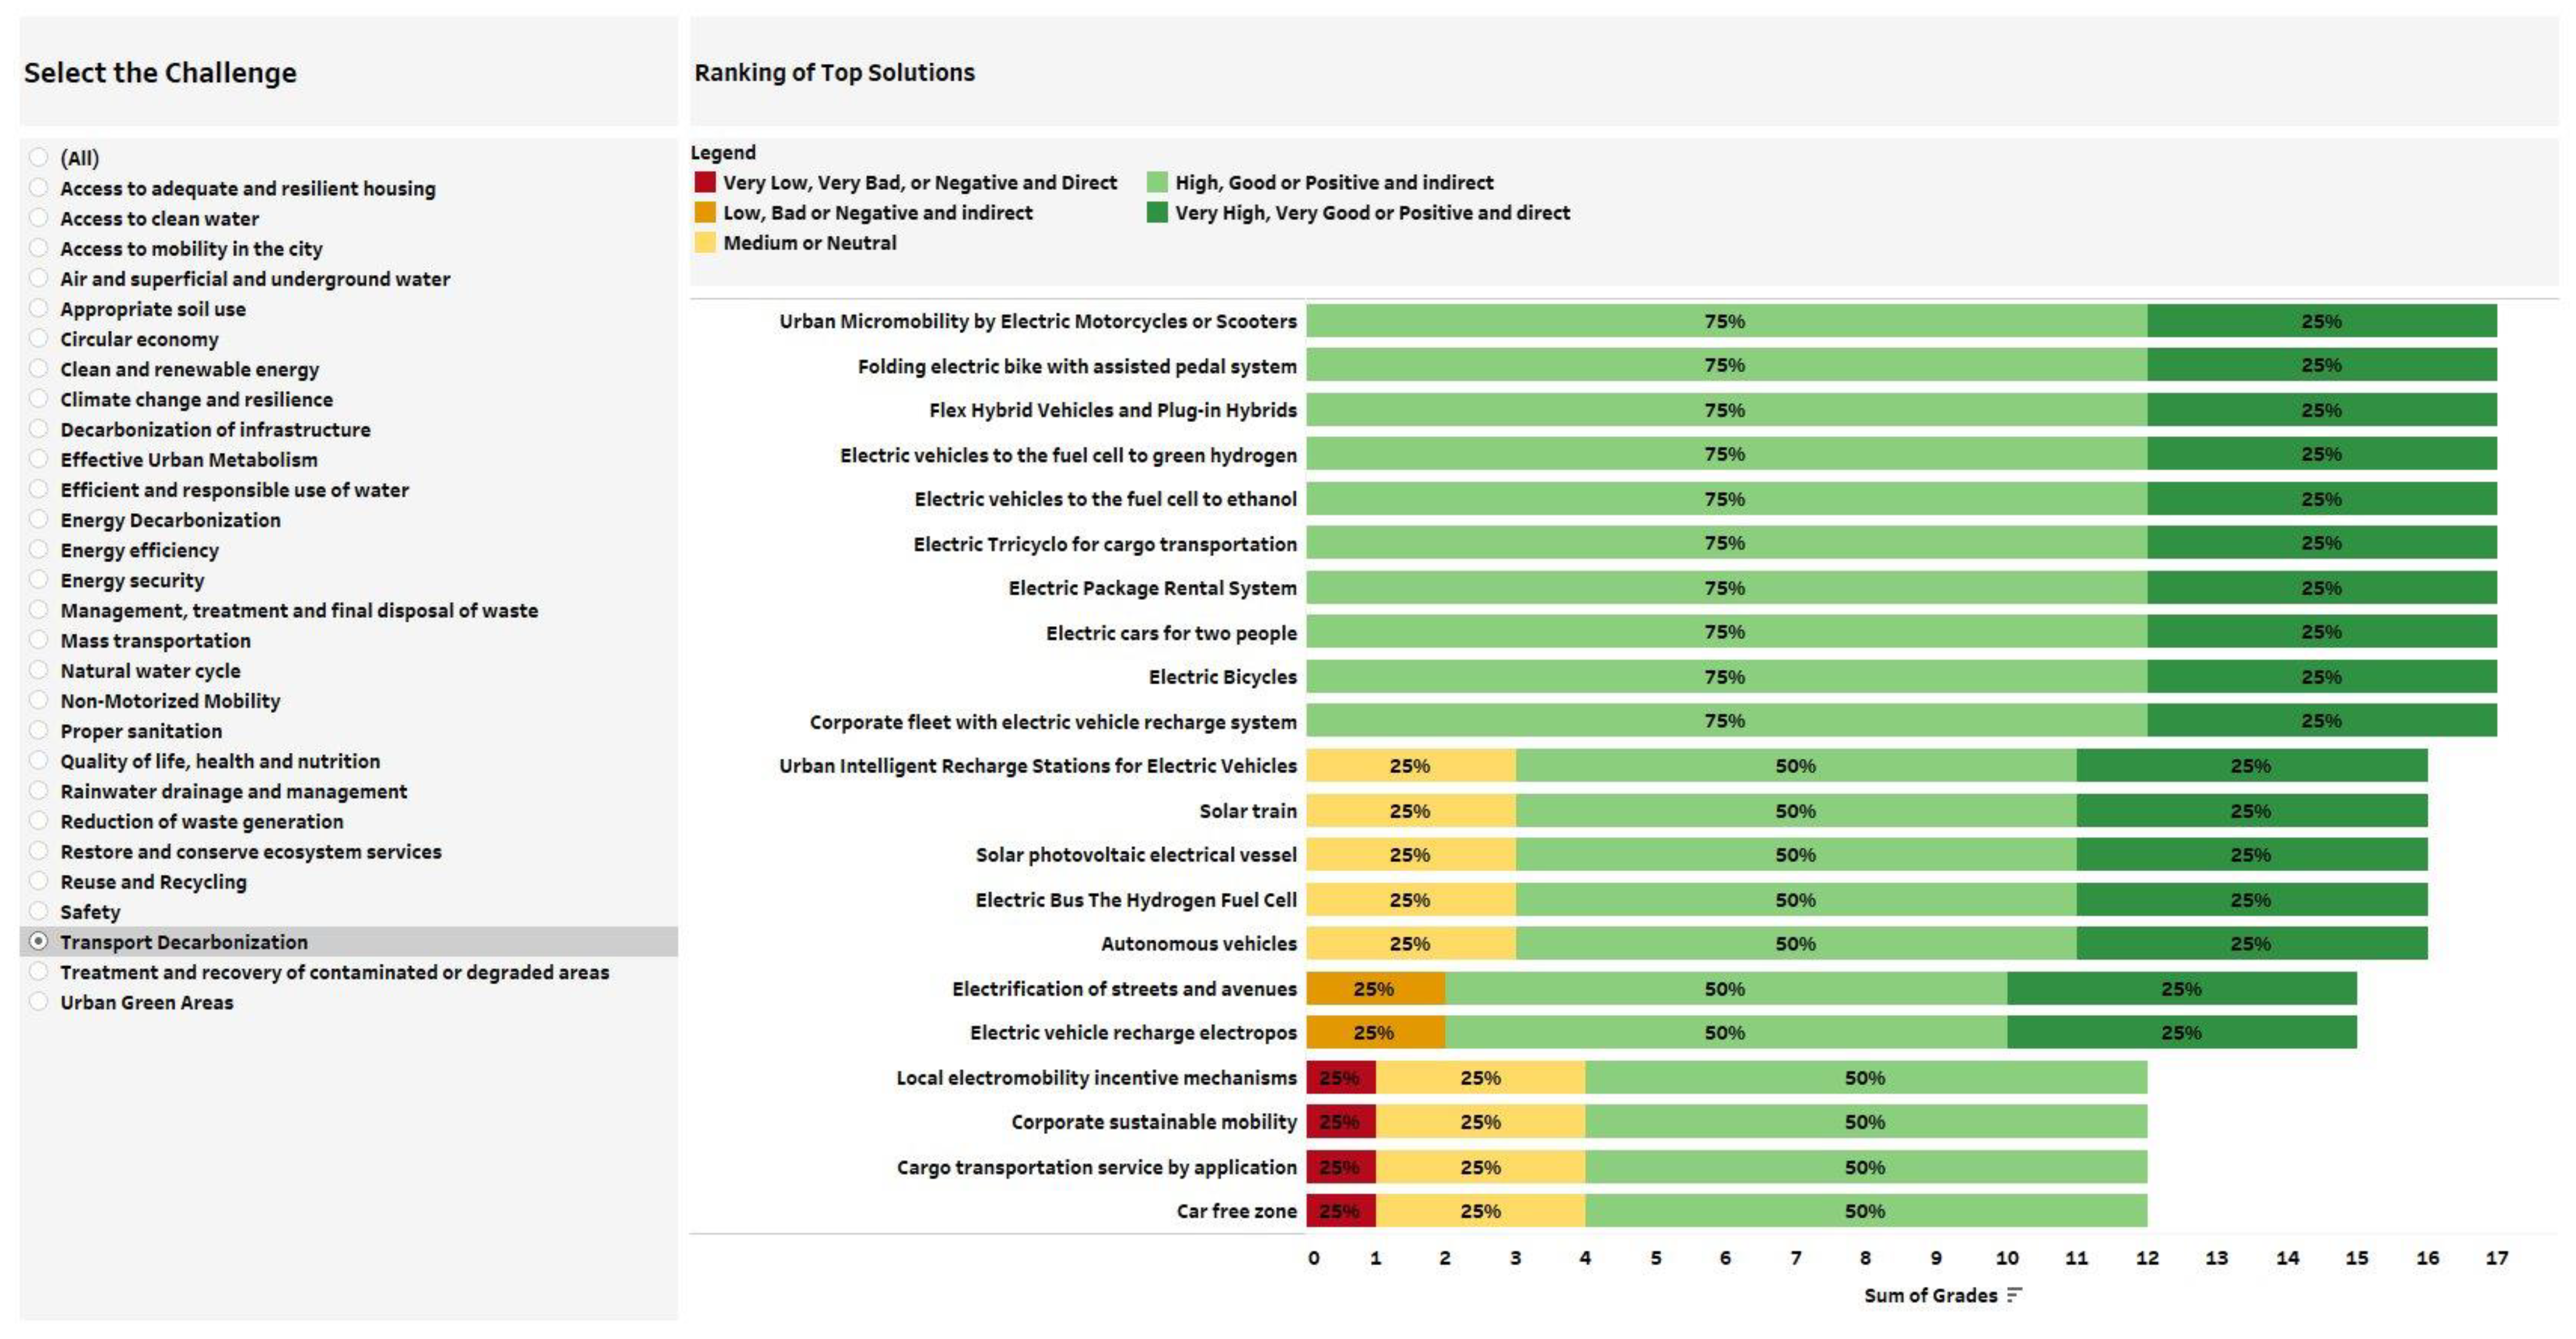
3.3. Ranking the Top Urban Solutions by Challenge

Figure 6 illustrates how the tool can be used. In short, as indicated on the left-hand side of the panel, the solutions were categorized into 28 challenges. This allowed for us to choose a particular challenge and obtain the best-classified solutions for the demand in question, indicated on the right-hand side of the panel.
For example, if we chose the transport decarbonization challenge, the ranking of the solutions that received the best scores was automatically displayed on the right-hand side of the panel. In this instance, the highest-scoring solutions involved alternative propulsion technologies, such as electric motors and fuel cells. As shown, this set of solutions scored 17 points. This result also illustrates another aspect of the methodology. There was no differentiation between the technologies that promoted vehicular electrification, that is, a bicycle and an electric vehicle had the same mitigation potential in the methodology because of the intervention areas created between the integrated model and the set of OICS platform solutions. The intervention areas classified and grouped the solutions according to their thematic correspondence in the models. Thus, the methodology does not include the differentiation of the potential between solutions from the same group; therefore, the solutions presented the same score). Three (75%) of the indicators received a score of 4, and one (25%) of the indicators received a score of 5. This result is in line with the vast majority of the current studies on transport decarbonization that indicate alternative motor propulsion solutions and the miniaturization of vehicles.
Likewise, other challenges could be selected, and the best solutions are displayed below, allowing for visualizing the top available solutions in the platform that are suitable to each challenge.

4. Discussion

In this section, we discuss the policy implication of our results, addressing the policy barriers to implementing the top solutions (Section 4.1) and what local governments can do in the face of structural constraints (Section 4.2).

4.1. Political Barriers to Implementing Solutions

According to the results, the solutions that had the greatest potential for impact belonged to groups of advanced technologies. Often, these solutions are at earlier stages of technological readiness. Hence, they are not widely commercialized, which imposes a challenge on implementation at the urban level.
Thus, Fuhr and Gonzales-Iwanciw [29,30] argued that, for urban sustainability policies to be successful, collaborations between and within different levels of government are necessary, and with the business community. For example, for Di Gregorio [31], it is essential to align local and national policies because fiscal, tax, and sectoral policies affect the development and availability of solutions while indicating society’s commitment to sustainable development.
Furthermore, Hammer et al. [8] added that the ability of municipalities to actively influence a sustainable growth strategy varies greatly. While some urban authorities enjoy significant political power or influence over different geographic areas, others have much more limited scope or political competence. Hence, there are several structural obstacles to the development of a sustainable economy that is based on the actions of cities and local governments.
To overcome this barrier, Bulkeley and Ryan [32,33] suggested that the implementation of sustainability solutions by cities is shaped by forms of governance that go beyond urban limits and require a multilevel governance program (MLG) that combines vertical and horizontal policies with decentralized adaptive governance. In this way, an MLG allows for the promotion of local initiatives and networks for the dissemination of best practices at the national level. Therefore, this is a challenge for the current Brazilian structure that strongly concentrates climatic decisions at the national level [34].

4.2. What Local Governments Can Do

Despite the identified political barriers for the implementation of top solutions at Brazilian municipalities, city officials could encourage the development of solutions through regulation, awareness programs, and purchases, as we briefly discuss below by thematic area.
For the thematic area of energy, as our results demonstrate, solutions with the greatest potential are related to the development of new technologies, intensive in capital and innovation, as is the case of blockchain solutions and energy generation via pedestrian steps. On the other hand, as Lo [35] indicated, authorities at the urban level could buy renewable energy to operate their regional facilities, thus encouraging photovoltaic generation solutions in water reservoirs, water heating using sunlight, and biofuel, among other solutions described in the database.
For mobility, our results indicate the high potential of electric vehicles, bicycles, and other micromobility solutions for moving both cargo and people in the urban perimeter. In this context, according to Glazener [36], local governments could act as regulatory authorities, managers of public transport and road systems, and buyers. In this regard, many cities have established procurement policies that require local fleets to transition to alternative fuels.
The analysis of solid-waste management solutions, in turn, indicated the high potential of transforming urban waste into energy and recycling solid waste. For this thematic area, Hammer et al. [8] argued that municipalities have considerable autonomy in terms of who collects waste and how, where and how they dispose of it, and which waste is directed for recycling or reuse. Thus, municipalities can act as regulators, encouraging the adoption of solutions while generating new jobs and economic growth [37,38].
With regard to nature-based solutions, local authorities such as landowners and development planners could establish land-use policies to improve urban resilience and restore ecosystem services [8,39]. In these circumstances, our results indicate the high potential of applying phytoremediation and bioremediation solutions to contaminated areas in addition to parks, gardens, and community gardens that are not intensive with regard to new technologies.
Regarding sanitation, while municipal governments may play a limited role in advancing technological solutions and processes identified as priorities in our study (e.g., nanotechnologies, chemistry, recycled wastewater, and seawater desalination), cities could implement these practices in public facilities [40,41].
For the thematic area of the built environment, our analysis identified that new materials, such as ecological tiles produced from recycled paper, bamboo urban furniture, and sustainable plastic wood are solutions that have a high economic and environmental impact. In this respect, building codes are one of the most important policy levers in developing solutions, as indicated by [42,43].

5. Conclusions

Cities are a key contributor to climate change; therefore, they need a coordinated approach to develop sustainable solutions. In this paper, we shed light on the role of cities in the transition to sustainable development, and how they can promote the UN 2030 Agenda in an integrated fashion. To this end, we coupled integrated assessment models with an urban solution database. More specifically, the EFES and BLUES models, and the Innovation Observatory for Sustainable Cities database were used.
The modeling tools, through the baseline and COP26 scenarios, provided proxies for the construction of indicators for evaluating the mitigation potential, economic growth, and job creation of the solutions contained in the OICS. With these parameters, the solutions were classified using a 5-level scale (1 to 5), scoring whether the degree of impact of the solution was negative (1), neutral (3), or positive (5). Lastly, the solutions were ranked and classified according to the main challenge they aid in resolving. The applied methodology incorporates a process of rationality and prioritization to the observatory’s database of solutions. It allows for users to browse the database, prioritizing solutions given the challenge of interest.
The solutions that obtained the best marks were those related to the energy sector, especially renewable sources and grid management, followed by solutions for the treatment and reuse of water and solid waste. The electrification of transport, the promotion of micromobility, and green areas in the urban perimeter also obtained good marks.
These results must, however, be seen in the light of caveats. First, the platform solutions were not evaluated individually, but through clusters that allowed for identifying areas of intervention. Second, the classifying criteria bound the solutions to a single thematic area, and a solution may generally include more than one areas or challenges.
Hence, three messages stand out: (i) the developed methodology is unique in the literature and demonstrates potential for transforming technical–economic trajectories into indicators for sustainable solutions; (ii) the solutions with the greatest impact were often related to new technologies, and depend on institutional and financial arrangements that are beyond the administrative capacity of the vast majority of municipalities; (iii) even in the face of limitations, cities can act as regulators or buyers, or provide financial incentives and advocacy to promote solutions in the urban environment.

Author Contributions

Formal analysis, E.V.-A., M.I. and L.B.B.; Writing—original draft, C.C., T.T. and A.C.O.F.; Writing—review & editing, E.H., E.D., A.M., F.P., A.P., A.F.P.L. and R.S. All authors have read and agreed to the published version of the manuscript.

Funding

The document and the research behind it would not have been possible without the financial and administrative support provided by the Global Environment Facility (GEF) and the United Nations Environment Programme (UNEP), respectively, under the ‘Cities-IAP: Promoting Sustainable Cities in Brazil through Integrated Urban Planning and Innovative Technologies Investment (CITinova) project’. In particular, we thank the staff of the Center for Strategic Studies and Management (CGEE) and Innovation Observatory for Sustainable Cities (OICS) for financial support, database access, and review of this material.

Institutional Review Board Statement

Not applicable.

Informed Consent Statement

Not applicable.

Data Availability Statement

Consult the authors for data access.

Acknowledgments

We thank the CITinova project’s climate and economics expert, Régis Rathmann, for the technical coordination and review of this study.

Conflicts of Interest

The authors declare no conflict of interest.

Appendix A

This appendix presents the economic sectors of the IAM modeling that are compatible with the areas of intervention and with the thematic areas of the OICS solutions database (see Table A1).
Table A1. Compatibility between thematic areas of OICS solution and BLUES-EFES modeling sectors.
Thematic AreaSolution Intervention AreaCorresponding Economic Sectors
Built EnvironmentBuilding materialsExtraction of iron ore; pig iron and iron alloys; cement
Building systems and technologiesExtraction of iron ore; pig iron and iron alloys; cement; construction
Building design strategies and urban designConstruction; trade; feeding; accommodation; public and private education; public and private health; services of architecture, engineering, technical tests/analysis; other professional, scientific, and technical activities
Design and evaluation methodologies and toolsArchitectural and engineering services, technical tests/analysis; other professional, scientific, and technical activities
MobilityElectrification of mobilityElectrical energy; ground transport; water transport
Transport sharing systemsElectrical energy; ground transport; waterway transport; water transport; systems development; services of architecture, engineering, technical tests/analysis; other professional, scientific, and technical activities
Methods, projects, plans, services, and mechanisms of sustainable urban mobilityArchitectural and engineering services, technical tests/analysis; other professional, scientific, and technical activities
Innovative urban mobility technologiesGround transport; waterway transport; water transport; development of systems and other information services
Sustainable mobility infrastructureConstruction; ground transport; water transport
Vehicles powered by biofuelsGround transport; waterway transport; manufacture of biofuels
EnergyRenewable or distributed electricity generationElectrical energy
Smart and innovative electricity systemsElectrical energy; water, sewage, and waste management
Energy storageElectrical energy; services of architecture, engineering, technical tests/analysis; other professional, scientific, and technical activities
Energy management projects, mechanisms, and toolsServices of architecture, engineering, technical tests/analysis; other professional, scientific, and technical activities
Biofuel production and carbon captureManufacture of biofuels
Sanitation: Solid WasteEnergy use of wasteRefining oil and petrol coke; electricity, natural gas, and other utilities; water, sewage, and waste management
Conventional techniques for the collection, treatment, or disposal of solid wasteWater, sewage, and waste management; construction; ground transport; waterway transport; air transport
Recycling, reuse, and reuse of wasteManufacture of textile products; water, sewage, and waste management; construction; feeding
Methods, tools, demand management and other sustainable waste management mechanismsServices of architecture, engineering, technical tests/analysis; other professional, scientific, and technical activities
Innovative technologies or processes for mitigating the disposal of solid wasteWater, sewage, and waste management; ground transport; waterway transport; air transport
Sanitation: WaterTechnologies that increase efficiency in water consumption in buildingsManufacture of electrical machinery and equipment; water, sewage, and waste management
Conventional water treatment and reuse processes, systems, and techniquesWater, sewage, and waste management; services of architecture, engineering, technical tests/analysis; other professional, scientific, and technical activities
Innovative techniques for water supply, treatment, reuse, and reuseManufacture of textile products; manufacture of rubber products and plastic material; manufacture of electrical machinery and equipment; water, sewage, and waste management
Methods, tools, mechanisms, and management processes applied to the sanitation and supply chainServices of architecture, engineering, technical tests/analysis; other professional, scientific, and technical activities; manufacture of electrical machinery and equipment; water, sewage, and waste management
Techniques for removing plastic from waterManufacture of rubber products and plastic material; water, sewage, and waste management
Nature-based solutionsTechniques and processes applied to food productionAgriculture, forestry, forestry; livestock farming, including livestock support
Nature-based infrastructureAgriculture, forestry, forestry; livestock farming, including livestock support; forest production; fisheries and aquaculture; construction; manufacture of wood products; production of pig iron/ferroalloys
Conservation, monitoring, recovery and renaturalization of ecosystems and basinsAgriculture, forestry, forestry; livestock farming, including livestock support; forest production; fisheries and aquaculture; other professional, scientific, and technical activities
Innovative technologies and techniques for the restoration of urban flora and faunaAgriculture, forestry, forestry; livestock farming, including livestock support; forest production; fishing and aquaculture
Nature-based methods, plans, services, and mechanismsServices of architecture, engineering, technical tests/analysis; other professional, scientific, and technical activities

References

  1. ONU. Nova Agenda Urbana: Declaração de Quito sobre Cidades e Assentamentos Humanos Sustentáveis para Todos em Conferência das Nações Unidas sobre Habitação e Desenvolvimento Urbano Sustentável (Habitat III) A Nova Agenda Urbana adotada na Conferência das Nações Unidas sobre Habitação e Desenvolvimento Urbano Sustentável (Habitat III), 20 de de Outubro de 2016, Quito (Equador). 2016. Available online: https://habitat3.org/wp-content/uploads/NUA-Portuguese-Brazil.pdf (accessed on 24 November 2022).
  2. IEA. Empowering Cities for a Net Zero Future, IEA, Paris. 2021. Available online: https://www.iea.org/reports/empowering-cities-for-a-net-zero-future (accessed on 24 November 2022).
  3. Van der Heijden, J. Studying urban climate governance: Where to begin, what to look for, and how to make a meaningful contribution to scholarship and practice. Earth Syst. Gov. 2019, 1, 100005. [Google Scholar] [CrossRef]
  4. IPCC. Summary for Policymakers. In Climate Change 2022: Impacts, Adaptation and Vulnerability; Pörtner, H.-O., Roberts, D.C., Poloczanska, E.S., Mintenbeck, K., Tignor, M., Alegría, A., Craig, M., Langsdorf, S., Löschke, S., Möller, V., et al., Eds.; Contribution of Working Group II to the Sixth Assessment Report of the Intergovernmental Panel on Climate Change; Cambridge University Press: Cambridge, UK; New York, NY, USA, 2022; pp. 3–33. [Google Scholar] [CrossRef]
  5. GCoM—Global Covenant of Mayors for Climate & Energy, 2022. The Largest Global Alliance for City Climate Leadership. Available online: https://www.globalcovenantofmayors.org/who-we-are/ (accessed on 24 November 2022).
  6. Huang, Y.; Tian, Z.; Ke, Q.; Liu, J.; Irannezhad, M.; Fan, D.; Hou, M.; Sun, L. Nature-based solutions for urban pluvial flood risk management. Wiley Interdiscip. Rev. Water 2020, 7, e1421. [Google Scholar] [CrossRef]
  7. Santamouris, M.; Kolokotsa, D. Urban Climate Mitigation Techniques; Routledge: Oxford, UK, 2016. [Google Scholar]
  8. Hammer, S.; Kamal-Chaoui, L.; Robert, A.; Plouin, M. Cities and Green Growth: A Conceptual Framework; OECD Regional Development Working Papers, No. 2011/08; OECD Publishing: Paris, France, 2011. [Google Scholar] [CrossRef]
  9. Miller, H.; Clifton, K.; Akar, G.; Tufte, K.; Gopalakrishnan, S.; MacArthur, J.; Irwin, E.; Ramnath, R.; Stiles, J. Urban Sustainability Observatories: Leveraging Urban Experimentation for Sustainability Science and Policy. Harv. Data Sci. Rev. 2021, 3, 2. [Google Scholar] [CrossRef]
  10. Sustainable Cities Programme (PCS). Sustainable Cities Platform. Available online: https://www.cidadessustentaveis.org.br/inicial/home (accessed on 14 November 2022).
  11. Center for Strategic Studies and Management (CGEE). Innovation Observatory for Sustainable Cities (OICS). Available online: https://oics.cgee.org.br/ (accessed on 14 November 2022).
  12. UN. A/RES/70/1—Transforming Our World: The 2030 Agenda for Sustainable Development. Seventieth United Nations General Assembly, New York. 2015. Available online: https://sdgs.un.org/2030agenda (accessed on 24 November 2022).
  13. Brasil. Ministério das Relações Exteriores. Apresentação da Contribuição Nacionalmente Determinada do Brasil perante o Acordo de Paris. 2022. Available online: https://unfccc.int/sites/default/files/NDC/2022-06/Updated%20-%20First%20NDC%20-%20%20FINAL%20-%20PDF.pdf (accessed on 14 November 2022).
  14. da Silva, F.T.; Szklo, A.; Vinhoza, A.; Nogueira, A.C.; Lucena, A.F.; Mendonça, A.M.; Marcolino, C.; Nunes, F.; Carvalho, F.M.; Tagomori, I.; et al. Inter-sectoral prioritization of climate technologies: Insights from a Technology Needs Assessment for mitigation in Brazil. Mitig. Adapt. Strateg. Glob. Chang. 2022, 27, 48. [Google Scholar] [CrossRef]
  15. Grubler, A.; Wilson, C.; Bento, N.; Boza-Kiss, B.; Krey, V.; Mccollum, D.L.; Rao, N.D.; Riahi, K.; Rogelj, J.; De Stercke, S.; et al. A low energy demand scenario for meeting the 1.5 °C target and sustainable development goals without negative emission technologies. Nat. Energy 2018, 3, 515–527. [Google Scholar] [CrossRef] [Green Version]
  16. Rogelj, J.; Shindell, D.; Jiang, K.; Fifita, S.; Forster, P.; Ginzburg, V.; Handa, C.; Kheshgi, H.; Kobayashi, S.; Kriegler, E.; et al. Global Warming of 1.5 °C. An IPCC Special Report on the impacts of global warming of 1.5 °C above pre-industrial levels and related global greenhouse gas emission pathways, in the context of strengthening the global response to the threat of climate change, sustainable development, and efforts to eradicate poverty. In Mitigation Pathways Compatible with 1.5 °C in the Context of Sustainable Developmen; IPCC/WMO: Geneva, Switzerland, 2018; pp. 93–174. [Google Scholar]
  17. Gambhir, A.; Drouet, L.; Mccollum, D.; Napp, T.; Bernie, D.; Hawkes, A.; Fricko, O.; Havlik, P.; Riahi, K.; Bosetti, V.; et al. Assessing the feasibility of global long-term mitigation scenarios. Energies 2017, 10, 89. [Google Scholar] [CrossRef] [Green Version]
  18. Cunha, B.S.; Garaffa, R.; Gurgel, Â.C. TEA Model Documentation. 2020. Available online: https://www.iamcdocumentation.eu/index.php/Model_Documentation_-_COFFEE-TEA (accessed on 18 February 2023).
  19. Rochedo, P.R.; Costa, I.V.; Império, M.; Hoffmann, B.S.; Merschmann, P.R.D.C.; Oliveira, C.C.; Szklo, A.; Schaeffer, R. Carbon capture potential and costs in Brazil. J. Clean. Prod. 2016, 131, 280–295. [Google Scholar] [CrossRef]
  20. Rochedo, P.R.R.; Soares-Filho, B.; Schaeffer, R.; Viola, E.; Szklo, A.; Lucena, A.F.P.; Koberle, A.; Davis, J.L.; Rajão, R.; Rathmann, R. The threat of political bargaining to climate mitigation in Brazil. Nat. Clim. Chang. 2018, 8, 695–698. [Google Scholar] [CrossRef]
  21. Köberle, A. Implementation of Land Use in an Energy System Model to Study the Long-Term Impacts of Bioenergy in Brazil and its Sensitivity to the Choice of Agricultural Greenhouse Gas Emission Factors. Ph.D. Thesis, Universidade Federal do Rio de Janeiro, Rio de Janeiro, Brazil, 2018. Available online: http://www.ppe.ufrj.br/index.php/pt/publicacoes/teses-e-dissertacoes/2018/130-implementation-of-land-use-in-an-energy-system-model-to-study-the-long-term-impacts-of-bioenergy-in-brazil-and-its-sensitivity-to-the-choice-of-agricultural-greenhouse-gas-emission-factors (accessed on 18 February 2023).
  22. Haddad, E.A.; Domingues, E.P. EFES-Um modelo aplicado de equilíbrio geral para a economia brasileira: Projeções setoriais para 1999–2004. Estud. Econômicos 2001, 31, 89–125. [Google Scholar]
  23. Horridge, M. The TERM Model and Its Data Base; Centre of Policy Studies—General Paper n. G-219; Centre of Policy Studies: Melbourne, Australia, 2011; p. 21. [Google Scholar]
  24. IBGE—Instituto Brasileiro de Geografia e Estatística. Coordenação de População e Indicadores Sociais. In Projeções da População: Brasil e Unidades da Federação: Revisão 2018; IBGE: Rio de Janeiro, Brazil, 2018. [Google Scholar]
  25. Altenburg, T.; Rodrik, D. Green Industrial Policy. Concept, Policies, Country Experiences; UN Environment; German Development Institute/Deutsches Institut für Entwicklungspolitk (DIE): Geneva, Bonn, 2017. [Google Scholar]
  26. UN Brazil. Transformando Nosso Mundo: A Agenda 2030 para o Desenvolvimento Sustentável. 2019. Available online: https://nacoesunidas.org/pos2015/agenda2030/ (accessed on 31 May 2019).
  27. SDG Strategy. SDGs Strategy. 2019. Available online: https://www.rbadvisors.no/sdg-strategy (accessed on 31 May 2019).
  28. OICS. Home—OICS. 2022. Available online: https://oics.cgee.org.br/solucoes-e-casos/solucoes (accessed on 18 February 2023).
  29. Fuhr, H.; Hickmann, T.; Kern, K. The role of cities in multi-level climate governance: Local climate policies and the 1.5 °C target. Curr. Opin. Environ. Sustain. 2018, 30, 1–6. [Google Scholar] [CrossRef]
  30. Gonzales-Iwanciw, J.; Dewulf, A.; Karlsson-Vinkhuyzen, S. Learning in multi-level governance of adaptation to climate change–a literature review. J. Environ. Plan. Manag. 2020, 63, 779–797. [Google Scholar] [CrossRef] [Green Version]
  31. Di Gregorio, M.; Fatorelli, L.; Paavola, J.; Locatelli, B.; Pramova, E.; Nurrochmat, D.R.; May, P.H.; Brockhaus, M.; Sari, I.M.; Kusumadewi, S.D. Multi-level governance and power in climate change policy networks. Glob. Environ. Chang. 2019, 54, 64–77. [Google Scholar] [CrossRef]
  32. Bulkeley, H.; Betsill, M. Rethinking Sustainable Cities: Multilevel Governance and the “Urban” Politics of Climate Change. Environ. Politics 2005, 14, 42–63. [Google Scholar] [CrossRef]
  33. Ryan, D. From commitment to action: A literature review on climate policy implementation at city level. Clim. Chang. 2015, 131, 519–529. [Google Scholar] [CrossRef]
  34. De Souza Leao, E.B.; Andrade, J.C.S.; Nascimento, L.F. Recife: A climate action profile. Cities 2021, 116, 103270. [Google Scholar] [CrossRef]
  35. Lo, K. Urban carbon governance and the transition toward low-carbon urbanism: Review of a global phenomenon. Carbon Manag. 2014, 5, 269–283. [Google Scholar] [CrossRef]
  36. Glazener, A.; Khreis, H. Transforming Our Cities: Best Practices Towards Clean Air and Active Transportation. Curr. Environ. Health Rep. 2019, 6, 22–37. [Google Scholar] [CrossRef]
  37. Santin, J.R.; Pedrini, M.; Comiran, R. The national solid waste policy and the brazilian municipalities: Challenges and possibilities/a politica nacional dos residuos solidos e os municipios brasileiros: Desafios e possibilidades. Direito da Cidade 2017, 9, 556–582. [Google Scholar]
  38. Singh, R.P.; Tyagi, V.V.; Allen, T.; Ibrahim, M.H.; Kothari, R. An overview for exploring the possibilities of energy generation from municipal solid waste (MSW) in Indian scenario. Renew. Sustain. Energy Rev. 2011, 15, 4797–4808. [Google Scholar] [CrossRef]
  39. Ershad Sarabi, S.; Han, Q.L.; Romme, A.G.; de Vries, B.; Wendling, L. Key Enablers of and Barriers to the Uptake and Implementation of Nature-Based Solutions in Urban Settings: A Review. Resources 2019, 8, 121. [Google Scholar] [CrossRef] [Green Version]
  40. Orner, K.D.; Mihelcic, J.R. A review of sanitation technologies to achieve multiple sustainable development goals that promote resource recovery. Environ. Sci. Water Res. Technol. 2017, 4, 16–32. [Google Scholar] [CrossRef]
  41. Lerebours, A.; Scott, R.; Sansom, K.; Kayaga, S. Regulating sanitation services in sub-saharan africa: An overview of the regulation of emptying and transport of faecal sludge in 20 cities and its implementation. Util. Policy 2021, 73, 101315. [Google Scholar] [CrossRef]
  42. O’brien, W.; Tahmasebi, F.; Andersen, R.K.; Azar, E.; Barthelmes, V.; Belafi, Z.D.; Berger, C.; Chen, D.; De Simone, M.; d’Oca, S.; et al. An international review of occupant-related aspects of building energy codes and standards. Build. Environ. 2020, 179, 106906. [Google Scholar] [CrossRef]
  43. Shen, Z.; Fitriaty, P. Overview: Green City Planning and Practices in Asian Cities. In Green City Planning and Practices in Asian Cities: Sustainable Development and Smart Growth in Urban Environments; Springer: Berlin/Heidelberg, Germany, 2018; pp. 1–16. [Google Scholar] [CrossRef]
Figure 1. Methodological structure. Methodological framework: (1) Innovation Observatory for Sustainable Cities solutions were evaluated by thematic area (in blue); (2) two scenarios were created using integrated assessment models and allowed for the development of indicators of GHG mitigation potential and economic performance (in green); (3) OICS solution analysis based on indicators (in gray); (4) ranking of sustainable solutions available in the OICS database (in purple).
Sustainability 15 04766 g001
Figure 2. Exchange of information between integrated assessment models.
Sustainability 15 04766 g002
Figure 3. Compatibilization between the results of the BLUES–EFES model and the OICS intervention areas.
Sustainability 15 04766 g003
Figure 4. Average score by thematic area and indicator.
Sustainability 15 04766 g004
Figure 5. Top 5 solutions for each sector.
Sustainability 15 04766 g005
Figure 6. Classification of database solutions based on challenges of interest.
Sustainability 15 04766 g006
Table 1. Mitigation potential, employment, and GDP indicators.
Impact ClassGHG Emissions
Mitigation Potential
Average Annual
Variation in Jobs
Average Annual
Variation in GDP
Average Annual Variation in Capital and Labor Productivity
1 a≤5%≤−0.03%≤−0.04%≤−0.05%
2 b>5%
≤9%
>−0.03%
≤−0.02%
>−0.04%
≤−0.02%
>−0.05%
≤−0.02%
3 c>9%
≤14%
>−0.02%
≤0.01%
>−0.02%
≤0.01%
>−0.02%
≤0.01%
4 d>14%
≤19%
>0.01%
≤0.03%
>0.01%
≤0.04%
>0.01%
≤0.05%
5 e>19%>0.03%>0.04%>0.05%
a The solution, once implemented, had very low emission reduction potential and a very low impact on jobs, GDP, and competitiveness; b the solution, once implemented, had low emission reduction potential and a low impact on jobs, GDP, and competitiveness; c the solution, once implemented, had a median emission reduction potential and a median negative or positive impact on jobs, GDP, and competitiveness; d the solution, once implemented, had a high emission reduction potential and a high impact on job creation, GDP, and competitiveness; e the solution, once implemented, had a very high emission reduction potential and a very high impact on job creation, GDP, and competitiveness.
Table 2. Potential for emission mitigation and economic impacts by thematic and intervention areas.
Thematic AreaArea of InterventionMitigation PotentialGDP (%)Employment (%)Competitiveness (%)
Built environmentBuilding materials11%0.010.010.02
Building systems and technologies6%0.030.010.03
Building design strategies and urban design4%0.040.020.03
Design and evaluation methodologies and tools5%0.040.010.03
MobilityElectromobility18%0.060.030.02
Transport sharing systems17%0.050.020.02
Methods, projects, plans, services, and mechanisms of sustainable urban mobility5%0.030.010.02
Innovative urban mobility technologies10%0.050.020.03
Sustainable mobility infrastructure6%0.050.020.02
Vehicles powered by biofuel11%0.040.020.04
EnergyDistributed renewable electricity generation19%0.10.040.03
Smart and innovative electricity systems44%0.060.030.03
Energy storage10%0.050.020.04
Energy management projects, mechanisms, and tools5%0.040.010.04
Biofuel production and carbon capture9%0.030.020.03
Solid wasteEnergy use of waste53%0.030.020.04
Conventional techniques for the collection, treatment, or disposal of solid waste15%0.040.020.03
Recycling, reuse, and the reuse of waste6%0.030.020.03
Methods, tools, demand management and other sustainable waste management mechanisms5%0.040.010.03
Innovative technologies or processes for mitigating the disposal of solid waste26%0.040.020.03
SanitationTechnologies that improve water consumption efficiency in buildings29%0.030.020.02
Conventional water treatment and reuse processes, systems, and techniques26%0.030.020.03
Innovative techniques for water supply, treatment, reuse, and reuse13%0.030.020.02
Methods, tools, mechanisms, and management processes applied to the sanitation and supply chain5%0.040.010.03
Techniques for removing plastic from water17%0.030.020.02
Nature-based solutionsTechniques and processes applied to food production17%0.030.010.02
Nature-based infrastructure16%0.030.010.02
Conservation, monitoring, recovery and denaturalization of ecosystems and basins6%0.040.020.02
Innovative technologies and techniques for the restoration of urban flora and fauna18%0.040.020.02
Nature-based methods, plans, services, and mechanisms26%0.020.010.02
Disclaimer/Publisher’s Note: The statements, opinions and data contained in all publications are solely those of the individual author(s) and contributor(s) and not of MDPI and/or the editor(s). MDPI and/or the editor(s) disclaim responsibility for any injury to people or property resulting from any ideas, methods, instructions or products referred to in the content.

