Article

A Comprehensive In Situ Investigation on the Reinforcement of High-Filled Red Soil Using the Dynamic Compaction Method

1
College of Civil and Transportation Engineering, Shenzhen University, Shenzhen 518060, China
2
Key Laboratory for Resilient Infrastructures of Coastal Cities (MOE), College of Civil and Transportation Engineering, Shenzhen University, Shenzhen 518060, China
3
School of Civil Engineering, Tsinghua University, Beijing 100084, China
4
Institute of Foundation Research, China Academy of Building Research, Beijing 100013, China
5
Shanghai Shenyuan Geotechnical Engineering Co., Ltd., Shanghai 200040, China
*
Author to whom correspondence should be addressed.
Sustainability 2023, 15(6), 4756; https://doi.org/10.3390/su15064756
Submission received: 2 February 2023 / Revised: 4 March 2023 / Accepted: 7 March 2023 / Published: 7 March 2023
(This article belongs to the Special Issue Sustainability in Geology and Civil Engineering)

Abstract

:
High-filled red soil typically lacks sufficient bearing capacity, which can pose significant challenges when constructing building foundations. One economical and effective method for the reinforcement of high-filled red soil is the dynamic compaction (DC) method. However, the design parameters for reinforcing high-filled red soil using the DC method are largely based on experience, which indicates the significant value of field results of related engineering practice. In this paper, we report a field study that was carried out to investigate the effect of impact energy on the treatment of super-high-filled ground with red soil in southwestern Yunnan, China, where three pilot DC tests were designed and conducted with three different impact energies (4000 kN·m, 8000 kN·m and 15,000 kN·m). To evaluate the reinforcement effect and optimize the DC operational parameters, a series of in situ tests, including settlement monitoring, standard penetration tests, dynamic penetration tests, surface wave velocity tests and plate-load tests, were carried out. Furthermore, the improvement depth of DC was discussed. The results of the field study show that the characteristic value of the ground bearing capacity of the three test zones could reach 250 kPa, which coincides with the design requirement, although the improvement depth of testing zone III fails to reach the required depth. This study helps to improve the in situ recycling of high-filled soil, thereby promoting the sustainable development of engineering construction.

1. Introduction

As a traditional engineering material, soil has gained widespread usage in forming large areas of high-filling foundation. This application is particularly prevalent in mountainous areas, where high-filled sites are often implemented to achieve desired and level surfaces in construction projects such as highways, airports and refinery plants [1,2,3]. However, the use of loose and low-bearing-capacity high-filled soil can potentially jeopardize the stability and safety of a building’s foundation [4,5]. The primary cause of this issue is the utilization of non-engineered fillings, such as excavated soils in construction areas (e.g., tunneling works, road construction cuts and hill cuts), which are typically employed for cost efficiency and environmental protection reasons [6,7,8]. The original composition, microstructure and interparticle bonds of non-engineered filling are destroyed and regrouped during man-made excavation and backfilling [9]. Moreover, these non-engineered fillings are rarely scattered in thin layers and are well-compacted during the filling operation, which is often difficult and time-consuming. As a result, the settlement of such fillings can continue for years or even decades after completion [10,11,12,13] and can reach up to 0.5 to 30% of its depth under self-weight loading [14]. Therefore, this effect should be treated adequately to improve high-filled ground conditions.
Various improvement methods have been proposed and used to enhance high-filled sites, among which dynamic compaction (DC) is a preferential treatment and improvement method because of its cost-effectiveness, simplicity and considerable treatment depth, especially for high-filled sites with a large area and ground thickness [2,15,16,17,18]. The DC method involves repeated impact by dropping a tamper with a weight of 10 to 30 t from a height of 10 to 30 m on predetermined soil surfaces [19]. The powerful stress wave induced by the impact destroys the skeleton of the soil grains, decreases the porosity and compacts the ground, which effectively reduces the compressibility and improves the bearing capacity of the soil. For decades, the DC method has been widely used in geotechnical engineering to treat poor soils (e.g., desert sands, soft soils and collapsible loess) [5,20,21]. The results have shown that there are a number of influencing factors in DC design, including high-filled ground properties (e.g., filled thickness and type, groundwater level, and underlying original strata) and DC technique (e.g., weight and shape of the tamper, drop height and grid pattern) [22,23,24,25]. Generally, it is acknowledged that fill thickness and impact energy are the two dominant factors. For a super-high-filled ground, to obtain a better improvement, two methods can be applied: adapting several rounds of DC on every layered filling with a low impact energy, that is, low-energy dynamic compaction (LEDC), or using high-energy dynamic compaction (HEDC) (i.e., the impact energy is more than 8000 kN·m) [26,27]. However, these two methods have different treatment mechanisms, and different improvement results can be observed. For example, after a dynamic compaction of 25,000 kN·m on a gravel body with a large thickness, the reinforcement effect is not obvious in the range of 4 m on the surface layer but is obvious in the range of 4 to 16 m and still exists at a 22 m depth [28]. For a DC energy of 6000 kN·m, the reinforcement effect is limited to the upper 8 m [29]. As a result, the design method and experience in LEDC may differ from that of HEDC. Therefore, to achieve optimal design parameters for the reinforcement of super-high-filled red soil using the DC method, both LEDC and HEDC should be performed.
Although several studies have investigated the effectiveness of the DC method in reinforcing various soil layers such as sand [23,30], loess [2,7,19] and dredged soil [31,32], the efficacy and optimal design parameters of this method for red soil with weaker engineering properties remain unclear. Yuan et al. (2018) conducted model tests to investigate the reinforcing effect of the DC method on red clay treatment [33]. However, the applicability of these results for determining optimal compaction parameters is limited due to the significant differences between model tests and practical engineering. Furthermore, there is a lack of research on the use of the DC method to reinforce super-high-filled red soil. Therefore, field results of related engineering practices could provide valuable insights for determining the optimal design parameters for reinforcing high-filled red soil using the DC method.
This paper presents a field study investigating the effect of impact energy on the reinforcement of super-high-filled red soil in southwestern Yunnan, China. Three pilot DC tests were designed and conducted with a large range of impact energies, i.e., 4000 kN·m, 8000 kN·m and 15,000 kN·m. Additionally, after dynamic compaction, a series of in situ tests were carried out to evaluate the DC effect, including site deformation monitoring, a standard penetration test (SPT), a dynamic penetration test (DPT), a surface wave test (SASW) and a plate-load test (PLT). Deformation monitoring summarizes the DC tamping performance and the average settlement of each test zone, which directly reflects the treatment effect. The SPT, DPT and SASW tests are employed to evaluate the improvement depth, while PLT is used to obtain the allowable bearing capacity. This interesting case study presents the reinforcement effects of both LEDC and HEDC on high-filled red soil, which can help to optimize the design and expand the application of the DC method. Additionally, the valuable data collected from field experiments can provide a reference for similar projects.

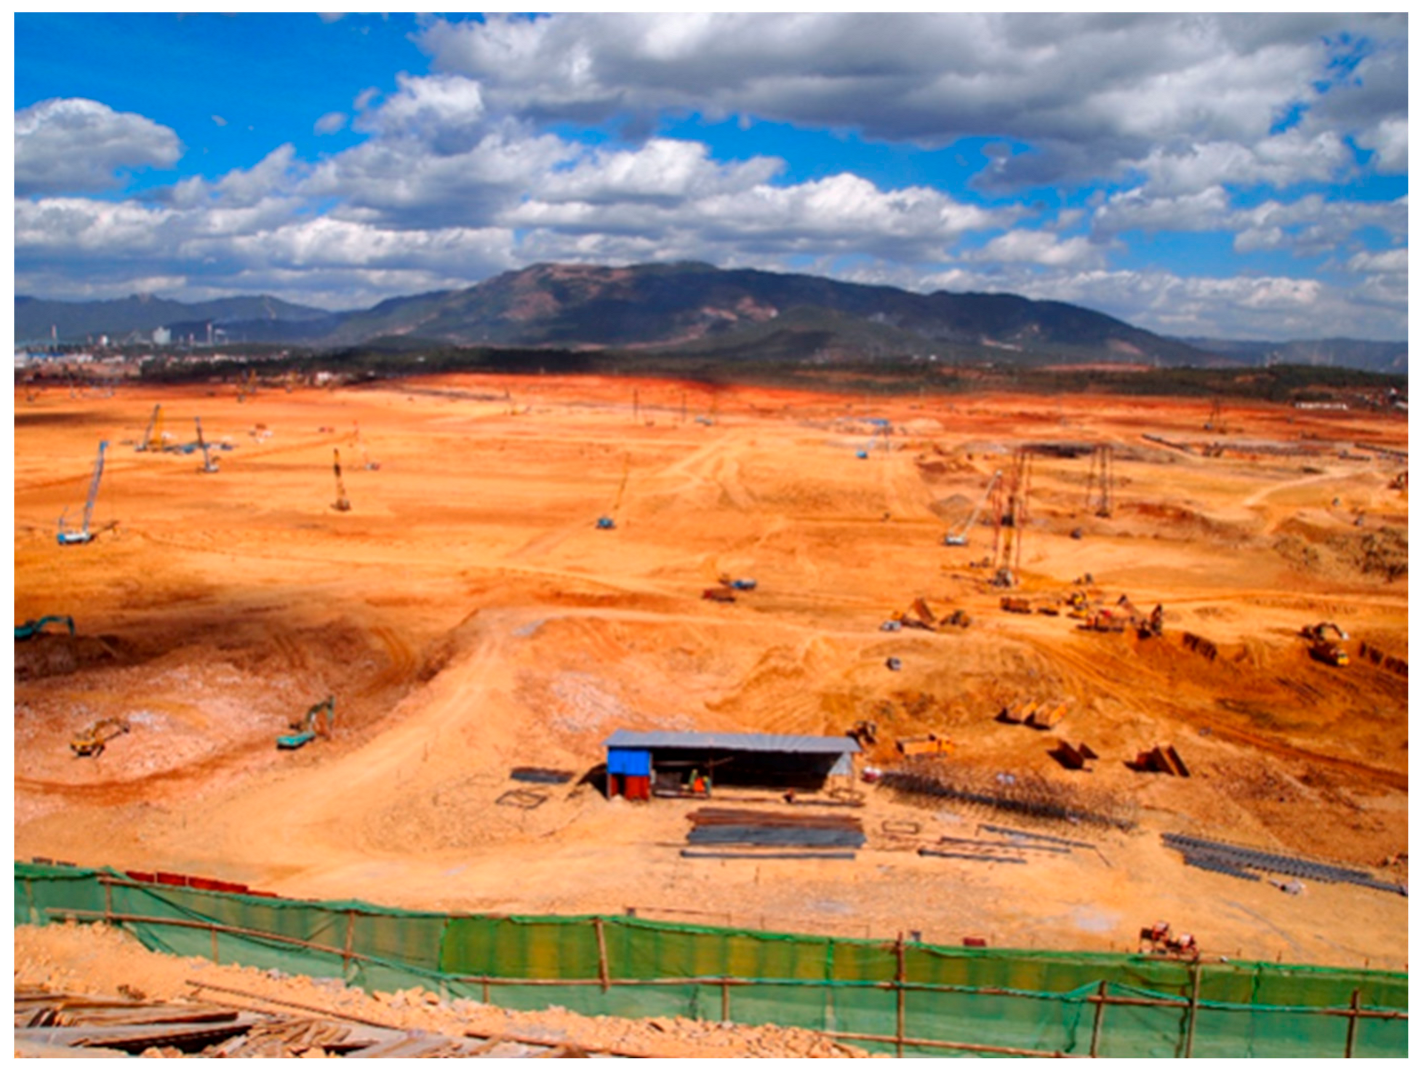
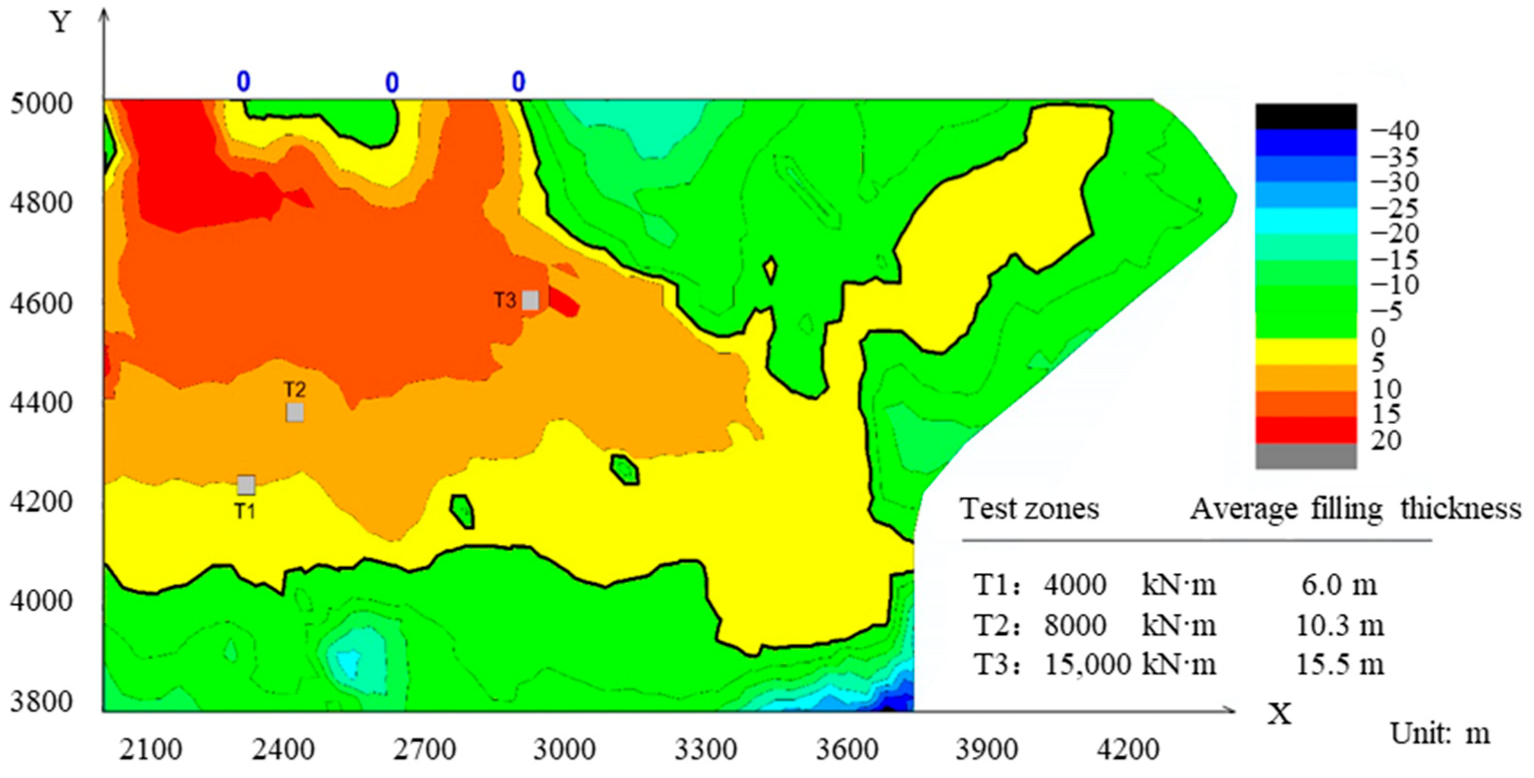
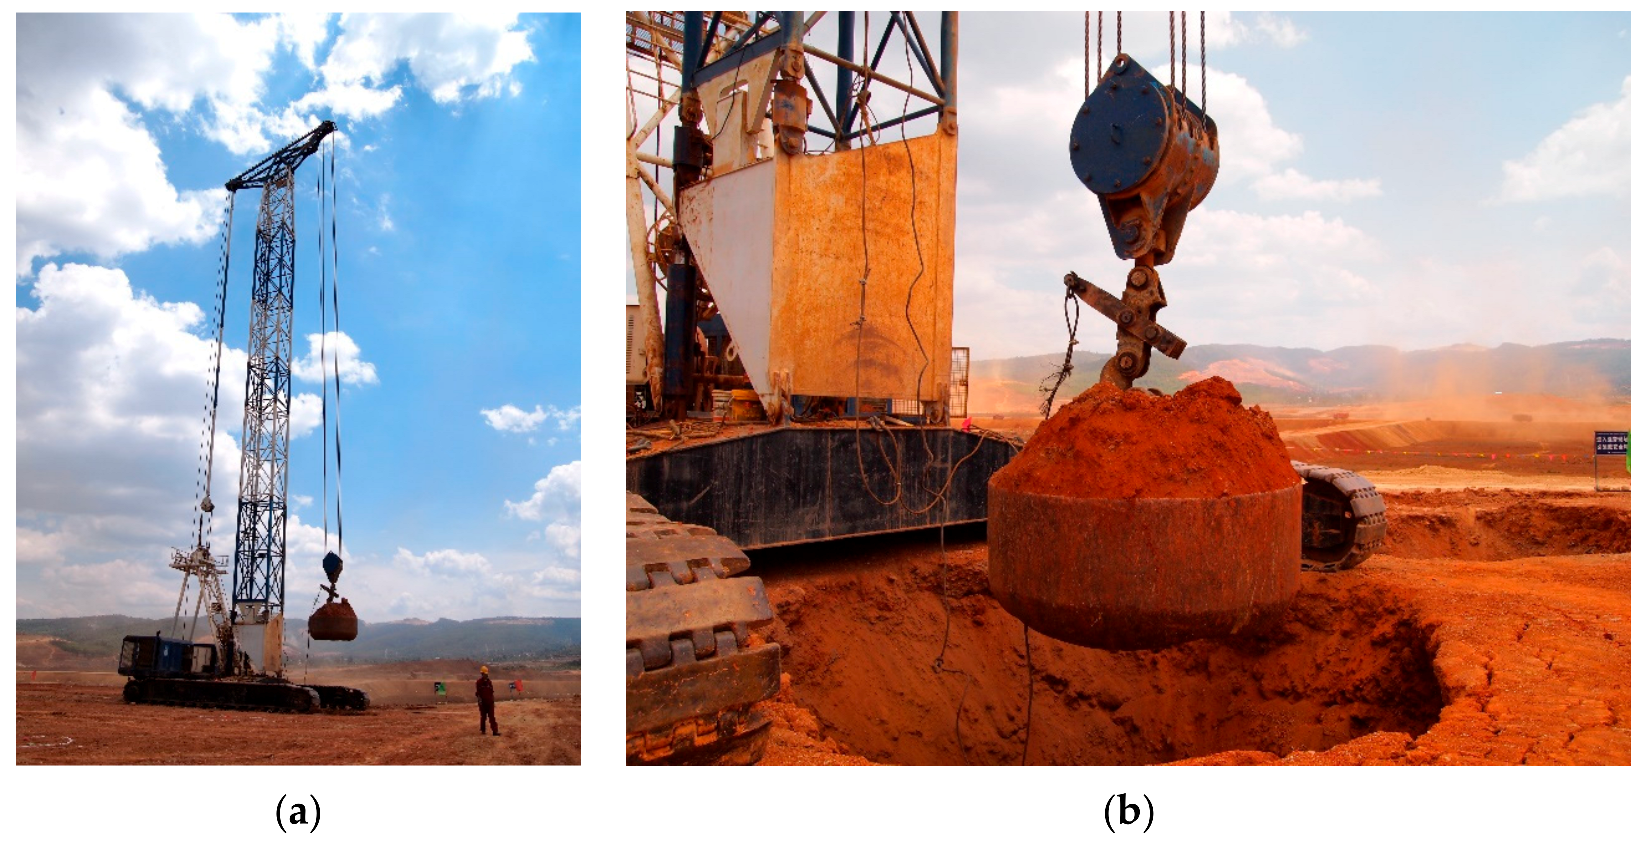
2. Site Description and Subsoil Conditions
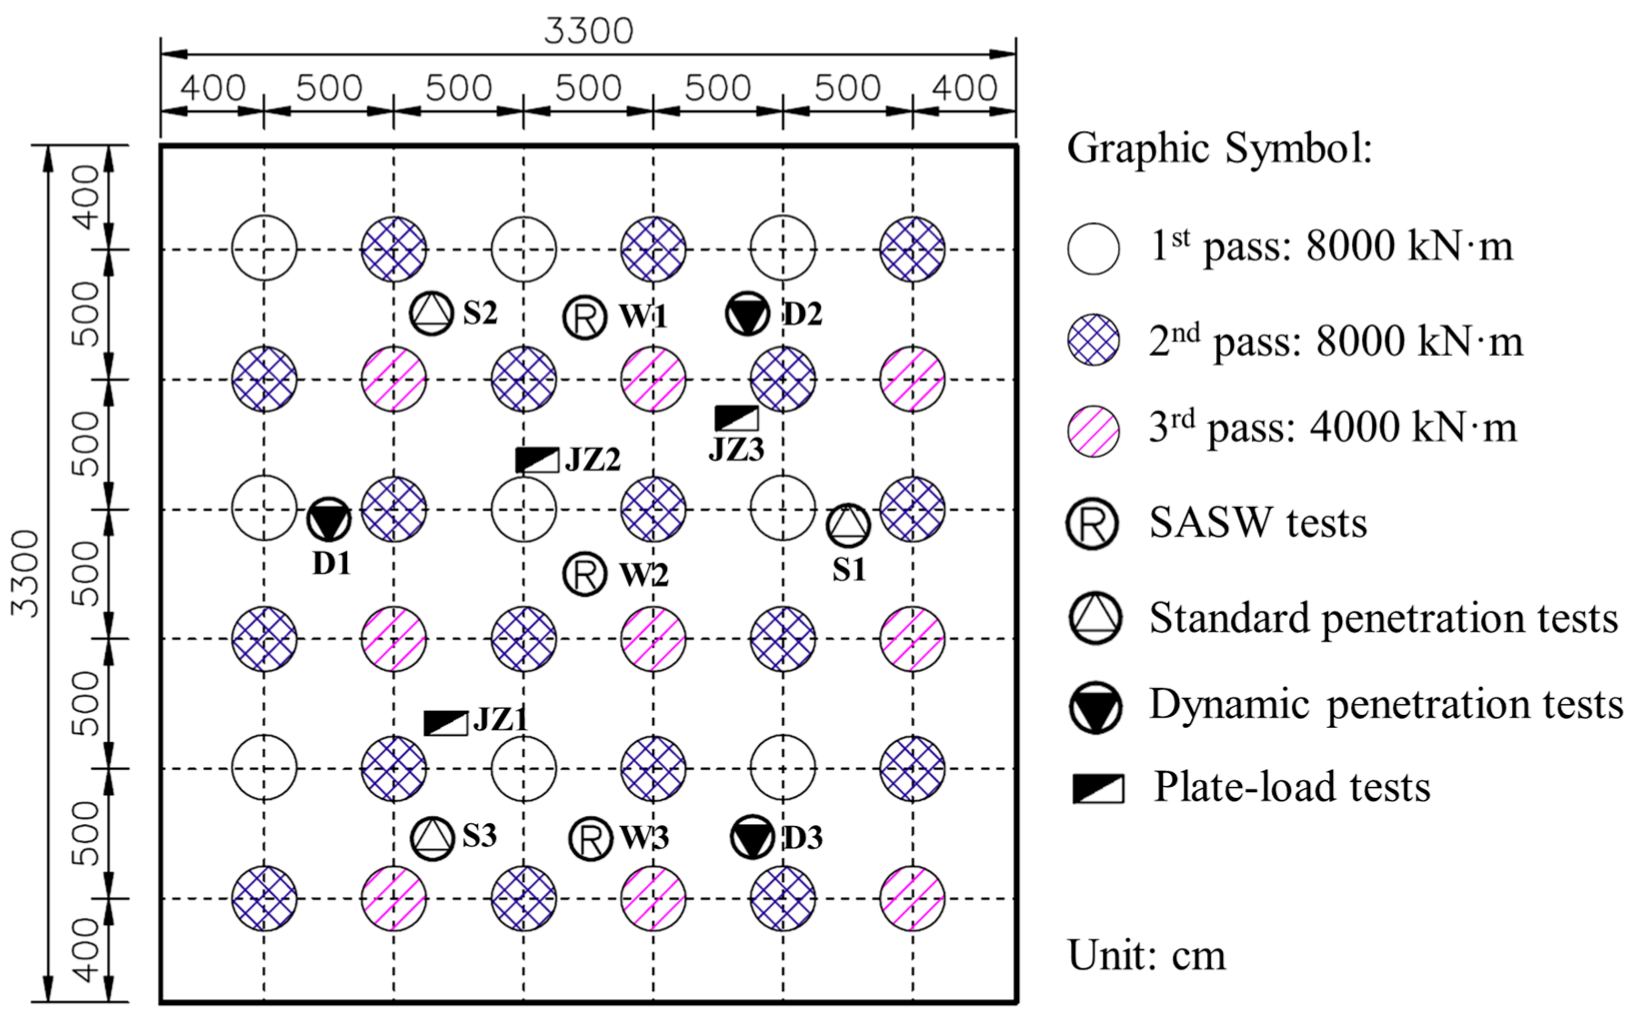
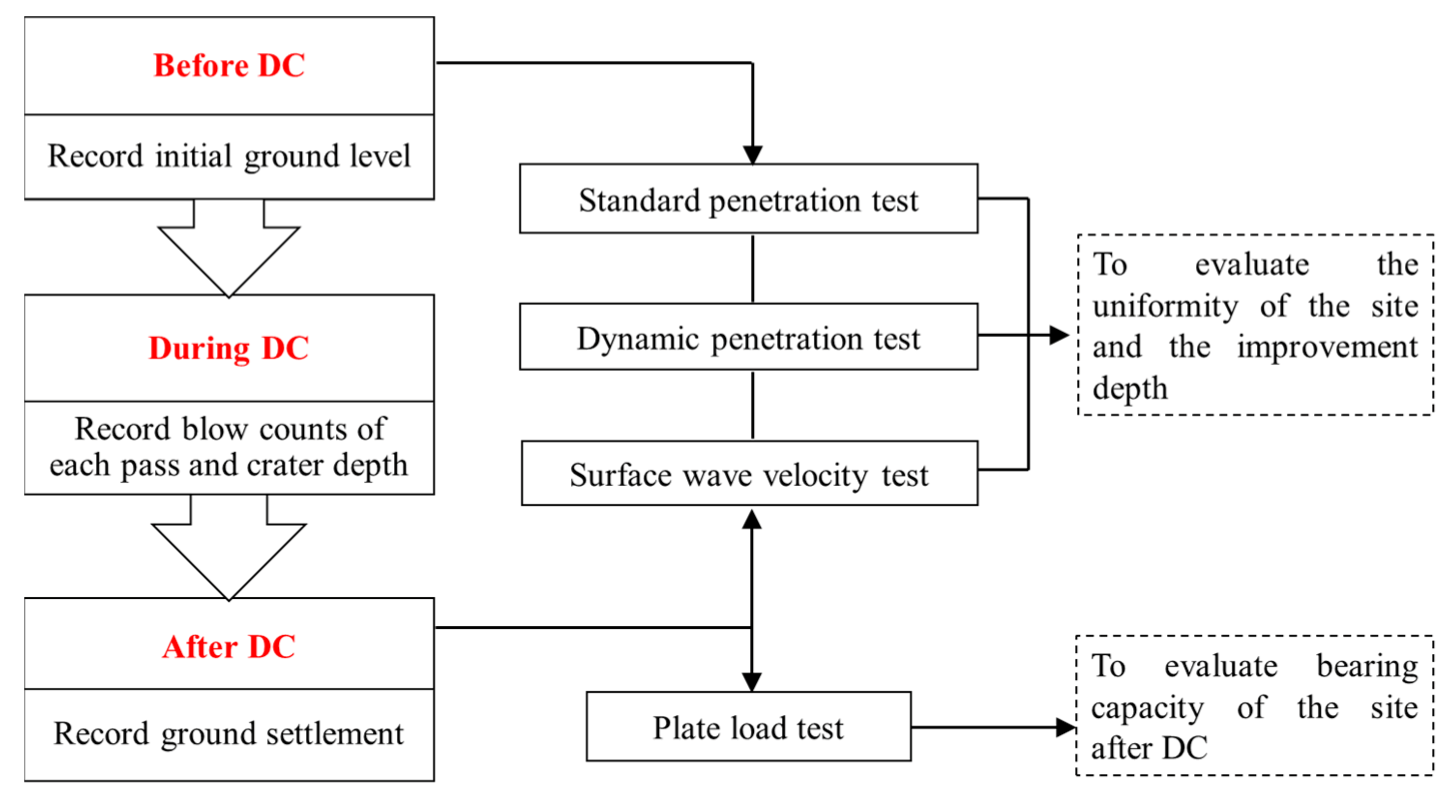
The construction site can be regarded as a depression surrounded by several high hills in the south and east, as shown in Figure 1, which was leveled based on the principle of cut-fill balance and nearby allocation. The filling material was filled into the depression area layer by layer, and each layer (i.e., 1.5 m) was compacted to 93% of its maximum dry density. Figure 2 shows a contour map of the filling soil across the whole site, which indicates that the fill depth gradually increases to nearly 20 m from southeast to northwest. An oil refinery installation will be built in the middle area of this site, which means that a great loading is applied on the filled soil-gravel mixture. Therefore, the ground should be properly improved for a large bearing capacity and low settlement. For this purpose, the DC method was chosen to improve the high-filled ground. Various soil conditions and three pilot tests with energy levels of 4000 kN·m, 8000 kN·m and 15,000 kN·m were carried out to determine the operation parameters. Note that the pilot test points, namely T1, T2 and T3, have different fill depths of nearly 6.0 m, 10.3 m and 15.5 m, respectively, as shown in Figure 2.
The filling soil mainly consists of red soil, yellow–white clay, gravels and rubble. The gravels and rubbles (i.e., 2.0 to 40.0 mm in size) account for approximately 5 to 30% of the weight percentage. Red soil is characterized by its weak expansibility, high dry density and high dry shrinkage. The preliminary geological investigation shows that the subsoil conditions are quite similar, as shown in Figure 3; the average physical and mechanical properties of the subsoil are summarized in Table 1.

3. Test Procedure

The DC operation parameters should be carefully designed to obtain the target bearing capacity and the improvement depth. Three pilot tests were designed for test areas T1, T2 and T3 with different filling depths (i.e., 6.0 m, 10.3 m and 15.5 m, respectively); the operation parameters also differ depending on the target improvement depth, as listed in Table 2. The findings show that the filling in area T1 undergoes two passes of impaction (i.e., 4000 kN·m) following a square-grid pattern with 6 m spacing, while those in areas T2 and T3 undergo three passes of impaction (i.e., 8000 kN·m/8000 kN·m/4000 kN·m and 15,000 kN·m/15,000 kN·m/8000 kN·m) following a square-grid pattern with 10 m spacing. For each testing point, the dynamic impaction is stopped when the settlement increment is less than the predefined value according to the applied impact energy, e.g., 10 cm for 4000 kN·m, 20 cm for 8000 kN·m and 25 cm for 15,000 kN·m (YS/T 5209-2018) [34]. Then, in the final iron tamping pass, the mutual overlapping area of each pounder was approximately a quarter of the pounder’s basal area, and the impact energies were 1500 kN·m, 2000 kN·m and 2000 kN·m for areas T1, T2 and T3, respectively. It is worth noting that the time interval between two successive tamping passes was approximately 10 days.
To evaluate the DC effect, a series of in situ field tests was conducted for two weeks after DC was finished, including the standard penetration test (SPT), the dynamic penetration test (DPT), the surface wave velocity test (SASW) and the PLT to obtain the reinforcement depth, bearing capacity and compressive modulus of fillings. To obtain a conservative result, all in situ field tests were carried out on the fillings between the impact points, as shown in Figure 4. A flow chart of the DC operation and the tests is presented in Figure 5.

4. Test Results

4.1. Crater Depth and Ground Settlement Monitoring

Figure 6 provides a view of dynamic compaction. The tamper is heaved and then dropped on the soil surface so that a large crater is generated, which indicates that the red soil has a high compressibility. The tamping performance is the most visible and immediate result of compaction, including the blow counts per pass, the cumulative crater depth and the average settlement. The monitored data are summarized in Table 3. It is observed that the average blow counts are quite similar at different impact energies, and these values fall within a range of 13–15. This is because the critical settlement increases with increasing impact energy, as shown in Table 2. Moreover, the cumulative crater depth of the first pass is larger than that of the second pass (3.98 m vs. 2.93 m) in T1, while the results are contrary in T2 and T3. The cumulative cater depth of the second pass is almost two times greater than that of the first pass in T2. This is probably because the stress wave caused by the impact energy can only compress the soil in a certain area (e.g., 3 m in T1), and the surface soil in the far area can even be loosened (e.g., 5 m in T2 and T3). Hence, impact points should be carefully arranged to achieve a satisfactory improvement effect. Furthermore, both the tamping count and the cumulative crater depth of the third pass in T2 and T3 decrease greatly, indicating that effective soil improvement has been achieved. When the ironing impact levelled the filling surface treatment, the average settlement of the whole ground in T1, T2 and T3 was measured at 0.66 m, 0.52 m and 0.94 m, respectively. The calculated relative settlement ratio, which is defined as the ratio of the average settlement to the filling depth, is 11.0%, 5.0% and 5.1% for T1, T2 and T3, respectively. A comparison of the data between T2 and T3 shows that when the filling depth is increased by a value of 1.5 times, the corresponding impact energy should be increased by more than 1.5 times to obtain a simulated relative settlement ratio. The reason for this phenomenon may lie in the increase in soil disturbance between tamping points when a higher input energy is used during DC. In addition, considerable improvement can also be obtained using a low impact energy with a proper arrangement of impact points for high-filled ground.

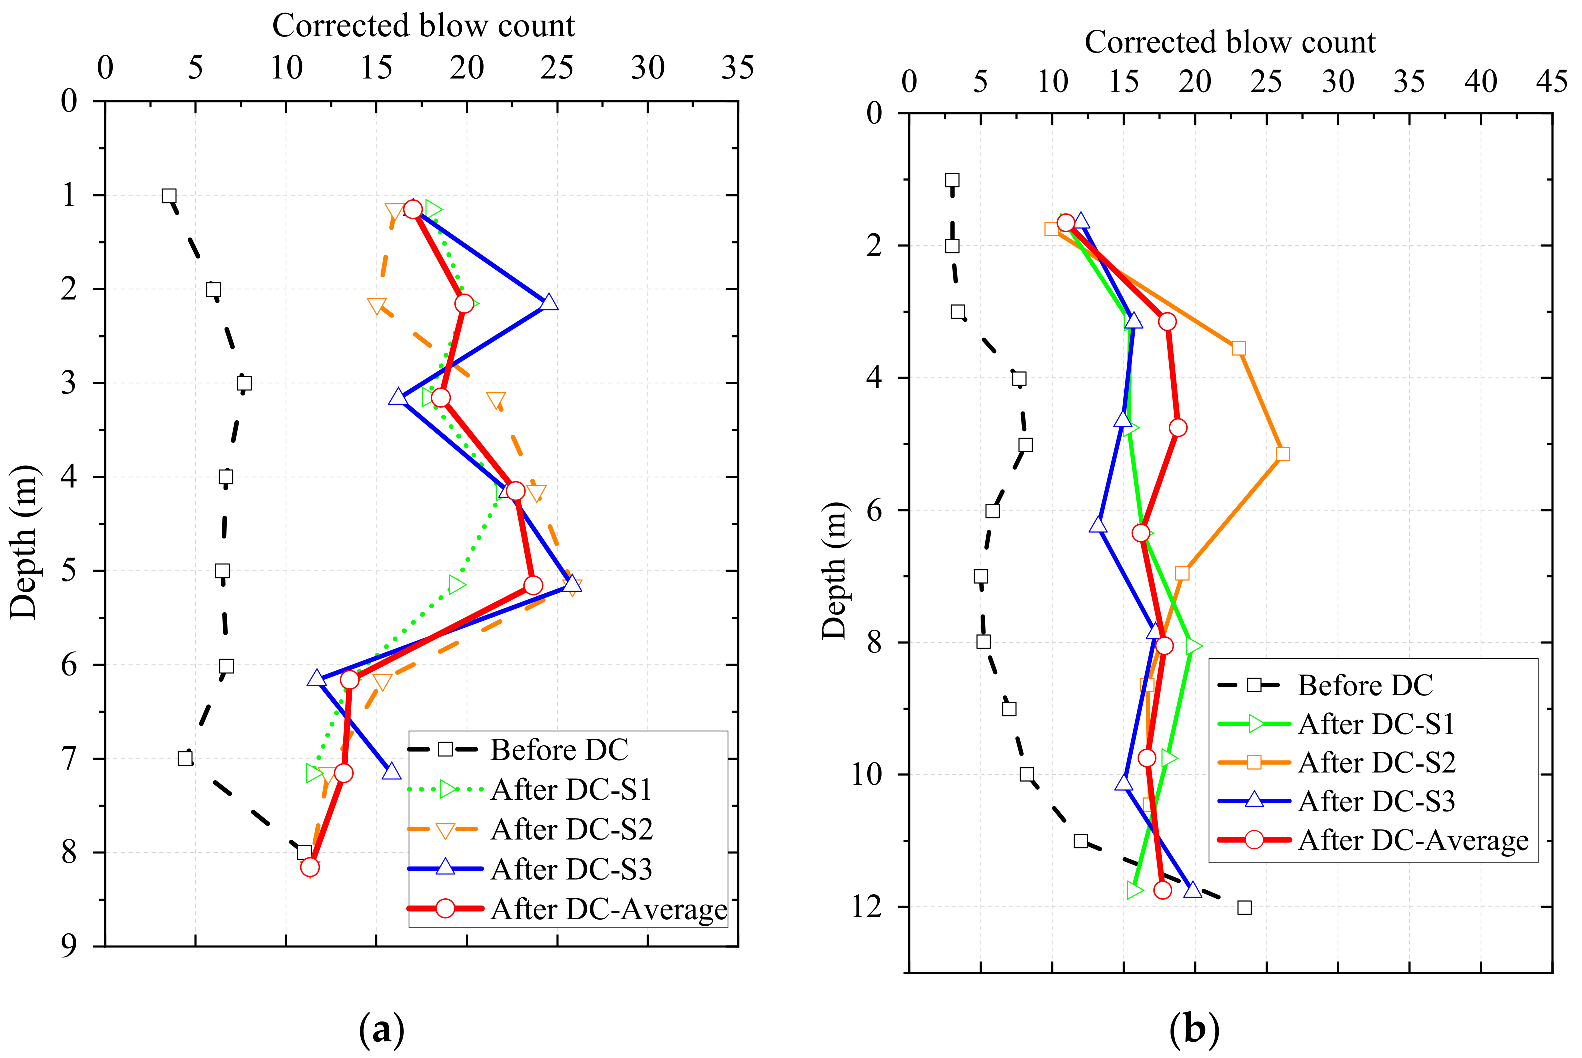
4.2. Standard Penetration Test

The SPT is widely used for in situ investigation, and it can effectively assess the improvement depth after DC. During the SPT, a hammer with a weight of 63.5 kg is dropped repeatedly from a standard height of 760 mm. After penetrating into the soil with a value of 150 mm, the blow count is recorded for each penetration depth of 100 mm. The test is stopped when the accumulated penetration depth reaches a value of 450 mm or the accumulated blow count is over 50.
Figure 7 shows the measured data of SPT in T1, T2 and T3. A great improvement was achieved according to a comparison of the blow counts before and after DC. Before DC, the blow count tends to increase with filling depth, which indicates that deeper soil bears more compaction during the filling operation and generates a larger vertical stress due to self-weight. After DC, the average blow counts were doubled in T1 and T2 within the required improvement depths of 6 and 10 m, respectively. However, although the average blow count in T3 grew considerably within the depth of 13 m, it seems to be unchangeable for depths between 13 and 15 m. As illustrated in Figure 7c, the corrected blow count of the soil at a depth of 16 m was significantly lower than that of the soil at a depth of 15 m before the implementation of DC. This discrepancy suggests the presence of a relatively weak interlayer near the 16 m depth. Consequently, the weak interlayer absorbed a considerable amount of the impact energy generated by the DC method [35]. As a result, a substantial increase in the corrected blow count of the soil at depths between 15 and 17 m was observed, while the corrected blow count for the upper soil between 13 and 15 m remained unchanged. Although the impact energy increased substantially from 4000 kN·m to 8000 kN·m and 15,000 kN·m in T1, T2 and T3, the improvement depth increased slowly from 7 to 11 and 13 m, respectively. Especially in T3, the target improvement depth of 15 m was not achieved. By comparing the reinforcement effect in the three testing zones, it can be concluded that for super-high-filled ground, a better improvement can be obtained by multilayer impaction with a low impact energy and small spacing than single-layer impaction with high energy and large spacing.

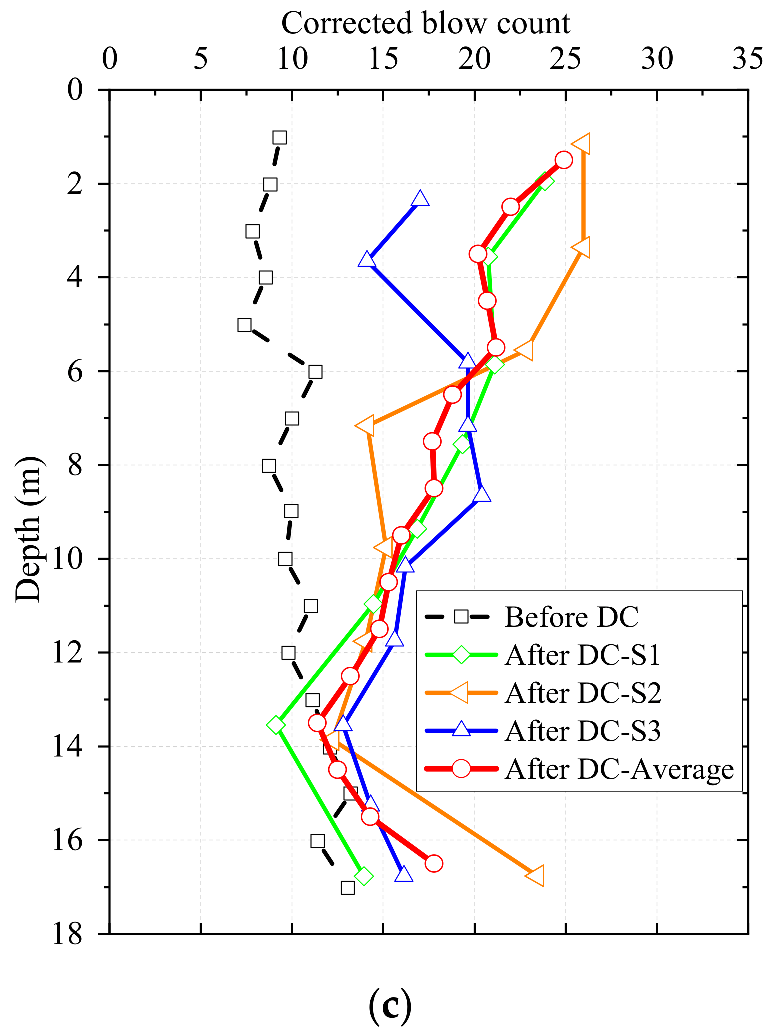
4.3. Dynamic Penetration Test

The DPT is a useful and fast method for field investigation and has been widely used to determine the relative stiffness and density of superficial deposits. To examine soil properties after DC and ground replacement with backfilled rocks, three DPTs were conducted on the surface soil between the DC points. The DPT apparatus was also equipped with a probe head with a 74 mm diameter cone-shaped tip with a tip angle of 60°. A 63.5 kg hammer was dropped from a height of 76 cm, and the blow count was recorded every 100 mm until reaching the required depth. The DPT was ended when three successive blow counts exceeded 50 or when the probing rod was rebounded.
Figure 8 shows the results of the three DPTs (D1, D2 and D3) before and after DC in the three test zones. A great improvement was achieved according to the blow counts, which were increased significantly after DC. Taking Figure 8a as an example, the average blow count in D1 increased from 4 to 10.6 after DC from the ground surface to an improvement depth of 7.5 m. Note that the improvement depth was larger than the filling depth of T1 because both the filling and original soils were improved. In addition, it is observed that the improvement depth increased from 7.5 m to 11.5 m and 12.5 m when the impact energy increased from 4000 kN·m to 8000 kN·m and 15,000 kN·m, as expected, while the average increment of the blow count due to DC decreased from 6.6 to 5.6 and 3.8 in T1, T2 and T3, respectively. Such observations show that a better improvement was achieved in the T1 area, although its impact energy and improvement depth are small. This phenomenon might be explained by two reasons. The first reason is that DC in T1 used a smaller spacing of 6 m than that of 10 m in T2 and T3. Second, a comparison of the results between T2 and T3 shows that low impact energy may result in a better improvement depth, although the improvement depth increased only slightly. It can also be concluded that a better improvement can be obtained by multilayer impaction with a low impact energy and small spacing than single-layer impaction with high energy and large spacing for super-high-filled ground.

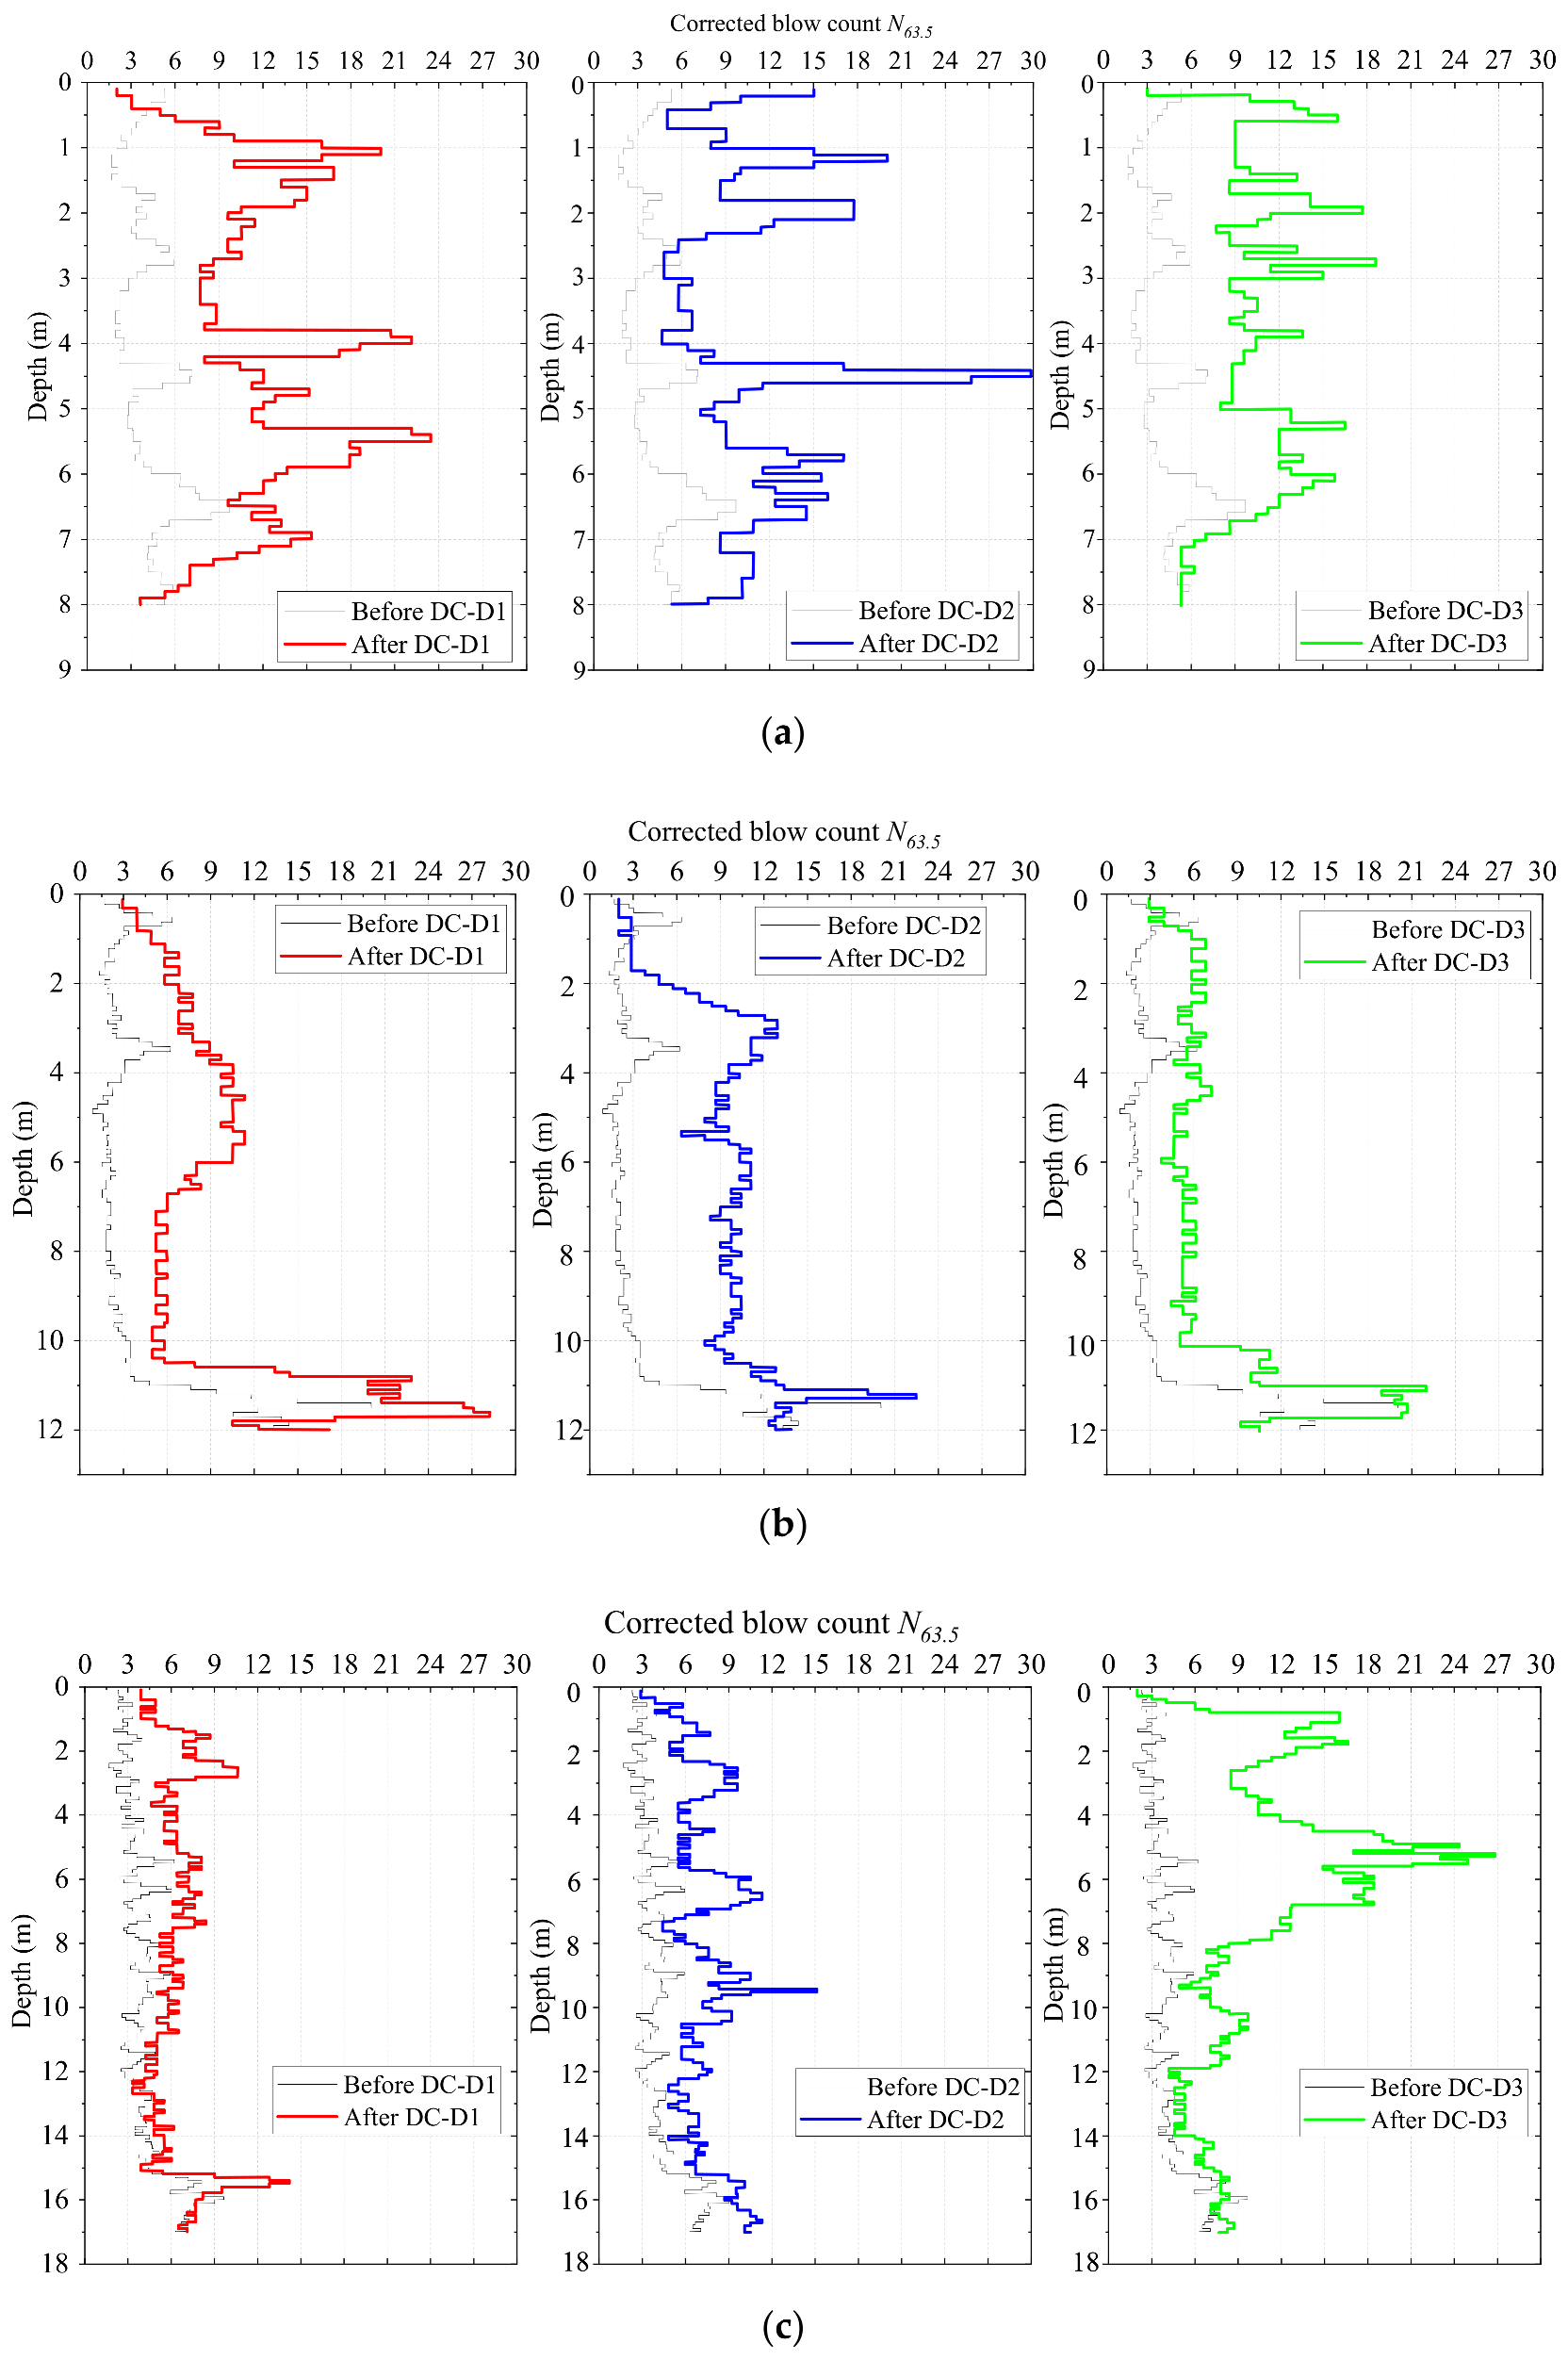
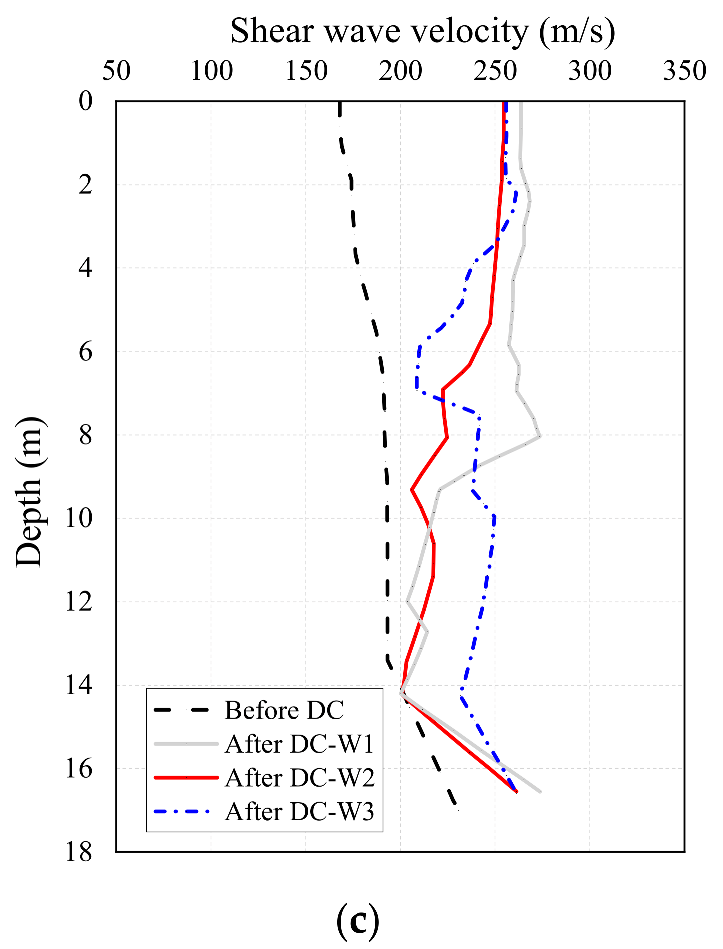
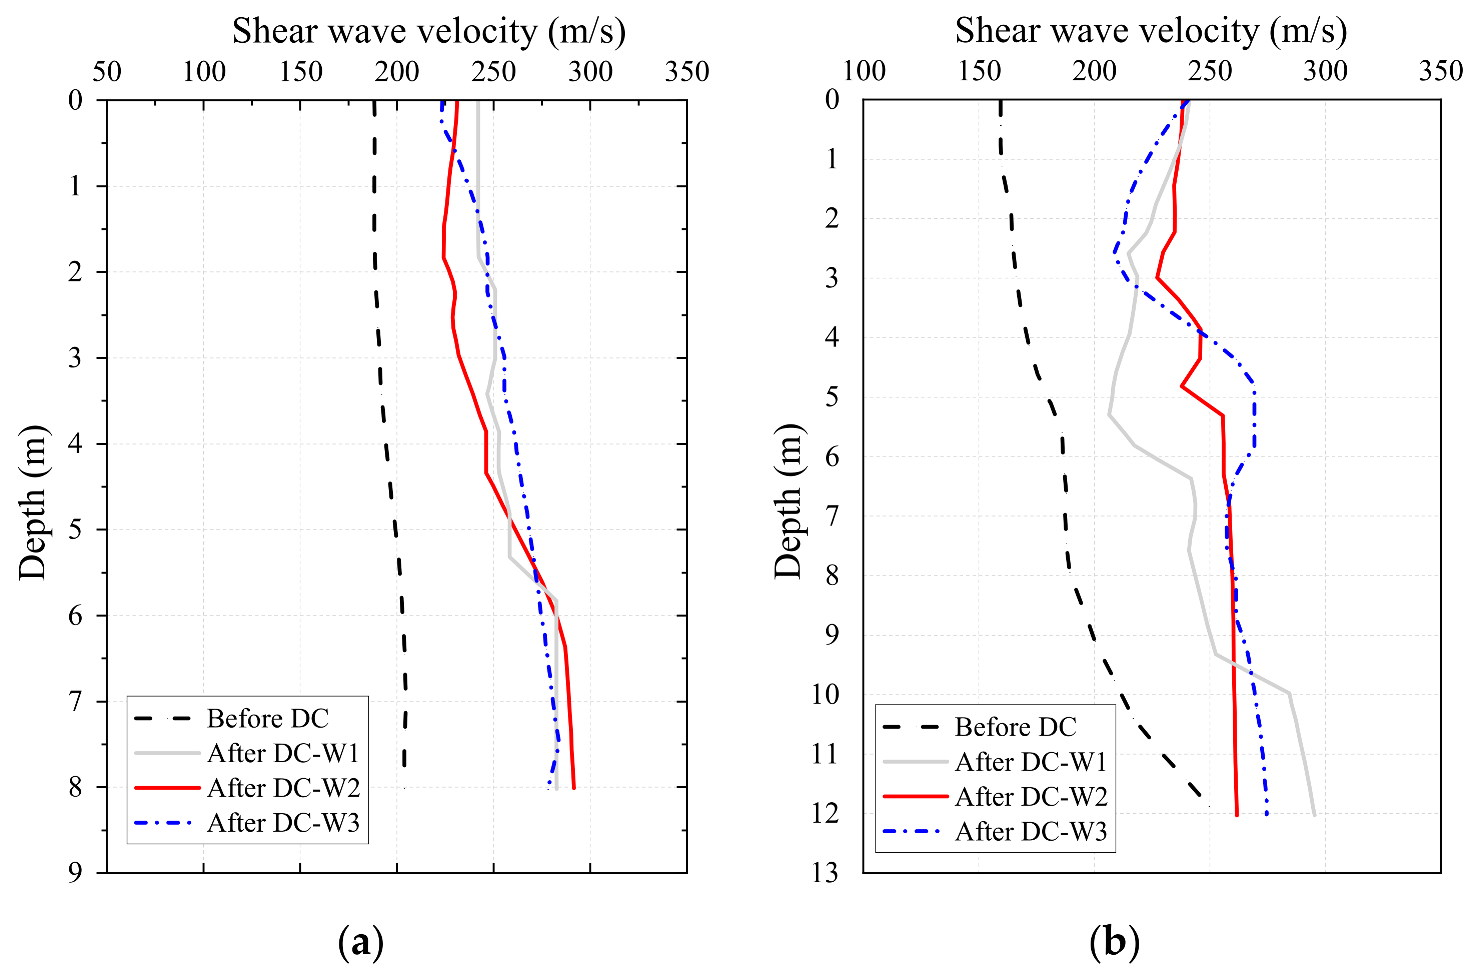
4.4. Surface Wave Velocity Test

Spectral analysis of surface waves (SASW) is based on the dispersive characteristics of Rayleigh waves when traveling through a layered medium. Waves with higher wavelengths penetrate deeper, and their velocities vary regularly with material properties at greater depths. In recent years, this method has gained popularity in determining improvement depth due to the advantages of low cost and non-disturbance of soil. In this study, three SASW tests were carried out for each testing area. Surface waves were generated by applying a dynamic vertical load on the ground surface. An actuator capable of applying a maximum dynamic force of 130 kN at frequencies from 1 to 200 Hz was used.
Figure 9 shows the shear wave velocities before and after DC. It is obvious that the shear wave velocity increased at depths from nearly 150 to 250 m/s before DC, indicating that the deeper soil became denser due to its self-weight, as expected. After DC, the shear wave velocity increased significantly within the improvement depth, indicating that a great treatment effect was achieved by DC. The improvement depths according to the shear wave velocity were 8 m, 11 m and 13 m for T1, T2 and T3, respectively, which shows good agreement with those verified by the SPT and DPT. Moreover, it is observed that different treatment effects were obtained in the three testing areas. Before DC, the shear wave velocities were similar in the three test areas, at nearly 200 m/s. However, after DC, the shear wave velocity in T1 was the largest, and the shear wave velocity in T3 was the smallest. Such observations show that a better improvement was achieved in T1, where a low impact energy of 4000 kN·m was used with a small spacing on a shallow fill. A comparison of the results between T2 and T3 show that the treatment effect decreased with increasing impact energy within the improvement depth, and the improvement depth increased slightly. Therefore, it can be concluded that for super-high-filled soil, DC with a high impact energy is not satisfactory. As an alternative, multilayer DC with a low impact energy and a relatively smaller spacing is a better method for super-high-filled ground.

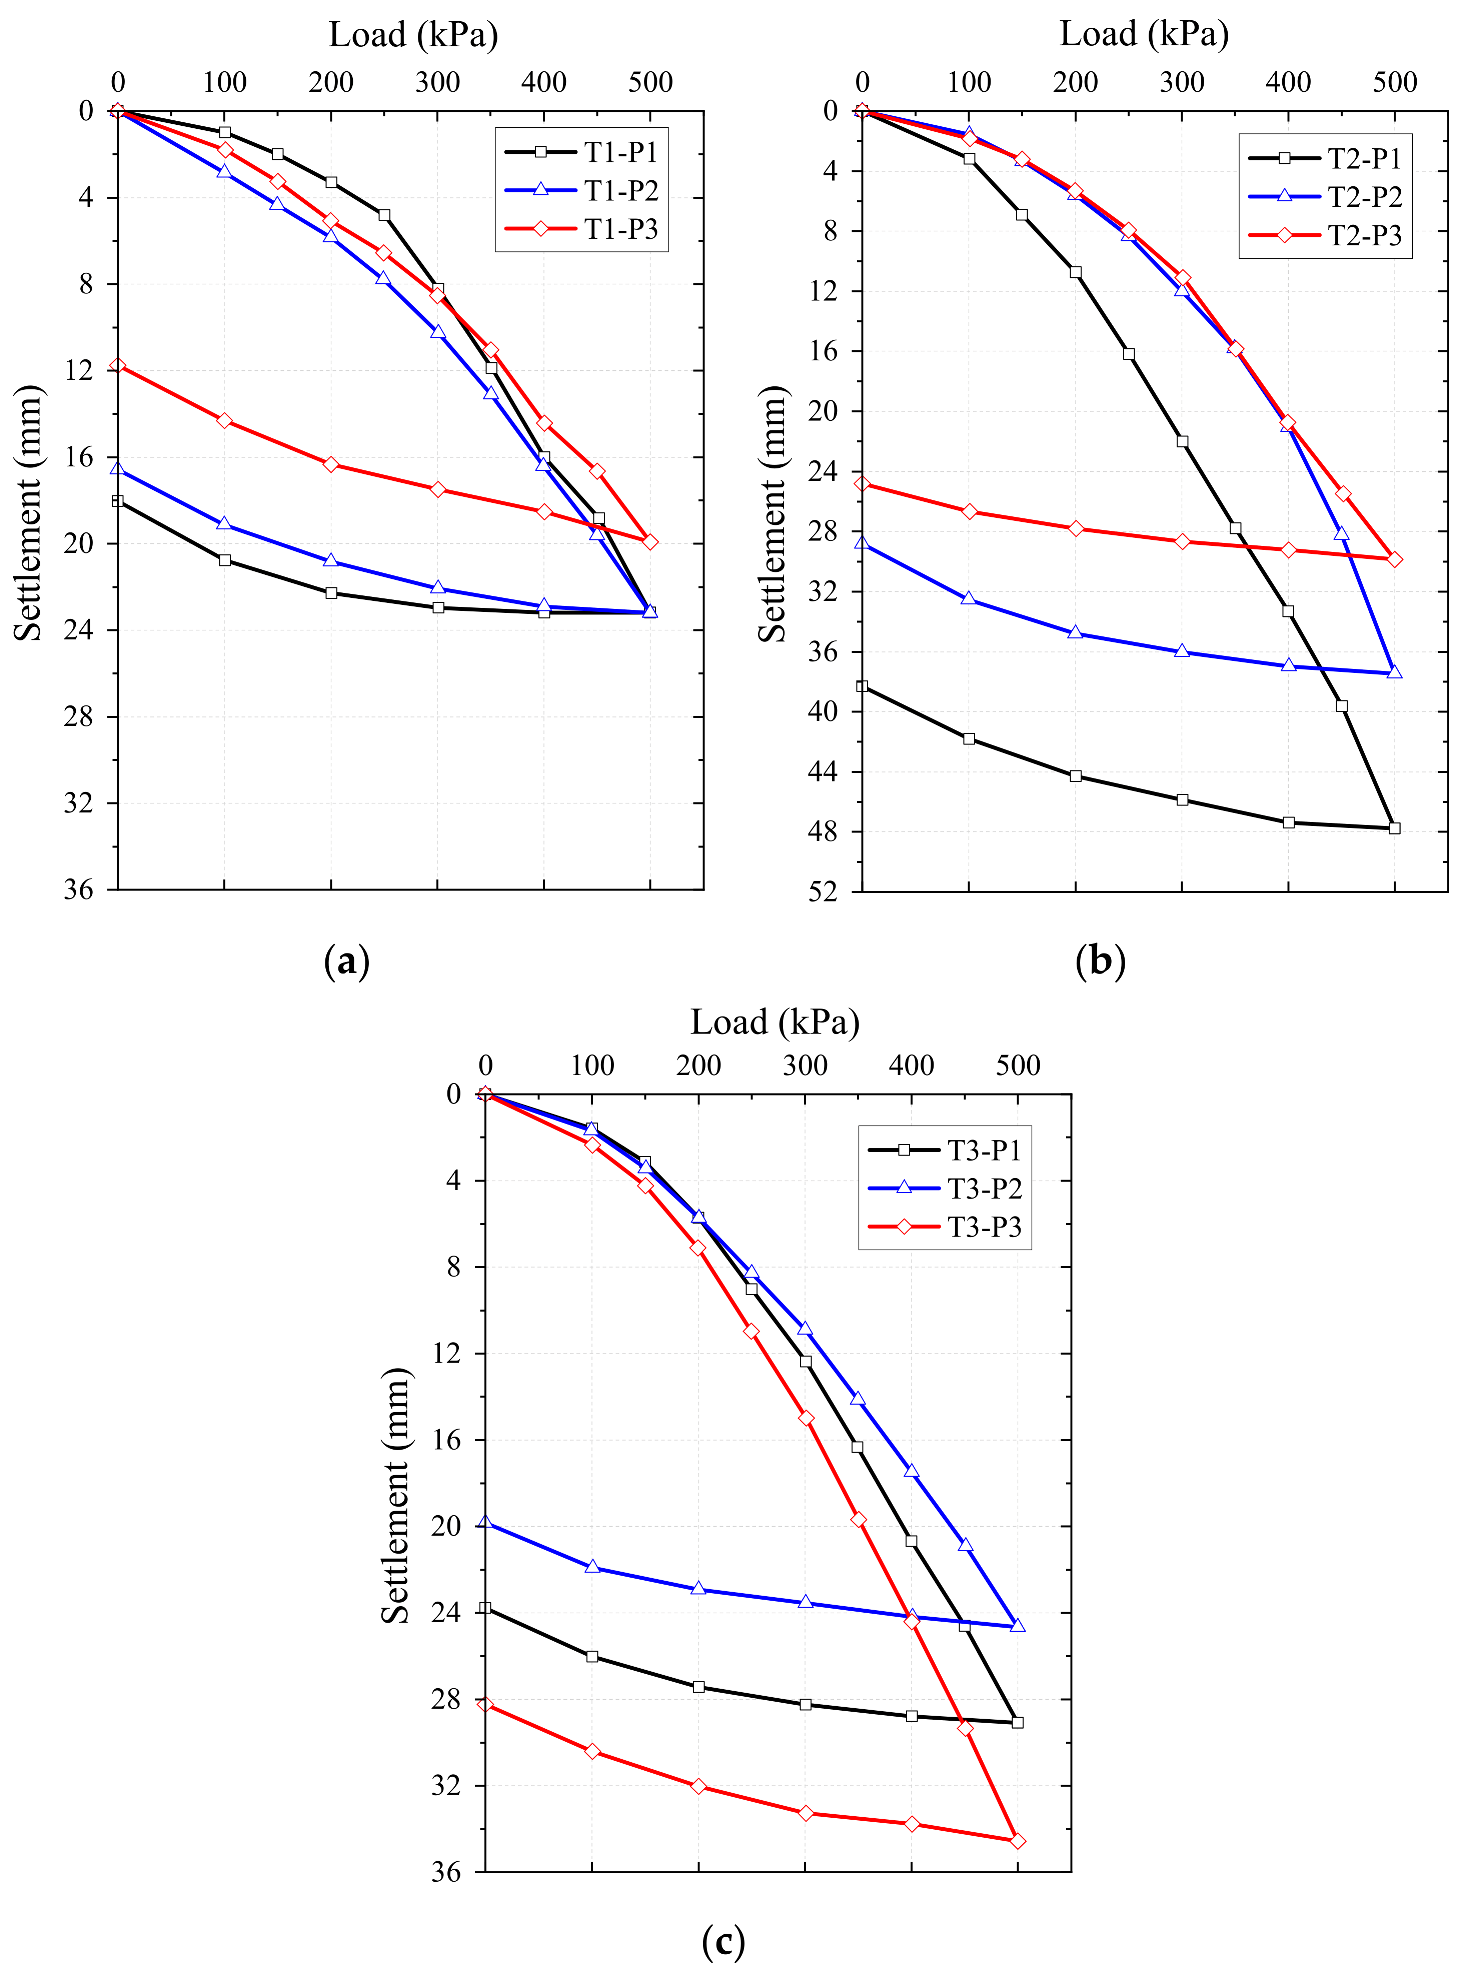
4.5. Plate-Load Test

The ultimate and allowable load-bearing capacities of the ground can easily be determined by the PLT, in which a circular or square plate is forced into the soil to draw the curve between the applied pressure and the corresponding settlement. In this study, three PLTs were carried out in each testing area to determine the ground bearing capacity between the DC points (see Figure 4). A circular plate of 2 m2 was forced into the soil with a maximum pressure of 500 kPa. A 20 mm fine sand layer was prepared under the plate to ensure equal settlement.
Figure 10 shows the measured load–settlement curves of the three test areas. The test points P1, P2, and P3 in Figure 10b correspond to JZ1, JZ2, and JZ3 in Figure 4, respectively. All three curves exhibit a similar evolution according to the impact energy; that is, the loading pressure first increases rapidly at a low settlement and then increases slowly with a rapidly increasing settlement. However, significant differences were observed in the corresponding settlement values at the same maximum load. This is because while dynamic compaction can effectively reinforce the entire area, the soil near the impact point becomes denser than the soil between impact points. Therefore, there are noticeable differences in the results of plate load tests conducted at different measurement points within the same test area. This finding is consistent with previous research [29].
According to the “Chinese national standard for building foundation design” [36], the ultimate bearing capacity for every test zone is the maximum load (500 kPa) because the maximum settlement is 47.8 mm, which is much less than 84.8 mm, i.e., 6% of the side length of the square plate (1.4 m). Considering that there is no proportional limit load for PLTs, the characteristic value of the ground bearing capacity for every test zone is half the value of the ultimate bearing capacity, i.e., 250 kPa, which are all larger than the target value, as shown in Table 2.

5. Discussion

The determination of the improvement depth in the DC method is crucial and should be based on various field tests. In this study, SPTs, DPTs and SASW were utilized before and after DC to examine the improvement depths of different test zones (T1, T2 and T3) subjected to varying impact energies (4000, 8000 and 15,000 kN·m). Table 4 presents the improvement depths of the three test zones determined by SPTs, DPTs and SASW, and the results obtained by the three tests are quite consistent. Specifically, the values for T1, T2 and T3 range from 7.0 to 8.0 m, 11.0 to 11.5 m and 12.5 to 13.0 m, respectively. The negligible differences between the improvement depths of the test points at different locations demonstrate that the high-filled red soil ground was uniformly reinforced after DC. Notably, the test points of the three tests were positioned between the DC points.
To facilitate the construction of DC, Ménard and Broise (1975) proposed an empirical formula to relate the impact energy and the improvement depth [37]. However, the effects of soil types and tamping processes were excluded in this formula. Hence, Lukas suggested a revised formula with a correction Factor (n) as follows [38]:
d m a x = n W H
where dmax (m) is the improvement depth after DC (m), W is the tamper mass (ton) and H is the fall height of the tamper (m). In this equation, WH is usually referred to as the DC energy level, which shows a significant effect on the improvement depth. Previous studies have suggested that n should be 0.4 for collapsible soils, 0.4–0.5 for dry sandy silt [39] and 0.5 for granular soils [40]. However, the simplified equation may lead to a gross error due to complicated site-dependent conditions, such as high-filled red soil, for which the empirical coefficient has rarely been reported.
The pilot tests conducted in this study provide insight to determine the empirical coefficient. According to the results presented in Table 4, the effective improvement depths for T1, T2 and T3 (7.0 m, 11.0 m and 12.5 m, respectively) are preferred as the minimum values for safety reasons. Based on these values, the coefficients calculated using Equation (1) are 0.324, 0.357 and 0.344 for T1, T2 and T3, respectively, which are lower than the coefficient value of 0.4 typically used for collapsible soil. Therefore, when using the DC method to reinforce high-filled red soil, a larger overall energy input should be considered to achieve the desired improvement depth. In addition, it is worth mentioning that all in situ tests were conducted between DC points, and it is reasonably inferred that a larger improvement depth should be reached right under the DC points.

6. Conclusions

In this study, we investigated the use of the DC technique to improve the bearing capacity of high-filled red soil, with impact energy levels ranging from low to super high. Based on a series of field tests, the following conclusions can be drawn:
(1)
The DC method is effective in reinforcing super-high-filled red soil, with the characteristic values of ground bearing capacity reached 250 kPa in all three test zones, meeting the design requirement of 160 kPa;
(2)
The improvement depths of T1 and T2 meet the required improvement depths of 6 m and 10 m, respectively, while T3 falls short of the 15 m requirement due to the presence of a weak interlayer;
(3)
The empirical correction factor (n) values for T1, T2 and T3 are 0.324, 0.357 and 0.344, respectively, indicating that a larger overall energy input should be considered when applying the DC method to reinforce high-filled red soil in order to achieve the desired improvement depth. Overall, these findings provide valuable insights for the effective application of the DC method to improve the bearing capacity of high-filled red soil.

Author Contributions

L.W.: writing—original draft and formal analysis; F.D.: writing—original draft and methodology; Y.L.: investigation and resources; W.G.: conceptualization; Z.S.: writing—review and editing; G.Z.: writing—review a editing; X.C.: supervision. All authors have read and agreed to the published version of the manuscript.

Funding

This research was funded by the Nature Science Foundation of Beijing, China (No. 8192050).

Institutional Review Board Statement

Not applicable.

Informed Consent Statement

Not applicable.

Data Availability Statement

Not applicable.

Acknowledgments

The authors acknowledge the financial support provided by the Nature Science Foundation of Beijing, China, under grant no. 8192050.

Conflicts of Interest

The authors declare no conflict of interest.

References

  1. Zhao, G.Q.; Yang, Y.Y.; Zhang, H.Q.; Zhang, G.L. A case study integrating field measurements and numerical analysis of high-fill slope stabilized with cast-in-place piles in Yunnan, China. Eng. Geol. 2019, 253, 160–170. [Google Scholar] [CrossRef]
  2. Feng, S.J.; Du, F.L.; Shi, Z.M.; Shui, W.H.; Tan, K. Field study on the reinforcement of collapsible loess using dynamic compaction. Eng. Geol. 2015, 185, 105–115. [Google Scholar] [CrossRef]
  3. Mei, Y.; Hu, C.M.; Wang, X.Y. Experimental Research on Deep Collapsible Loess Foundation Treatment By Dynamic Compaction Under Super High Fill. Adv. Civ. Eng. 2013, 256–259, 129–138. [Google Scholar] [CrossRef]
  4. Liang, Y.; Shui, W.; Lu, S. Field practice and ground settlement behaviors of a land creation case in loess area of China. B Eng. Geol. Environ. 2022, 81, 462. [Google Scholar] [CrossRef]
  5. Zhu, C.H.; Li, N. Ranking of influence factors and control technologies for the post-construction settlement of loess high-filling embankments. Comput. Geotech. 2020, 118, 103320. [Google Scholar] [CrossRef]
  6. Wei, Y.M.; Liu, X.J.; Zhao, C.Y.; Tomas, R.; Jiang, Z. Observation of Surface Displacement Associated with Rapid Urbanization and Land Creation in Lanzhou, Loess Plateau of China with Sentinel-1 SAR Imagery. Remote Sens. 2021, 13, 3472. [Google Scholar] [CrossRef]
  7. Zhang, H.X.; Zeng, R.Q.; Zhang, Y.; Zhao, S.F.; Meng, X.M.; Li, Y.X.; Liu, W.C.; Meng, X.P.; Yang, Y.P. Subsidence monitoring and influencing factor analysis of mountain excavation and valley infilling on the Chinese Loess Plateau: A case study of Yan’an New District. Eng. Geol. 2022, 297, 106482. [Google Scholar] [CrossRef]
  8. Zhu, C.H.; Zhou, X.S.; Wang, S.H. Foundation Treatment Assessment and Postconstruction Settlement Prediction of a Loess High Fill Embankment: A Case Study. Shock Vib. 2020, 2020, 8864690. [Google Scholar] [CrossRef]
  9. Xua, W.J.; Xu, Q.; Hu, R.L. Study on the shear strength of soil-rock mixture by large scale direct shear test. Int. J. Rock Mech. Min. 2011, 48, 1235–1247. [Google Scholar]
  10. Athanasiu, C.; Simonsen, A.S.; Soereide, O.K.; Tistel, J. Elastic and creep settlements of rock fills. In Proceedings of the 16th International Conference on Soil Mechanics and Geotechnical Engineering, Osaka, Japan, 12–16 September 2005; Volumes 1–5, pp. 1837–1843. [Google Scholar]
  11. Charles, J.A.; Watts, K.S. The assessment of the collapse potential of fills and its significance for building on fill. Int. J. Rock Mech. Min. Sci. Geomech. Abstr. 1996, 119, 15–28. [Google Scholar] [CrossRef]
  12. Li, S.; Jianie, Y.C.; Ho, I.H.; Ma, L.; Yu, B.T.; Wang, C.D. Evolution of Load Reduction for High-Filled Cut-and-Cover Tunnels Subjected to Soil Creep. Int. J. Geomech. 2021, 21, 04021172. [Google Scholar] [CrossRef]
  13. Li, S.; Jianie, Y.; Ho, I.H.; Ma, L.; Ning, G.X.; Wang, C.D. Long-term behavior of earth pressure around a high-filled cut-and-cover tunnel. Geomech. Eng. 2021, 26, 311–321. [Google Scholar]
  14. Eslami, A.; Ahmadnezhad, M.; Kenarsari, A.E.; Rezazadeh, S. Experimental study on stiffness properties of non-engineered clay and granular fills. Arab. J. Geosci. 2015, 8, 3065–3075. [Google Scholar] [CrossRef]
  15. Li, Z.Q.; Qi, S.W.; Qi, Z.Y.; Zhang, L.X.; Hou, X.K. Microstructural insight into the characteristics and mechanisms of compaction during natural sedimentation and man-made filling on the Loess Plateau. Environ. Earth Sci. 2021, 80, 668. [Google Scholar] [CrossRef]
  16. Jia, M.C.; Zhao, Y.; Zhou, X.J. Field Studies of Dynamic Compaction on Marine Deposits. Mar. Georesour. Geotec. 2016, 34, 313–320. [Google Scholar] [CrossRef]
  17. Feng, S.J.; Shui, W.H.; Gao, L.Y.; He, L.J.; Tan, K. Field studies of the effectiveness of dynamic compaction in coastal reclamation areas. B Eng. Geol. Environ. 2010, 69, 129–136. [Google Scholar] [CrossRef]
  18. Mayne, P.W.; Jones, J.S.; Dumas, J.C. Ground Response to Dynamic Compaction. J. Geotech. Eng.-ASCE 1984, 110, 757–774. [Google Scholar] [CrossRef]
  19. Mei, Y.; Zhang, S.M.; Hu, C.M.; Wang, X.Y.; Yuan, Y.L.; Zhao, L.J.; Zhou, D.B. Field test study on dynamic compaction in treatment of a deep collapsible loess foundation. B Eng. Geol. Environ. 2021, 80, 8059–8073. [Google Scholar] [CrossRef]
  20. Gao, Z.; Du, Y.; Lai, Y.; Huang, X. Reinforcement effect of broken stone fills under dynamic consolidation. In CICTP 2012: Multimodal Transportation Systems—Convenient, Safe, Cost-Effective, Efficient; American Society of Civil Engineers (ASCE): Beijing, China, 2012; pp. 2976–2985. [Google Scholar]
  21. Dou, J.Z.; Chen, J.J.; Wang, W. Method for Estimating the Degree of Improvement in Soil between Adjacent Tamping Locations under Dynamic Compaction. Int. J. Geomech. 2019, 19, 04019134. [Google Scholar] [CrossRef]
  22. Jia, M.C.; Cheng, J.X.; Liu, B.; Ma, G.Q. Model tests of the influence of ground water level on dynamic compaction. B Eng. Geol. Environ. 2021, 80, 3065–3078. [Google Scholar] [CrossRef]
  23. Yao, Z.Y.; Zhou, C.; Lin, Q.; Yao, K.; Satchithananthan, U.; Lee, F.H.; Tang, A.M.; Jiang, H.; Pan, Y.T.; Wang, S.T. Effect of dynamic compaction by multi-point tamping on the densification of sandy soil. Comput. Geotech. 2022, 151, 104949. [Google Scholar] [CrossRef]
  24. Mollamahmutoglu, M.; Avci, E. Dynamic compaction experience in alluvial soils of Carsamba (Turkey). Maejo Int. J. Sci. Tech. 2018, 12, 206–220. [Google Scholar]
  25. Zhou, C.; Yang, C.J.; Qi, H.; Yao, K.; Yao, Z.Y.; Wang, K.; Ji, P.; Li, H. Evaluation on Improvement Zone of Foundation after Dynamic Compaction. Appl. Sci. 2021, 11, 2156. [Google Scholar] [CrossRef]
  26. Fu, J. Field test on 30,000 kN m ultra high energy level dynamic compaction on large thickness gravel foundation. In Proceedings of the 16th Asian Regional Conference on Soil Mechanics and Geotechnical Engineering, Taipei, Taiwan, 14–18 October 2020. [Google Scholar]
  27. Nian, T.; Shui, W.; Li, H.; Yang, Q.; Wang, Y. Field tests of high energy dynamic compaction on foundation backfilled by crushed stone in coastal area. Chin. J. Geotech. Eng. 2010, 32, 1029–1034. [Google Scholar]
  28. Fu, J.; Zhang, R.; Liu, A. Filed test on 25,000 kN m ultra high energy level dynamic consolidation on large thickness gravel foundation. In IOP Conference Series: Materials Science and Engineering; IOP Publishing Ltd.: Singapore, 2018. [Google Scholar]
  29. Feng, S.J.; Shui, W.H.; Tan, K.; Gao, L.Y.; He, L.J. Field Evaluation of Dynamic Compaction on Granular Deposits. J. Perform. Constr. Fac. 2011, 25, 241–249. [Google Scholar] [CrossRef]
  30. Feng, S.; Tan, K.; Shui, W.; Zhang, Y. Densification of desert sands by high energy dynamic compaction. Eng. Geol. 2013, 157, 48–54. [Google Scholar] [CrossRef]
  31. Feng, S.; Du, F.; Chen, H.X.; Mao, J. Centrifuge modeling of preloading consolidation and dynamic compaction in treating dredged soil. Eng. Geol. 2017, 226, 161–171. [Google Scholar] [CrossRef]
  32. Hu, X.Q.; Gao, Z.Y.; Liu, F.Y.; Tao, Y.; Xu, D.H.; Du, Y.G.; Gou, C.F.; Li, M.F. The optimal combination form of vacuum pre-loading combined with electro-osmosis and with dynamic compaction method on the improvement of dredged slurry. Mar. Georesour. Geotec. 2021, 39, 1192–1204. [Google Scholar] [CrossRef]
  33. Yuan, H.; Liu, M.; Li, W.; Wang, Y. Dynamic Compaction Model Tests for the Characteristics of Red Clay Under equal Energy Level. Geotech. Geol. Eng. 2018, 36, 1873–1883. [Google Scholar] [CrossRef]
  34. YS/T 5209-2018; Technical Specification for Dynamic Compaction Foundation. China Planning Press: Beijing, China, 2019. (In Chinese)
  35. Jia, M.C.; Liu, B.; Zhou, X.J. Field Test Study of High Energy Dynamic Compaction on Marine Silty Fine Sand Deposits with Soft Interlayers. J. Build. Constr. 2019, 40, 240–246. [Google Scholar]
  36. GB 50007-2011; Code for Design of Building Foundation. China Architecture and Building Press: Beijing, China, 2012. (In Chinese)
  37. Menard, L.; Broise, Y. Theoretical and Practical Aspects of Dynamic Consolidation. Geotechnique 1975, 25, 3–18. [Google Scholar] [CrossRef]
  38. Lukas, R.G. Dynamic Compaction for Highway Construction. Design and Construction Guidelines; Rep. No. FHWA/RD-86/133; U.S. Federal Highway Administration: Washington, DC, USA, 1986; Volume 1, pp. 204–219. [Google Scholar]
  39. Rollins, K.M.; Rogers, G.W. Mitigation Measures for Small Structures on Collapsible Alluvial Soils. J. Geotech. Eng. 1994, 120, 1533–1553. [Google Scholar] [CrossRef]
  40. Leonards, G.A.; Holtz, R.D.; Cutter, W.A. Dynamic Compaction of Granular Soils. J. Geotech. Eng. Div. 1980, 106, 35–44. [Google Scholar] [CrossRef]
Figure 1. View of the construction site.
Sustainability 15 04756 g001
Figure 2. Contour map of the filling soil thickness.
Sustainability 15 04756 g002
Figure 3. Geological condition of the T2 testing zone.
Sustainability 15 04756 g003
Figure 4. Layout of DC and testing points in T2.
Sustainability 15 04756 g004
Figure 5. Flow chart of DC operation and the tests.
Sustainability 15 04756 g005
Figure 6. View of DC during and after operations: (a) DC device; (b) crater after DC.
Sustainability 15 04756 g006
Figure 7. Results of the SPT for (a) T1, (b) T2 and (c) T3.
Sustainability 15 04756 g007aSustainability 15 04756 g007b
Figure 8. Results of the DPT for (a) T1, (b) T2 and (c) T3.
Sustainability 15 04756 g008
Figure 9. Results of the SASW tests for (a) T1, (b) T2 and (c) T3.
Sustainability 15 04756 g009aSustainability 15 04756 g009b
Figure 10. Results of the plate-load test for (a) T1, (b) T2 and (c) T3.
Sustainability 15 04756 g010
Table 1. Physicaomechanical characterization of soil layers.
Layer No.Layer NameAverage Thickness (m)Density (g/cm3)Moisture Content (%)Void RatioSPT Blow CountCPT TestsPlate-Load Tests
Tip Resistance (MPa)Side Friction (kPa)Modulus of Deformation (MPa)Bearing Capacity (kPa)
Filling soil11--------
Silty clay3.011.9128.00.8597.01.555814.3176.0
②-1Silty clay1.851.9031.41.0483.80.86338.8133.3
②-3Gravel1.80----3.607815.3189.3
②-4Gravelly silty clay1.571.8930.20.7807.72.2080--
Gravelly silty clay1.761.9030.40.7937.91.8090--
③-1Organic clay1.911.8433.70.9943.30.9337--
③-4Gravel1.20----4.50110--
③-5Silty clay2.351.9129.80.8317.81.7075--
③-6Organic clay2.271.8137.00.8637.62.0078--
Silty clay3.401.8533.90.91911.42.109514.7208.7
Table 2. DC operation parameters.
Testing ZoneTamping PassEnergy Level (kN·m)Spacing (m)Stop CriterionIroning DC Energy (kN·m)Improvement Requirement
Improvement Depth (m)Bearing Capacity (kPa)Compression Modulus (MPa)
T1First pass40006.0s < 10 cm15006.0≥160≥10
Second pass40006.0
T2First pass800010.0s < 20 cm200010.0≥160≥10
Second pass800010.0s < 20 cm
Third pass400010.0s < 10 cm
T3First pass15,00010.0s < 25 cm200015.0≥160≥10
Second pass15,00010.0s < 20 cm
Third pass800010.0s < 20 cm
Table 3. Results of DC for each test zone.
Test ZoneTamping PassEnergy Level (kN·m)Blow Counts per PassCumulative Crater Depth of Single DC Point (m)Average Settlement after DC (m)
RangeAverageRangeAverage
T1First pass400012–15143.12–4.843.980.66
Second pass400012–13132.42–3.442.93
T2First pass800010–15133.79–6.174.980.52
Second pass80008–19145.17–5.825.50
Third pass40008–11101.85–2.562.21
T3First pass15,00014–16153.37–5.604.670.94
Second pas15,00011–14133.47–5.719.18
Third pass80008–1091.57–3.002.29
Table 4. Improvement depth in each test zone.
Test ZoneImprovement Depth (m)Empirical Coefficient n
SPTDPTSASWPreferred Values
T17.07.58.07.00.324
T211.011.511.011.00.357
T313.012.513.012.50.344
Disclaimer/Publisher’s Note: The statements, opinions and data contained in all publications are solely those of the individual author(s) and contributor(s) and not of MDPI and/or the editor(s). MDPI and/or the editor(s) disclaim responsibility for any injury to people or property resulting from any ideas, methods, instructions or products referred to in the content.

