Article

Digitalization as a Provider of Sustainability?—The Role and Acceptance of Digital Technologies in Fashion Stores

by
Louisa von der Assen
Faculty of Economics and Social Science, University of Potsdam, 14482 Potsdam, Germany
Sustainability 2023, 15(5), 4621; https://doi.org/10.3390/su15054621
Submission received: 13 January 2023 / Revised: 27 February 2023 / Accepted: 3 March 2023 / Published: 5 March 2023
(This article belongs to the Special Issue Sustainable Fashion and Textile Management)

Abstract

:
Digitalization, as well as sustainability, are gaining increased relevance and have attracted significant attention in research and practice. However, the research already published about this topic examining digitalization in the retail sector does not consider the acceptance of related innovations, nor their impact on sustainability. Therefore, this article critically analyzes the acceptance of customers towards digital technologies in fashion stores as well as their impact on sustainability in the textile industry. The comprehensive analysis of the literature and the current state of research provide the basis of this paper. Theoretical models, such as the Technology-Acceptance-Model (TAM) and the Unified Theory of Acceptance and Use of Technology 2 (UTAUT 2) enable the evaluation of expectations and acceptance, as well as the assessment of possible inhibitory factors for the subsequent descriptive and statistical examination of the acceptance of digital technologies in fashion stores. The research on this subject was examined in a quantitative way. The key findings show that customers do accept digital technologies in fashion stores. The final part of this contribution describes the innovative Digitalization 4 Sustainability Framework which shows that digital technologies at the point of sale (PoS) in fashion stores could have a positive impact on sustainability. Overall, this paper shows that it is particularly important for fashion stores to concentrate on their individual strengths and customer needs as well as to indicate a more sustainable way by using digital technologies, in order to achieve added value for the customers and to set themselves apart from the competition while designing a more sustainable future. Moreover, fashion stores should make it a point of their honor to harness the power of digitalization for sake of sustainability and economic value creation.

1. Introduction

Although large vertical players and online giants are gaining ever-increasing market share, many fashion stores are struggling to adapt to the structural and disruptive changes caused by digitalization [1]. Digital disruption, which describes the devaluation and marginalization of existing business models by digitalization, is forcing the stationary retail trade to adapt and develop accordingly [2]. Moreover, it also has a significant impact on the customer’s needs and expectations when it comes to digitalization [3]. Therefore, it is necessary to understand how consumers accept digital innovations in the form of in-store technologies at the PoS and to get to know the impact of those on sustainability, since digitalization, as well as sustainability are gaining increased relevance and have attracted significant attention in research and practice. Moreover, the fashion industry belongs to critical industries that often do not comply with ecological, social, and economic standards. Digitalization not only substantially contributes to better, faster, and leaner processes, but also to efficient and sustainable resource disposition and consumption in the fashion industry. This paper shows the implications of digitalization for fashion retail stores from the viewpoint of sustainability. Thus, it strikes the balance between digitalization and sustainability showing that both strands of the contemporary management discussion are fully compatible. Adopting a conceptual point of view, the novelty of this paper stems from the co-alignment of these topics. While the digitalization and sustainability debate often incorporated juxtaposing positions, this research endorses a framework for creating shared value (CSV), when harmonizing stakeholder and shareholder interests in a self-enforcing way [4,5]. This paper evidences that store management in the fashion industry may greatly benefit from sustainable digitalization options. The latter incorporates a full range of tools and techniques that foster platform-based transactions and personalized, individualized, and localized communication processes. Digitalization tools represent a portfolio of digitally supported devices ranging from apps to hardware and software solutions, such as automized processes. This article defends the point of view that digitalization tools reflect a class of applications that take advantage of digitalization to a high degree. For sure, they may enter different maturity stages with respect to the technological level: Baseline digitalization versus rocket science digitalization in the shape of AI-promoted business and customer solutions. In this case, a broader viewpoint of digitalization was chosen because this fancy term evokes a flurry of connotations among interviewees. Furthermore, this article is also a plea for sustainable digitalization due to smarter resource management and (invisible) asset disposition such as time, convenience, and service. Beyond the two dimensions of digitalization and sustainability, economic value creation may be propelled by the aforementioned dimensions. Sustainable digitalization sounds akin to a buzzword but may usher in a new era of philanthropic and profitable business models [4,5].
However, the research already published about these topics, for example, those by Deloitte, McKinsey, and other researchers which have examined digitalization in the retail sector, do not consider the acceptance of related innovations, nor their impact on sustainability [6,7,8,9,10,11]. Hence, this study explores the acceptance of customers towards digital technologies in fashion stores and what impact they have on sustainability. The goal of the investigation is therefore outlined with the following research questions: “Do customers accept digital technologies in fashion stores?” and “Which impact do digital technologies in fashion stores have on sustainability?”. Hereby, this article adds to what is already known in the field of research concerning sustainability and digital technologies in the context of digitalization. Further, this research adapts constructs of the well-established technology acceptance model, the UTAUT 2.
This paper is structured as follows: In Section 2, a short literature review with a brief background about the terms and used theories are provided. Section 3 contains the methodology developed in order to identify the research gaps. The following section shows the research outcomes, whereas Section 5 describes the Digitalization 4 Sustainability Framework. The research outcomes will then be discussed in Section 6. Section 7 and Section 8 include the conclusion, as well as limitations and implications.

2. Literature Review

2.1. Digitalization Imperative for Management and Marketing

Digitalization is now sweeping through every aspect of people’s lives and can be regarded as a cross-sectional platform technology. In a dynamic world where speed—more than quality or cost efficiency—is the key to success, digital technology makes processes faster, more accurate, sometimes smarter, and more convenient. In several ways, the twenty-first century is different from previous ones, because digital technology is evolving in such a way that everyone is part of the change, and “the Future” arrived suddenly, bringing new developments with it. The new normal is closely linked with digitalization and ensuing topics, such as augmented realities, machine learning, or artificial intelligence.
The beginnings of the digital era can be traced back to the early 2000s, specifically to 2002, when the transition from analog to digital information increased significantly compared to previous years [12]. Although the term digitalization is omnipresent, it remains a controversial topic in theory and practice [13,14]. No consistent understanding of the term has yet been established in the business literature. The terms “digital” or “digitalization” are still undefined, as their meanings depend on the industry, the context, and the profession of the competence field [14,15]. In this article, the term digitalization describes a process in which formerly analog information is digitized by information technology or the existing digital information is stored digitally but not processed. The fundamentals are the structured attitude of the data and the automation of processes [16]. Within this context, digital innovations play an important role because they enable the structuring, standardization, and automation of processes [17]. Digitalization may contribute to efficient and resilient processes by means of better resource disposition and machine-executed standard operation procedures.
Concerning the digitalization of companies, there are various potentials that have to be worked on to realize these increases in effectiveness and efficiency with reduced cost structures and higher quality standards. As part of the currently evolving digital transformation, companies are encouraged to automate and parallelize operational processes and to improve the quality of information. The starting points for versatile integration in various areas of the company and the removal of restrictions to save time and space by utilizing digital tools also belong to these potentials. Digitalization thus establishes new structures and processes in companies that are supposed to achieve outcomes that increase effectiveness and efficiency [16,18]. A digital transformation occurs as companies exploit technological innovations to shift their value chains and business models with the aim of providing more efficient service and fulfilling customer requirements as effectively as possible. The dimensions of the digitalization process could be of a temporal, financial, spatial, and qualitative nature. This requires employing the latest technologies in all areas of the company’s value-creation process [19]. In addition, businesses need to have data acquisition, exchange, analysis, and conversion skills. The information obtained from the processed data is used for the decision-making process and therefore for the company’s strategic and operational orientation. The so-called “enablers” (technologies) that lead to new services or applications also function as instruments of a digital transformation. The degree of digitalization of the transformation of the business model can mean incremental or even radical changes for the company. The degree of innovation that the transformation entails is measured, for example, by the benchmarks of customers, partners, and industries [20]. When adopting a sustainability standpoint, ecological and economic responsibility may be in conflict with social responsibility, because resource-efficient digitalization kills the jobs of the working poor. On the one hand, digital progress corresponds with ecological and economic targets, because scarce resources are deployed in a very productive way as retail and platform giant Amazon prove relentlessly. On the other hand, intelligent digitalization bears the seeds of human labor devaluation by means of algorithms, artificial intelligence, and applied software and service engineering [21]. Since those digital innovations are often driven by employees, they must be highly willing to accept those. Even though there are already several companies with a high propensity to innovate, a large proportion of established retail companies still show room for improvement. For these companies, there is a risk of missing the opportunity to keep up with the very dynamic transformation processes. The resulting loss of market share leads to a lack of future viability and a loss of customers [17].

2.2. Digital Technologies as Change Agents

There are various definitions when it comes to digital technologies, therefore it is difficult to find a proper definition of this term. According to Loebbecke [22], digital technologies refer to all technologies that are used to create, process, transmit, and utilize digital commodities, which are grouped together under the term “Information, Communication, and Media Technologies (ICMT)”. Furthermore, Yoo et al. [23] indicate that digital technologies differentiate from past technologies in the following three ways: (1) re-programmability, which isolates a device’s functional logic from its physical representation; (2) data homogenization, which permits the storage, transmission, and processing of digital contents using the same tool and networks; and (3) self-referential nature, which yields positive network externalities that speed up the production of digital contents. Moreover, he invokes a modular architecture for digital technologies, comprising the four layers of service, content, network, and device. This facilitates the delimitation of units and services due to re-programmability and the delimitation of network and content due to the homogenization of data [23]. Those digital technologies can enable important business advancements such as improved customer experience and engagement, operational simplicity, and corporate innovation [14,24]. Digital tools employed stand for a full range of devices, techniques, or companions resembling assisting systems of decision and transaction support. They incorporate a class of problem solutions rather than a digital solitaire.
Since the present research article deals with the fashion industry, we are focusing on those kinds of digital technologies, which can be found at the PoS in fashion stores. Today, digital technologies are wearable, smart-phone based, connected, and may become implanted service solutions as medical tracking vividly evidence. Rasche, Margaria, and Floyd [25] sketched out the TTTPPP framework that stands in a digital age of tracing, tracking, tapping, profiling, predicting, and ensuing profits due to professional sequences of data transformation that lead to better, quicker, and smarter decision making. Technologies like digital price tags, beacons, QR codes as well as mobile payment are rather basic tools for the purpose of endorsing retailing processes, which lead to a higher convenience for the customer [26,27]. Geofencing resembles an advanced tool that is operated with satellite technology used over a range of up to several kilometers. Aided by this technology, potential customers in the vicinity of the correspondingly equipped store receive push messages regarding special offers or discount campaigns [28]. This kind of precision marketing excels in a personalized, individualized, and localized customer approach that assures high-quality communication [29,30,31,32]. Click-and-collect technologies stand for a self-enhancing ecosystem of stationery and internet-based channels. When employing these technologies professionally, resource-saving and efficiency gains may be possible due to a lean and smart philosophy [33]. Furthermore, large stores can be transformed with the help of digital technologies like virtual reality glasses or augmented technologies into showrooms that feature only a few physical products. The products can then be purchased via QR code scanning through a smartphone and then either delivered to the store or to the customer’s home. This method combines the stationary advantage of haptics with the trend of shopping online directly at the PoS [34]. Virtual reality glasses enable the customer to be transferred to a product world in a personalized, individualized, and localized manner. This technology might increase the likelihood of a purchase, for example, with kitchens or sports products that can be experienced virtually by customers [35,36]. Digital companions assist consumers and store staff alike. Think of digital changing rooms using RFID tags to identify the items selected by the customer. Beyond fast-track selection, AI-based algorithms may profile the client and predict prospective wants, wishes, and transactions. Product information such as size offers, color packages, cross-selling offers, or details regarding the item’s availability provides enhanced value to the customer. The magic mirror application takes advantage of sensors recording the surroundings in a 3D format. The latter employs intuitive gesture control as a means to make the client dress his or her image in a 2D format while not being forced to change clothes. Individual styling is easy, convenient, and fast saving time while boosting customer value [27,31]. This software can also be synchronized with the ERP (enterprise resource planning) system and the online shop so that consumers can learn about prices, sizes, or colors to make them order directly [37]. Digital shop window provides customers with a 24/7 opportunity because they may shop in front of the store while standing outside. Strict opening hours are softened [38]. In-store navigation corresponds with indoor positioning systems (IPS) helping the customer to shop lean, fast, and smart [39]. Moreover, self-checkouts and autonomous scanning via a 360-degree barcode scanner developed by Wincor and Fujitsu lead to lean and mean transaction processes being fully automated [40]. Drone-triggered retail-bot solutions as well as service bots or robotic inventory management usher in a new era of super-efficient standard operation procedures that qualify for digitalization, automation, and standardization on a large-scale format [41,42,43]. Additionally, artificial intelligence is heralded as the next big bang technology incorporating all features of disruptive innovations. In-store cameras that measure consumer reactions to product placements and layouts, as well as the dwell and gaze time are examples of AI-induced customer observation. This gives insights to the store owners on which products consumers are most interested in and helps to improve their purchasing decisions and to create tailor-made problem solutions [32,44]. AI inventory management is another promising option to get a close grip on consumer purchasing data for the purpose of the three Ps, profiling, prediction, and profit, after having accomplished tracing, tracking, and tapping beforehand. As a result, the system could start prioritizing manual auditing of some regions over others. When demand is predicted precisely, items can be produced and crafted alongside consumer wants in a tailor-made fashion [45,46].

2.3. Sustainability

Not only do managers nowadays increasingly place sustainability operations at the center of their company [47,48], but also 300 years ago there was already a concept of sustainability, which states that only those quantities of wood could be cut that could also grow again through planned reforestation [49]. Therefore, both scientific and institutional debates have long focused on sustainability. The 2030 Agenda developed by the United Nations reaffirmed the need for a paradigm shift in the approach to sustainable development. In this agenda, a global plan for the preservation and promotion of prosperity, as well as peace and the protection of the environment is established. Additionally, it has a set of guidelines that oblige the governments of the member nations to honor people and subsequently our planet. The alleged sustainable development goals (SDGs), include 17 objectives and 169 goals that must be accomplished by 2030. [50,51]. These SDGs have their focus on three different sustainability aspects: economic growth, social inclusion, and, environmental protection [52]. Additionally, Balderjahn [49] states that the extent of sustainable action is divided into three basic dimensions: ecological, social, and economic dimensions. Sustainable economic activity and global environmental protection are thus based on the preservation of social prosperity, the protection of resources and the climate, the protection of biodiversity, and the socially responsible behavior of people. From a social perspective, corporate social responsibility (CSR), is of great importance for the corporate sector. The guiding principle formulated according to this is seen in a commitment by companies to a comprehensive assumption of responsibility towards society, stakeholders, and the natural environment. In this context, the reaction of companies to sustainability-related demands and expectations of stakeholders should be taken into account, as well as the requirements of sustainable development by the company’s management [49].
Since this research article is focused on sustainability in the fashion industry, it is indispensable to have a look at its impact on sustainability: With a market size of 1.5 trillion US dollars, the fashion industry is one of the largest industries in the world. It is currently undergoing an enormous transformation process from “fast fashion” to “more sustainable fashion”. This change is triggered by devastating effects on the environment and on a large number of participants along the production chain. As a result, producers are experiencing enormously high-water consumption, pollution from toxic chemicals, an increase in human rights violations, and rising greenhouse gas emissions [53]. Recent research shows that by raising the CSR commitment further, companies and manufacturers will have a great benefit compared to their competitors [54]. Within the context of digital technologies at the PoS, the question arouses, whether those can have a positive impact on the environment.

2.4. Technology-Acceptance

Regarding acceptance, there are numerous different definitions and accommodating concepts. For instance, the Cambridge Dictionary defines it as people’s willingness to use a new product, service, or idea [55]. Conversely, the Oxford Dictionaries describe acceptance as the act of consenting to obtain or pursue an offer [56]. Therefore, acceptance lacks a clear definition, given that it is defined differently depending on the business field. As this study is concerned with digitalization and innovative technologies, it is important to understand more about customers’ reasons for accepting or rejecting both. Technological acceptance, diffusion, and utilization often go hand in hand representing a technology cascade starting with technological awareness. The latter shares common ground with technology and innovation marketing because the mere existence and availability of a promising technology is only a necessity, but not a sufficient condition for market success. The construct of acceptance and adoption has been extensively studied and presented in various ways. Figure 1 shows the models that have been constructed based on the research to help to understand how people perceive and accept various technologies:
Within this paper, the focus lies on the first and last models, the TAM and UTAUT 2, which are further described in what follows.

2.4.1. Technology-Acceptance-Model

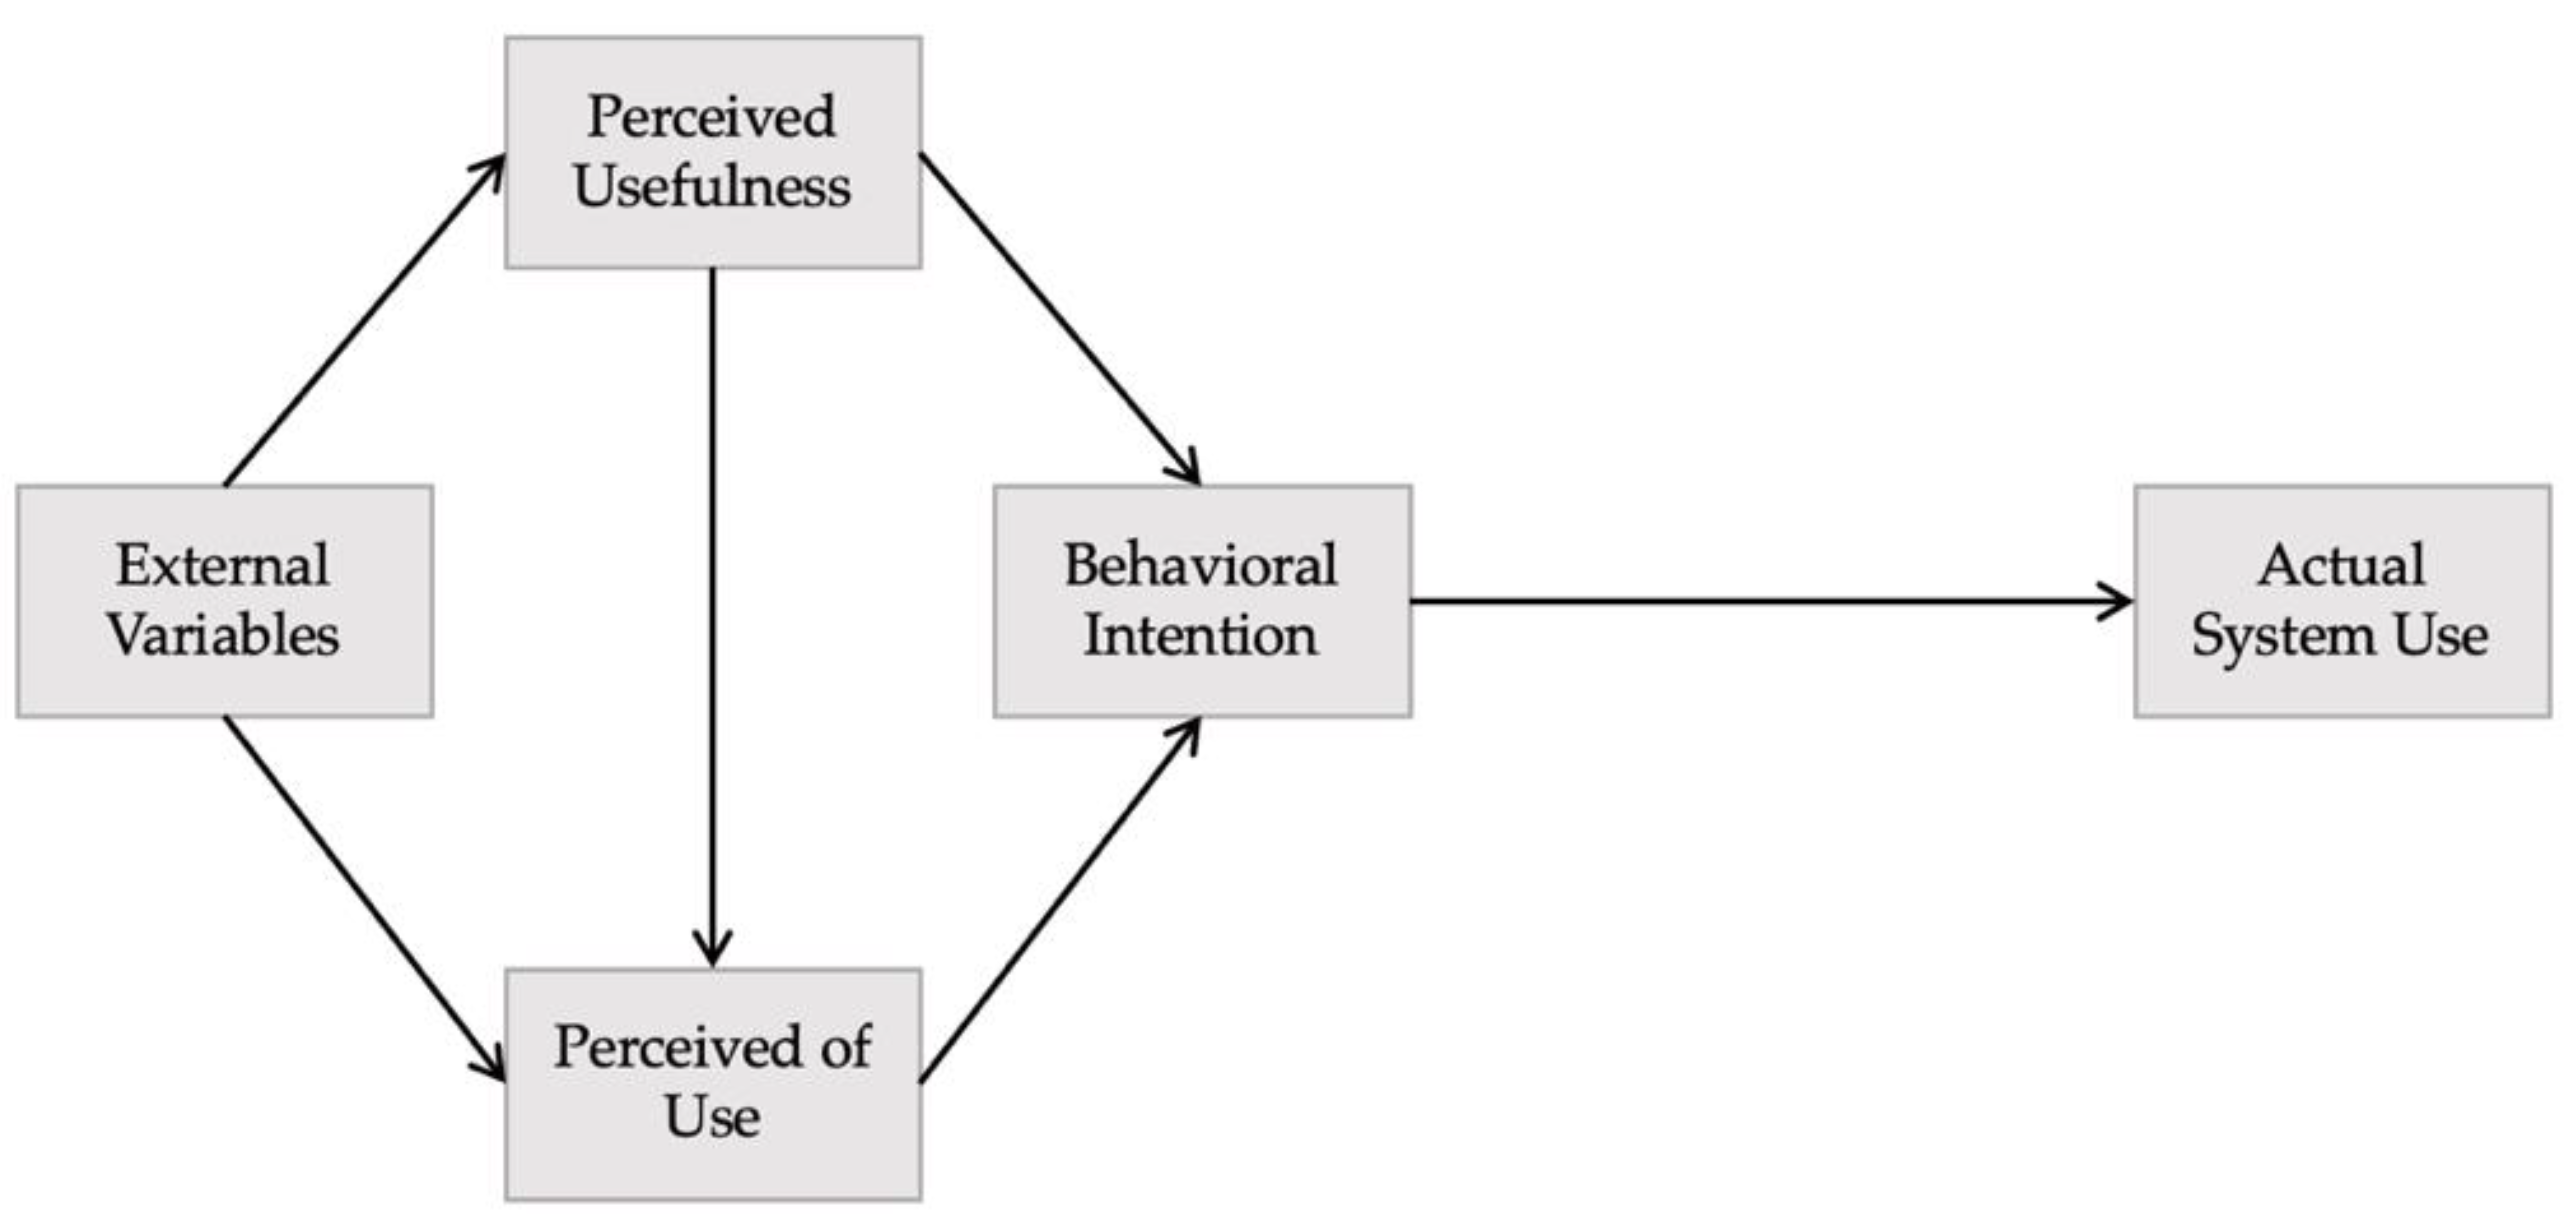
The TAM was originally developed with the aim of analyzing the effects of system features on user acceptance of information systems. It seeks to gain a further understanding of the process of user acceptance to achieve a corresponding improvement in acceptance levels, as well as to gain new insights for the design and implementation of technologies. This model also explains the motivational processes that mediate between user behavior and system characteristics [57]. The term acceptance is understood as a repeated action. With this in mind, attitudes are seen as motivation, combined with cognitive assessment and evaluation. Motivation is the perception of the environment, which is linked to the incentive to react to behavior [58]. The motivation to use the system is influenced by two fundamental elements the perceived ease of use and the perceived usefulness. The latter is causally influenced by ease of use [57]. Perceived usefulness describes the extent to which the user perceives a revision of the work performed, whereas perceived ease of use means the application is free of any effort. The premise for achieving the perceived ease of use is, on the one hand, the self-confidence of the users and, on the other hand, the adaptation of the system-related usability with the target system [59]. Figure 2 demonstrates, among other things, the consequences of the perceived usefulness and user-friendliness, which can facilitate a positive attitude toward the intended use of the technology [57].
If all influencing factors are assessed positively or customer expectations are met, this outcome can lead to a shopping experience [60]. Since this model is only based on two drivers that influence user acceptance and does not include social and hedonistic factors, further developments of the model were devised in subsequent research.

2.4.2. Unified Theory of Acceptance and Use of Technology 2

The previous model of the unified theory of acceptance (UTAUT) developed from eight models, which were used to explain the usage behavior of information systems. It extended the TAM with four determinants: performance expectancy, effort expectancy, social influence, and facilitating conditions. These determinants stimulate behavioral intention and user behavior [61].
In the latest model, the UTAUT2 (Figure 3), the hedonic motivation factors fun and pleasure and the factors purchase price and habit have been added, while the moderator voluntariness of use is left out [60]. The first determinant of this model, performance expectancy, stands for the perceived benefits of the customers derived from using technologies. The determinant effort expectancy describes the effort that a person has to put into using technologies. The social influence emerges from the family environment, which can influence the use of technology by being open or reluctant to use digital technologies. The facilitating conditions describe the general infrastructure, which is perceived as assistance by the customer. The hedonistic motivators, which are defined as joy in the usage of technology, can also lead to an application of technology for this reason alone. The purchase price factor is seen as a cognitive assessment that compares the perceived benefits of the application and the costs of its use. If the perceived benefit exceeds the costs of use, a behavioral intention is more likely to be induced. The aspect of habit is described as the extent to which an individual adopts behavioral modification as a result of learning [62].
To avoid possible failures, it is important that users are introduced to the technology since they tend to overestimate their own capabilities. The operation of technological innovations requires special knowledge that must be learned in a lengthy process. However, following a first failure, many consumers may develop a generally negative attitude towards the technology concerned. This response can subsequently lead to poor product reviews or even the complete rejection of the technologies. Due to the lack of time in daily business, strategic decisions for the implementation of digital technology are often not sufficiently thought through. The prospect of a model that enables structuring and comparability of different technologies, and identifies both the needs and potential obstacles in dealing with technologies, can facilitate the decision regarding a new strategic direction. Assessing the potential of digital touchpoints and the associated strategic investment planning is not only important for brick-and-mortar retail. The use of technology can satisfy the increased need for information and the need for shopping experiences of customers and thus sustainable competitive advantages can be achieved [58].
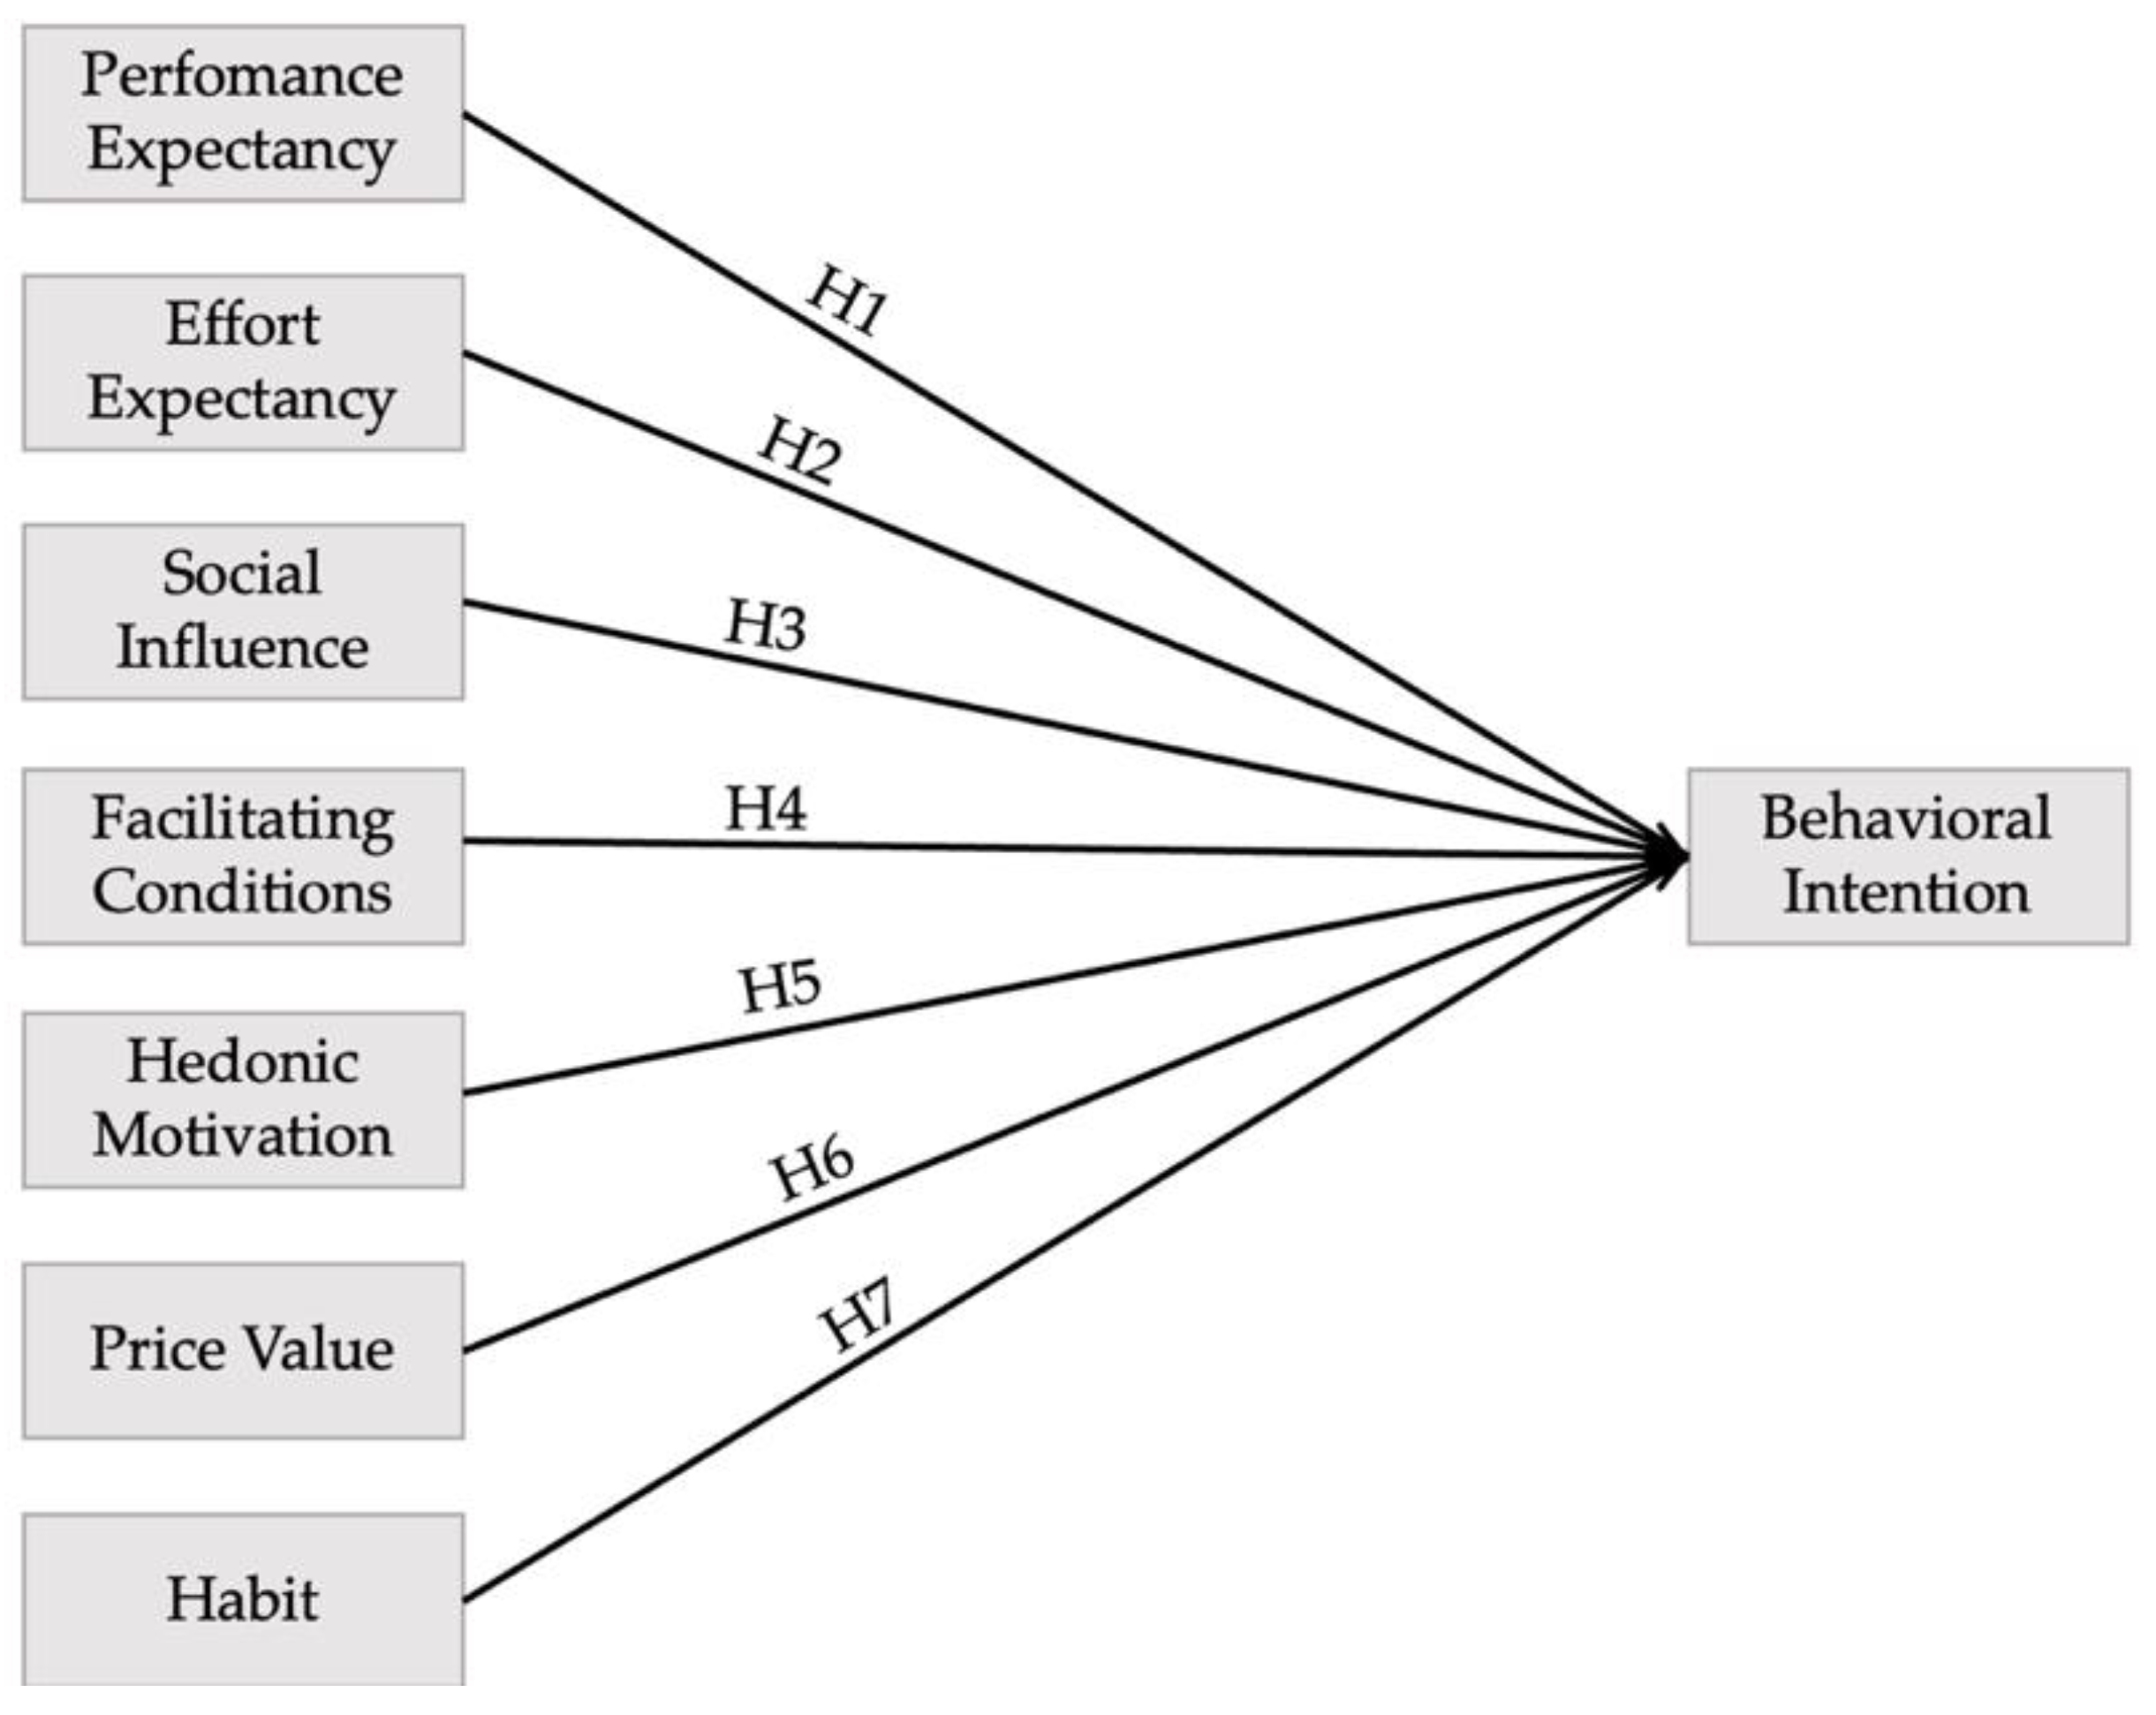
The TAM and the extension to UTAUT2 are considered instruments for testing the probability of success for the introduction of new technologies, and both models facilitate the analysis of the various drivers that lead to acceptance [61]. Accordingly, the initial model TAM is not used to record current developments in the course of the new strategic orientation during the evaluation. Furthermore, this model only inaccurately records technology acceptance, since it was originally utilized in the application of information technologies in the corporate environment. Therefore, the UTAUT2 model will be employed as a theoretical framework for this article to better understand the customer acceptance of digital technologies in department stores. Based on this model the following hypotheses were formulated for the first research question and presented in the theoretical framework below.
Hypothesis 1 (H1).
Performance expectancy positively influences customers’ behavioral intention to use digital technologies in fashion stores.
Hypothesis 2 (H2).
Effort expectancy positively influences customers’ behavioral intention to use digital technologies in fashion stores.
Hypothesis 3 (H3).
Social influence positively influences customers’ behavioral intention to use digital technologies in fashion stores.
Hypothesis 4 (H4).
Facilitating conditions positively influences customers’ behavioral intention to use digital technologies in fashion stores.
Hypothesis 5 (H5).
Hedonic motivation positively influences customers’ behavioral intention to use digital technologies in fashion stores.
Hypothesis 6 (H6).
Price value positively influences customers’ behavioral intention to use digital technologies in fashion stores.
Hypothesis 7 (H7).
Habit positively influences customers’ behavioral intention to use digital technologies in fashion stores.

3. Methodology

3.1. Research Design

In order to answer RQ1, a quantitative methodology from the customer’s viewpoint was utilized. Finally, a quantitative analysis of data is performed [63]. In this study, the required database was collected with the help of an anonymous online survey in the form of a questionnaire with mainly closed questions to ensure comparability of the results, using the questionnaire tool SoSci Survey [64]. The questions were constructed based on before mentioned hypotheses in order to prove them right or wrong and draw conclusions [65]. This online survey was shared via a link in social networks, such as Facebook and LinkedIn, and through emails or WhatsApp to reach a large sample size. Furthermore, social networks were asked to share the link to the survey with their friends, so that a variety of age and interest groups could be obtained for the sample. Hence, the convenience sampling method was executed to ensure that a broad range of questionnaire respondents was included in the sample [66]. With the convenience sampling method, everyone who came across the online questionnaire could open the link and participate. Since potential participants could decide independently if and when they would open the link to the survey, this sample can also be categorized as a self-selection sample [67].
The resulting sample consist initially of 257 participants. After eliminating questionnaires that were not fully filled out, a total of N = 202 (95 females, 107 males), ranging in age from under 18 to over 56 years remained. Of which, 71% of the respondents are from Europe, 18% from Asia, 6% from North America, and the remaining 5% from Africa. The data set with N = 202 respondents provided a solid basis and the sample chosen for the study has also been well reflected, as the aim was to get as many participants as possible from different countries and different ages. However, the results do not allow general statements based on the limited number of data sets.

3.2. Measuring Instruments

This questionnaire is based on the previously described UTAUT2 model, which measures customer acceptance of technologies. Twenty-seven questions (see Supplementary Material S1) were developed based on the original items from Venkatesh et al. [62]. These questions were adapted and modified to address the topic of acceptance of digital technologies in fashion stores and were developed for the following scales: performance expectancy, effort expectancy, social influence, facilitating conditions, hedonic motivations, price value, habit, and behavioral intention. The participants had to rate the statements using a six-point Likert scale (1 = strongly agree; 6 = strongly disagree) in order to avoid a clear center. At least three items were used for each variable.

3.3. Data Analysis

All calculations were conducted by using the statistic programs SPSS (IBM, Version 27) and RStudio (Version 2022.07.2 with the lavaan package) [68]. First of all, we calculated Cronbach’s alpha in order to test the internal invariance of all scales (see Table 1). All of the factors exhibited reasonable internal consistency with values above 0.80 [69]. Then the descriptive statistics, such as mean and SD, as well as bivariate correlations of all variables (see Table 1) were estimated. Thus, before examining the impact of one independent variable on a dependent one, we calculated intercorrelations that display undirected relationships. This gives a first overview of the relationships between the variables. In order to test hypotheses H1 to H7 of RQ1, a linear regression analysis was made with the goal to examine the cause-and-effect relationships of the variables. To be able to make statements and conclusions about the usability of the outcome, the determination coefficient R-squared (R2) and the standard estimations error (SE) served as measures for identifying the quality of prediction. R2 represents the amount of explained variance for a dependent variable that is explained by at least one independent variable. Based on the results, we calculated a path model using RStudio to answer RQ1 and to examine the direct and indirect relationships among variables in a complex model. The theoretical assumptions ( ) were combined with the results of the regression analysis to construct a model that was to be validated by the path analysis. With RMSEA ≤ 0.06, CFI between 0.90 and 0.95, and SRMR ≤ 0.08, a reasonable model fit is stated [70,71]. Finally, the Artificial Neural Networks (ANN) Technique and a sensitivity analysis were conducted.

4. Results

Table 1 shows that all of the variables correlated positively with each other with medium to strong effect sizes. The significant relationships with the behavioral intention all had high effect sizes. Overall, the strongest relationship was found between behavioral intention and habit (r = 0.86, p < 0.001). Besides habit, the performance expectancy, hedonic motivation, and price value were significantly positively correlated with the behavioral intention (r = 0.74, r = 0.70, and r = 0.72, p < 0.001) with an effect size above 0.70. Social influence was significantly related to behavioral intention (r = 0.58, p < 0.001), but this relationship showed the weakest effect size out of the relationships with behavioral intention.
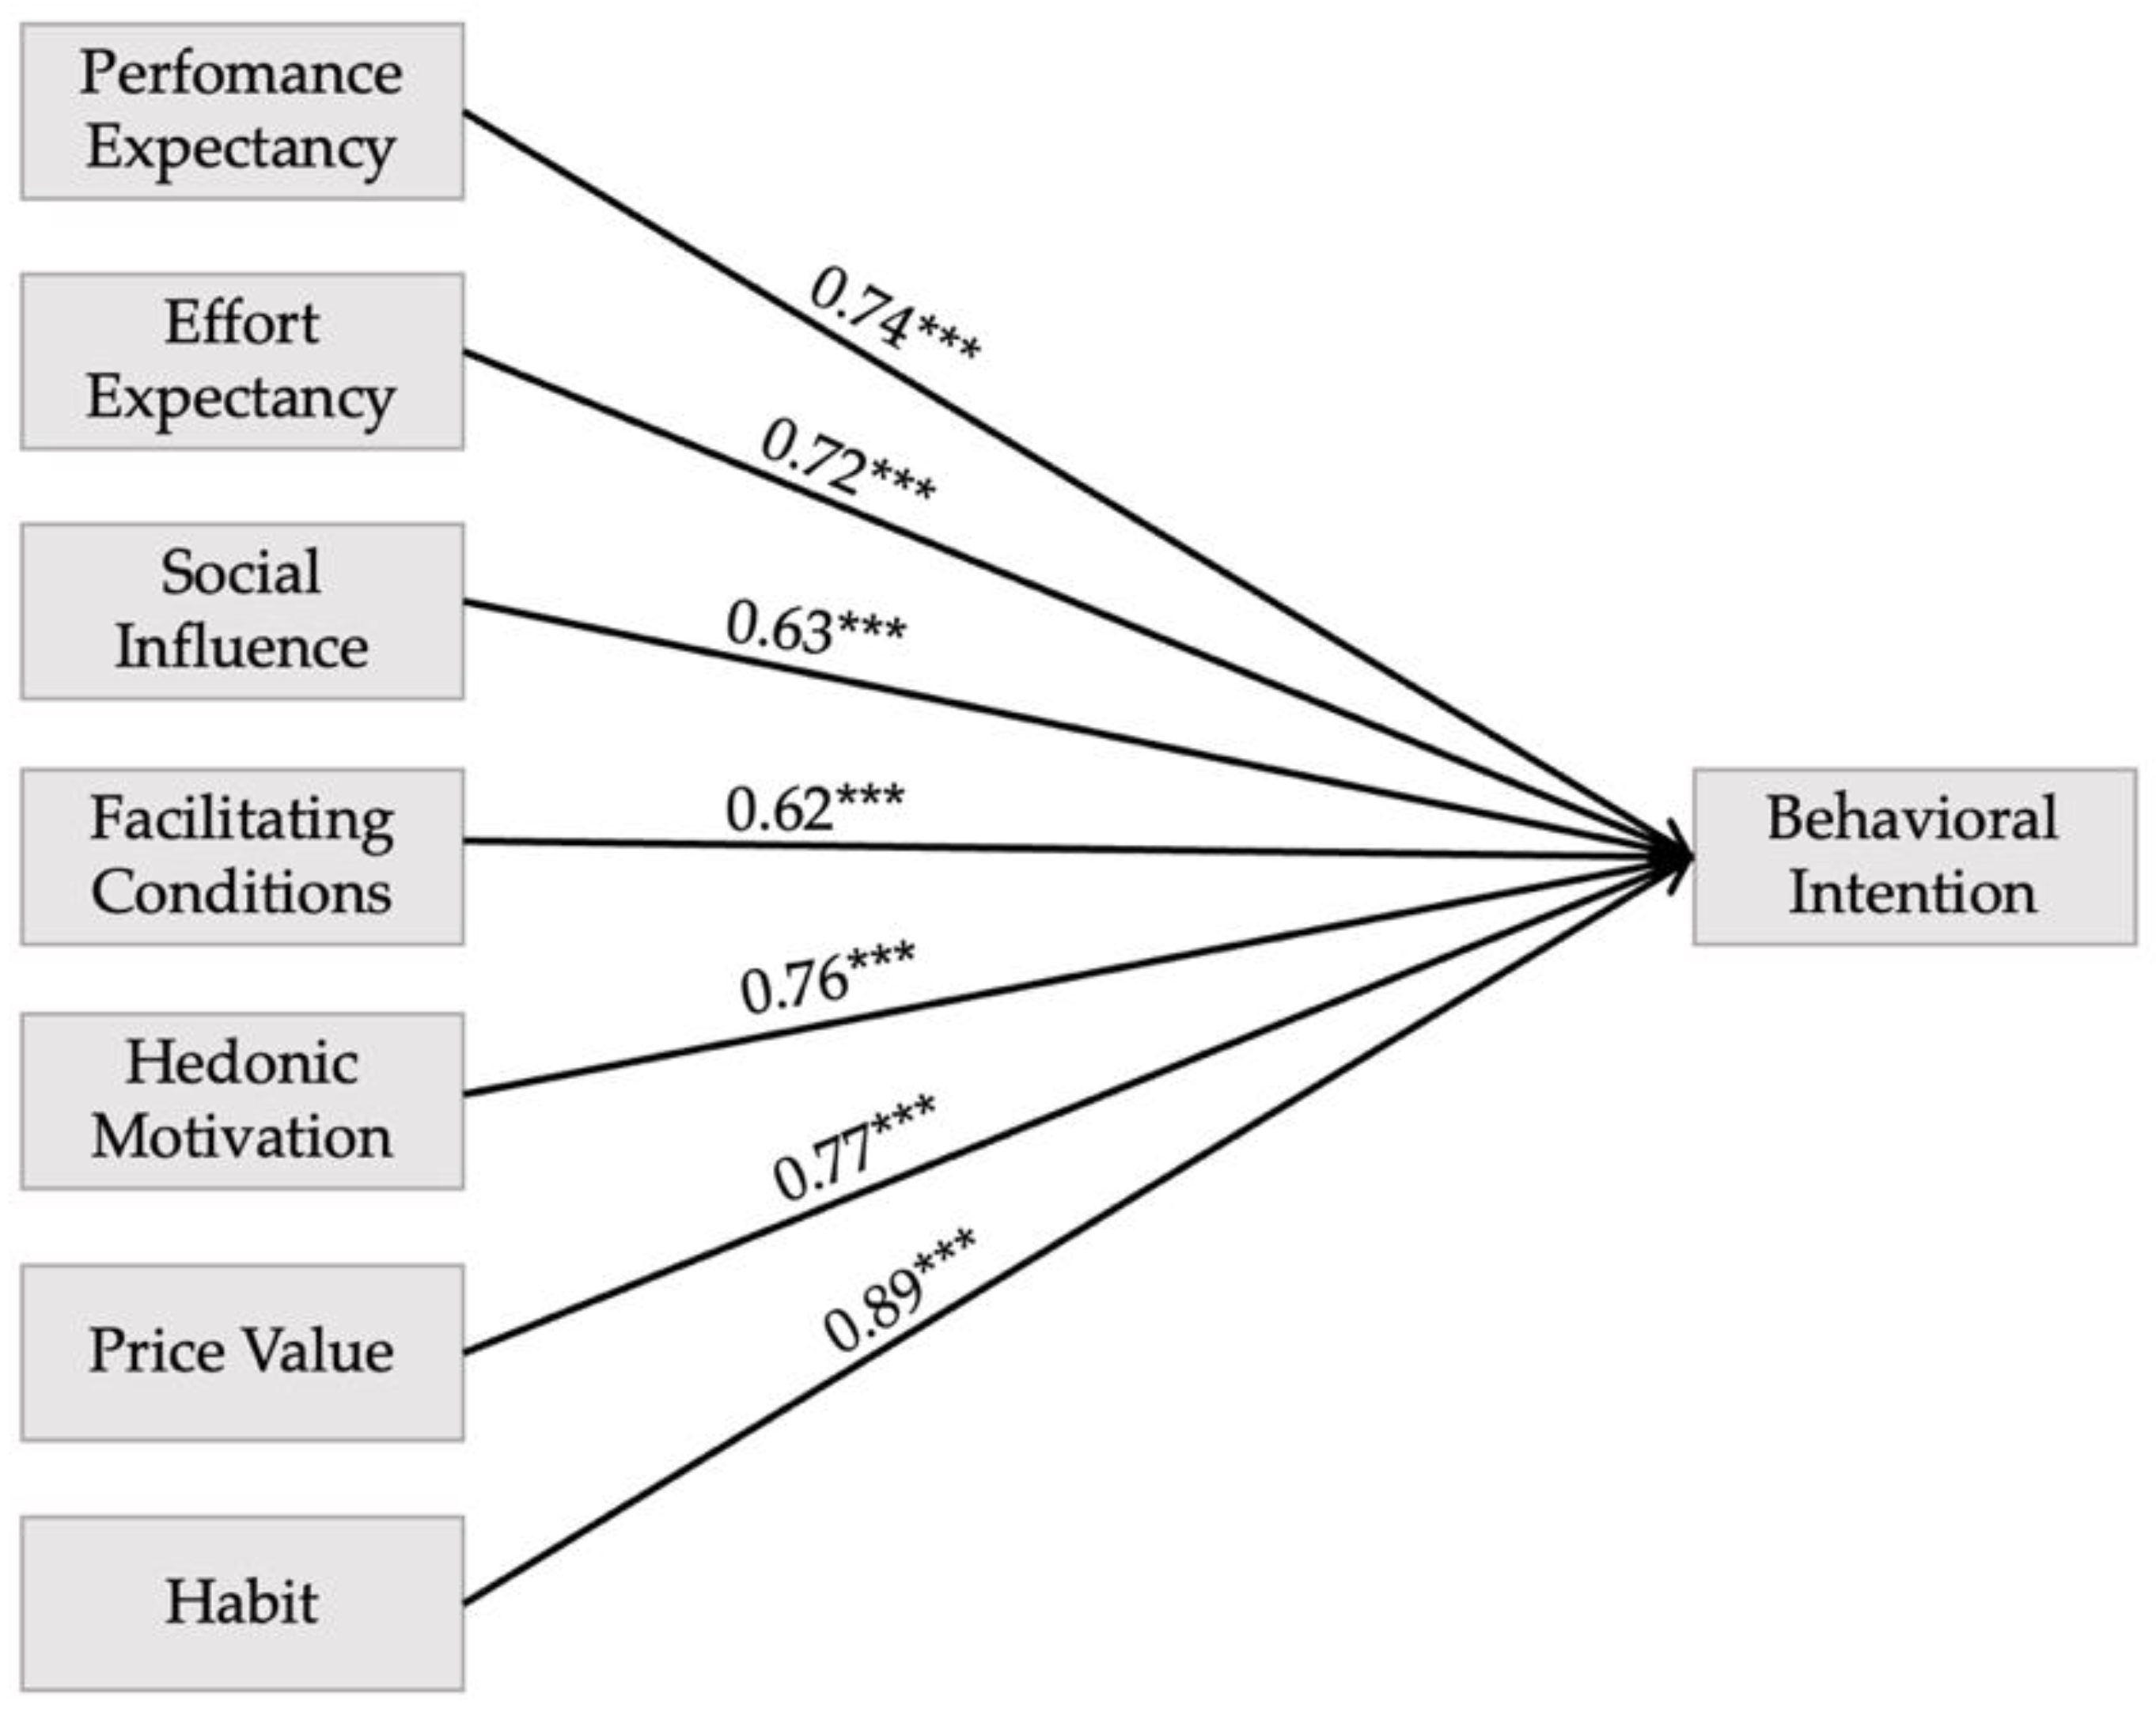
Consequently, based on the theoretical framework, linear and multiple regression analyses were carried out (Figure 4). The standardized regression coefficients of the model to forecast consumers’ behavioral intention to use digital technologies in fashion stores are shown in Figure 5. Moreover, it should be considered that the results presented are based on linear regression analyses and therefore display no related model.
In order to build upon the results, two multiple regression analyses were conducted. The first multiple regression analysis shows a highly significant model for behavioral intention as a dependent variable (see Table A1). The variables accounted for about 80% of the variance of behavioral intention (F (7,194) = 112.786). Habit could be identified as the only strong predictor for behavioral intention (β = 0.75, p ≤ 0.001).
Due to habit having a high impact on behavioral intention, another multiple regression analysis was conducted. In this analysis, the variable habit has been excluded as an independent variable. The aim was to have an insight into other variables that may have an impact on behavioral intention without habit as a strong influencing factor. The second multiple regression analysis shows one possible highly significant model for behavioral intention as a dependent variable. By excluding habit, the remaining variables accounted for about 68% of the variance of behavioral intention (F (6,195) = 73.312). Social influence and price value were the most significant predictors of habit (p < 0.001). The strongest predictor was price value (β = 0.27, p < 0.001), followed by effort expectancy (β = 0.26, p < 0.01). Performance expectancy and hedonic motivation also had an—even if the lowest—impact on behavioral intention (See Table A2).
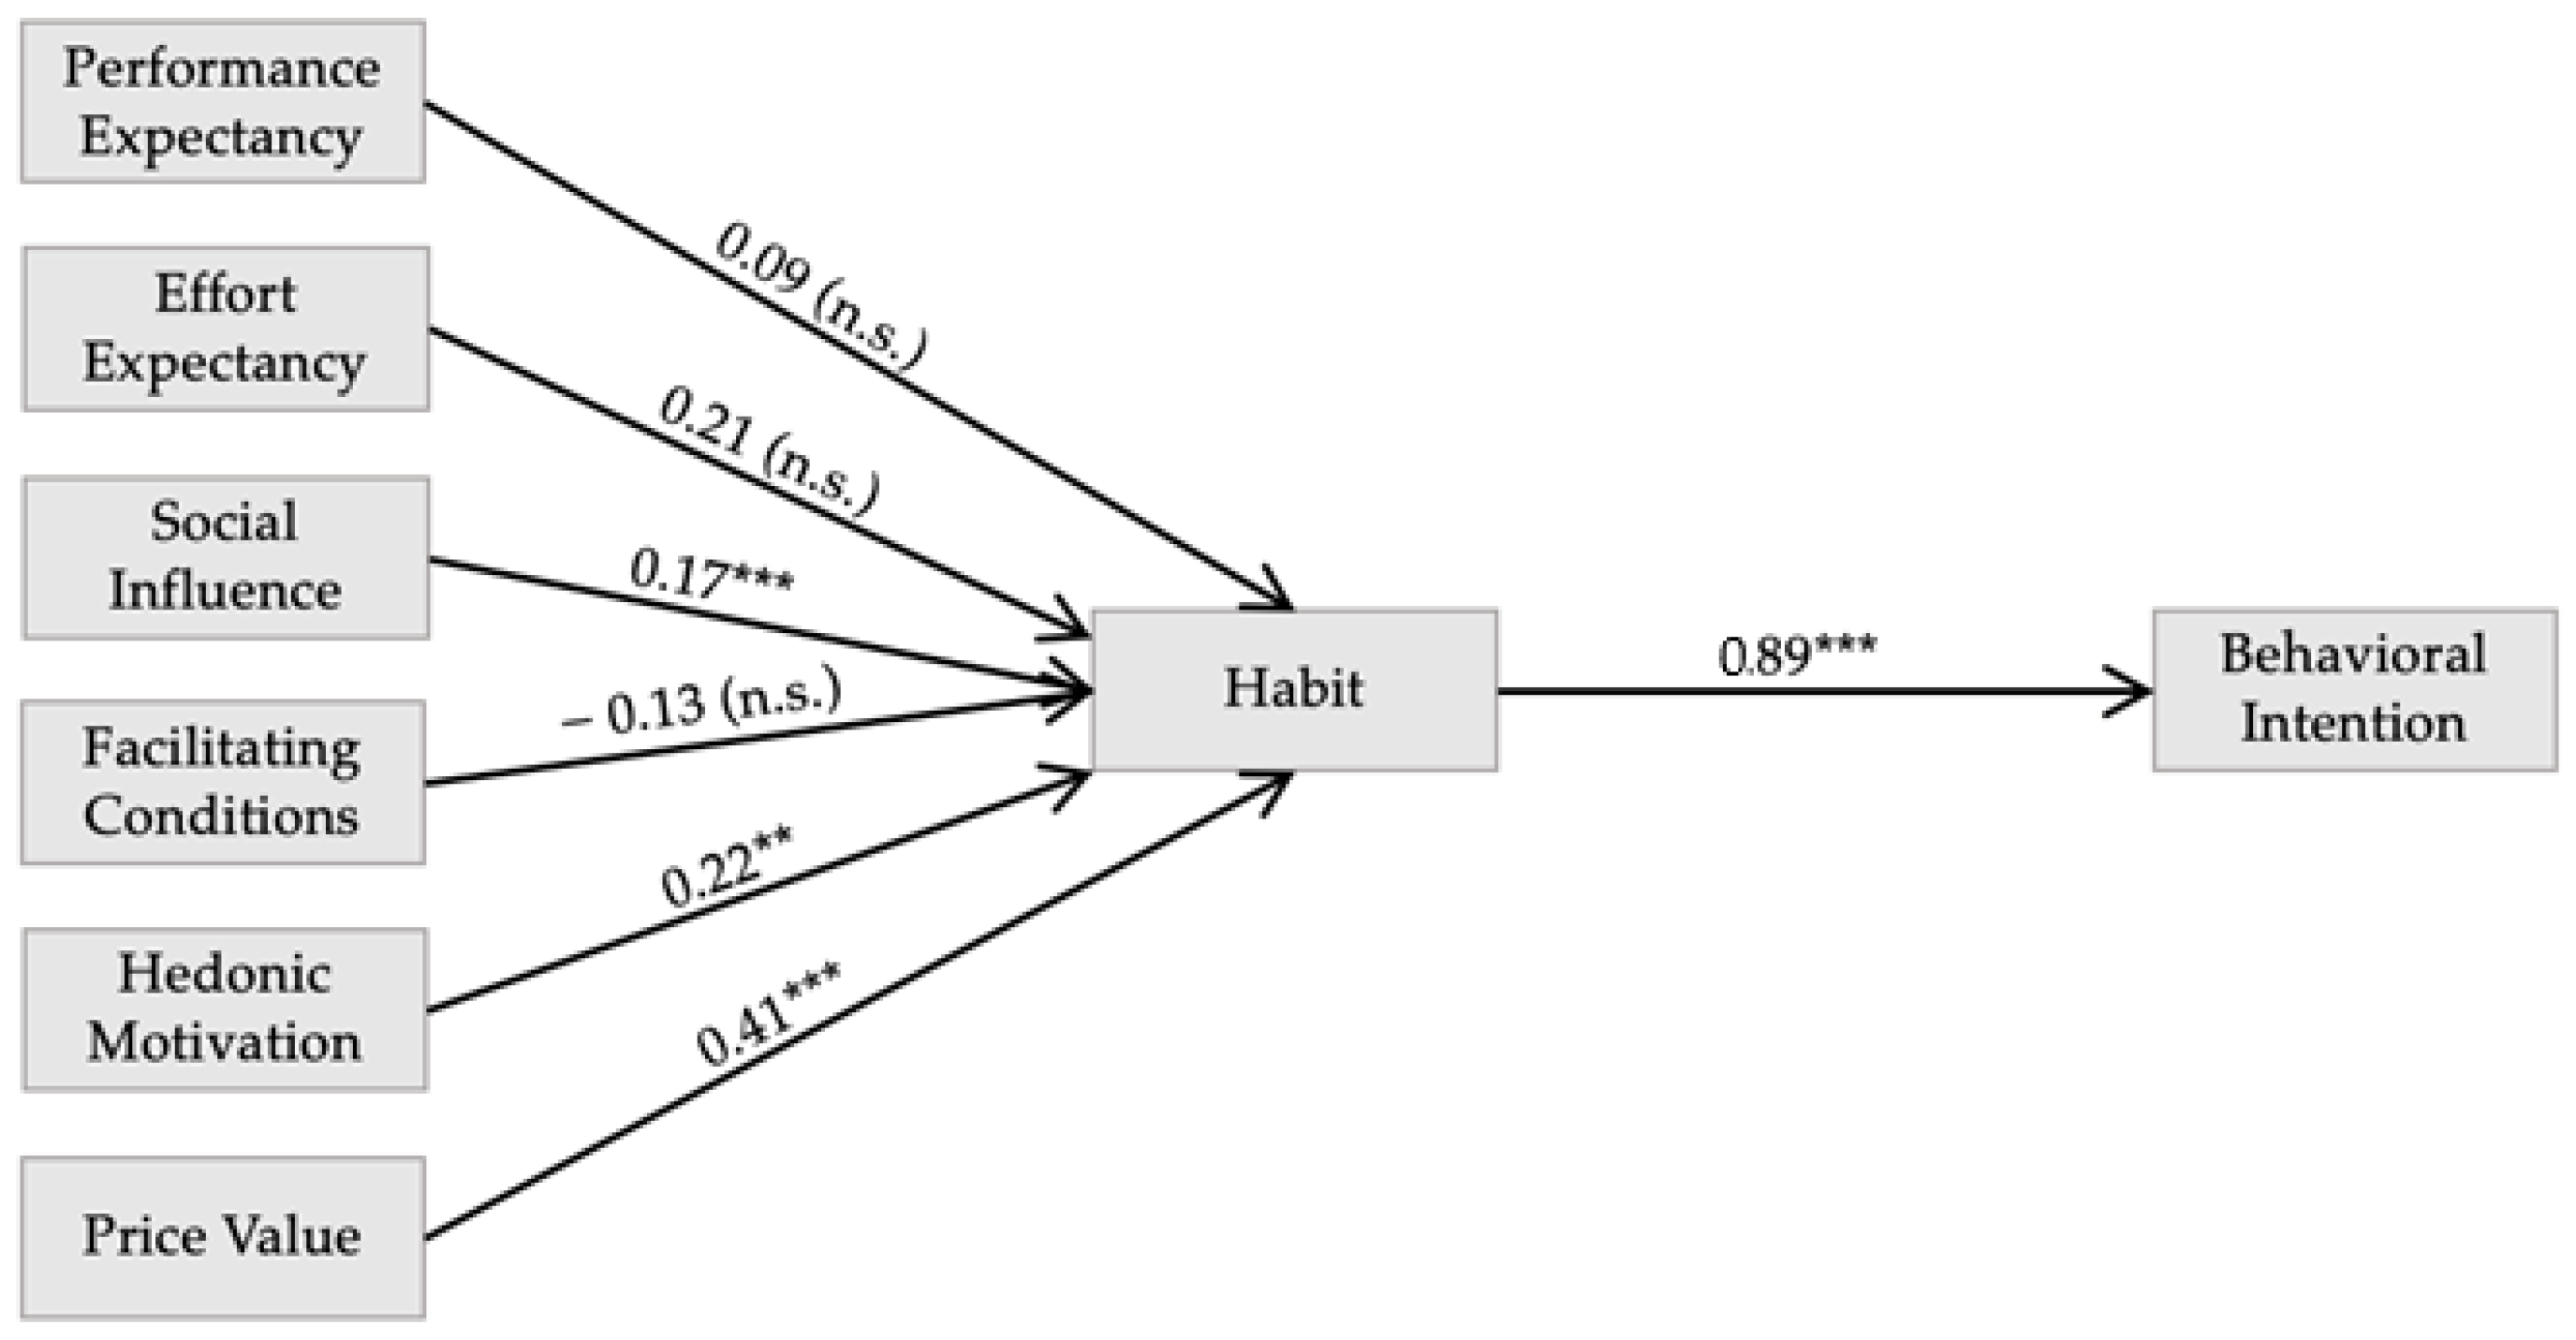
After the descriptive and regression analyses, a path model initially based on the theoretical background (Figure 4) was constructed. Combining regression analysis and path analysis provides a more nuanced and complete understanding of the relationships among variables that affect behavioral intention. The regression analysis identified the individual effects of independent variables on the dependent variable, while the path analysis examined how these variables interact with each other and how their combined effects lead to changes in the intention. Figure 6 shows the standardized path coefficients of the final model of the path analysis.
This final model indicates that habit is a mediating factor and thus a solid model fit was indicated by the fit indices (robust RMSEA = 0.08; SRMR = 0.02; robust CFI = 0.99). The overall model explained about 79% of the variance of the intention to use digital technologies in fashion stores (R2 = 0.785) and 76% of the variance of habit (R2 = 0.764). The path model shows, in contrast to the initial theoretical model (Figure 4), that everything is mainly mediated by habit; price value (β = 0.41, p < 0.001), social influence (β = 0.17, p < 0.001), and hedonic motivation (β = 0.22, p < 0.01) were positive predictors of habit. The price value had the strongest effect on habit. Facilitating conditions, performance expectancy, and effort expectancy showed no predictive power (p > 0.05).
Finally, the path model shows that habit (β = 0.89, p < 0.001) has the strongest predictive power on behavioral intention to use digital technologies in department stores.
Finally, the ANN Technique in SPSS was conducted, in order to assess the most important variable for the behavioral intention to use digital technologies at the point of sale and for the subsequent sensitivity analysis. With this technique, it is possible to capture linear and nonlinear relationships and it also works for a non-normal data distribution [72]. These artificial neural networks are trained using the Multi-Layer Perceptron (MLP) approach training technique. Values for the root mean square error (RMSE) is used to evaluate the network model’s accuracy. Ninety percent of the data was used to train the ANN model, while ten percent was used to evaluate the trained model’s accuracy. Errors may be reduced, and prediction accuracy can be increased further through many learning sessions [73]. Therefore, 10 cross-validations were employed and the root mean square error (RMSE) was assessed in order to prevent the possibility of overfitting. Seven covariates (performance expectancy, effort expectancy, social influence, facilitating conditions, hedonic motivation, price value, and habit) were used with behavioral intention as the dependent variable. Table 2 shows the results of the RMSE of the testing and training for the different validations.
In addition, a sensitivity analysis (Table 3) was conducted in order to underline the average importance of each variable in predicting the behavioral intention to use digital technologies. By dividing the relative importance of each input by the maximum importance in the form of a percentage. The result indicates that habit is the most important predictor followed by performance expectancy with normalized importance of 36.5%, effort expectancy (23%), hedonic motivation (22%), price value (20%), facilitating conditions (13%), and social influence (12%).

5. Digitalization 4 Sustainability Framework

What is still missing is a framework in order to answer the second research question by outlining the impact of digital technologies in fashion stores on sustainability. The fast fashion strategy epitomizes a non-sustainable way to boost profit while accepting substantial negative side effects. Sustainability encompasses economic, social, and ecological strands calling for a holistic concept. Digitalization is not only a matter of economic efficiency but of smart resource disposition and asset utilization according to its highest value. Digitalization is anything but a closed framework rather than representing a fuzzy reflection of doing things in a highly automated, augmented, or artificially intelligent way. We develop the idea of a digitalization maturity model starting with (1) supporting store technologies (e.g., digital price tags, beacons, QR codes, mobile payment, geofencing and click and collect technologies), (2) assisting store technologies (e.g., digital changing room, magic mirror, digital shop window, in-store navigation), and (3) augmenting store technologies (e.g., augmented reality, virtual reality glasses) that complement human labor in a value-enhancing manner. Furthermore, (4) autonomous store technologies (e.g., self-checkouts, drone or robot retail delivery, customer service robotics, robotic inventory management) and (5) artificially intelligent store technologies (e.g., in-store cameras that measure consumer reactions to products, inventory management provided by AI, AI-driven demand forecasting) may endanger entrenched business models, routines and legacies of conducting processes because they are disruptive, destructive and devaluating. Hence this type of digitalization could create a conflict with the three sustainability pillars: Economic, Social, and Ecological. Workers, customers, and stakeholders complain about social dumping, environmental dumping, and tax dumping. We defend the standpoint of co-alignment of sustainability and digitalization. Figure 7 regards the digitalization maturity stages as an independent variable that may have a strong bearing on the three core dimensions of sustainability. It is safe to argue that the aforementioned digitalization steps pave the way for resource-efficient retail, as well as order and process management due to precision marketing. Opposite to traditional marketing, precision marketing personalized, individualized, and localized data about products, customers and services contribute to valid profiling and predictions. Digitalization and sustainability can go in line with each other if integrated into a holistic retail framework.
Our concept resonates with the creating shared value logic and states a congruence of shareholder value and stakeholder value. On the one hand, sustainability and digitalization may be in conflict with each other because of energy-consuming IT infrastructures (i.e., servers, platform operation, 24/7 availability) or some critics argue that digitalization destroys established workplaces by means of automation, rationalization, and AI-supported process management, but on the other hand, digitalization options for marketing, retailing, order fulfillment or store management take full advantage of time savings, decreasing transportation costs and reduced stockpiling (see Figure 7). Looking at the assumed digital and sustainable impacts of the different types of store technologies, it becomes clear that those digital store technologies could have a positive impact on the three sustainability pillars.

6. Discussion

Even though digitalization already plays an important role for businesses and scholars, there remains a lack of combining digital technologies with stationary retail in fashion stores. The aim of this work was to contribute to the research in order to get to know whether consumers accept digital technologies in fashion stores and to identify their impact on sustainability. A lot of research is already existing on the digitalization of the fashion industry, but none of them is applicable in the context of acceptance, nor about their impact on sustainability.
The first research question examined the acceptance of customers towards digital technologies at the PoS in fashion stores. The seven hypotheses (H1–H7) were constructed and adapted based on the UTAUT2 Model by Vankatesh et al. [62], which is an instrument that investigates the probability of the success of introducing new digital technologies and analyzes which factors lead to acceptance. Therefore, the different hypotheses are testing different factors that influence customers to use digital technologies at the PoS. H1 examined whether the performance expectancy, which stands for the perceived benefits of the customer by using digital technologies, influences their intentions to use those technologies in department stores. By conducting linear regressions, it shows, that the perceived benefits of using digital technologies have a positive impact on the intention to use them with β = 0.74, p ≤ 0.001. Additionally, the six other hypotheses (H2–H7), which are testing whether the effort expectancy, the social influence, the facilitating conditions (e.g., a smartphone), the hedonic motivators (e.g., joy/fun), the purchase price or the habit influence the customers’ intentions to use digital technologies in department stores, could be confirmed. However, habit has the highest impact among all variables. This result goes along with other similar studies, which were testing different technologies in the retail sector (e.g., mobile payment, AI wearables, in-store smartphone use) [74,75,76], as well as with the ANN and sensitivity analysis. Looking at the multiple regression, the determinant habit has the only and biggest impact with β = 0.68, p ≤ 0.001. This shows that consumers are more likely to accept technology, they have already used, which is proving the fact that the more often a digital technology is used, the more likely people are to accept them [77]. Moreover, it speaks for itself, that the human is a creature of habit, where existence is resting in a certain, constant having [62]. Another multiple regression model was conducted, with the aim to have an insight into other variables that may have an impact on behavioral intention without habits as a strong influencing factor. The strongest predictor was price value with β = 0.27, p ≤ 0.001 in this model. This shows that perceived benefits exceed the cost of use and therefore a behavioral intention is likely to be induced. Furthermore, it demonstrates that it is important for a consumer to save money by examining the prices of different products and searching for offers when using digital Technologies at the PoS in fashion stores. The path model explained 79% of the variance of the intention to use digital technologies in fashion stores and 76% of the variance of habit. Furthermore, it shows again that habit is the only predictor of the behavioral intention to use digital technologies in fashion stores, which goes along with the outcome from the first multiple regression analysis. Even though the factors in the linear regression affect intention individually, however, when considered in the overall framework in the form of a path model, habit is the most important factor because it influences our actions the most [78]. Looking at these results the question arouses of what influences habit, besides the factors performance expectancy, effort expectancy, price value, facilitating conditions, hedonic motivation, and social influence in order to get a higher impact on the behavioral intention to use digital technologies in fashion stores. Since the aspect of habit is described as the degree to which a person adopts an adaption of behavior resulting from a learning process [62], one can say that the more digital technologies will be used in fashion stores, the more likely it is that they will be accepted.
Since digitalization has a strong bearing on the future of the fashion industry, it may change the DNA of conventional business models and fashion store concepts. Charnley et al. [79] already indicated that digital solutions can be applied to overcome barriers and create opportunities for consumers’ needs and expectations in the context of circular business models. While past discussions circled around either operational excellence or disruptive innovation by means of digital technology employment, we should place special emphasis on the effects of digitalization with respect to sustainable issues calling for an overarching framework. The fashion business incorporates many aspects of non-sustainability when it comes to fast fashion, labor dumping or environmental pollution, and harmful apparel. For this reason, the fashion industry resembles features of critical industries that are inclined to be in conflict with the three sustainability pillars, non-compliant with moral expectations, and breach of stakeholder interests. Chan et al. [54] found out that it is in fact beneficial for companies and even for manufacturers to increase their CSR commitment further by using disruptive technologies, which helps to increase sustainability transparency along the supply chain [57]. Therefore, Digitalization may not only contribute to economic KPI fulfillment, but also to sustainable resource management with respect to human assets as well as physical assets and energy savings. It may foster a more-for-less strategy since processes and products emerge as smart problem solutions embodying platform economics as well as sharing economy features when renting, lending, and access outperform ownership status. Digitalization plays out its usefulness in many ways beyond economic efficiency and effectiveness. For sure, giga-servers and big data storage are on the one hand energy consuming, but on the other hand, digitalization not only contributes to lower physical traffic but also incorporates a set of virtualization technologies augmenting or replacing fashion shows, physical apparel, or over-sized store capacities. It is safe to say, that the digital natives show a high acceptance level of new technology formats opposite typical baby boomers, who were raised in the analogous world of brick-and-mortar business models. For this reason, the proclaimed era of the metaverse may usher a paradigm shift towards assisted and augmented retailing and consumer realities.

7. Conclusions

This work shows that digitization is bringing changes in the business models of the fashion retail trade. Thus, further development and adaptation for the preservation of competition in the context of digitalization and sustainability are necessary for fashion stores. While fashion online retail continues to gain market share, the turnover figures of stationary retail are declining sharply. Consequently, brick-and-mortar fashion stores are under pressure to act more effectively and sustainably against the competition. In order to gain a constant competitive advantage, it is particularly important for fashion stores to concentrate on their individual strengths and customer needs as well as to indicate a more sustainable way by using digital technologies. Since customer needs have changed increasingly in the course of digitalization and sustainability, fashion retailers must set themselves the goal of meeting these needs in the best possible way. This is the only way to achieve added value for the customers and to set oneself apart from the competition while designing a more sustainable future. This argues in favor of hybrid and retail systems incorporating the old normal of physical presence and the new normal of digitalized processes, emulations, and virtual substance when it comes to the proclaimed advent of the metaverse. Irrespective of the business model at hand, the sustainability debate has a strong bearing on the fashion industry belonging to the so-called critical industries. The latter are held responsible for big sustainable footprints. Fashion stores should make it a point of their honor to harness the power of digitalization for sake of sustainability and sustainability compliance. Digitalization, conscious consumption, and sustainability issues are no points in dispute but can be harmonized in a self-enhancing fashion. The future of retailing is digital, sustainable, and hybrid, because the classic store concepts take full advantage of digitalization for the sake of resource efficiency, smartness, and minimized sustainable footprints. Theoretically, this paper co-aligns the viewpoints of the resource-based view and the market-based view calling for the accumulation of sustainability competences in the retail industry. The latter can be nurtured and fostered by digitalization technologies bridging the gap between online and offline stores.
This paper bridges the gap between sustainability and digitalization because it holds evidence that sustainability compliance can be achieved by means of digitalization to a high degree. Moreover, economic value creation as reflected by financial key performance indicators may be fostered and nurtured by sustainable digitalization. Theoretically, this paper goes hand in hand with the CSV approach and extends its logic to the alignment of digitalization, sustainability, and economic value creation.

8. Implications and Limitations

The paper addresses fashion retail stores from the viewpoint of digitalization and sustainability compliance. It is safe to say that conscious consumer behavior calls for sustainable store management. Ethical, moral, and resource-efficient behavior is not in conflict with shareholder value anymore but can boost the latter. For sure, the empirical evidence of this study is limited because results cannot be transferred to other industries. Furthermore, some countries, such as China, excel in digitalization, but not in sustainability. Others, such as Germany, pay much attention to sustainability but “suffer” from a huge digitalization gap. Despite the disadvantages of the convenience sampling method, such as the lack of generalizability, it allowed to obtain basic data and trends regarding the study resource- and time-efficiently. A 2 by 2 matrix originates, in which the best case displays a high digitalization and sustainability level. Theoretically, this should add value to the dominating market-based view and resource-based view by means of complementing them with a digital- and sustainability-based view of the firm. Further, research should be completed on the advent of advanced digitalization options such as AI devices and the metaverse. Beyond this, the overarching effect of digitalization deserves special attention since AI, machine learning and big data applications are very energy intensive on the one hand while they reduce traveling costs to a high degree. Competing for the future in fashion marketing often incorporates retailing systems and store innovations. Omni-channel marketing goes far beyond multi-channel retailing because all elements go for an integrated business model capitalizing on digital platforms. Sustainable omni-channel management places special emphasis on the fulfillment of moral, ethical, and ecological standards by means of digital resource management. The digital-based view of the firm and the sustainability-based view of the firm is still in their infancy and should be conceptually integrated into a strategic framework. While in the past digitalization was often seen as a leaner, meaner, and faster concept, it can also contribute substantially to sustainability progress due to better resource management decisions. Furthermore, digital tools and technologies as employed by different market agents and stakeholders deserve a deeper and more accurate understanding with respect to rapid technological progress. For this reason, it should be promising to differentiate between excellence levels of digitalization, because employed tools range from cryptic and less advanced to sophisticated and highly advanced.

Supplementary Materials

The following supporting information can be downloaded at: https://www.mdpi.com/article/10.3390/su15054621/s1, Supplementary Material S1: Questionnaire on which the publication is based.

Funding

Funded by the Deutsche Forschungsgemeinschaft (DFG, German Research Foundation)–Projektnummer 491466077.

Institutional Review Board Statement

Not applicable.

Informed Consent Statement

Informed consent was obtained from all subjects involved in the study.

Data Availability Statement

The data presented in this study are available on request from the corresponding author.

Conflicts of Interest

The author declares no conflict of interest.

Appendix A

Table A1. Results of the multiple regression analysis for predicting behavioral intention.
VariablesbSEβTp
Perf. Expect.0.1090.0740.0931.471n.s.
Effort Expect.0.1420.0930.1191.518n.s.
Social Infl.0.0790.0450.0751.754n.s.
Facil. Cond.−0.0300.078−0.025−0.384n.s.
Hed. Motiv.0.2600.0760.0230.340n.s.
Price Value−0.0090.079−0.008−0.118n.s.
Habits0.7460.0720.68310.396***
R2 (adj.) 0.796
Notes: Adj. = Adjusted R2, *** p ≤ 0.001; n.s. = not significant (p > 0.05). B = Regression coefficient, SE B standard error.
Table A2. Results of the multiple regression analysis without the variable “habits“ for predicting behavioral intention.
VariablesbSEβTp
Perf. Expect.0.1820.0920.1561.988*
Effort Expect.0.3120.1140.2632.733**
Social Infl.0.1990.0540.1893.658***
Facil. Cond.−0.1320.097−0.111−1.362n.s.
Hed. Motiv.0.1910.0920.1702.073*
Price Value0.3100.0910.2713.416***
R2 (adj.) 0.683
Notes: Adj. = Adjusted R2, *** p ≤ 0.001; ** p ≤ 0.01; * p ≤ 0.05; n.s. = not significant (p > 0.05). B = Regression coefficient, SE B standard error.

References

  1. Chwallek, A.; Wilhelm, S. Kein Konzept ist ausgeschlossen. Der Handel 2016, 10, 10–16. [Google Scholar]
  2. Bovensiepen, G.; Rumpff, S.; Bender, S. Store 4.0—Zukunft des stationären Handels; PricewaterhouseCoopers: London, UK, 2016; Available online: https://www.pwc.ch/de/publications/2017/store-4.0-zukunft-des-stationaeren-handels-pwc-1.pdf (accessed on 22 November 2022).
  3. Böcker, J. Die Customer Journey—Chance für mehr Kundennähe. In Dialogmarketing Perspektiven 2014/2015: Tagungsband 9. Wissenschaftlicher Interdisziplinärer Kongress für Dialogmarketing; Deutscher Dialogmarketing Verband, e.V., Ed.; Springer: Wiesbaden, Germany, 2015; pp. 165–177. ISBN 9783658088767. [Google Scholar]
  4. Porter, M.E.; Kramer, M.R. The Competitive Advantage of Corporate Philanthropy. Harv. Bus. Rev. 2002, 80, 56–68. [Google Scholar]
  5. Porter, M.E.; Kramer, M.R. Creating Shared Value. Harv. Bus. Rev. 2011, 89, 62–77. [Google Scholar]
  6. Deloitte. Disruptions in Retail through Digital Transformation—Reimagining the Store of the Future; Deloitte Global: New York, NY, USA, 2017; Available online: https://www2.deloitte.com/content/dam/Deloitte/in/Documents/CIP/in-cip-disruptions-in-retail-noexp.pdf (accessed on 22 November 2022).
  7. Amed, I.; Balchandani, A.; Beltrami, M.; Berg, A.; Hedrich, S.; Rölkens, F. The State of Fashion 2019; McKinsey&Company: Hongkong, China, 2019; Available online: https://www.mckinsey.com/~/media/mckinsey/industries/retail/our%20insights/the%20state%20of%20fashion%202019%20a%20year%20of%20awakening/the-state-of-fashion-2019-final.ashx (accessed on 22 November 2022).
  8. Deloitte. Digital Disruptions in Retail; Deloitte Global: New York, NY, USA, 2020; Available online: https://www2.deloitte.com/content/dam/Deloitte/in/Documents/consumer-business/in-consumer-Digital%20Disruption%20in%20Retail_Retail%20Leadership%20Summit%202020%20Report.pdf (accessed on 4 February 2023).
  9. Amed, I.; Berg, A.; Balchandani, A.; Hedrich, S.; Rölkens, F.; Young, R.; Jensen, J.E.; Peng, E. The State of Fashion 2021; McKinsey&Company: Hongkong, China, 2021; Available online: https://www.mckinsey.com/~/media/mckinsey/industries/retail/our%20insights/state%20of%20fashion/2021/the-state-of-fashion-2021-vf.pdf (accessed on 4 February 2023).
  10. Iannilli, V.M.; Spagnoli, A. Phygital Retailing in Fashion. Experiences, Opportunities and Innovation Trajectories. ZoneModa J. 2021, 11, 43–69. [Google Scholar] [CrossRef]
  11. Alexander, B.; Kent, A. Tracking technology diffusion in-store: A fashion retail perspective. Int. J. Retail. Distrib. Manag. 2021, 49, 1369–1390. [Google Scholar] [CrossRef]
  12. Fritz, K. Wer ist hier Sklave, wer Herr? Frankfurter Allgemeine Zeitung: Hessen, Germany, 2015; p. 11. [Google Scholar]
  13. Becker, W.; Botzkowski, T.; Eurich, S.; Ulrich, P. Data Analytics in Familienunternehmen—Implikationen für das Controlling. Z. Erfolgsorientierte Unternehm. 2015, 27, 263–268. [Google Scholar] [CrossRef]
  14. Wynn, M.; Jones, P. Digital Technology Deployment and the Circular Economy. Sustainability 2022, 14, 9077. [Google Scholar] [CrossRef]
  15. Krickel, F. Digitalisierung in der Energiewirtschaft. In Zukunftsorientierte Unternehmenssteuerung in der Energiewirtschaft; Hecker, W., Krickel, F., Lau, C., Müller, A., Eds.; Springer: Wiesbaden, Germany, 2015; pp. 42–43. ISBN 9783658078157. [Google Scholar]
  16. Schütte, R.; Vetter, T. Analyse des Digitalisierungspotentials von Handelsunternehmen. In Handel 4.0: Die Digitalisierung des Handels; Gläß, R., Leukert, B., Eds.; Springer: Berlin, Germany, 2017; p. 85. ISBN 9783662533314. [Google Scholar]
  17. Pazaitis, A. Breaking the Chains of Open Innovation: Post-Blockchain and the Case of Sensorica. Information 2020, 11, 104. [Google Scholar] [CrossRef] [Green Version]
  18. Grewal, D.; Gauri, D.K.; Das, G.; Agarwal, J.; Spence, M.T. Retailing and emergent technologies. J. Bus. Res. 2021, 134, 198–202. [Google Scholar] [CrossRef]
  19. Große-Holtforth, D. Schlüsselfaktoren im E-Commerce: Innovationen, Skaleneffekte, Daten und Kundenzentrierung; Springer: Wiesbaden, Germany, 2017; pp. 13–15. ISBN 9783658164331. [Google Scholar]
  20. Banken, R. Schneller Strukturwandel trotz institutioneller Stabilität. Die Entwicklung des deutschen Einzelhandels 1949–2000. Jahrb. Wirtsch. Econ. Hist. Yearb. 2007, 48, 117–146. [Google Scholar] [CrossRef]
  21. Frey, C.B.; Osborne, M.A. The Future of Employment: How Susceptible are Jobs to Computerization? Technol. Forecast. Soc. Chang. 2013, 114, 254–280. [Google Scholar] [CrossRef]
  22. Loebbecke, C. Digitalisierung: Technologien und Unternehmensstrategien. In Handbuch Medienmanagement; Scholz, C., Ed.; Springer: Heidelberg, Germany, 2006; pp. 357–373. ISBN 9783540235408. [Google Scholar]
  23. Yoo, Y.; Henfridsson, O.; Lyytinen, K. Research commentary—The new organizing logic of digital innovation: An agenda for information systems research. Inf. Syst. Res. 2010, 21, 724–735. [Google Scholar] [CrossRef]
  24. Fitzgerald, M.; Kruschwitz, N.; Bonnet, D.; Welch, M. Embracing digital technology: A new strategic imperative. MIT Sloan Manag. Rev. 2014, 55, 1. [Google Scholar]
  25. Rasche, C.; Margaria, T.; Floyd, B.D. Service Model Innovation in Hospitals: Beyond Expert Organizations. In Service Business Model Innovation in Healthcare and Hospital Management—Models, Strategies Tools; Pfannstiel, M., Rasche, C., Eds.; Springer: Wiesbaden, Germany, 2017; pp. 1–19. ISBN 9783319835150. [Google Scholar]
  26. Liébana-Cabanillas, F.; García-Maroto, I.; Muñoz-Leiva, F.; Ramos-de-Luna, I. Mobile Payment Adoption in the Age of Digital Transformation: The Case of Apple Pay. Sustainability 2020, 12, 5443. [Google Scholar] [CrossRef]
  27. Vashishtha, V.; Kashyap, R. Reconfigure the apparel retail stores with interactive technologies. Res. J. Text. Appar. 2022, 27, 54–73. [Google Scholar] [CrossRef]
  28. Kupper, A.; Bareth, U.; Freese, B. Geofencing and background tracking—The next features in LBSs. 41. In Proceedings of the Jahrestagung der Gesellschaft für Informatik, Berlin, Germany, 4–7 October 2010. [Google Scholar]
  29. Zhu, G.; Gao, X. Precision Retail Marketing Strategy Based on Digital Marketing Model. Sci. J. Bus. Manag. 2019, 1, 33–37. [Google Scholar] [CrossRef]
  30. Reinartz, W.; Wiegand, N.; Imschloss, M. The impact of digital transformation on the retailing value chain. Int. J. Res. Mark. 2019, 36, 350–366. [Google Scholar] [CrossRef]
  31. Rienda, L.; Ruiz-Fernández, L.; Carey, L. Analysing trademark and social media in fashion industry: Tools that impact performance and internationalization for SMEs. J. Fash. Mark. Manag. 2021, 25, 117–132. [Google Scholar] [CrossRef]
  32. Garaus, M.; Wagner, U.; Rainer, R.C. Emotional targeting using digital signage systems and facial recognition at the point-of-sale. J. Bus. Res. 2021, 131, 747–762. [Google Scholar] [CrossRef]
  33. Visser, J.; Nemoto, T.; Browne, M. Home Delivery and the Impacts on Urban Freight Transport: A Review. Procedia Soc. Behav. Sci. 2014, 125, 15–27. [Google Scholar] [CrossRef] [Green Version]
  34. Heinemann, G. Der neue Online-Handel—Geschäftsmodell und Kanalexzellenz im Digital Commerce; Springer: Wiesbaden, Germany, 2017; pp. 19–30. ISBN 9783658153830. [Google Scholar]
  35. Schäfer, S. Argumented und Virtual Reality im Handel: Einsatz. Available online: https://zukunftdeseinkaufens.de/augmented-und-virtual-reality-im-handel-einsatz-13/ (accessed on 22 November 2022).
  36. OECD. OECD Digital Economy Outlook 2020; OECD Publishing: Paris, France, 2020. [Google Scholar] [CrossRef]
  37. Hütz, S. Mode Anprobieren Wird Zum Erlebnis. Available online: https://www.stores-shops.de/technology/mode-anprobieren-wird-zum-erlebnis/ (accessed on 22 November 2022).
  38. Reinhold, K. Die digitale Aufholjagd. Textilwirtschaft 2016, 1B, 14–17. [Google Scholar]
  39. Yu, H.; Lee, H.; Jeon, H. What is 5G? Emerging 5G Mobile Services and Network Requirements. Sustainability 2017, 9, 1848. [Google Scholar] [CrossRef] [Green Version]
  40. Celko, M.; Janszky, S. Die Zukunft des Stationären Handels; Trendstudie des 2b AHEAD ThinkTanks: Washington, DC, USA, 2014; Available online: https://www.markant-magazin.com/sites/default/files/downloads/Studie%20-%20Die%20Zukunft%20des%20station%C3%A4ren%20Handels.pdf (accessed on 12 December 2022).
  41. Kornatowski, P.M.; Bhaskaran, A.; Heitz, G.M.; Mintchev, S.; Floreano, D. Last-Centimeter Personal Drone Delivery: Field Deployment and User Interaction. IEEE Robot. Autom. Lett. 2018, 3, 3813–3820. [Google Scholar] [CrossRef]
  42. Cleveland, J.; Thakur, D.; Dames, P.; Phillips, C.; Kientz, T.; Daniilidis, K.; Bergstrom, J.; Kumar, V. Automated System for Semantic Object Labeling with Soft-Object Recognition and Dynamic Programming Segmentation. IEEE Trans. Autom. Sci. Eng. 2017, 14, 820–833. [Google Scholar] [CrossRef]
  43. Shankar, V.; Kalvanam, K.; Setia, P.; Golmohammadi, A.; Tirunillai, S.; Douglass, T.; Hennessey, J.; Bull, J.S.; Waddoups, R. How Technology is Changing Retail. J. Retail. 2021, 97, 13–27. [Google Scholar] [CrossRef]
  44. Cipresso, P.; Giglioli, I.A.C.; Raya, M.A.; Riva, G. The past, present, and future of virtual and augmented reality research: A network and cluster analysis of the literature. Front. Psychol. 2018, 9, 2086. [Google Scholar] [CrossRef] [Green Version]
  45. McCarthy, J.; Minsky, M.L.; Rochester, N.; Shannon, C.E. A proposal for the dartmouth summer research project on artificial intelligence, August 31, 1955. AI Mag. 2006, 27, 12. [Google Scholar]
  46. Bengio, Y.; Courville, A.; Vincent, P. Representation learning: A review and new perspectives. IEEE Trans. Pattern Anal. Mach. Intell. 2013, 35, 1798–1828. [Google Scholar] [CrossRef] [Green Version]
  47. Bansal, P.; Song, H.-C. Similar but not the same: Differentiating corporate sustainability from corporate responsibility. Acad. Manag. Ann. 2017, 11, 105–149. [Google Scholar] [CrossRef]
  48. Ponte, S. Green capital accumulation: Business and sustainability management in a world of Global Value Chains. New Political Econ. 2020, 25, 72–84. [Google Scholar] [CrossRef]
  49. Balderjahn, I. Nachhaltiges Management und Kosumentenverhalten; UVK Verlag: Munich, Germany, 2021; pp. 11–16. ISBN 9783825254919. [Google Scholar]
  50. Griggs, D.; Stafford-Smith, M.; Gaffney, O.; Rockström, J.; Ohman, M.C.; Shyamsundar, P.; Noble, I. Policy: Sustainable development goals for people and planet. Nature 2013, 495, 305–307. [Google Scholar] [CrossRef] [PubMed]
  51. Vereinte Nationen. Ziele für Nachhaltige Entwicklung. Available online: https://unric.org/de/17ziele/ (accessed on 22 December 2022).
  52. Lee, B.X.; Kjaerulf, F.; Turner, S.; Cohen, L.; Donnelly, P.D.; Muggah, R.; Waller, I. Transforming our world: Implementing the 2030 agenda through sustainable development goal indicators. J. Public Health Policy 2016, 37, 13–31. [Google Scholar] [CrossRef] [PubMed]
  53. Thorisdottir, T.S.; Johannsdottir, L. Sustainability within fashion business models: A systematic literature review. Sustainability 2019, 11, 2233. [Google Scholar] [CrossRef] [Green Version]
  54. Chan, H.; Wei, X.; Guo, S.; Leung, W. Corporate social responsibility (CSR) in fashion supply chains: A multi-methodological study. Transp. Res. Part E Logist. Transp. Rev. 2020, 142, 102063. [Google Scholar] [CrossRef]
  55. Cambridge Dictionary. Acceptance. In Cambridge Dictionary; Cambridge University Press: Cambridge, UK, 2022; Available online: https://dictionary.cambridge.org/dictionary/english/acceptance (accessed on 22 December 2022).
  56. Oxford Dictionary. Acceptance. In OED Online; Oxford University Press: Oxford, UK, 2022; Available online: https://www.oed.com/view/Entry/1011 (accessed on 22 December 2022).
  57. Davis, F.D. A Technology Acceptance Model for Empirically Testing New End User Information Systems: Theory and Results. Doctoral Dissertation, Sloan School of Management, Cambridge, MA, USA, 1985. [Google Scholar]
  58. Kroeber-Riel, W.; Gröppel-Klein, A. Konsumentenverhalten; Vahlen: Munich, Germany, 2013; pp. 257–404. ISBN 9783800660339. [Google Scholar]
  59. Venkatesh, V.; Davis, F. A Theoretical Extension of the Technology Acceptance Model: Four Longitudinal Field Studies. Manag. Sci. 2000, 46, 186–204. [Google Scholar] [CrossRef] [Green Version]
  60. Kheiravar, S.; Richter, N. Neue Technologien im stationären Einzelhandel: Mobile Apps oder stationäre Geräte? In Digitalisierung im Vertrieb; Binckebanck, L., Elste, R., Eds.; Springer: Wiesbaden, Germany, 2016; pp. 609–631. ISBN 9783658050535. [Google Scholar]
  61. Venkatesh, V.; Morris, M.G.; Davis, G.B.; Davis, F.D. User acceptance of information technology: Toward a unified view. MIS Quarterly 2003, 27, 425–478. [Google Scholar] [CrossRef] [Green Version]
  62. Venkatesh, V.; Thong, J.; Xu, X. Consumer Acceptance and Use of Information Technology: Extending the Unified Theory of Acceptance and Use of Technology. MIS Q. 2012, 36, 157–178. [Google Scholar] [CrossRef] [Green Version]
  63. Williams, C. Research methods. J. Bus. Econ. Res. 2011, 5, 65–72. [Google Scholar] [CrossRef]
  64. Meffert, H. Marketing: Einführung in die Absatzpolitik; Springer: Wiesbaden, Germany, 1977; pp. 176–183. ISBN 9783409369718. [Google Scholar]
  65. Rasch, D.; Verdooren, L.; Gowers, J. Planung und Auswertung von Versuchen und Erhebungen; Oldenbourg: Munich, Germany, 2007; pp. 72–80. ISBN 9783486583007. [Google Scholar]
  66. Mishra, S.B.; Alok, S. Handbook of Research Methodology; Educreations: Palo Alto, CA, USA, 2017; pp. 8–10. ISBN 9781545703403. [Google Scholar]
  67. Bortz, J.; Döring, N. Forschungsmethoden und Evaluation in den Sozial- und Humanwissenschaften; Springer: Berlin, Germany, 2016; pp. 398–490. ISBN 9783642410888. [Google Scholar]
  68. Rosseel, Y. lavaan: An R Package for Structural Equation Modeling. J. Stat. Softw. 2012, 48, 1–36. [Google Scholar] [CrossRef] [Green Version]
  69. Field, A. Discovering Statistics Using IBM SPSS Statistics, 5th ed.; SAGE Publications: Thousand Oaks, CA, USA, 2018; pp. 1–976. [Google Scholar]
  70. Brown, T.A. Confirmatory Factor Analysis for Applied Research; Guilford Press: New York, NY, USA, 2015; pp. 1–462. ISBN 9781462517794. [Google Scholar]
  71. Bentler, P.M. Comparative fit indexes in structural models. Psychol. Bull. 1990, 107, 238–246. [Google Scholar] [CrossRef]
  72. Berger, C. Vom Gewohnheitstier zur reflektierten Nutzung—Ein Diskussionsanstoß über Betriebssysteme und Programmnutzung nachzudenken. Medienimpulse 2010, 48, 1–6. [Google Scholar]
  73. Funke, G.; Schmandt, J. Gewohnheit. Arch. Begr. 1961, 3, 7–606. [Google Scholar]
  74. Teo, A.C.; Tan, G.W.H.; Ooi, K.B.; Hew, T.S.; Yew, K.T. The effects of convenience and speed in m-payment. Ind. Manag. Data Syst. 2015, 115, 311–331. [Google Scholar] [CrossRef]
  75. EL Idrissi, T.; Idri, A.; Bakkoury, Z. Systematic map and review of predictive techniques in diabetes self-management. Int. J. Inf. Manag. 2019, 46, 263–277. [Google Scholar] [CrossRef]
  76. Chu, W.S.W. Factors Influencing Mobile Payment Adoption in Hong Kong: A Quantitative Study. Asian J. Bus. Manag. 2022, 10, 41–61. [Google Scholar] [CrossRef]
  77. Sulkowski, L.; Kaczorowska-Spychalska, D. Determinants of the adoption of AI wearables—Practical implications for marketing. Hum. Technol. 2021, 17, 294–320. [Google Scholar] [CrossRef]
  78. Mosquera, A.; Juaneda-Ayensa, E.; Olarte-Pascual, C.; Pelegrín-Borondo, J. Key Factors for In-Store Smartphone Use in an Om-nichannel Experience: Millennials vs. Nonmillennials. Complexity 2018, 2018, 1057356. [Google Scholar] [CrossRef] [Green Version]
  79. Charnley, F.; Knecht, F.; Muenkel, H.; Pletosu, D.; Rickard, V.; Sambonet, C.; Schneider, M.; Zhang, C. Can Digital Technologies Increase Consumer Acceptance of Circular Business Models? The Case of Second Hand Fashion. Sustainability 2022, 14, 4589. [Google Scholar] [CrossRef]
Figure 1. Development of technology acceptance models.
Sustainability 15 04621 g001
Figure 2. Technology acceptance model (TAM).
Sustainability 15 04621 g002
Figure 3. Unified theory of acceptance and use of technology 2 (UTAUT 2).
Sustainability 15 04621 g003
Figure 4. Theoretical Framework for addressing research question 1 (RQ1).
Sustainability 15 04621 g004
Figure 5. Results of the linear regression analysis based on Figure 4. *** p ≤ 0.001; n.s. = not significant (p > 0.05). The directional arrows show the predictive power.
Sustainability 15 04621 g005
Figure 6. Results of the path analysis in order to predict the behavioral intention to use digital technologies. The directional arrows show the predictive power. *** p ≤ 0.001; ** p ≤ 0.01; n.s. = not significant (p > 0.05).
Sustainability 15 04621 g006
Figure 7. Digitalization 4 Sustainability Framework (own presentation).
Sustainability 15 04621 g007
Table 1. Descriptive statistics and intercorrelations for all variables.
Variable12345678
1. BI10.738 ***0.678 ***0.583 ***0.592 ***0.701 ***0.722 ***0.855 ***
2. Perf. Expect. 10.669 ***0.521 ***0.550 ***0.733 **0.739 ***0.737 ***
3. Effort Expect. 10.496 ***0.827 ***0.686 ***0.722 ***0.663 ***
4. Social Influence 10.408 ***0.554 ***0.597 ***0.627 ***
5. Facil. Conditions 10.649 ***0.678 ***0.571 ***
6. Hedonic Motiv. 10.763 ***0.728 ***
7. Price Value 10.790 ***
8. Habit 1
Number of items34433334
Mean4.034.744.693.804.704.464.484.10
SD1.281.101.081.221.081.141.121.17
Cronbach’s α 0.940.940.940.950.890.960.890.88
Notes: BI = Behavioral intention; Expect. = Expectancy; Facil. Conditions = Facilitating Conditions; Hedonic Motiv. = Hedonic Motiviation; *** p < 0.001; ** p ≤ 0.01.
Table 2. RMSE values through Neural Networks.
NetworkTrainingTesting
NSSERMSENSSERMSETotal Samples
ANN 118620.7480.334161.2210.276202
ANN 218015.5150.294223.7460.413202
ANN 317818.3060.321241.0150.206202
ANN 418120.8710.340212.0480.312202
ANN 518220.8340.338200.790.199202
ANN 618015.4390.293222.0530.305202
ANN 718422.7220.351180.8820.221202
ANN 817713.5240.276253.1420.355202
ANN 918117.8580.314212.0930.316202
ANN1017916.3240.302232.2110.310202
Mean18.2140.316 1.9200.291
SD3.00660.0246 0.97990.0678
Notes: SSE = Sum square of errors, RMSE = Root mean square of errors, N = sample size.
Table 3. Sensitivity Analysis.
NNPEEESIFCHMPVH
NN 10.4350.2040.0090.0910.1880.2771.0
NN 20.2970.0980.0690.0740.2930.1551.0
NN 30.4430.0690.1230.1180.2190.1171.0
NN 40.150.3150.2640.0880.3380.1181.0
NN 50.5120.1530.1080.110.1220.0781.0
NN 60.4250.2740.0590.1930.1470.1361.0
NN 70.2630.2020.2180.1330.1480.4281.0
NN 80.5670.3750.190.1890.2620.3121.0
NN 90.2270.3820.0670.1170.3110.2041.0
NN100.330.2240.0830.2070.1860.1861.0
Averg. Importance0.360.230.210.130.220.21
Normalized Importance (%)36.4922.9611.913.222.1420.11100.0
Notes: PE = Performance Expectancy; EE = Effort Expectancy; SI = Social Influence; FC = Facilitating Conditions; HM = Hedonic Motivation; PV = Price Value; H = Habit.
Disclaimer/Publisher’s Note: The statements, opinions and data contained in all publications are solely those of the individual author(s) and contributor(s) and not of MDPI and/or the editor(s). MDPI and/or the editor(s) disclaim responsibility for any injury to people or property resulting from any ideas, methods, instructions or products referred to in the content.