Article

A Route Choice Model for the Investigation of Drivers’ Willingness to Choose a Flyover Motorway in Greece

by
Ioannis Politis
1,
Georgios Georgiadis
1,
Aristomenis Kopsacheilis
1,
Anastasia Nikolaidou
1,
Chrysanthi Sfyri
1 and
Socrates Basbas
2,*
1
Transport Engineering Laboratory, Department of Civil Engineering, Aristotle University of Thessaloniki, 54124 Thessaloniki, Greece
2
Department of Transportation & Hydraulic Engineering, School of Rural and Surveying Engineering, Aristotle University of Thessaloniki, 54124 Thessaloniki, Greece
*
Author to whom correspondence should be addressed.
Sustainability 2023, 15(5), 4614; https://doi.org/10.3390/su15054614
Submission received: 31 December 2022 / Revised: 23 February 2023 / Accepted: 3 March 2023 / Published: 4 March 2023

Abstract

:
The constant evolution of many urban areas ultimately reaches a point where the current infrastructure cannot further serve the needs of citizens. In the case of transport networks, congested roads, increased delay, and low level of service are among the indicators of a need for road infrastructure upgrade. Thessaloniki is the second-largest city in Greece with a population of over 1 million inhabitants in its metropolitan area. Currently, a significant share of the city’s traffic demand is served via its ring road, whose capacity is set to be enhanced through the construction of a flyover highway with the simultaneous upgrade of the existing ring road. The current study aims at investigating the key factors determining the final route choice of drivers between the two road axes. To that end, data from a combined revealed and stated preference survey targeting car drivers were collected, which were later exploited as the basis for the development of binary route choice regression and machine learning models. The results reveal that drivers’ choice is affected by criteria such as total travel time, the probability of accident occurrence, and closure time due to accident. The results of this paper could prove beneficial to transport researchers in forecasting drivers’ behavior in terms of route choice and to practitioners during the planning phase of similar infrastructure projects.

1. Introduction

Modern lifestyle in urban centers combined with traffic congestion make existing road networks saturated. In recognizing the modern challenges that cities face due to the inability of the existing form and structure of the transport system to meet the needs of sustainable development, it is considered necessary to redefine the practices of urban and transport planning as well as changes in the way major road projects are planned and implemented. Although the concept of sustainability is mainly linked to the promotion of cleaner modes of transport, such as walking, biking, and the use of public transport, proper planning of major urban transport infrastructure projects can also contribute to the concept of sustainability [1].
One of the most important socioeconomic benefits expected from the implementation of an urban transport infrastructure project, such as a new motorway, is the time savings for passengers of various means of transport. These savings are not limited to the users of the particular motorway but extend to a greater or lesser extent to the rest of the road network in the study area where there will be positive effects from the expected traffic redistribution [2]. The construction of a motorway will create better traffic conditions which effectively translate into higher speeds on the urban road network, where speeds are low, and consequently into lower operating costs for both light and heavy vehicles. In addition, increasing speeds also reduces the pollutants emitted by vehicles, while improving the flow of traffic will reduce the number of times vehicles’ engines are running, hence reducing the environmental burden simultaneously, as well as reducing congestion and improving users’ experience [3]. Last but not least, a new motorway can improve the road safety of users and reduce the severity of traffic accidents [4].
In transport planning, six route choice models seek to explain and predict individuals’ preferences over a discrete set of alternative travelling routes. Their results are valuable for a wide spectrum of transport planning decisions. The accurate prediction of route choice behavior might assist in evaluating traffic congestion, environmental impact, and feasibility of investment projects regarding transport infrastructures and services. Travel time [5,6,7], travel cost [8,9,10], travel distance [11,12], safety [9,10,13], and socioeconomic or trip-related characteristics of travelers [7,8,13,14,15] have been underlined as critical explanatory factors for selecting among alternative road routes. The discrete choice logit models, based on the random utility maximization theorem, have been the predominant research tools for explaining route choice behavior [16]. However, despite their general merits (easy interpretability, straightforward specifications), there are researchers who discussed the fact that they are not always able to adequately account for the complicated nature of route choice behaviors, due to their restricted model complexity, the bias inserted from small sample sizes, and the risk of subjective decisions of modelers regarding the selection and combination of the independent variables [10,17]. In the discrete choice framework, binary logistic regression is the simplest but not the only available method [18]. Studies from different domains have compared the performance of logistic regression models and artificial neural networks, demonstrating either similar results or improved prediction capabilities of artificial neural networks [19,20,21,22,23,24]. In the choice modelling field, the comparative benefits of further utilizing machine learning methods have been recently discussed in terms of model building, model estimation, data handling, etc. [25].
The research objective of this paper is twofold. Firstly, this paper aims to provide recent findings regarding the key decision factors which affect drivers’ choices between two alternative routes with specific characteristics. Secondly, we compare the predictability and accuracy of the traditional discrete choice models and the more advanced machine learning methods in terms of explaining the route choice behavior. Therefore, we contribute to the ongoing discussion regarding the applicability and the potential of the two methods in this field.
In this respect, this paper presents the results of a revealed preference and stated preference questionnaire survey, which was undertaken to highlight the willingness of commuters to use a new elevated highway that is going to be constructed in the city of Thessaloniki, Greece. Binary logistic regression and artificial neural network models were formulated and compared, in order to explore the importance of trip-related attributes and user-specific characteristics in route choice. To this end, binary logistic regression models are compared against artificial neural network models.
The remainder of this paper is organized as follows. The Section 2 presents a literature review on the route choice criteria of commuters. The case study, the questionnaire survey, as well as an overview of the data collected, are described in the Section 3. The Section 4 presents the methodology on which the development of route choice models was based. The Section 5 reports the results of the binary logistic regression and artificial neural network models which were developed. The Section 6 summarizes the main findings and limitations of the study as well as recommendations for future research.
The entire methodological approach is briefly presented in the following Figure 1, while all the stages of the methodology are analyzed in detail in the following sections.

2. Literature Review

The investigation of route choice behavior has a long research history. It is traditionally based on the random utility maximization theorem, which assumes that when a traveler is to select among a set of travel routes, he/she will decide taking the one that exhibits the highest utility for him/her [26,27]. Considering this theory, researchers have mainly developed binary or multinomial logit discrete choice models [5,7,13,15,28,29] and variations of them, such as nested or mixed logit ones [6,15,30,31,32], to uncover the factors that determine route choice decisions, along with their relative magnitude. A wide array of road user categories has been examined, ranging from private car drivers [5,8,11,12,14,15,33,34,35] and truck drivers [9,28,36,37] to motorcycle riders [13] and bicycle users [38,39]. The necessary data are primarily derived from customized revealed or/and stated preference surveys [5,9,13,35,36,37,39,40], while other studies have also utilized activity-based vehicle data which rely on Global Positioning System (GPS) technologies [15,28,34,35,38,41]. The attributes of route alternatives (i.e., congestion, road properties, speed), trip, and socioeconomic individual characteristics along with other external factors, such as weather conditions and time, have long been recognized as key determinants of route choice behavior [42]. An alternative approach for predicting choice behavior, in general, is emerging thanks to machine learning methods, which are more capable in handling unstructured data and may demonstrate greater accuracy of results [25]. Table 1 presents an overview of recent studies on route choice behavior and lists their corresponding features. The research findings on route choice behavior, considering discrete choice model analysis and machine learning methods, are further discussed in the next two subsections.

2.1. Discrete Choice Models

In the early study of Polydoropoulou et al. (1996), the contribution of advanced traveler information systems to route switching decisions is demonstrated in the case of car commuters in the California Bay, USA. Results showed that delays, travel time, and poor availability of traffic information were statistically important variables of the binary logit models which estimated the probability of using an alternative route [5]. To this end, the impact of real-time information on route choice preferences was studied by Ben-Elia and Shiftan (2010), who developed mixed logit models to uncover the association between travel time variability and informed trip-making decisions [6]. Other studies have also confirmed that the broadcasting of real-time traffic information may affect drivers’ route choices. Travel time, travel cost, age, gender, and income were underlined as significant factors in the multinomial probit models, which predicted the route switching behavior of car users in the freeway network of Taiwan, given the operation of advanced traveler information systems [8]. Under a similar research concept, another study in China indicated the importance of travel time and familiarity of car users with road alternatives when choosing among available routes [33]. In Madrid, Spain, Romero et al. (2020) employed binary logit models to analyze vehicle loop detectors’ data and highlighted the impact of the en-route variable message signs’ (VMS) information, such as travel time estimates and incidents, on drivers’ choices between a tolled highway and a competing free alternative of the same corridor [29]. In an urban environment in China, the route choice behavior of private car and taxi drivers was studied through a stated preference questionnaire survey and logistic regression models, and it was found that the VMS announcements on delays and accidents had a critical importance on route choice decisions [35]. More recently, a study in Iran underlined the influence of personality traits, along with the availability of VMS delay information, on route switching behaviors [40].
A nationwide questionnaire survey of over 1000 private car users in Taiwan indicated that when travel distances are over 151 km, car trips are preferably performed on freeways during off-peak hours for drivers to avoid traffic congestion events and decrease travel time and stress [11]. In Indonesia, Fadilah et al. (2022) investigated the route choice behavior of motorcycle riders with binary logit models. They concluded that the provision of real-time traffic information along with the level of road safety play an important role in selecting an arterial over a local route, because both traffic flow conditions and individual characteristics, such as travel purpose, driving style, and trip frequency, appeared to be significant factors in their discrete choice models [13]. The importance of driving habits and past experiences regarding the selection of alternative routes in Cagliari, Italy, is also examined in the study of [41]. Xu et al. (2010) [7] ran multinomial logit models and discovered that under the impact of travel information, the younger, male, and more experienced car drivers in Nanjing, China, were more willing to change their travelling routes, while shorter travel time variability, which is associated with higher travel time savings, was emphasized as a particularly attractive trip attribute. The latter finding is also confirmed by the research of Srinivasan and Mahmassani (2003) [32]. Travel cost and toll fees were highlighted as the most determining factors for the route selections of car drivers, while travel time played a comparatively more influential role for the decisions of truck drivers in a case study in Greece, where the utility of two alternative motorways was evaluated [9]. In the same study, road safety standards were equally appreciated in the decisions which were made by both road user categories. A great variety of trip and personal attributes, such as the number of traffic lights per km, the existence of highways, the time perception, the gender, age, income, and driving experience characteristics, were confirmed to influence route switching behavior in Italy, where researchers analyzed data from almost 400 commute trips under mixed logit modelling specifications [15]. In a similar context, Li et al. (2005) [14] studied GPS data relevant to the commute trip behavior of almost 200 car drivers in the metropolitan area of Atlanta, USA, and explained that those individuals who had a higher income and work schedule flexibility also had a greater propensity to choose multiple routes. Regarding the significance of vehicle type, the route choice behavior was found to be more sensitive to travel time and trip length for the drivers of battery electric vehicles in a large-scale experiment in Denmark [12]. The importance of truck drivers’ temperament for predicting urban freight route choice decisions is emphasized in a recent study conducted in Ukraine [37].

2.2. Machine Learning Methods

An emerging approach to the above-discussed discrete choice modelling is the utilization of machine learning techniques for explaining and predicting route choice behavior. The research work so far is comparatively less extensive. Specifically, in Japan, a study compared binary logit models and decision trees to estimate the behavior of expressway drivers against the selection of two alternative routes. Travel time was highlighted as a key decision factor in both models, but the decision trees had superior predictive power [36]. Artificial neural networks were utilized in a two-stage analysis of commuting patterns in the Minneapolis–St. Paul region, USA, where commuters were first grouped into three clusters and then their route choice behavior was evaluated separately [34]. In the work of Lai et al. (2019) [43], the performance of random forest models is examined, and they are proven to be suitable for large network and real-time analyses of drivers’ route choice behaviors when compared to random utility models. Random forest methods were also employed along with traditional discrete choice techniques to analyze features in order to better generate route choice sets and models [17]. In South Korea, the applicability of advanced neural network models is demonstrated for explaining route choice behaviors, and travel distance, cost, and safety are highlighted as important features for drivers’ route selection based on the SHAP (SHapley Additive exPlanations) machine learning algorithm [10].
Our study of the existing literature showed a variety of cases where traditional logit models are utilized for the estimation of user behavior. On the other hand, more modern modelling approaches, from the spectrum of machine learning, are not so common. In our analysis, we attempt to approach the route choice problem with two different modelling approaches, a binary logit and an artificial neural network, compare their performance, and identify the key parameters that influence user behavior.

3. Case Study/Data Collection

3.1. Description of Case Study

Thessaloniki is the second-largest city in Greece with a population in its metropolitan area of about one million inhabitants [44]. It is the economic, commercial, and cultural center of northern Greece, while at the same time it is a key transport hub at a regional level, due to its geographical location in the Balkan peninsula. Mobility is one of the greatest environmental and urban problems in Thessaloniki, since until now there is limited choice of travel options and transport modes, resulting in the increased use of private cars, worsening air pollution, and quality of life in general [45].
Thessaloniki’s Internal Ring Road extends over a total length of 22 km and is probably the most important road infrastructure in Thessaloniki as it ensures the bypass of the city to many daily commuters in the area. The road was designed in the late 1970s with two lanes and an emergency lane in each direction and its construction, which was implemented by segment, was completed in 1993. The road was subsequently upgraded to become a closed motorway with interchanges, with three lanes and no emergency lane in each direction. The number of vehicle crossings per day has increased from 40,000 initially to 120,000 vehicles in 2020 [46,47]. These figures would have increased even more had it not been for the long-lasting economic crisis and the COVID-19 pandemic.
Based on the above geometric and operational characteristics, the upgrade of the Internal Ring Road is deemed necessary to be able to serve vehicle traffic that is expected to increase significantly in the coming years and to significantly improve the level of road safety, which is at a very low level in the current situation. In the past, various solutions for the upgrading of the Internal Ring Road were considered but were rejected mainly for environmental reasons but also due to high implementation and operational costs.
The solution that was finally adopted concerns the upgrading of the existing Internal Ring Road with the construction of an elevated expressway with two lanes and an emergency lane over a length of 9.5 km. The whole project, named Flyover, was decided to be financed through Public Private Partnership and is expected to be completed by the end of 2026. Flyover will serve 10,000 vehicles per hour in each direction and there will be no tolls. Only cars and small trucks will enter the new motorway while heavy vehicles will be required to use the existing Internal Ring Road. Finally, it will serve only through traffic between East and West Thessaloniki with no intermediate exits (Figure 2). The project has a total budget of €478 million and will be the largest road infrastructure project in Thessaloniki for many years.

3.2. Data Collection Survey (RP/SP Survey Description)

In line with our research objective, an online web-based questionnaire survey was conducted among residents of Thessaloniki and the surrounding areas in February–March 2021. The aim of the survey was to investigate user behavior for different modes of transport (private cars, motorcycles, trucks, taxi, and buses) in the Internal Ring Road in Thessaloniki and assess the willingness to use the new Flyover motorway. The questionnaire was structured in three sections, each of which consisted of different types of questions.
The first part of the questionnaire is related to the revealed preference (RP) part of the survey and included questions about the respondents’ most recent trip on the Internal Ring Road in Thessaloniki. This specific section of the questionnaire was designed to collect data such as trip frequency and purpose, route length, rating of the Internal Ring Road in terms of specific characteristics (comfort, safety, etc.), as well as whether the respondent has encountered an unexpected event (e.g., accident) during their trip and the frequency of such events based on his/her experience.
The second part of the questionnaire included the stated preference (SP) part of the survey, where respondents were presented with a set of cards with hypothetical scenarios for two alternative trip routes. An initial assumption was made of a hypothetical trip, starting from the west, and heading to the east districts of the city or vice versa, for all respondents. This assumption was necessary to have a common principle based on which respondents consider their alternatives. To perform this trip, the user can follow two possible routes, Route A: existing Internal Ring Road and Route B: Flyover. Before the alternative scenarios were presented, a brief description of the main characteristics of Route A and Route B was given, showing indicative road lengths, number of lanes, and road capacity. In total, nine different scenarios were formed and the total trip duration, the probability of a serious accident, and the recovery time in case of an accident were chosen as the main attributes of the two alternative routes.
The aforementioned attributes of the SP survey were chosen due to the fact that the main differences between the alternative routes examined are mainly related to trip duration and the level of road safety which is either expressed in terms of the probability of a serious accident to occur or is also linked to the time required to return traffic to normal after an incident occurs. Common variables examined in such surveys, such as travel cost, were decided not to be considered in the specific questionnaire survey as the total travel cost on both routes is considered to be identical, mainly due to the absence of tolls on the new motorway.
The determination of trip characteristics’ values for both routes was not made randomly but was based on the traffic simulation model created within the Flyover investment project as well as on relevant studies and other data collected. The nine cards with hypothetical choice scenarios for both routes were then presented to the users.
Table 2 shows the attribute levels, as were given to the respondents through the SP card games. Overall, the construction of the new motorway is expected to reduce travel time as it would reduce delays that may be caused by heavy vehicle traffic, delays that may be associated with the absence of an emergency lane, and delays that may be caused by the presence of a high number of interchanges serving as entry/exit points to a motorway. All the above would also improve the level of road safety in the new motorway compared to the relatively low safety level in the current situation. However, accident recovery time is expected to be increased in the new motorway, namely because Flyover will operate as a “closed” motorway as there will be entry/exit points only at the start and at the end of the motorway, thus making it more difficult for emergency services to approach a potential accident.
The third and last part of the questionnaire included questions about socioeconomic characteristics such as gender, age, number of persons living in the same household, income, occupation, etc.

3.3. Data Overview

Due to the COVID-19 pandemic, the questionnaire survey was conducted using electronic mass media (e.g., social media, e-newspapers, etc.). In total, 450 valid questionnaires were collected [48]. Table 3 and Table 4 present the descriptive statistics for the scale and nominal/ordinal variables, respectively, which were quantified by this questionnaire survey and used further in the analysis of this study.
Τhe main conclusions that emerged from the analysis of the survey results can be summarized as follows:
  • About half of the survey respondents have been using the Internal Ring Road for more than 15 years while more than 67% of the respondents use the existing motorway at least once a week, which highlights the importance of the road axis under examination for the city of Thessaloniki.
  • Commuting seems to be the most prevalent trip purpose when using the Internal Ring Road for 32.40% of the sample, followed closely by trips for recreation purposes.
  • Regarding the qualitative evaluation of the existing motorway based on specific criteria, the analysis showed that the lowest scores were given to safety conditions and information provision about accidents and other incidents, while the highest scores were given to travel time and cost.
  • Most of the sample, namely 85.10%, has experienced an unexpected event during their trips on the Internal Ring Road, a very high percentage that raises several concerns about the safety conditions and the level of service of this central artery of the city. Such events can be either an accident or road maintenance incident, which can cause the temporary closure of traffic lanes and lead to long delays due to the lack of an emergency traffic lane.
  • A percentage of around 20% of the sample uses the existing Ring Road from its initial to its final junction, namely through trips from East to West Thessaloniki and vice versa. This is a significant percentage of traffic that can be served by the construction of the Flyover.
  • Regarding the socioeconomic characteristics of the sample: 33.3% were women, 27.10% of the participants belong to the age group 35–44, the average total number of persons in the household is 3 persons, and the average total number of vehicles in the household accounts for 2 vehicles. The monthly household income for more than 50% of the respondents is <2000 € while 51.1% of the sample are employees in the public or private sector. Age and income were considered as the two control variables used for the representativeness of the sample to the total population.
  • Finally, based on the responses of the SP part of the survey, almost 65% of users would choose the Flyover as an alternative trip route, which proves the attractiveness of the new motorway.
Before proceeding further to the development of the route choice models, it is crucial to examine the relationship between the dependent variable of our survey, namely the choice of users, with all the other independent variables of our sample. The correlation between the variables was examined to determine which of them would be taken into account as input variables for the formulation of the route choice models.
In our analysis, we assessed correlations at a significance level of 95%, with the use of appropriate inferential statistical tests. The selection of the appropriate statistical tests was based on the type of variables examined each time [49]. Correlations of the different independent variables were assessed against the dependent variable of “choice”. To this end, the impact of different variables on users’ route choice is examined. Table 5 presents the results of the statistical tests performed in the context of the present study.
Based on the above results, it can be concluded that the parameters that influence the choice of commuters the most are:
  • User characteristics such as gender as it appears that women, compared to men, are more likely to choose the new motorway.
  • Qualitative characteristics of the existing motorway such as safety, comfort, reliability, information, service, and travel time assessment. The higher the rating given to the above characteristics, the more likely users are to continue to use the existing Internal Ring Road.
  • Trip characteristics and, more specifically, the difference between alternative routes regarding travel time, probability of accident occurrence, and recovery time in case of an incident. The better trip characteristics of one route are compared to the other, the more likely users are to choose the specific route over the other.

4. Route Choice Models

4.1. Binary Logit Regression

The primary purpose of this section is to examine the intention of respondents to choose one route over the other. To this end, binary route choice models are constructed through the binary logistic regression process and the use of the statistical program IBM SPSS Statistics [50]. Generally, a binary logistic regression predicts the probability that an observation falls into one of two categories of a dichotomous dependent variable based on one or more independent variables that can be either continuous or categorical. In developing the logistic regression equation, the LN of the odds represents a logit transformation, where the logit is a function of covariates such that [50]:
Y i = l o g i t ( P i ) = L N ( P i 1 P i ) = β 0 + β 1 × Χ 1 , i + β 2 × Χ 2 , i + + β K × Χ K , i
where β0 is the model constant and the β1, …, βK are the unknown parameters corresponding with the explanatory variables (Xk, k = 1, …, K the set of independent variables).
Based on specific trip and route characteristics, drivers who currently use the Internal Ring Road in Thessaloniki have two distinct choices, to continue using the existing motorway or to shift to the new Flyover. Thus, a binary logistic regression model could be used for explaining drivers’ behavior as a function of various observable factors. The variables tested for inclusion in the model are the following:
  • Route characteristics as presented in the SP part of the questionnaire (travel time, probability of a serious accident, and the recovery time in case of an accident).
  • Trip characteristics (trip purpose, frequency, assessment of existing infrastructure, etc.).
  • User characteristics (gender, age, income, etc.).
The description and coding of all variables tested in the model are presented in Table 2 and Table 3. The dependent variable is the users’ choice, taking values 0 and 1. Zero (0) stands for selecting the existing Internal Ring Road and one (1) for selecting the new Flyover. Different combinations of explanatory variables were tested. The form of the model is given by the following Equation (2) [50]:
P i   ( f l y o v e r ) = e ( b 0 +   b 1 x 1 +   b 2   x 2 + +   b k   x k ) 1 +   e ( b 0 +   b 1 x 1 +   b 2   x 2 + +   b k   x k )
where
Pi is the probability of the ith case to choose the Flyover,
bi is the odds ratio.
The statistical tests carried out in order to evaluate the statistical significance of the model were the following:
  • The Nagelkerke R Square index, which gives an indication of the size of the sample variance that is ultimately interpreted by the regression. The closer to 1 the value of this indicator is, the better the model adapts to the sample data.
  • Another measure of the good adaptation of the model is the Classification Table, which compares the observed probabilities with those provided for by the model. The higher the percentage of cases of the dependent variable correctly predicted based on the model, the better the model adjustment [50].

4.2. Artificial Neural Network

For the purpose of achieving the best possible predicting model of the user’s road choice behavior, we developed an artificial neural network (ANN) additional to the binary regression model. The ability of ANNs to fit complex datasets and in some cases identify latent relations between variables are some of their advantages against traditional statistical models. On the other hand, the higher computational requirements, in combination with their non-parametric nature, often deter researchers from choosing them.
Depending on the problem at hand, different types of ANNs can be used. For instance, convolutional neural networks are mainly exploited in problems of computer vision, while recurrent neural networks can be used to incorporate temporal parameters in an analysis. The widest family of ANNs, the feedforward neural networks, have a wide variety of applications, through their ability to solve regression, classification, and clustering problems.
The architecture of an ANN, i.e., the number of layers and the number of neurons in each layer, is the most crucial part of developing the model. The determination of the optimal combination of layers and neurons is determined through a trial-and-error approach, with the assessment of performance metrics working as a guide for the suitability of each combination. Along with the architecture, the hyperparameters of the network also affect the performance of the model. Among those parameters are the activation function associated with each layer of the network, the number of training cycles of the network, called epochs, the learning rate of the network, and the batch size, which refers to the number of data points/rows inserted in the network at each training instance.

Model Architecture and Complexity Assessment

In our analysis, we chose a feedforward neural network with backpropagation as our model. In order to determine the optimal model, we assessed the achieved accuracy of several different architectures. However, although higher accuracy is the main requirement for all predictive models, in the case of deep learning, this could come at the cost of high computation time and high resource consumption, especially when it comes to large and detailed datasets [51]. As a result, an additional parameter that needs to be taken into account when choosing the optimal model is its complexity.
Model optimization based on complexity is a process that can include a variety of parameters, such as model framework, optimization process, data complexity, etc. Model size is also a parameter that affects complexity and in cases where all other parameters are fixed, can be regarded as a measure of complexity [52]. A common metric of model size is the number of trainable parameters, which translates as the number of weights and biases that need to be optimized during the model’s training process. Processing time can also be regarded as a metric of model complexity, one that is directly in conjunction with model size, as more complex models often take more time to train.
In the case of our model, we chose the number of trainable parameters and the processing time as measures of complexity. Figure 3 illustrates the results of the complexity analysis. As can be seen, the best overall performance was achieved by the architecture that includes three hidden layers of eight neurons each. More complex architectures led to marginal gains in accuracy (size of 0.1–0.5%), while at the same time significant overfitting was observed along with unstable performance through the training epochs. Additionally, increased complexity also affected processing time, with the selected model architecture achieving the optimal trade-off between accuracy and processing time.
The architecture of the network was completed with the addition of the input layer, which consists of the X vector (Equation (3)), which includes five neurons, as many as the independent variables of our problem (the same variables that were included in the binary logit regression model) and the output layer, which consists of two neurons, as many as the classes of our dependent variable.
X   [ X 1 ,   X 2 , ,   X 5 ]  
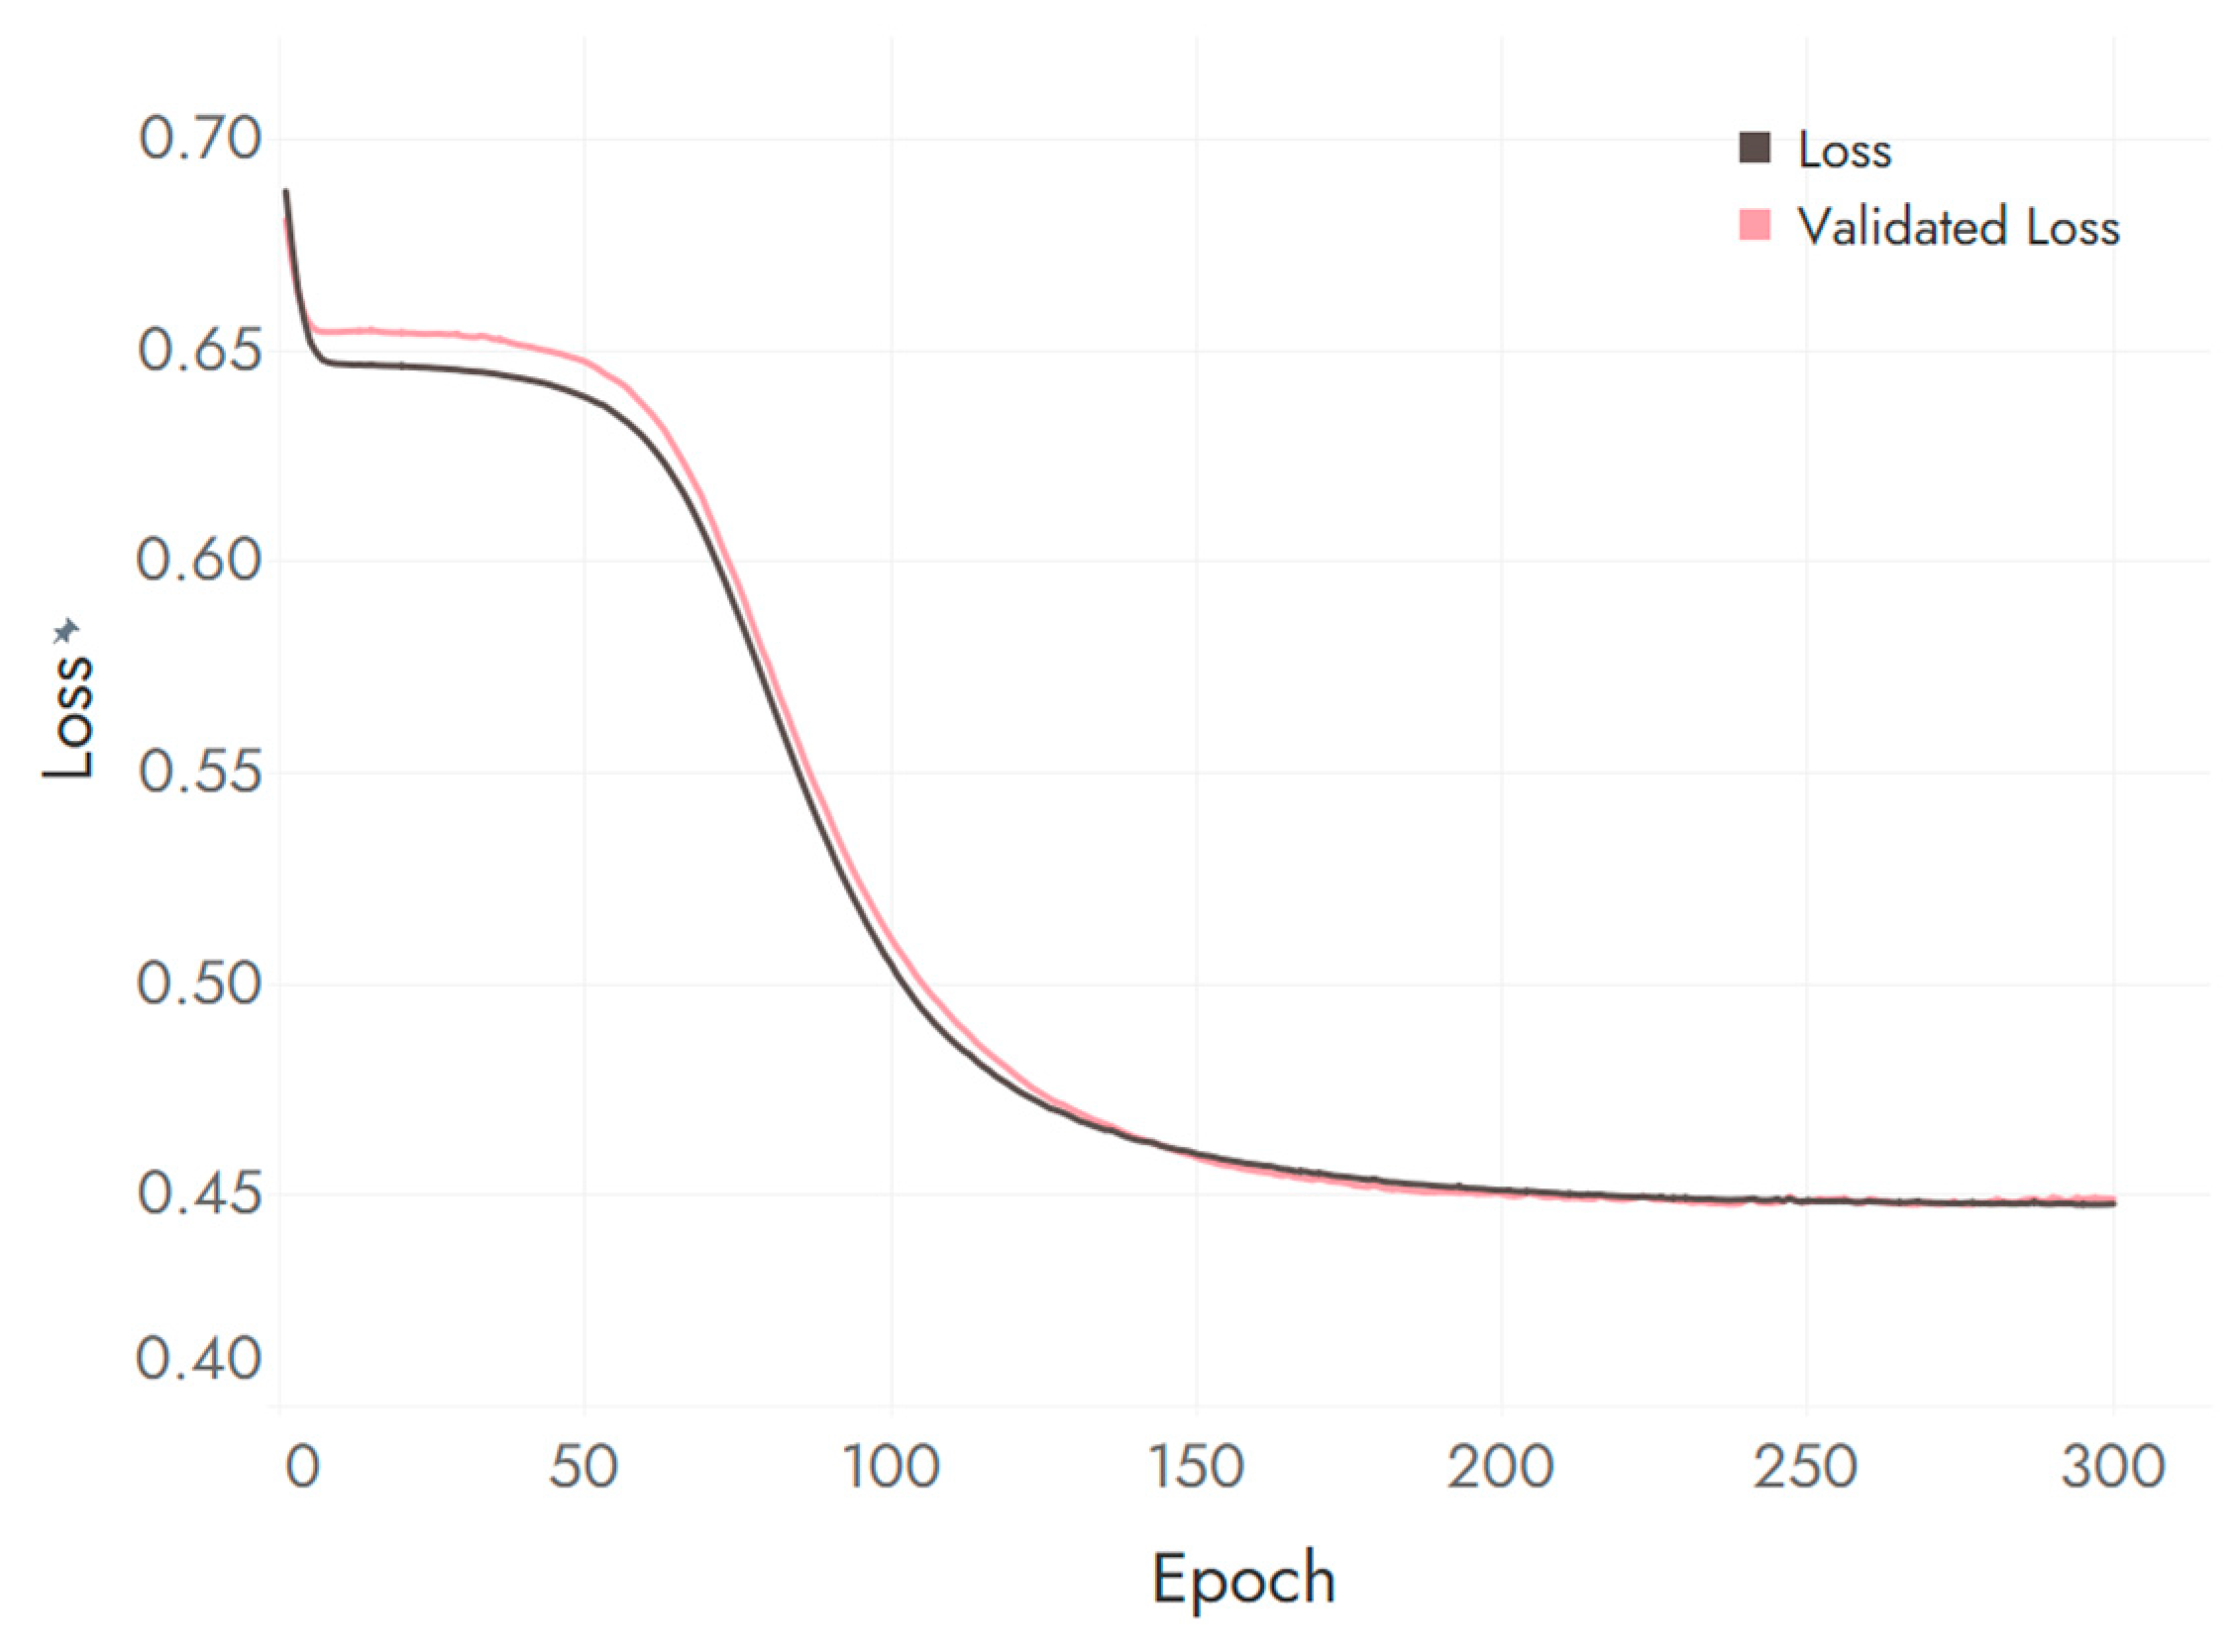
Concerning the activation functions, we chose to use the sigmoid function (Equation (4)) between all layers, as it provided more robust results. Furthermore, several trials with different values for the learning rate and the batch size were attempted, with the values of 0.0001 and 256, respectively, returning the best overall performance. The model was trained on an 80/20 dataset ratio for 300 epochs, after which, according to the learning curves (Figure 4), the model does not achieve higher accuracy.
f = 1 1 + e x  
The evaluation of the performance of the ANN model was performed based on the classification table, as well as the values of different metrics, i.e., accuracy, precision, and recall described from the following equations:
A c c u r a c y = T P + T N T P + F P + T N + F N
P r e c i s i o n = T P T P + F P
R e c a l l = T P T P + F N
where TP (true positives) are the values that are correctly assigned to class i, TN (true negatives) are the values correctly not assigned to class i, FP (false positives) are the values falsely assigned to class i, and FN (false negatives) are the values falsely not assigned to class i.
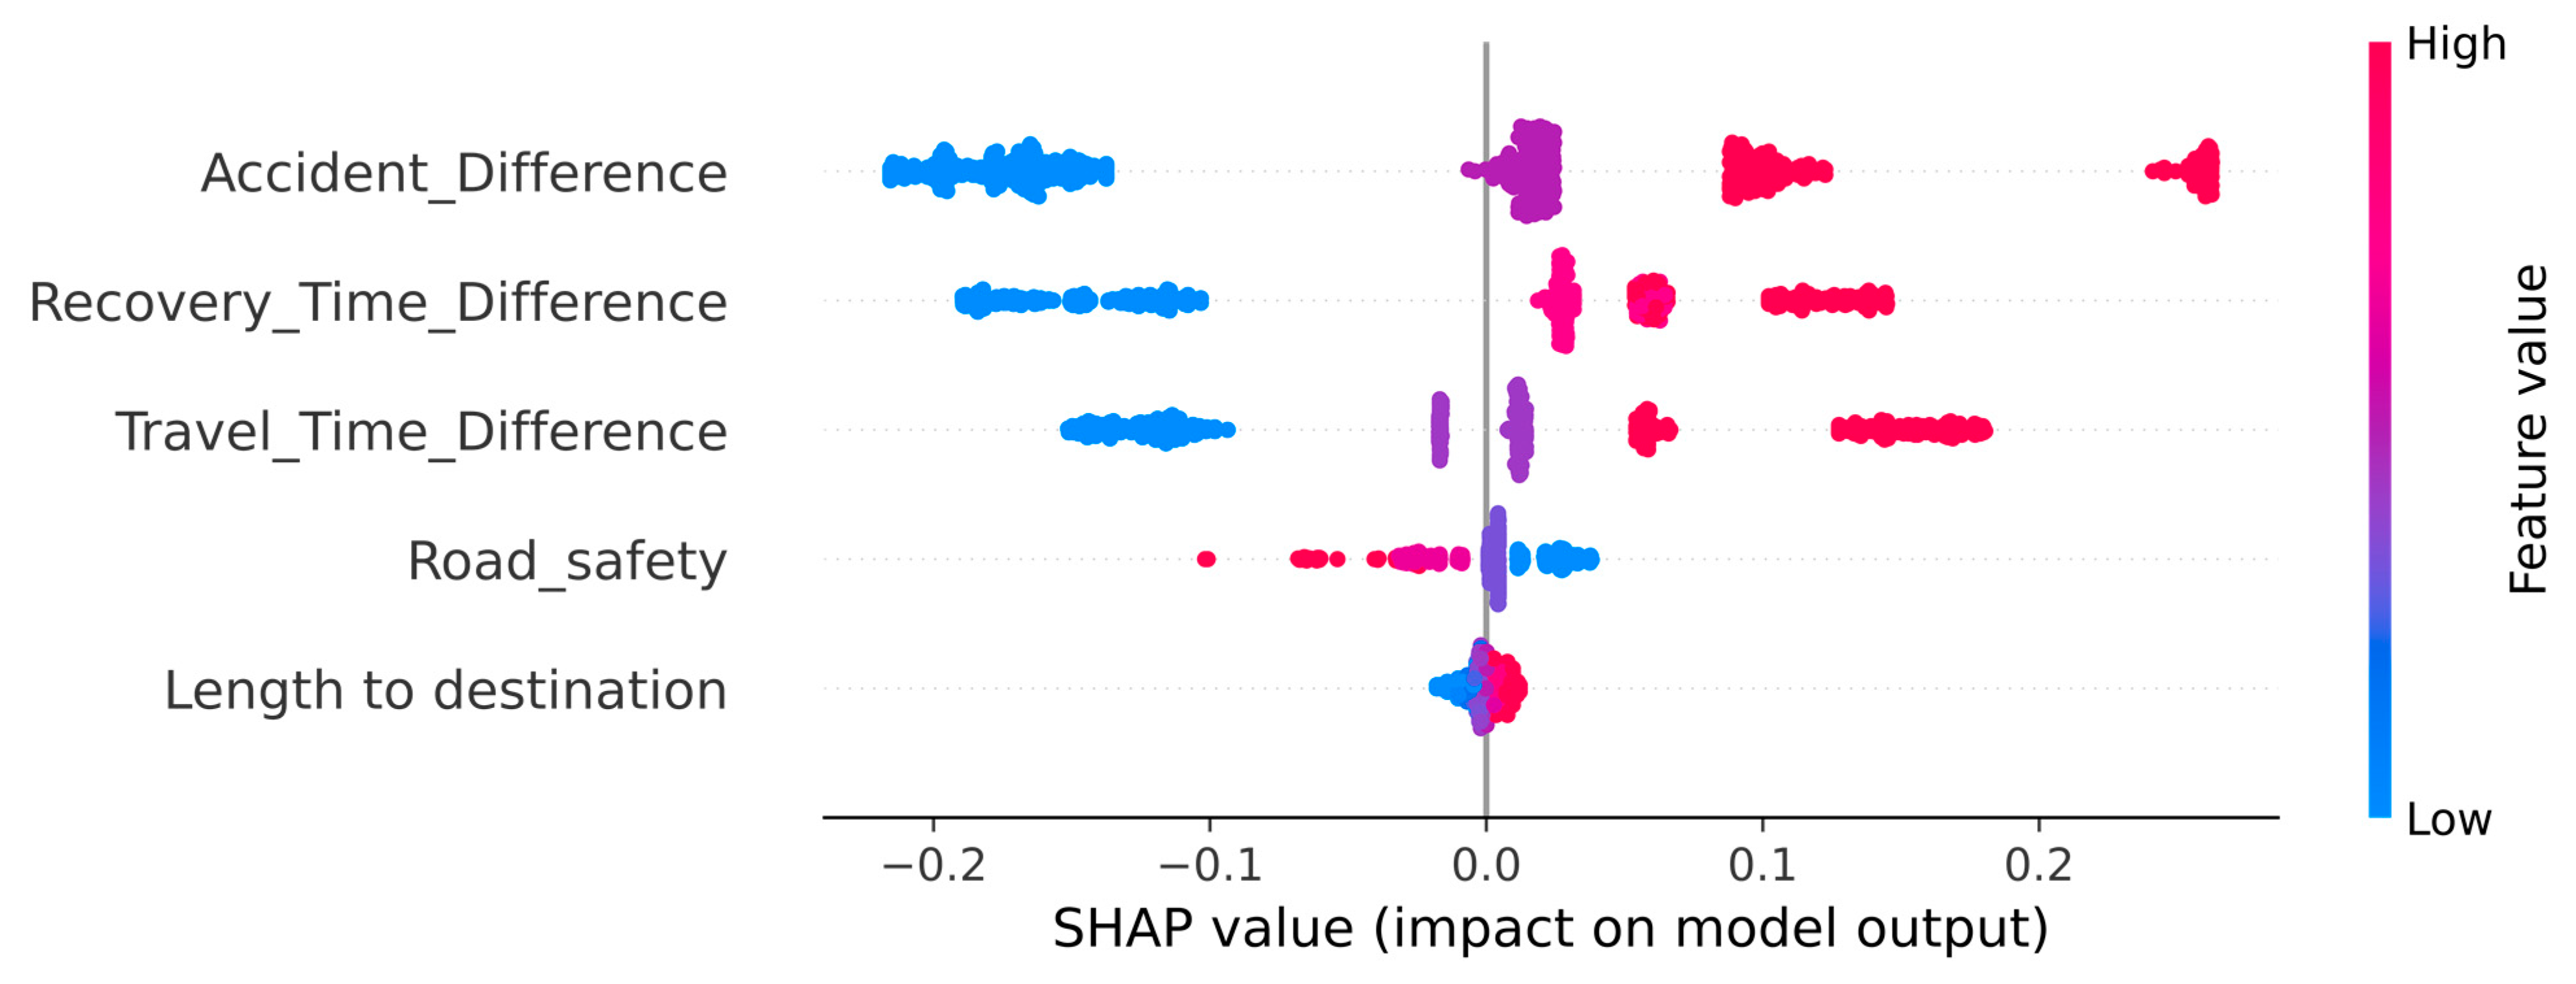
After the establishment of the most robust model, the SHAP algorithm [53] was fitted for the estimation of the effect of each of the independent variables on the choice of users. More importantly, since the network that was finally chosen is comprised of three (3) hidden layers, and thus, is a deep learning network, the algorithm that was chosen was the DeepSHAP algorithm.

5. Results and Discussion

The analysis of the results focuses on two objectives; firstly, the assessment of the predictive capabilities of the two applied methods and secondly, the determination of the factors that affect user choice, as deriving from each model. Concerning the fit of both models on the user choice problem, both applied models demonstrated similar predictive capabilities, with the ANN appearing to be slightly more accurate.
The accuracy of the regression model, as can be seen in Table 6, is 81%. By looking at the parameter estimates for each variable, we can initially assume that there is an a priori tendency of drivers toward choosing the flyover for their travel. The most important parameters that affect users’ decision are the probability of accident occurrence, travel time, and recovery time in case of an accident. Results also indicate that improved road conditions on the new motorway compared to the existing situation, prompt users to choose the new alternative route. Furthermore, users who make longer journeys are more likely to use the new flyover. When it comes to the quality of service of the existing road, it is evident that road safety is the most important criterion in route selection, which again demonstrates the low level of road safety characterizing the existing road infrastructure. Other quality of service parameters were not considered to be included in the model due to multicollinearity issues with the other independent variables and weak correlation with the dependent variable.
The calculation of the odds ratio ((exp(B) in Table 6) allows for the comparison of the effect of each independent variable to the outcome of the model. Based on the results, it can be concluded that the most important parameter that affects users’ choice is travel time, probability of accident occurrence, and recovery time in case of an accident.
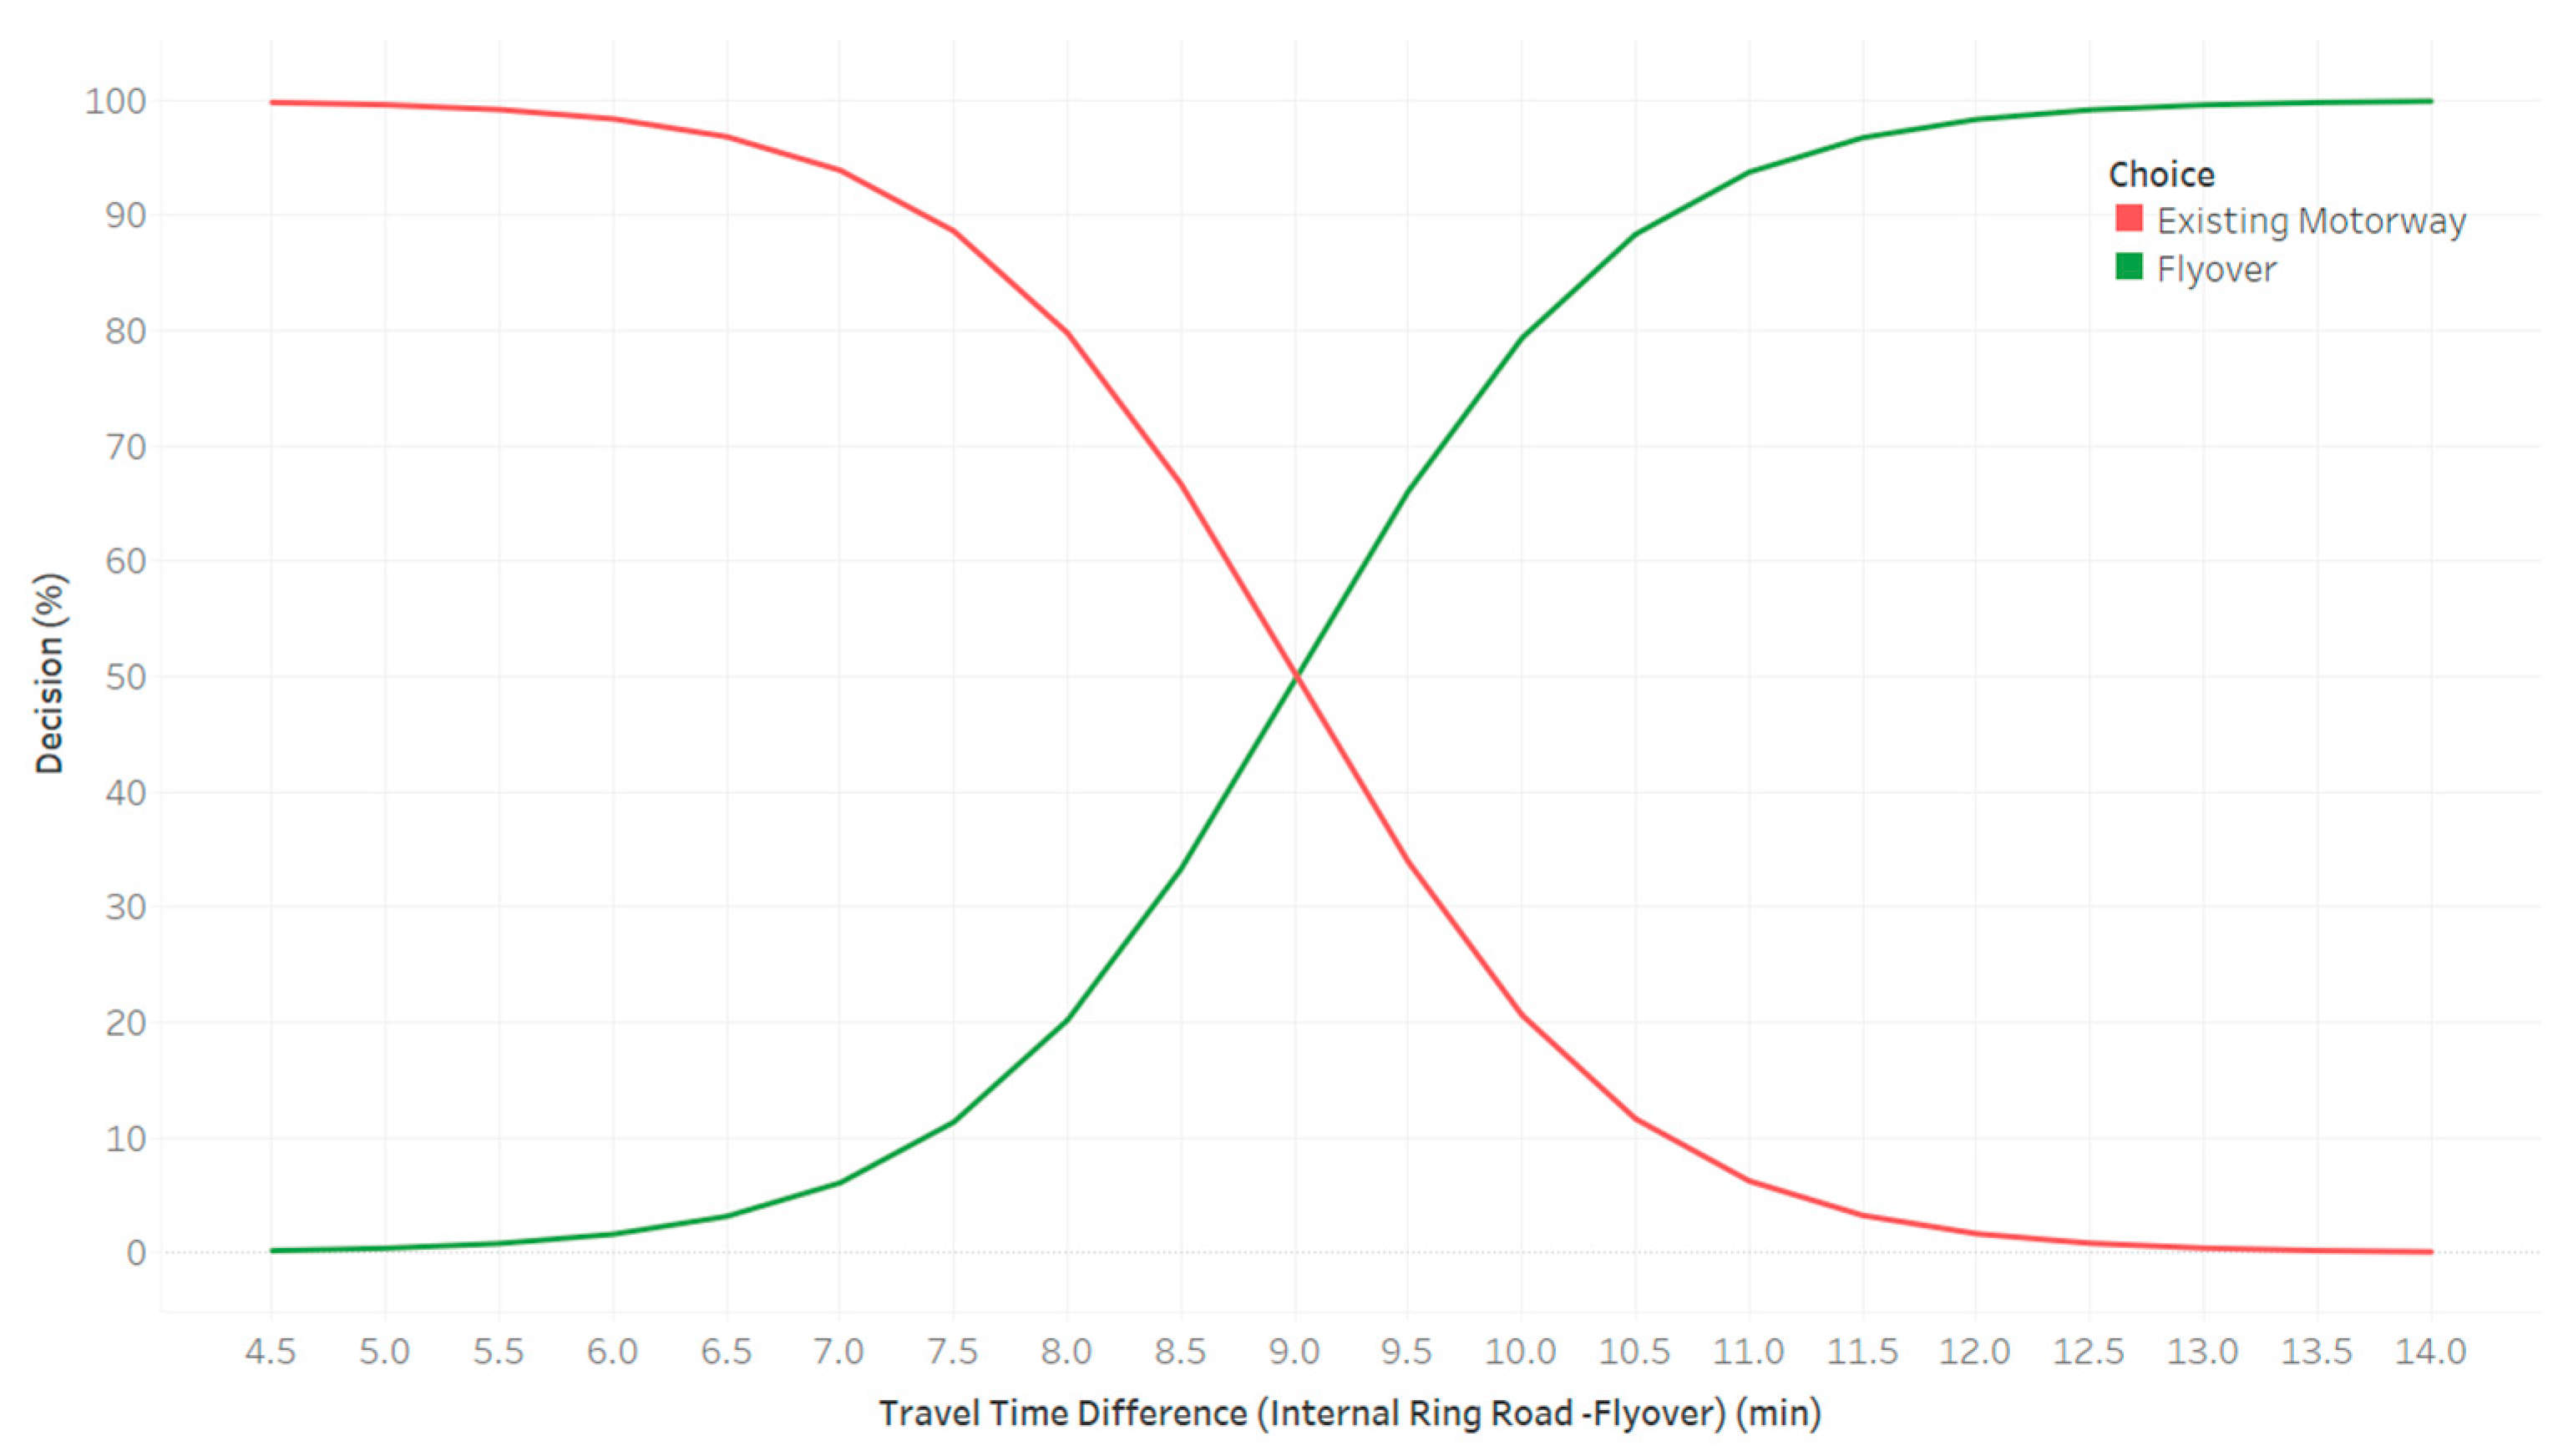
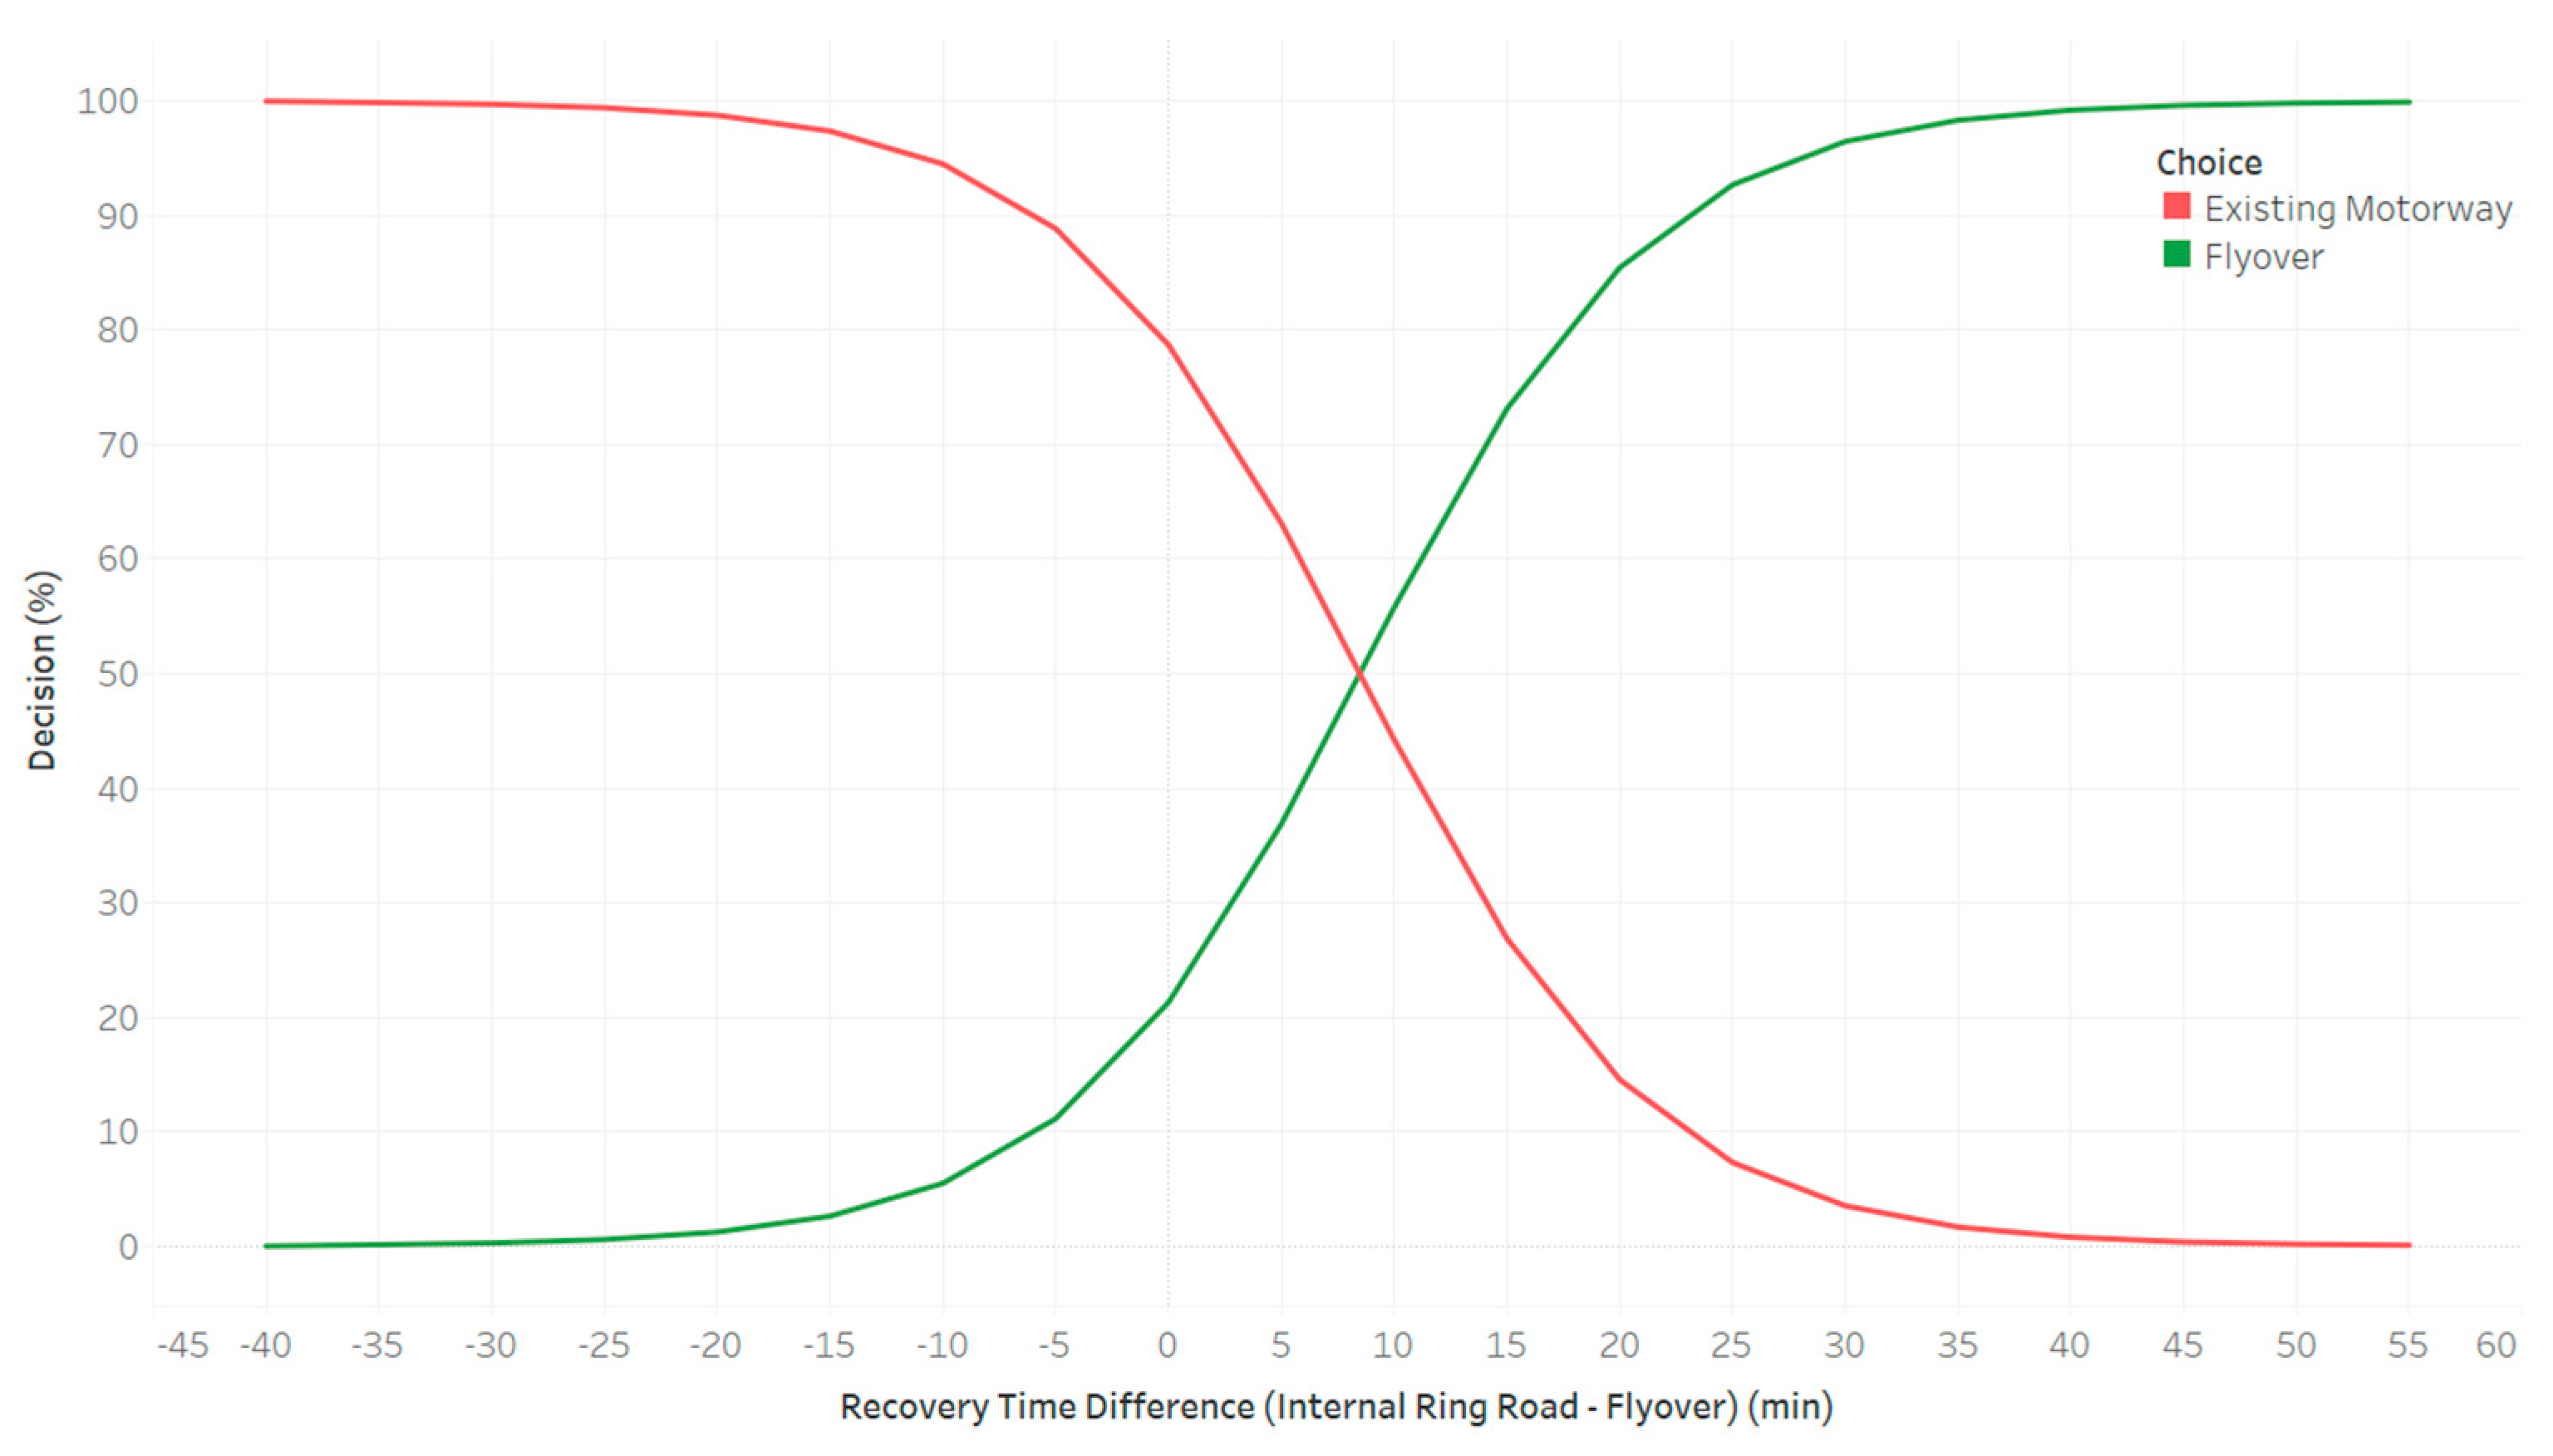
Furthermore, probability charts for the binary choice model were also constructed for travel time, probability of accident occurrence, and recovery time in case of an accident (Figure 5, Figure 6 and Figure 7). For each examined variable, different attribute levels were examined while for the other variables, the mean values were used for the calculation of probabilities. These charts indicate that users’ choice is most influenced by the difference in the probability of accident occurrence between the examined routes. Even if the probability of accident occurrence in the existing motorway is lower than that of the new motorway, users tend to choose the Flyover to a higher percentage compared to the existing motorway. On the other hand, even when travel time and recovery time in case of an accident is to some extent longer in the existing situation compared to the new one, users appear reluctant to choose the new route over the one they already use. Once again, it is proven that one of the greatest problems of the Internal Ring Road is road safety.
The ANN developed achieved marginally better results in comparison to the regression model, as can be seen in Table 7. More specifically, the model demonstrates an overall accuracy of 82.10%, while the recall metric for the users choosing the existing motorway and the flyover is 58.5% and 95.5%, respectively. Although the ANN is equally able to predict users that choose the existing road infrastructure, there is a distinguishable improvement in the predictive capability concerning users that choose to travel via the flyover.
In succession of the development of the ANN model, the SHAP algorithm was applied, in order to determine the effect of each of the studied variables to the dependent variable. The results (Figure 8) indicate the difference in accident occurrence probability between the two route options as the most important variable, while the recovery time and travel time difference are the next two variables. For each one of these three factors, as their value increases, meaning that travel conditions (road safety, congestion level, etc.) in the existing road axis are worse than in the flyover, users tend to choose the flyover as their route more often. Regarding the effect of the qualitative assessment of road safety of the existing motorway, the higher the rating the lesser the number of users who leave the existing motorway in favor of the flyover. Finally, the travel distance is the least important of the variables in the model, since the SHAP values do not deviate significantly from the zero-line as its value increases/decreases. Overall, there appears to be an agreement on the results of both models, regarding which input variables are considered as important contributors to route choice and how strongly each of these variables affect drivers’ decision.
The existing literature confirms the effect of travel time on user choice [5,6,8,9,33,36], while on the other hand there is limited research [9] on the significance of road safety on route choice. Additionally, there is no literature supporting or contradicting the effect of recovery time on route choice either. Furthermore, past research findings provide evidence on the significance of travel distance in route choice [11,12].

6. Conclusions

Route choice is one of the most important steps of transport planning and thus, the determination of the key factors that affect it is a constant objective of interest and research. The present study aims at identifying the key factors that affect user choice between the existing ring road in Thessaloniki, Greece, and a future flyover motorway. For the purposes of the research, two choice models, a binary regression and an ANN, were developed, based on user preference data from an RP and SP survey.
Both models demonstrated moderate predictive capabilities, with the ANN proving to be the most robust model of the two. After the establishment of both models, the identification of the most influential factors was undertaken. Both methods reached a similar outcome, by indicating the difference in travel time, accident occurrence probability, and recovery time between the existing and future motorway, as the three most important factors. In more detail, worse conditions on the existing road infrastructure, as depicted by these variables, lead users to choose the future flyover motorway. The significance of road safety was also underlined by the fact that users who rate safety levels on the existing infrastructure with a lower score, are more likely to choose the flyover instead. Lastly, an increase in trip distance also seems to favor the flyover.
Based on the empirical findings of this study, several implications can be highlighted regarding the increase in the attractiveness of a motorway, that can be useful to transport infrastructure operators or transport planners. Initially, the enhancement in road safety can consequently increase the perception of safety of users and thus persuade them to use a particular road section/axis. Additionally, an enhancement in road safety can also contribute to the minimization of traffic disruption phenomena due to accidents, thus ensuring direct and immediate trips. Furthermore, suitable traffic management schemes that contribute to the limitation of traffic congestion cases and thus reduce delays, should also be employed by planners or operators to increase the attractiveness of certain routes. Finally, the timely detection of accidents or incidents and the corresponding immediate action toward removing stopped vehicles and repairing infrastructure can also lead to the increase in the attractiveness of a specific route. To that end, patrol vehicles or specialized detection equipment (fixed cameras, drones, sensors, etc.) can be exploited to provide input in such cases.
Limitations of the present study mainly lie in the data collection process. A wider survey could provide additional data that would enhance the predictive ability of the applied models and give more detailed insight into the effect of the independent variables on user choice. Future research can also focus on the additional assessment of the difference in cost and in various environmental parameters between two route options as well as on the inclusion of variables that describe the traffic composition (ratio of private cars to heavy vehicles, autonomous vehicles, etc.). Additionally, future research could focus on the comparative analysis of the performance of the two applied models (under different dataset sizes, or by utilizing different optimization algorithms), i.e., binary logit and artificial neural network, and add to the existing literature on the subject.

Author Contributions

Conceptualization, I.P., G.G., A.K., A.N., C.S., S.B.; methodology, A.N., A.K., I.P. and G.G.; software, A.K. and A.N.; validation, A.N., A.K., G.G. and I.P.; formal analysis, A.K., A.N., G.G. and I.P.; investigation, A.K., A.N., I.P. and G.G.; data curation, A.N. and A.K.; writing—original draft preparation, A.N., A.K., G.G. and I.P.; visualization, A.K.; supervision, I.P.; project administration, A.N., A.K., G.G., I.P. and S.B. All authors have read and agreed to the published version of the manuscript.

Funding

This research received no external funding.

Institutional Review Board Statement

Not applicable.

Informed Consent Statement

Informed consent was obtained from all subjects involved in the study.

Data Availability Statement

Data are available by the authors upon request.

Conflicts of Interest

The authors declare no conflict of interest.

References

  1. Cramphorn, B.; Davies, R. The Social Impact of Roads. Aust. Plan. 2004, 41, 46–47. [Google Scholar] [CrossRef]
  2. Wang, D.D. Assessing Road Transport Sustainability by Combining Environmental Impacts and Safety Concerns. Transp. Res. D Transp. Environ. 2019, 77, 212–223. [Google Scholar] [CrossRef]
  3. Harantová, V.; Kalašová, A.; Kubíková, S. Use of Traffic Planning Software Outputs When a New Highway Section Is Put into Operation. Sustainability 2021, 13, 2467. [Google Scholar] [CrossRef]
  4. Zeng, J.; Qian, Y.; Wang, B.; Wang, T.; Wei, X. The Impact of Traffic Crashes on Urban Network Traffic Flow. Sustainability 2019, 11, 3956. [Google Scholar] [CrossRef] [Green Version]
  5. Khattak, A.; Polydoropoulou, A.; Ben-Akiva, M. Modeling Revealed and Stated Pretrip Travel Response to Advanced Traveler Information Systems. Transp. Res. Rec. J. Transp. Res. Board 1996, 1537, 46–54. [Google Scholar] [CrossRef]
  6. Ben-Elia, E.; Shiftan, Y. Which Road Do I Take? A Learning-Based Model of Route-Choice Behavior with Real-Time Information. Transp. Res. Part A Policy Pract. 2010, 44, 249–264. [Google Scholar] [CrossRef]
  7. Xu, C.; Wang, W.; Li, Z.; Yang, C. Comparative Study on Drivers’ Route Choice Response to Travel Information at Different Departure Time. In Proceedings of the 2010 2nd International Asia Conference on Informatics in Control, Automation and Robotics (CAR 2010, Wuhan, China, 6 March 2010; pp. 97–100. [Google Scholar]
  8. Jou, R.-C.; Lam, S.-H.; Liu, Y.-H.; Chen, K.-H. Route Switching Behavior on Freeways with the Provision of Different Types of Real-Time Traffic Information. Transp. Res. Part A Policy Pract. 2005, 39, 445–461. [Google Scholar] [CrossRef]
  9. Politis, I.; Kyriakoglou, M.; Georgiadis, G.; Papaioannou, P. Evidence from Highway Drivers in Greece Showing Toll Avoidance and Utility of Alternative Routes. Transp. Res. Rec. J. Transp. Res. Board 2020, 2674, 948–958. [Google Scholar] [CrossRef]
  10. Dong, G.; Kweon, Y.; Park, B.B.; Boukhechba, M. Utility-Based Route Choice Behavior Modeling Using Deep Sequential Models. J. Big Data Anal. Transp. 2022, 4, 119–133. [Google Scholar] [CrossRef]
  11. Jou, R.-C.; Chiou, Y.-C.; Chen, K.-H.; Tan, H.-I. Freeway Drivers’ Willingness-to-Pay for a Distance-Based Toll Rate. Transp. Res. Part A Policy Pract. 2012, 46, 549–559. [Google Scholar] [CrossRef]
  12. Jensen, A.F.; Rasmussen, T.K.; Prato, C.G. A Route Choice Model for Capturing Driver Preferences When Driving Electric and Conventional Vehicles. Sustainability 2020, 12, 1149. [Google Scholar] [CrossRef] [Green Version]
  13. Fadilah, S.R.; Nishiuchi, H.; Ngoc, A.M. The Impact of Traffic Information Provision and Prevailing Policy on the Route Choice Behavior of Motorcycles Based on the Stated Preference Experiment: A Preliminary Study. Sustainability 2022, 14, 15713. [Google Scholar] [CrossRef]
  14. Li, H.; Guensler, R.; Ogle, J. Analysis of Morning Commute Route Choice Patterns Using Global Positioning System–Based Vehicle Activity Data. Transp. Res. Rec. J. Transp. Res. Board 2005, 1926, 162–170. [Google Scholar] [CrossRef]
  15. Vacca, A.; Meloni, I. Understanding Route Switch Behavior: An Analysis Using GPS Based Data. Transp. Res. Procedia 2015, 5, 56–65. [Google Scholar] [CrossRef]
  16. Prato, C.G. Route Choice Modeling: Past, Present and Future Research Directions. J. Choice Model. 2009, 2, 65–100. [Google Scholar] [CrossRef] [Green Version]
  17. Yao, R.; Bekhor, S. Data-Driven Choice Set Generation and Estimation of Route Choice Models. Transp. Res. Part C Emerg. Technol. 2020, 121, 102832. [Google Scholar] [CrossRef]
  18. Ripley, B.D. Pattern Recognition and Neural Networks; Cambridge University Press: Cambridge, MA, USA, 1996; ISBN 9780521460866. [Google Scholar]
  19. León, M.A. Binary Response Forecasting: Comparison between Neural Networks and Logistic Regression Analysis. In World Congress on Neural Networks; Routledge: Oxfordshire, UK, 2021; Volume 2. [Google Scholar]
  20. Heydari, S.T.; Ayatollahi, S.M.T.; Zare, N. Comparison of Artificial Neural Networks with Logistic Regression for Detection of Obesity. J. Med. Syst. 2012, 36, 2449–2454. [Google Scholar] [CrossRef] [PubMed]
  21. Dou, J.; Yamagishi, H.; Zhu, Z.; Yunus, A.P.; Chen, C.W. TXT-Tool 1.081-6.1 A Comparative Study of the Binary Logistic Regression (BLR) and Artificial Neural Network (ANN) Models for GIS-Based Spatial Predicting Landslides at a Regional Scale. In Landslide Dynamics: ISDR-ICL Landslide Interactive Teaching Tools; Springer International Publishing: Cham, Switzerland, 2018; pp. 139–151. [Google Scholar]
  22. Yoo, H.-S.; Kim, Y.-S. Development of a Crack Recognition Algorithm from Non-Routed Pavement Images Using Artificial Neural Network and Binary Logistic Regression. KSCE J. Civ. Eng. 2016, 20, 1151–1162. [Google Scholar] [CrossRef]
  23. Kazemnejad, A.; Batvandi, Z.; Faradmal, J. Comparison of Artificial Neural Network and Binary Logistic Regression for Determination of Impaired Glucose Tolerance/Diabetes. East. Mediterr. Health J. 2010, 16, 615. [Google Scholar] [CrossRef] [PubMed]
  24. Wang, S.; Mo, B.; Hess, S.; Zhao, J. Comparing Hundreds of Machine Learning Classifiers and Discrete Choice Models in Predicting Travel Behavior: An Empirical Benchmark. arXiv 2021, arXiv:2102.01130. [Google Scholar] [CrossRef]
  25. van Cranenburgh, S.; Wang, S.; Vij, A.; Pereira, F.; Walker, J. Choice Modelling in the Age of Machine Learning—Discussion Paper. J. Choice Model. 2022, 42, 100340. [Google Scholar] [CrossRef]
  26. Manski, C.F. The Structure of Random Utility Models. Theory Decis. 1977, 8, 229–254. [Google Scholar] [CrossRef]
  27. Marshack, J. Binary Choice Constraint and Random Utility Indicators. In Mathematical Methods in the Social Sciences; Springer: Dordrecht, The Netherlands, 1960. [Google Scholar]
  28. Hess, S.; Quddus, M.; Rieser-Schüssler, N.; Daly, A. Developing Advanced Route Choice Models for Heavy Goods Vehicles Using GPS Data. Transp. Res. E Logist. Transp. Rev. 2015, 77, 29–44. [Google Scholar] [CrossRef] [Green Version]
  29. Romero, F.; Gomez, J.; Rangel, T.; Jurado-Piña, R.; Vassallo, J.M. The Influence of Variable Message Signs on En-Route Diversion between a Toll Highway and a Free Competing Alternative. Transportation 2020, 47, 1665–1687. [Google Scholar] [CrossRef]
  30. Abdel-Aty, M.A. Modeling Incident-Related Routing Decisions by Using a Nested Logit Structure. Transp. Res. Rec. J. Transp. Res. Board 1998, 1645, 103–110. [Google Scholar] [CrossRef]
  31. Vovsha, P.; Bekhor, S. Link-Nested Logit Model of Route Choice: Overcoming Route Overlapping Problem. Transp. Res. Rec. J. Transp. Res. Board 1998, 1645, 133–142. [Google Scholar] [CrossRef] [Green Version]
  32. Srinivasan, K.K.; Mahmassani, H.S. Analyzing Heterogeneity and Unobserved Structural Effects in Route-Switching Behavior under ATIS: A Dynamic Kernel Logit Formulation. Transp. Res. Part B Methodol. 2003, 37, 793–814. [Google Scholar] [CrossRef]
  33. Xu, T.; Sun, L.; Peng, Z.-R. Empirical Analysis and Modeling of Drivers’ Response to Variable Message Signs in Shanghai, China. Transp. Res. Rec. J. Transp. Res. Board 2011, 2243, 99–107. [Google Scholar] [CrossRef]
  34. Tang, W.; Cheng, L. Analyzing Multiday Route Choice Behavior of Commuters Using GPS Data. Adv. Mech. Eng. 2016, 8, 168781401663303. [Google Scholar] [CrossRef] [Green Version]
  35. Zhao, W.; Ma, Z.; Yang, K.; Huang, H.; Monsuur, F.; Lee, J. Impacts of Variable Message Signs on En-Route Route Choice Behavior. Transp. Res. Part A Policy Pract. 2020, 139, 335–349. [Google Scholar] [CrossRef]
  36. Yamamoto, T.; Kitamura, R.; Fujii, J. Drivers’ Route Choice Behavior: Analysis by Data Mining Algorithms. Transp. Res. Rec. J. Transp. Res. Board 2002, 1807, 59–66. [Google Scholar] [CrossRef]
  37. Davidich, N.; Galkin, A.; Iwan, S.; Kijewska, K.; Chumachenko, I.; Davidich, Y. Monitoring of Urban Freight Flows Distribution Considering the Human Factor. Sustain. Cities Soc. 2021, 75, 103168. [Google Scholar] [CrossRef]
  38. Zimmermann, M.; Mai, T.; Frejinger, E. Bike Route Choice Modeling Using GPS Data without Choice Sets of Paths. Transp. Res. Part C Emerg. Technol. 2017, 75, 183–196. [Google Scholar] [CrossRef]
  39. Stinson, M.A.; Bhat, C.R. Commuter Bicyclist Route Choice: Analysis Using a Stated Preference Survey. Transp. Res. Rec. J. Transp. Res. Board 2003, 1828, 107–115. [Google Scholar] [CrossRef]
  40. Ilkhani, I.; Yazdanpanah, M.; Dehghanbanadaki, A. Effects of Personality Traits and Visual Health on Driver Route-Choice Behaviour in Response to VMS Traffic Information. Transp. Lett. 2022, 1–16. [Google Scholar] [CrossRef]
  41. Vacca, A.; Prato, C.G.; Meloni, I. Should I Stay or Should I Go? Investigating Route Switching Behavior from Revealed Preferences Data. Transportation 2019, 46, 75–93. [Google Scholar] [CrossRef]
  42. Bovy, P.H.L.; Stern, E. Route Choice: Wayfinding in Transport Networks; Springer: Dordrecht, The Netherlands, 1990; Volume 9, ISBN 978-94-010-6772-0. [Google Scholar]
  43. Lai, X.; Fu, H.; Li, J.; Sha, Z. Understanding Drivers’ Route Choice Behaviours in the Urban Network with Machine Learning Models. IET Intell. Transp. Syst. 2019, 13, 427–434. [Google Scholar] [CrossRef]
  44. Eurostat Database—Cities (Urban Audit). Available online: https://ec.europa.eu/eurostat/web/cities/data/database (accessed on 28 December 2022).
  45. THEPTA. Resilient Thessaloniki: A Strategy for 2030; THEPTA Report; THEPTA: Athens, GA, USA, 2020. [Google Scholar]
  46. Tegos, N. Comparative Impact Analysis of Alternative Road Infrastructure Design Solutions. In The Case of Thessaloniki’s Ring Road; University of Thessaly: Volos, Greece, 2011. [Google Scholar]
  47. Atzemi, M. Qualitative Assessment of the Operation of Internal and East Ring Road of Thessaloniki; Aristotle University of Thessaloniki: Thessaloniki, Greece, 2007. [Google Scholar]
  48. Sfyri, C. A Discrete Choice Model for the Elevated Highway of Thessaloniki. In Flyover Thessaloniki; Aristotle University of Thessaloniki: Thessaloniki, Greece, 2021. [Google Scholar]
  49. Washington, S.P.; Karlaftis, M.G.; Mannering, F.L. Statistical and Econometric Methods for Transportation Data Analysis, 2nd ed.; Chapman and Hall/CRC: Boca Raton, FL, USA, 2010; ISBN 9781420082869. [Google Scholar]
  50. IBM SPSS Statistics for Windows; Version 26.0; IBM Corp.: Armonk, NY, USA, 2019.
  51. Myung, I.J. The Importance of Complexity in Model Selection. J. Math. Psychol. 2000, 44, 190–204. [Google Scholar] [CrossRef] [PubMed] [Green Version]
  52. Hu, X.; Chu, L.; Pei, J.; Liu, W.; Bian, J. Model Complexity of Deep Learning: A Survey. arXiv 2021, arXiv:2103.05127. [Google Scholar] [CrossRef]
  53. Lundberg, S.M.; Lee, S.I. A Unified Approach to Interpreting Model Predictions. In Proceedings of the Advances in Neural Information Processing Systems, Long Beach, CA, USA, 4–9 December 2017; Volume 2017. [Google Scholar]
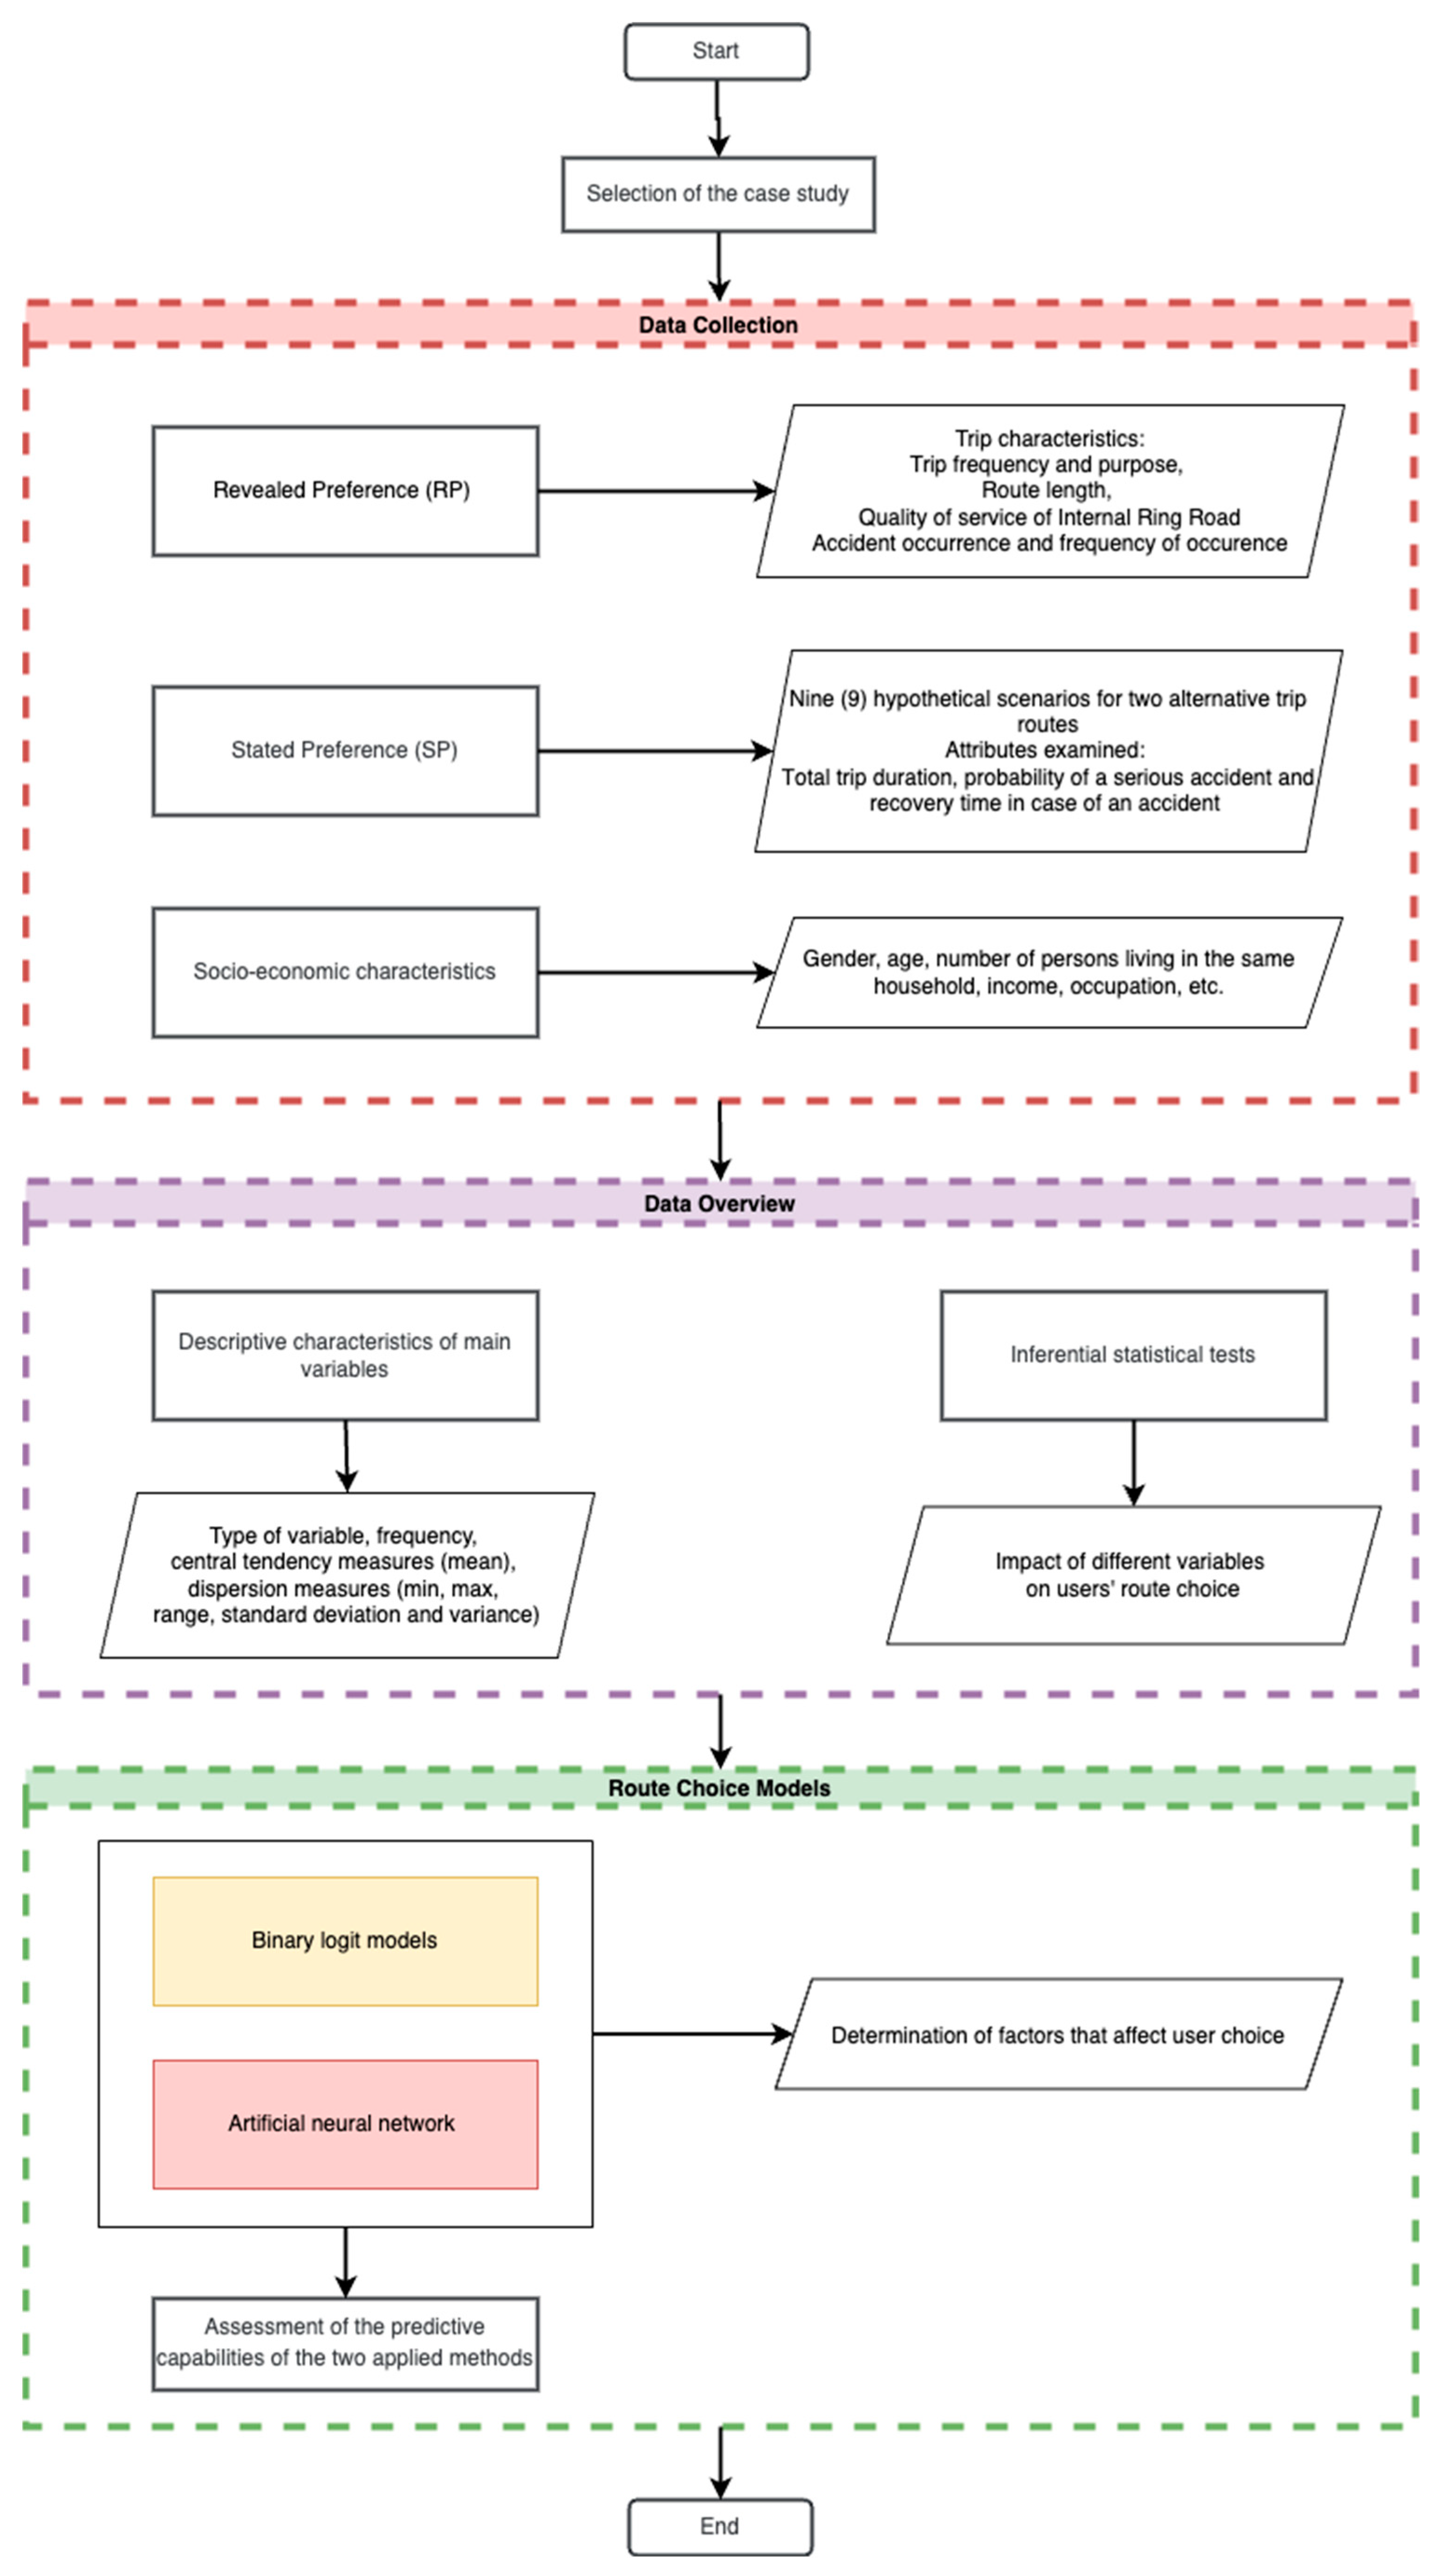
Figure 1. Methodological approach of the research.
Sustainability 15 04614 g001
Figure 2. Map of the existing ring road in Thessaloniki and the flyover.
Sustainability 15 04614 g002
Figure 3. Accuracy for different network architecture combinations (the values inside the brackets refer to the number of trainable parameters per network architecture, while the values inside parentheses refer to the processing time in seconds; the metrics of the chosen network architecture are highlighted in bold).
Sustainability 15 04614 g003
Figure 4. ANN training and validation curves.
Sustainability 15 04614 g004
Figure 5. Distribution of decision probability depending on travel time difference between the examined routes.
Sustainability 15 04614 g005
Figure 6. Distribution of decision probability depending on difference in the probability of accident occurrence between the examined routes.
Sustainability 15 04614 g006
Figure 7. Distribution of decision probability depending on difference in the recovery time in case of an accident between the examined routes.
Sustainability 15 04614 g007
Figure 8. SHAP values for the effect of each independent variable on the choice of the flyover as the preferred travel route.
Sustainability 15 04614 g008
Table 1. Overview of selected recent studies on route choice behavior research.
StudyData
Collection
User
Segments
Network, LocationMethodExamined
Attributes
Dong et al., 2022 [10]Activity-based vehicle data from navigation appAll drivers using navigation appAll roads, South KoreaDeep sequential modelsRoute attributes; travel distance; travel cost;
safety features
Fadilah et al., 2022 [13]Stated preference surveyMotorcycle commutersUrban road segments, IndonesiaBinary and mixed logit choice modelsSocioeconomic characteristics; driving characteristics; traffic flow; travel time
Jensen et al., 2020 [12]Activity-based vehicle data from GPSPrivate car driversAll roads, DenmarkMixed logit choice modelsSocioeconomic characteristics; vehicle-related features; route attributes, etc.
Politis et al., 2020 [9]Revealed and stated preference surveyPrivate car and truck driversTolled and toll-free motorways,
Greece
Binary logit choice modelsSocioeconomic characteristics; travel time; travel cost; type of vehicle; cargo features
Romero et al., 2020 [29]Vehicle loop detectors; license plate recognitionAll driversTolled and toll-free motorways,
Spain
Binary logit choice modelsTravel time; travel cost; travel information; environmental conditions, etc.
Vacca et al., 2019 [41]Activity-based vehicle data from GPSCar usersRoad network of Cagliari, ItalyBinary and mixed logit choice modelsSocioeconomic characteristics; road attributes; travel purpose; travel distance; travel time; congestion etc.
Yao and Bekhor, 2020 [17]Household travel survey and GPS observation dataCar usersRoad network of Tel Aviv, IsraelRandom forest modelsSocioeconomic characteristics; travel purpose; travel distance; route attributes, etc.
Zhao et al., 2020 [35]Stated preference surveyPrivate car and taxi driversUrban road segments, Xi’an, ChinaLogistic regression analysisSocioeconomic characteristics; travel purpose; travel information; driving experience
Table 2. Variables and attribute levels for the SP survey.
AttributesRoute A: Internal Ring RoadRoute B: Flyover
Travel time (min)7912789
Possibility of serious accident (%)246123
Accident recovery time (min)152545204060
Table 3. Descriptive characteristics of main scale variables.
VariableDescriptionMinMaxMeanStandard DeviationVariance
Number_travelersNumber of persons in vehicle1.006.001.630.920.84
Number_peopleNumber of people in the household1.007.002.971.251.57
Number_workersNumber of workers in the household1.007.001.900.730.54
CarsNumber of available cars in the household0.004.001.680.770.59
LoriginTrip length (km) from origin to destination on the Internal Ring Road0.0012.806.284.3518.92
LdestinationTrip length (km) from destination to origin on the Internal Ring Road0.0012.806.054.3418.88
Frequency_accidentAccident occurrence frequency (Internal Ring Road)0.00100.0013.1416.85283.75
Travel_Time_DifferenceTravel time (Internal Ring Road) (−) Travel Time (Flyover) (based on SP attribute levels)−2.00 *5.001.332.878.22
Accident_DifferenceProbability of accident occurrence (Internal Ring Road) (−) Probability of accident occurrence (Flyover) (based on SP attribute levels)−1.00 *5.002.002.456.00
Recovery_Time_DifferenceRecovery time in case of an accident (Internal Ring Road) (−) Recovery time in case of an accident (Flyover) (based on SP attribute levels)−35.00 *5.00−11.6717.00288.96
* In case the difference between the SP attribute levels of the two possible routes (Internal Ring Road (−) Flyover) are examined, negative values indicate that the relative values for the Internal Ring Road are lower than those of the Flyover.
Table 4. Descriptive characteristics of main nominal/ordinal variables.
VariableDescriptionRangeFrequencyType of Variable
YearsYears of use (Internal Ring Road)1: 0–5 years19.30%Ordinal
2: 5–10 years15.30%
3: 10–15 years16.40%
4: >15 years48.90%
FrequencyFrequency of use (Internal Ring Road)1: 5–7 times per week31.80%Ordinal
2: 2–4 times per week23.80%
3: Once per week12.00%
4: Few times per month18.70%
5: Few times per year13.80%
ModeTransport mode used during last trip (Internal Ring Road)1: Car (as a driver)81.60%Nominal
2: Car (as a passenger)12.90%
3: Motorcycle2.00%
4: Bus0.90%
5: Taxi0.20%
6: Light truck2.20%
7: Heavy truck0.20%
Reason_tripTrip purpose of last trip (Internal Ring Road)1: Commuting32.40%Nominal
2: Business purposes21.30%
3: Education 3.10%
4: Recreation28.40%
5: Health/Other7.10%
6: Companion7.60%
Road_timeTravel time assessment for the most recent trip
(Internal Ring Road)
1: Very bad5.10%Ordinal
2: Bad10.20%
3: Neutral34.70%
4: Good38.70%
5: Very good11.30%
Road_costTravel cost assessment for the most recent trip
(Internal Ring Road)
1: Very bad4.20%Ordinal
2: Bad9.60%
3: Neutral41.60%
4: Good28.40%
5: Very good16.20%
Road_safetySafety assessment for the most recent trip
(Internal Ring Road)
1: Very bad29.80%Ordinal
2: Bad38.00%
3: Neutral21.30%
4: Good9.10%
5: Very good1.80%
Road_comfortComfort assessment for the most recent trip
(Internal Ring Road)
1: Very bad15.60%Ordinal
2: Bad30.40%
3: Neutral32.20%
4: Good16.70%
5: Very good5.10%
Road_environmentEnvironmental impact assessment for the most recent trip
(Internal Ring Road)
1: Very bad10.00%Ordinal
2: Bad22.40%
3: Neutral49.80%
4: Good14.20%
5: Very good3.60%
Road_reliabilityReliability assessment for the most recent trip
(Internal Ring Road)
1: Very bad18.20%Ordinal
2: Bad31.60%
3: Neutral35.60%
4: Good12.20%
5: Very good2.40%
Road_infoInformation assessment for the most recent trip
(Internal Ring Road)
1: Very bad30.90%Ordinal
2: Bad33.30%
3: Neutral25.60%
4: Good8.90%
5: Very good1.30%
Road_serviceService assessment (Internal Ring Road)1: Very bad21.10%Ordinal
2: Bad27.60%
3: Neutral36.40%
4: Good12.00%
5: Very good2.90%
AccidentAccident occurrence in a past trip0: No14.90%Nominal
1: Yes85.10%
GenderGender of respondents0: Male66.70%Nominal
1: Female33.30%
AgeAge of respondents1: 18–2417.80%Ordinal
2: 25–3423.80%
3: 35–4427.10%
4: 45–5421.10%
5: 55–658.00%
6: >652.20%
Monthly_incomeMonthly household income of respondents1: <500€3.10%Ordinal
2: 500–1000€15.10%
3: 1001–2000€36.20%
4: 2001–3000€26.00%
5: 3001–4000€6.20%
6: >4000€13.30%
WorkOccupation of respondents1: Employee51.10%Nominal
2: Freelancer27.10%
3: Student15.80%
4: Housekeeping1.80%
5: Retired4.20%
ResidenceResidence in Thessaloniki0: No5.60%Nominal
1: Yes94.40%
ChoiceChoice of users (based on SP responses)0: Existing motorway35.40%Nominal
1: Flyover64.70%
Table 5. Statistical test results (* denotes a variable significant at the 0.05 level).
Dependent VariableIndependent VariableType of TestValueSig.
ChoiceYearsMann–Whitney U−0.480.64
FrequencyMann–Whitney U−1.040.30
ModeChi-squared test7.060.32
Reason_tripChi-squared test6.890.23
Road_timeMann–Whitney U−3.270.01 *
Road_costMann–Whitney U−1.440.15
Road_safetyMann–Whitney U−6.430.00 *
Road_comfortMann–Whitney U−6.580.00 *
Road_environmentMann–Whitney U−1.560.12
Road_reliabilityMann–Whitney U−5.470.00 *
Road_infoMann–Whitney U−3.530.00 *
Road_serviceMann–Whitney U−2.850.00 *
AccidentChi-squared test2.480.12
GenderChi-squared test3.750.05 *
AgeMann–Whitney U−1.140.25
Monthly_incomeMann–Whitney U−1.440.15
WorkChi-squared test14.780.05 *
ResidenceChi-squared test0.360.55
Number_travelersIndependent Samples t Test1.010.90
Number_peopleIndependent Samples t Test4.950.41
Number_workersIndependent Samples t Test2.070.95
CarsIndependent Samples t Test1.240.50
LoriginIndependent Samples t Test1.080.06
LdestinationIndependent Samples t Test0.050.12
Frequency_accidentIndependent Samples t Test10.890.11
Travel_Time_DifferenceIndependent Samples t Test59.420.00 *
Accident_DifferenceIndependent Samples t Test26.450.00 *
Recovery_Time_DifferenceIndependent Samples t Test194.900.00 *
Table 6. Parameter estimates and performance metrics for the binary regression model.
VariableBStd. ErrorSig.exp(B)
intercept0.330.150.031.40
Travel_Time_Difference0.300.020.001.36
Accident_Difference0.490.020.001.63
Recovery_Time_Difference0.050.000.001.05
Length to destination0.040.010.011.04
Safety_assessment_bad−0.650.120.000.52
Safety_assessment_neutral−0.820.140.000.44
Safety_assessment_good−0.890.190.000.41
Safety_assessment_very_good−0.930.430.030.39
Performance metrics
Nagelkerke R Square0.44
Percentage correct (existing motorway)58.70%
Percentage correct (flyover)93.10%
Overall accuracy81.00%
Table 7. ANN performance metrics.
CharacterizationPrecisionRecallF1 ScoreSupport
Choose Existing Motorway0.8790.5850.703212
Choose Flyover0.8020.9550.872374
Overall accuracy82.10%
Disclaimer/Publisher’s Note: The statements, opinions and data contained in all publications are solely those of the individual author(s) and contributor(s) and not of MDPI and/or the editor(s). MDPI and/or the editor(s) disclaim responsibility for any injury to people or property resulting from any ideas, methods, instructions or products referred to in the content.