Abstract
The Saudi Arabia government announced the $500 billion mega project “NEOM City”, to build a cross-border mega city to connect Saudi Arabia, Egypt, and Jordon for attracting foreign investments to the region. NEOM city is situated on the eastern region of the Gulf of Aqaba with its western side in the Sinai Peninsula. The selected site for NEOM city is geographically remarkable; nevertheless, this site needs a detailed geological and geophysical investigation. Sinai Peninsula is a microplate between the Arabian and African plates. Its southern tip is located at a triple junction comprising the Gulf of Aqaba–Dead Sea Transform fault, the Gulf of Suez, and the Red Sea, leading to relatively higher seismic activities in the region. The current study aims to understand the thermal structure of the vicinity of NEOM city to address the potential geohazards and indicate geological attractions within and around the planned city. We use the magnetic data from which geothermal images can be obtained. The preliminary results indicate that there is geologic similarity between the southern part of Sinai Peninsula and the northern part of the Arabian shield. This is because the Gulf of Aqaba separates what was once a continues Neoproterozoic crust. In addition, the magnetic data showed the presence of prominent lineaments on either side of the Gulf of Aqaba. The notable lineaments might represent faults that could still be active. Hence, selecting a site of NEOM city to be east of the Gulf of Aqaba needs to be guided by the careful understanding of the potential hazards. In addition, shallow Curie depths near the Gulf of Aqaba are recognized as a source for renewable geothermal energy.
1. Introduction
The Kingdom of Saudi Arabia announced in 2017 that it will build the first cross-border city of NEOM on the Red Sea coast as a centerpiece for the Kingdom’s economic 2030 vision. In addition to advancing the socioeconomic status of the Kingdom, the Kingdom also aims at attaining leadership statuses in global development. This project will be spanning three countries (Saudi, Egypt, and Jordon) and will run entirely on renewable energy. The word NEOM has two parts, NEO in Greek means future and “M” in Arabic means future “Mustakbal”. NEOM city is expected to serve as an effective drive to environmental conservation; an economic hub for the region and the world at large; a practical laboratory in which the future would be charted through entrepreneurship, stunningly diverse terrain, socially viable climate, and desert recreation; and a general reception for the international community [1].
It is also expected that this mega project, $500 billion, will have an impact on the economy. The location of this city is the east coast of the Gulf of Aqaba, northwestern Saudi Arabia, with the area (26,500 km2) and extent (460 km) along the coastal direction of the Red Sea (Figure 1).
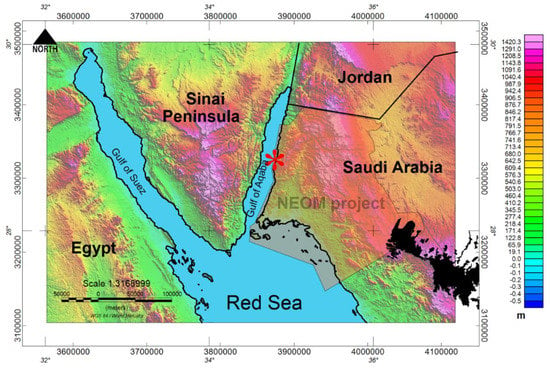
Figure 1.
Location map of the study area. Transparency polygon is NEOM city boundary, filled black polygon is Rahah and Uwayrid volcanic fields, red star shows the location of the 1995 earthquake (Mw = 7.3), background is SRTM.
In 1995, an earthquake of (7.3 Mw) magnitude, and an epicenter of 8 km in depth, occurred in the central Gulf of Aqaba following the Dead Sea Transform (DST) fault. The DST is an active tectonic plate boundary separating the African plate from the Arabian plate, which started 12–18 million years ago. It extends (~1000 Km) from the Northern Red Sea, crossing the Gulf of Aqaba, toward Israel–Palestine, Jordon, Syria, and Lebanon. The seismic data indicate that the DST fault is an active fault in this region. Although a longer inactive period characterizes the region, infrequent and impacting earthquakes have been recorded. An example is the 7.3 Mw earthquake events which was intense in the wake of decades of inactivity, causing wide destruction and the death of about eight persons. A moderate-to-minor series of earthquakes must have been remotely activated at about 500 km, north of the epicenter.
The above-mentioned information indicates that the selected area has some seismic hazards. However, since the 1995 event, there are not any records for large earthquakes in this region. Also, the Saudi seismic station network indicates low-to-moderate seismic activity in that region. This encourages the Saudi government to take on the challenge of building NEOM city along the Gulf of Aqaba coast, taking into consideration any expected future seismic hazards.
Some may think that the location of NEOM city has risk to spend such an amount of money on it, but science and engineering technology can help in building such a city resist earthquakes, like the SabihaGökçen International airport, Turkey; the TransAmerica Pyramids, USA; Burj Khalifa, UAE; Taipei 101, Taiwan; and the Philippine arena, Philippines.
The study area has extensive studies in terms of seismological work [2,3,4]. However, from the geothermal point of view, the current study is considered the first research work to discuss the geothermal energy in NEOM city. Consequently, the current work aims to investigate the area of interest in terms of geothermal resources. The analysis of these data help in mapping the renewable energy resources within the study area.
2. Geology Overview
The study area is located near a complex geological/tectonic system, the Gulf of Aqaba, Sinai Peninsula, Gulf of Suez, Northern Red Sea, and Dead Sea fault. Each has its own tectonic and seismic history. However, in general, it can be stated that NEOM city is located near the Gulf of Aqaba where the Precambrian basement complex is uplifted. Appearing as an elongated and narrow depression of approximately 195 km long, 17 km wide, the Gulf of Aqaba is bordered by elevated mountainous regions basically characterized by Precambrian basement rocks, allowing for absolute narrow coastal areas. The Gulf’s shorelines are restrained by faults and appear near to straight with a sharp slope representative of scarps of the enclosing faults.
Figure 2 shows the general geology map of the NEOM area [3]. It occupies the Midyan Peninsula [5,6]. Ramsay et al. [7] classified the granitic rocks into four groups, Haql, Atiyah, Ifal, and Midyan, and further mentioned the Sawda (nepheline syenite) and Mowasse (alkaline feldspar) quartz syenite complexes. A further addition is made to these designations which includes the Muwaylih suite composed of the tonalitic and dioritic complexes [8], extending from the Al Muwaylih quadrangle, and a complex of changed ultramafic rocks (the Muklar).
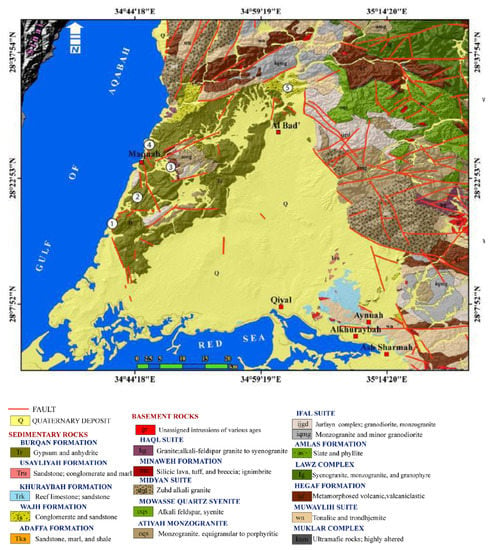
Figure 2.
General geology map of NEOM area. Circles 1–5 show the locations of the geological field surveys (e.g., stereographic projections of faults and the lithostratigraphic rock units [3].
A complex structural development due to extensional tectonics during the Oligocene-Miocene ensued in the Red Sea. This is coupled with a continuous post-Pliocene anticlockwise rotation of the Arabian plate in the direction of the Dead Sea Transform fault, relative to Africa. Depositional analysis results indicate regional structural control of the sedimentary sequences in the Ifal basin. Quaternary faulting extending over a large area and associating activities brought about the uplifting of coral reefs approximately 6–8 m (a. s. l.).
Along the Red Sea margin, the uplift inside the local fault block took place and separated from the later regional uplift. An overlay of the Tayran Group and its associates in the Red Sea happened with a regional evaporitic marker bed [9] and relates to the sea-level falling [10]. A period of swift subsidence and the uplift of the rift flanks (~20.4 Ma) was preceded by the evaporitic deposition [9,10,11,12]. A switch occurred in the rift motion, from a normal to highly oblique extension equidistant to the Dead Sea Transform system. This led to the development of a new plate ~14 Ma. A minor anticlockwise rotation was also recorded in the Sinai region simultaneously, leading to restrictions on the marine connection between the Red and Mediterranean seas [13,14]. The inability of the Red Sea rift to proliferate through the robust lithosphere of the Mediterranean oceanic crust resulted in this change in direction [14].
Ref. [15] suggested that the Gulf of Aqaba separated the Sinai Peninsula from the Arabian shield during the Pleistocene era (Figure 3). An onshore study [16], westward of the Gulf of Aqaba, involving the estimation of the cumulative horizontal slip, achieved a value of 24 km on the faults, including fault structures on the Arabian side of the Gulf. Within the Gulf itself, an about 60 km fault slip was obtained. They pointed out that in NW Arabia and southern Sinai, the sinistral slip postdates intrusions traced to Early Neogene (20–22 Ma) dolerite dikes and NW-SE oriented basalt. The aggregate slips on the faults of the Dead Sea Transform (DST) postdate the period of the opening of the Red Sea and the intrusions of the early Neogene igneous dikes [16].
From the other point of view, prior researchers opined two stages of the slip on the DST, separated by a silent era during the Miocene. These include the Early Miocene [17], the pre-Miocene [18,19] of a 60–67 km slip, and 40–45 km in the Late Pleistocene [17], or the last 7–12 Ma [18,19]. On the Dead Sea fault, the average rate of the sinistral slip is 4.5–4.7 ± 0.2 mm/y, established from GPS observations [20].
On the western side of the Gulf of Aqaba, intermediate to the ends of overstepping left-lateral faults, some pull-apart grabens were formed. Outside the grabens, Phanerozoic sedimentary units down-faulted against Precambrian basement rocks constituting at least three pull-apart grabens existing in the area. The implication is that similar Phanerozoic sedimentary rock units that range in age from Paleozoic to Eocene once covered the basement rocks of the Sinai Massif.
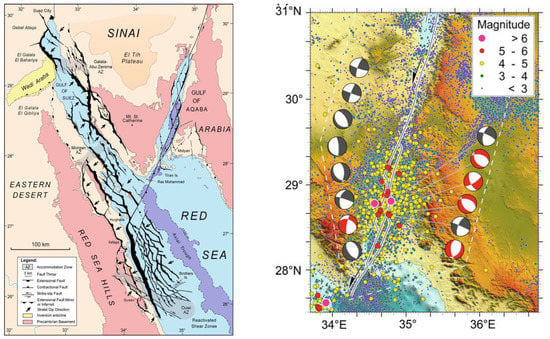
Figure 3.
(Left) Fault models for the Gulf of Suez [21,22], Midyan region of NW Saudi Arabia [9], northern region of the Egyptian Red Sea margin [9], Gulf of Aqaba [2,23,24], and Egyptian offshore Red Sea. (Right) Seismicity of the Gulf of Aqaba. Focal mechanisms are from the CMT catalogue (grey) and Mohamed et al. (2015) (red) (modified after [2]), while sub-basins and principal faults are shown with black lines [25].
3. Seismicity of the Gulf of Aqaba
Dissecting the floors of these pull-apart grabens are active NW-SE-oriented normal faults, as seen from seismic reflection profiles [26]. The DST is made an active fault zone from the continuous drifting of the Arabia away from Africa, coupled with the opening of the Red Sea basin. Other parts of the Transform as well as the seismicity connected to the faults in the Gulf of Aqaba mirror this.
The seismicity in the Gulf of Aqaba and its environs (Figure 3) decreases both to the north and south and concentrates in the central sub-basin [2]. Although the transform is essentially a strike-slip plate boundary, a dip-slip extensional movement is seen at the faulted margins of the gulf along with a footwall uplift. From the measurements of raised Pleistocene coral terraces, the rate of tectonic uplift was estimated as showing a maximum total uplift value of 19 m. This decreases to the north and south and appears adjacent to the central sub-basin.
Evident in the area north of Nuweibaa, starting from the shoulders of the Gulf of Aqaba in the direction of the down-faulted area, gravity sliding of the cretaceous sediments is observed. This leads to the formation of recumbent and overturned folds equidistant to the faults in the Gulf of Aqaba [25]. The sliding of the overlying carbonate rocks was promoted by detachment surfaces in the incompetent upper cretaceous shales.
4. Data and Methods
Magnetic data can be used for various purposes. For example, surface/subsurface faults can be mapped from magnetic data using edge detection filters (e.g., tilt derivative). It is also can be used for further imaging of the subsurface, estimating the Curie depth surface. This surface reflects the depth at which there are no magnetic signatures due to high temperature or it can be called depth to the bottom of magnetic source (e.g., bottom of basement surface or sometimes Moho surface) [27].
Magnetic data are widely used in geological investigations as they provide insights into the subsurface structure. As the study area includes land, coastal, and marine areas, it is difficult to find data from one type of magnetic survey that cover the entire area. [28] collected worldwide various magnetic surveys (e.g., ground, airborne, and marine surveys) and compiled/merged them in one magnetic model called World Digital Magnetic Anomaly Map (WDMAM) (http://wdmam.org/, accessed on 8 February 2023). WAMAM is continuously updated once new data sets from recent surveys become available. WAMAM coverage has a large interval (3 arc second) which is very suitable for regional studies. Satellite magnetic data were used frequently to update WAMAM coverage that increased the data resolution to 2 arc second interval that were used to generate Enhanced Magnetic Anomaly Grid (EMAG). In this research, we utilized EMAG data.
In the current work, we carried out edged detection to see the regional trends and faults from the magnetic data. Then, we estimated the Curie depth surface, in terms of thermal structure, which associated with geological evolution of the study area. Once the Curie depth surface map was estimated, heat flow, geothermal gradient, radiogenic heat production were calculated. Finally, the crustal P-wave velocity was estimated from radiogenic heat production map. All the above-mentioned output is based on magnetic data and reflects the geological evolution of the study area.
Figure 4 shows the magnetic intensity map of the study area. Magnetic values range from −64 to 142 nT. The map shows linear features (e.g., pink color) trending in various directions. However, within the Gulf of Aqaba, negative linear magnetic trend is observed, indicating there may be active displacement on both sides of the Gulf of Aqaba. One can recognize that residual map indicates that southern Sinai Peninsula and eastern portion of Gulf of Aqaba (northern head of the Arabian shield) have a common geological signature, indicating that they came from the same source. It can be stated that Gulf of Aqaba trend separates the northern head of the Arabian shield from southern Sinai Peninsula [15].
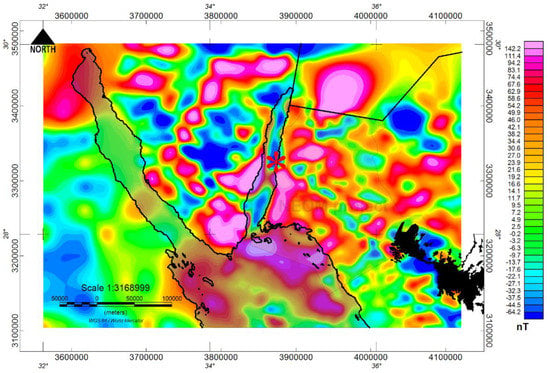
Figure 4.
Magnetic anomaly map for NEOM city region and its surroundings. Red star shows the location of the 1995 earthquake (Mw = 7.3). Filled black polygon is Rahah and Uwayrid volcanic fields.
5. Results and Interpretations
5.1. Edge Detection
Figure 5 shows the output of the TDR technique. The faults/contacts are well-mapped in the Sinai Peninsula as well as the eastern side of the Gulf of Aqaba. We can see some similarity in the ridges or lineaments. The similarity of the edges network on both sides of the Gulf of Aqaba indicates that the area has a history of tectonic movements.
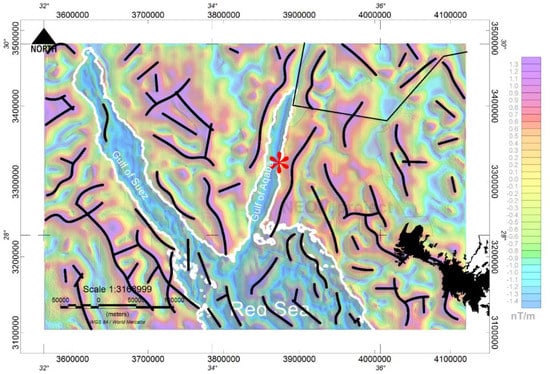
Figure 5.
Tilt derivative map deduced from the magnetic data. Detection faults are in black lines. Red star shows the location of the 1995 earthquake (Mw = 7.3). Filled black polygon is Rahah–Uwayrid volcanic field.
5.2. Curie Depth Map
The Curie temperature is a point at which magnetic minerals lose their magnetization due to high temperature, 580 °C [29,30,31]. To estimate the Curie depth surface (CDS) from the magnetic data, we used the power spectrum method [32]. Many authors have successfully utilized this method [33,34,35,36,37,38,39,40,41].
A reasonable relationship between the depth of a magnetic source and the power spectrum of magnetic anomalies is achieved through this method by transforming the data into the frequency domain. The centroid (Zo) depth and depth to the top (Zt) of the magnetic sources are resolved using Okubo et al. (1985). Then, Zt and Z0 are utilized to estimate the depth to the bottom/Curie depth (Zb) as below:
Zb = 2Z0 − Zt
A single term of Z0, the centroid, is achieved as the hyperbolic sine tends to unity at very long wavelengths. At shorter wavelengths, an estimate of the depth to the top (Zt) can be achieved because the signal from the top of the causative body dominates the spectrum [32,38].
The magnetic data were subdivided into 39 overlapped blocks/windows/grids. Each block/grid is 150 × 120 km. The depth information from the spectrum of a map is guided by ratio = length/2π [41]. A suggestion is given by [42] that the grid dimension should be 100 × 100 km, while [29] recommended a grid dimension 5 times more than the expected Curie depth. Also, a grid size of at least 4 or 6 times the depth of the magnetic sources was suggested by [43].
At each block, the depth to the top (Zt) and depth to centroid (Z0) were estimated using the power spectrum technique by fitting a straight line through the high and low wave-number parts of the power against the frequency using the least-squares method [44]. Then, the depth to bottom or Curie depth (Zb) was calculated using Equation (1).
The results (Table 1) indicate that the average Curie depth is 18 km, the high value is 33 km, and the low value is 10 km (Figure 6). Shallow Curie depths are observed at an area on the eastern and western sides of the Gulf of Aqaba (dashed black polygon in Figure 6a). It can be observed that very shallow Curie depths are located close to the Rahah and Uwayrid volcanic field.

Table 1.
Curie depth estimates for the NEOM study area.
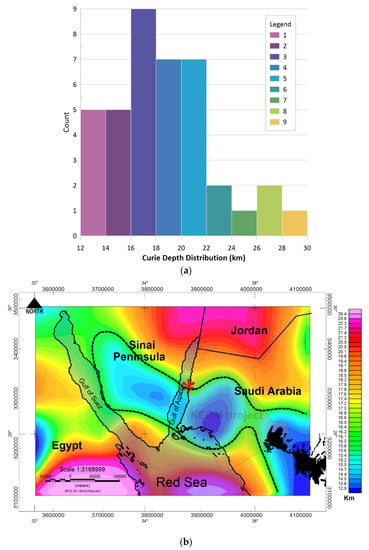
Figure 6.
(a) Curie depths distribution in the study area based on Table 1. (b) Curie depth surface map deduced from magnetic data for NEOM study area. Red star shows the location of the 1995 earthquake (Mw = 7.3). Filled black polygon is Rahah–Uwayrid volcanic field.
5.3. Geothermal Gradient from Curie Depth
The thermal structure establishes a high thermal gradient as suggested by [45]. The geothermal gradient can be estimated from Curie depth values [38,40,46,47] as below:
Figure 7 shows the geothermal gradient calculated map for the study area. It shows a high geothermal gradient anomaly (e.g., dashed black polygon in Figure 7) crossing the Gulf of Aqaba. The highest value of the geothermal gradient is about 44.9 C/km. It can be observed that the Curie depths have a converse association with the geothermal gradient where the shallow Curie depths are associated with an elevated geothermal gradient.
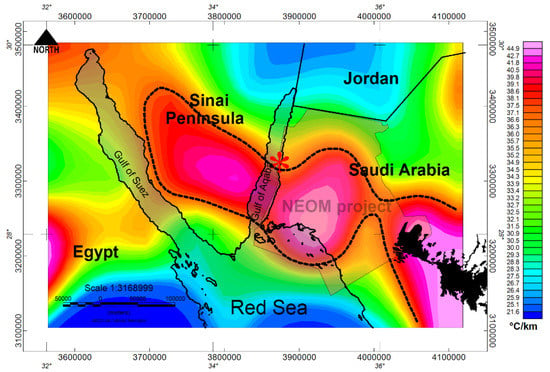
Figure 7.
Geothermal gradient map deduced from the Curie depth estimates for NEOM study area. Red star shows the location of the 1995 earthquake (Mw = 7.3). Filled black polygon is Rahah–Uwayrid volcanic field.
5.4. Heat Flow from Curie Depth
The surface heat flow can be estimated by using the geothermal gradient as below:
where k is the thermal conductivity as a function of depth. The coefficient of the thermal conductivity is assumed as 2.5 and 3.0 W m−1K−1 for the upper crust and between 2.6 and 2.8 W m−1K−1 for the middle crust. By using the above-mentioned equation, the heat flow map of the study area is calculated and displayed in Figure 8. A high heat flow is about 116 mW/m2, located at an area from the Rahah–Uwayrid volcanic field toward the Gulf of Aqaba and Sinai Peninsula. The results highly agree with the heat flow measurements by [26].
Heat Flow (HF) = −K * Geothermal Gradient (GG)
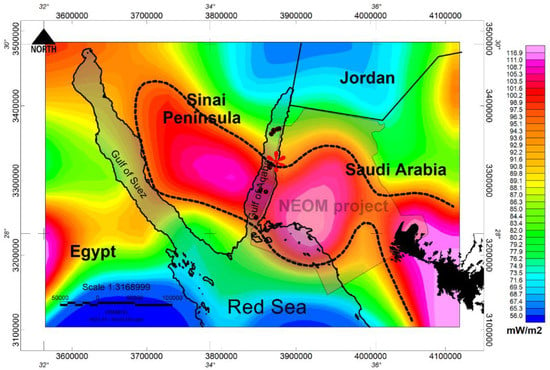
Figure 8.
Heat flow map deduced from the Curie depth estimates. Red star shows the location of the 1995 earthquake (Mw = 7.3). Filled black polygon is Rahah–Uwayrid volcanic field.
5.5. Crustal Radiogenic Heat Production from CPD
The decay of Thorium-232, Uranium-238, Potassium-40, and Uranium-235 is responsible for the majority of the crustal radiogenic heat production within the Earth. Radiogenic heat can be described as the contribution to the surface heat flow. The following equation could be utilized to estimate the crustal radiogenic heat production [48,49]:
Z is the depth, A0 is the radiogenic heat production rate at the Earth’s surface, and D is the radiogenic scaling depth. For each block/window, the radiogenic heat generation (A) was calculated (Table 1) using Equation (3). The surface radiogenic heat production rate coefficient, A0 of 1.5 (µW m−3), and a coefficient D of 10 km [49,50] were assumed.
Figure 9 displays the radiogenic heat production map on account of the upper crust of the study area. The consistency of this figure with previous maps is noticed from a similar large anomaly with high radiogenic heat production (e.g., black dashed polygon in Figure 8) crossing the Gulf of Aqaba.
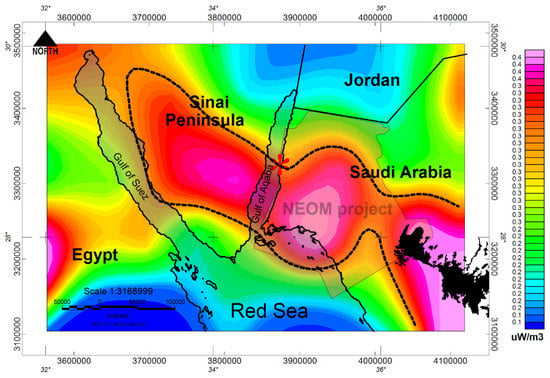
Figure 9.
Radiogenic heat production map deduced from the Curie depth results. Red star shows the location of the 1995 earthquake (Mw = 7.3). Filled black polygon is Rahah–Uwayrid volcanic field.
6. NEOM Geothermal Status
From the previous results, NEOM geothermal maps can extracted and displayed, as in Figure 10 and Figure 11. The highest potential geothermal zones are displayed in Figure 10 as a big anomaly crossing the Gulf of Aqaba.
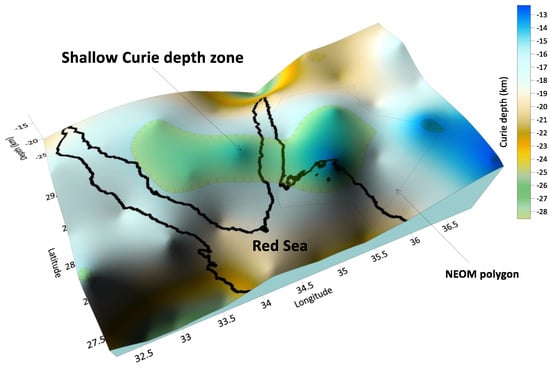
Figure 10.
Curie depth surface in 3D view showing the highly recommend zone for geothermal energy exploration.
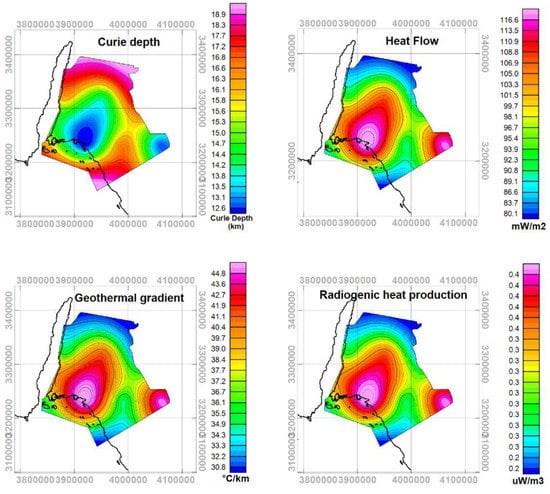
Figure 11.
NEOM thermal maps (Curie depth, heat flow, geothermal gradient, and radiogenic heat production) for NEOM city deduced from magnetic data.
The NEOM geothermal maps are extracted from the above-mentioned maps and displayed in Figure 11. It shows that the middle part of NEOM city can be used for extensive geothermal energy exploration. These resources can be as hot dry rock (e.g., sites where granitic rocks are available) or even as a hot sedimentary basin (e.g., Median basin).
7. Conclusions
The analysis of the magnetic data of NEOM city reveals new results that were not available before this study. The detected faults from the TDR technique deduced from the magnetic data assist the decision makers when selecting areas for development. The Curie depth point estimates assist in a roadmap for geothermal energy resources. On the other hand, the heat production map assists in hot dry rock exploration which is useful for generating electricity from granitic rock with a technology called the Enhanced/Engineering Geothermal System (EGS).
One of the unique results in this study is that it shined a light on the geothermal energy resources around NEOM city which were well matched with the Saudi government’s economic vision. The shallow Curie depth point (11 km) on the eastern side of the Gulf of Aqaba indicates that there is a geothermal reservoir. This reservoir requires more surface and subsurface studies to evaluate the geothermal reservoir. One of the most important studies is magnetotelluric (MT) which images the subsurface conductivity. On the other hand, a more detailed geochemistry study is required to understand the source of the heat.
In general, it can be stated that the magnetic data were used successfully to image the subsurface structure and produced new initial results supporting the idea of renewable geothermal energy within the city of NEOM.
Author Contributions
E.A. (Essam Aboud): building the idea and processing the magnetic data, estimating the Curie depth point; F.A.: roles/writing—original draft; M.A.: investigation, software; E.A. (Ema Abraham): investigation, writing—review and editing; N.E.-M.: resources, writing—review and editing, H.O. review the text and support in geology. All authors have read and agreed to the published version of the manuscript.
Funding
This research work was funded by Institutional Fund Projects under grant no IFPNC-001-145-2020. Therefore, the authors gratefully acknowledge the technical and financial support from the Ministry of Education and King Abdulaziz University, Jeddah, Saudi Arabia.
Institutional Review Board Statement
Not applicable.
Informed Consent Statement
Not applicable.
Data Availability Statement
Data available on request from the corresponding author.
Acknowledgments
The authors would like to thank the teamwork of the Geohazard Research Center at King Abdulaziz University for their help and support in this work.
Conflicts of Interest
The authors declare that they have no known competing financial interests or personal relationships that could have appeared to influence the work reported in this paper.
References
- NEOM Brochure. The Story of NEOM. 2018. Available online: https://www.neom.com/en-us/ (accessed on 1 May 2021).
- Bosworth, W.; Montagna, P.; Pons-Branchu, E.; Rasul, N.; Taviani, M. Seismic Hazards Implications of Uplifted Pleistocene Coral Terraces in the Gulf of Aqaba. Sci. Rep. 2017, 7, 38. [Google Scholar] [CrossRef]
- Kahal, A.Y. Geological assessment of the Neom mega-project area, northwestern Saudi Arabia: An integrated approach. Arab. J. Geosci. 2020, 13, 345. [Google Scholar] [CrossRef]
- Kahal, A.Y.; Abdelrahman, K.; Alfaifi, H.J.; Yahya, M.M.A. Landslide hazard assessment of the Neom promising city, northwestern Saudi Arabia: An integrated approach. J. King Saud Univ. Sci. 2021, 33, 101279. [Google Scholar] [CrossRef]
- Clark, M.D. Explanatory Notes to the Geologic Map of the Al Bad’ Quadrangle, Sheet 28A; Saudi Arabian Deputy Ministry for Mineral Resources Geoscience Map Series GM-81A, C, Scale 1:250,000, with Text; Saudi Arabian Deputy Ministry for Mineral Resources Geoscience: Jeddah, Saudi Arabia, 1986; p. 46.
- Tubbs, R.E.; Fouda, H.G.A.; Afifi, A.M.; Raterman, N.S.; Hughes, G.W.; Fadolalkarem, Y.K. Midyan Peninsula, northern Red Sea, Saudi Arabia: Seismic imaging and regional interpretation. GeoArabia 2014, 19, 165–184. [Google Scholar] [CrossRef]
- Ramsay, C.R.; Drysdall, A.R.; Clark, M.D. Felsic plutonic rocks of the Midyan region, Kingdom of Saudi Arabia—I. Distribution, classification and resource potential. J. Afr. Earth Sci. 1986, 4, 63–77. [Google Scholar] [CrossRef]
- Davies, F.B.; Grainger, D.J. Geologic Map of the Al Muwaylih Quadrangle, Sheet 27A; Saudi Arabian Deputy Ministry for Mineral Resources Geoscience Map GM-82, scale 1:250,000; Saudi Arabian Deputy Ministry for Mineral Resources Geoscience: Jeddah, Saudi Arabia, 1985; 32p.
- Hughes, G.W.; Grainger, D.J.; Abu-Bshait, A.J.; Abdul-Rahman, M.J. Lithostratigraphy and depositional history of part of the Midyan region, northwestern Saudi Arabia. GeoArabia 1999, 4, 503–542. [Google Scholar] [CrossRef]
- Haq, B.U.; Hardenbol, J.A.N.; Vail, P.R. Chronology of fluctuating sea levels since the Triassic. Science 1987, 235, 1156–1167. [Google Scholar] [CrossRef] [PubMed]
- Richardson, M.; Arthur, M.A. The Gulf of Suez—northern Red Sea neogene rift: A quantitive basin analysis. Mar. Pet. Geol. 1988, 5, 247–270. [Google Scholar] [CrossRef]
- Wescott, W.A.; Krebs, W.N.; Dolson, J.C.; Ramzy, M.; Karamat, S.A.; Moustafa, T. Chronostratigraphy, sedimentary facies, and architecture of tectonostratigraphic sequences: An integrated approach to rift basin exploration, Gulf of Suez, Egypt. In Proceedings of the Gulf Coast Section SEPM Foundation 18th Annual Research Conference, Shallow Marine and Nonmarine Reservoirs; Shanley, K.W., Perkins, B.F., Eds.; GCSSEPM: New York, NY, USA, 1997; pp. 377–399. [Google Scholar]
- Bayer, H.J.; Hötzl, H.; Jado, A.R.; Röscher, B.; Voggenreiter, W. Sedimentary and structural evolution of the northwest Arabian Red Sea margin. Tectonophysics 1988, 153, 137–151. [Google Scholar] [CrossRef]
- Bosworth, W.; Huchon, P.; McClay, K. The red sea and gulf of aden basins. J. Afr. Earth Sci. 2005, 43, 334–378. [Google Scholar] [CrossRef]
- Aboulela, H.A.; Aboud, E.; Bantan, R.A. Seismicity and major geologic structures of Tiran and Sanafir islands and their surroundings in the Red Sea. Environ. Earth Sci. 2017, 76, 793. [Google Scholar] [CrossRef]
- Eyal, M.; Bartov, Y.; Shimron, A.E.; Bentor, Y.K. Sinai-Geological Map, Scale 1:500,000; Israeli Geological Survey: Tel Aviv, Israel, 1980.
- Quennell, A. The structure and evolution of the Dead Sea rift. Quat. J. Geol. Soc. 1958, 64, 1–24. [Google Scholar]
- Freund, R.; Zak, I.; Garfunkel, Z.W.I. Age and rate of the sinistral movement along the Dead Sea Rift. Nature 1968, 220, 253–255. [Google Scholar] [CrossRef]
- Freund, R.; Garfunkel, Z.; Zak, I.; Goldberg, M.; Weissbrod, T.; Derin, B.; Bender, F.; Wellings, F.E.; Girdler, R.W. The shear along the Dead Sea rift. Philos. Trans. R. Soc. Lond. A 1970, 267, 107–130. [Google Scholar]
- ArRajehi, A.; McClusky, S.; Reilinger, R.; Daoud, M.; Alchalbi, A.; Ergintav, S.; Gomez, F.; Sholan, J.; Bou-Rabee, F.; Ogubazghi, G.; et al. Geodetic constraints on present-day motion of the Arabian Plate: Implications for Red Sea and Gulf of Aden rifting. Tectonics 2010, 29, TC3011. [Google Scholar] [CrossRef]
- Bosworth, W.; McClay, K. Structural and stratigraphic evolution of the Gulf of Suez rift, Egypt: A synthesis. Mémoires Du Muséum Natl. D’histoire Nat. 2001, 186, 567–606. [Google Scholar]
- Khalil, S.; McClay, K. Structural architecture of the eastern margin of the Gulf of Suez: Field studies and analogue modelling results. In Proceedings of the 14th Exploration & Production Conference, New Orleans, LA, USA, 27–30 September 1998; Volume 1, pp. 210–211. [Google Scholar]
- Ben-Avraham, Z.; Von Herzen, R.P. Heat flow and continental breakup: The Gulf of Elat (Aqaba). J. Geophys. Res. 1987, 92, 1407–1416. [Google Scholar] [CrossRef]
- Ehrhardt, A.; Hübscher, C. The northern Red Sea in transition from rifting to drifting-lessons learned from ocean deeps. In The Red Sea: The Formation, Morphology, Oceanography and Environment of a Young Ocean Basin; Rasul, N.M.A., Stewart, I.C.F., Eds.; Springer: Berlin/Heidelberg, Germany, 2015; pp. 99–121. [Google Scholar]
- Hildebrand, N.; Shirav, M.; Freund, R. Structure of the Western Margin of the Gulf of Elat (Aqaba) in the Wadi EI Quseib-Wadi Haimur Area, Sinai. Isr. J. Earth Sci. 1974, 23, 117–130. [Google Scholar]
- Ben-Avraham, Z.; Zoback, M.D. Transform-normal extension and asymmetric basins: An alternative to pull-apart models. Geology 1992, 20, 423–426. [Google Scholar] [CrossRef]
- Aboud, E.; Alotaibi, M.; Abdulrahman Saud, R. Relationship between Curie isotherm surface and Moho discontinuity in the Arabian shield, Saudi Arabia. J. Asian Earth Sci. 2016, 128, 42–53. [Google Scholar] [CrossRef]
- Maus, S.; Barckhausen, U.; Berkenbosch, H.; Bournas, N.; Brozena, J.; Childers, V.; Dostaler, F.; Fairhead, J.D.; Finn, C.; von Frese, R.R.B.; et al. EMAG2: A 2-arc min resolution EarthMagnetic Anomaly Grid compiled from satellite, airborne, and marine magnetic measurements. Geochem. Geophys. Geosyst. 2009, 10, Q08005. [Google Scholar] [CrossRef]
- Blakely, R.J. Potential Theory in Gravity and Magnetic Applications; Cambridge Press: Cambridge, UK, 1995; p. 441. [Google Scholar]
- Ross, H.E.; Blakely, R.J.; Zoback, M.D. Testing the use of aeromagnetic data for the determination of Curie depth in California. Geophysics 2006, 71, L51–L59. [Google Scholar] [CrossRef]
- Schlinger, C.M. Magnetization of lower crust and interpretation of regional crust anomalies: Example from Lofoten and Vesteralen, Norway. J. Geophys. Res. 1985, 90, 11484–11504. [Google Scholar] [CrossRef]
- Okubo, Y.; Tsu, H.; Ogawa, K. Estimation of Curie point and geothermal structure of island arcs of Japan. Tectonophysics 1989, 159, 279–290. [Google Scholar] [CrossRef]
- Aboud, E.; Salem, A.; Mekkawi, M. Curie depth map for Sinai Peninsula, Egypt deduced from the analysis of magnetic data. Tectonophysics 2011, 506, 46–54. [Google Scholar] [CrossRef]
- Bilim, F.; Akay, T.; Aydemir, A.; Kosaroglu, S. Curie depth, heat flow and radiogenic production deduced from the spectral analysis of the aeromagnetic data for geothermal investigation on the Menderes massif and the Aegean region, western Turkey. Geothermics 2016, 60, 44–57. [Google Scholar] [CrossRef]
- Bilim, F. Investigation of the Galatian volcanic complex in the northern central Turkey using potential field data. Phys. Earth Planet. Inter. 2011, 185, 36–43. [Google Scholar] [CrossRef]
- Espinosa-Cardena, J.M.; Campos-Enriquez, J.O. Curie point depth from spectral analysis of aeromagnetic data from Cerro Prieto geothermal area, baja Califormia, Mexico. J. Volcanol. Geotherm. Res. 2008, 176, 601–609. [Google Scholar] [CrossRef]
- Karastathis, V.K.; Papoulia, J.; Di Fiore, B.; Makris, J.; Tsambas, A.; Stampolidis, A.; Papadopoulos, G.A. Deep structure investigations of the geothermal field of the North Euboean Gulf, Greece, using 3-D local earthquake tomography and Curie point depth analysis. J. Volcanol. Geotherm. Res. 2011, 206, 106–120. [Google Scholar] [CrossRef]
- Okubo, Y.; Graf, R.J.; Hansen, R.O.; Ogawa, K.; Tsu, H. Curie point depths of the island of Kyushu and surrounding areas, Japan. Geophysics 1985, 50, 481–494. [Google Scholar] [CrossRef]
- Obande, G.E.; Lawal, K.M.; Ahmed, L.A. Spectral analysis of aeromagnetic data for geothermal investigation of Wikki Warm Spring, North-east Nigeria. Geothermics 2014, 50, 85–90. [Google Scholar] [CrossRef]
- Tsokas, G.N.; Hansen, R.O.; Fytikas, M. Curie point depth of the island of Crete (Greece). Pure Appl. Geophys. 1998, 152, 747–757. [Google Scholar] [CrossRef]
- Shuey, R.T.; Schellinger, D.K.; Tripp, A.C.; Alley, L.B. Curie depth determination from aeromagnetic spectra. Geophys. J. Roy. Astron. Soc. 1977, 50, 75–101. [Google Scholar] [CrossRef]
- Maus, S.; Gordon, D.; Fairhead, D.J. Curie temperature depth estimation using a self-similar magnetization model. Geophys. J. Int. 1997, 129, 163–168. [Google Scholar] [CrossRef]
- Nwobgo, P.O. Spectral prediction of magnetic source depths from simple numerical models. Comput. Geosci. 1998, 24, 847–852. [Google Scholar]
- Spector, A.; Grant, F.S. Statistical models for interpretation aeromagnetic data. Geophysics 1970, 35, 293–302. [Google Scholar] [CrossRef]
- Okubo, Y.; Uchida, Y.; Taniguchi, M.; Miyakoshi, A.; Safanda, J. Statistical analysis for thermal data in the Japanese islands. Phys. Earth Planet. Inter. 2005, 152, 277–291. [Google Scholar] [CrossRef]
- Ates, A.; Bilim, F.; Buyuksarac, A. Curie point depth investigation of central Anatolia, Turkey. Pure Appl. Geophys. 2005, 162, 357–371. [Google Scholar] [CrossRef]
- Hsieh, H.H.; Chen, C.H.; Lin, P.Y.; Yen, H.Y. Curie point depth from spectral analysis of magnetic data in Taiwan. J. Asian Earth Sci. 2014, 90, 26–33. [Google Scholar] [CrossRef]
- Jaupart, C. On the average amount and vertical distribution of radioactivity in the continental crust. In Thermal Modeling in Sedimentary Basins; Burrus, J., Ed.; Editions Technip: Paris, France, 1986; pp. 33–47. [Google Scholar]
- Lachenbruch, A.H. Preliminary geothermal model of the Sierra Nevada. J. Geophys. Res. 1968, 73, 6977–6989. [Google Scholar] [CrossRef]
- Lachenbruch, A.H. Crustal temperature and heat production: Implication of the linear heat flow relationship. J. Geophys. Res. 1970, 75, 3291–3300. [Google Scholar] [CrossRef]
Disclaimer/Publisher’s Note: The statements, opinions and data contained in all publications are solely those of the individual author(s) and contributor(s) and not of MDPI and/or the editor(s). MDPI and/or the editor(s) disclaim responsibility for any injury to people or property resulting from any ideas, methods, instructions or products referred to in the content. |
© 2023 by the authors. Licensee MDPI, Basel, Switzerland. This article is an open access article distributed under the terms and conditions of the Creative Commons Attribution (CC BY) license (https://creativecommons.org/licenses/by/4.0/).