Abstract
The pollution of aquatic ecosystems is an issue facing many countries all over the world and may result in issues such as eutrophication in coastal zones. Managing this eutrophication is a real challenge. The current study focuses on the investigation and identification of aquatic environmental characteristics, including the sediments, waters, and seaweed, of seven eutrophicated locations along the Mediterranean coast of Alexandria (Egypt). Different ecological risk assessment and bioaccumulation factors were calculated in order to identify the probable pollution source and the degree of the problem, in addition to the accumulation of heavy metals in the seaweed. The characteristics of the seaweed, sediments, and waters were chemically analyzed and heavy metals were measured. The genetically and biochemically identified seaweed species were Ulva compressa, Ulva fasciata, Ulva lactuca and Ulva linzea. The sediments of the El-Tabia location contained the highest concentrations of Cd, Co, Ni, and Pb, because this location receives these elements from the El-Amia drain. The Abu Qir location was found to contain the highest concentrations of the same heavy metals in the studied water samples because it was located much closer to the Abu Qir harbor. Ecological risk assessment indices indicated moderate to high contamination for most of the studied elements and locations. The results of the bioaccumulation factor analysis indicated that the studied seaweed species are accumulators of trace elements. These seaweed species should be further investigated concerning ecotoxicology if they are to be used in the human diet and for other benefits. This study opens many windows of research to be investigated in the future regarding the sustainable management of polluted coastal zones.
1. Introduction
The pollution of coastal zones is a significant concern worldwide, including the coasts of the Mediterranean basin [1,2]. The coastal zones of the city of Alexandria, Egypt, which is at a latitude of 31°13′ to 31°19′ N and a longitude of 29°55′ to 30°04′ E, lie in the southeastern Mediterranean Sea and have more than 35 beaches with a length of 24 km [3]. The coastal zone of this city suffers from many sources of pollution, as reported by several researchers; these include organic pollutants [1], radionuclides [4], heavy metals [5] and municipal wastewater sludge [6]. Marine sediments serve as a source and sink of trace elements, influencing their concentrations and distribution patterns in the water column; this is based on local bottom conditions, sediment re-suspension activity, and local biogeochemical cycling regimes in the sediment [7]. Generally, the initial concentrations of trace elements in water sources do not represent a hazard to aquatic creatures. However, the concentration of trace elements in marine waterways is rising as a result of effluents discharged by human industrial and agricultural production operations [8]. Monitoring trace elements in the environment is crucial due to their potential harm to human health [9,10]. Thus, several indices may be employed as indicators to monitor the natural variation in soil and sediment composition, the possibility of human-source pollution, and the toxicological health concerns that are related to soil and sediment pollution [11]. Contaminated seawater can pose health concerns to humans through skin absorption during recreation or the ingestion of contaminated seafood, which might expose individuals to metal contamination, among other issues [12]. As a result, addressing the health hazards posed by metals in saltwater is critical [13].
Eutrophication, particularly due to nitrogen and phosphorus, is a common phenomenon in several coastal zones in many countries such as China [14,15], Brazil [16], Fuji [17], Italy [18], Japan [19], Côte d’Ivoire [20], Vietnam [21], and Egypt [22]. This phenomenon occurs in Alexandria (Egypt) because of pollution that enhances phytoplanktonic biomass, especially marine algal blooms, which are good indicators of eutrophication [23]. The eutrophication of aquatic ecosystems causes anoxia [14,24]. Macroalgal blooms are linked to coastal eutrophication and are becoming increasingly common across the globe [25].
These green tides are a specific marine environmental issue, and often involve sea lettuce (Ulva spp.). Common Ulva species include Ulva lactuca, U. armoricana, U. rigida, U. prolifera, U. pertusa, U. fasciata and U. rotundata [26]. Green tides occur seasonally because of anthropogenic eutrophication and are thought to have increased since the 1970s [27]. Many strategies have been investigated to manage eutrophication, such as reducing phosphorus input [28], estimating nutrient thresholds [29], monitoring water temperature [30], and reducing the abundance of Cyanophyta [31].
Macroalgae or seaweeds include green algae (Chlorophyta), brown algae (Phaeophyta) and red algae (Rhodophyta). These kinds of seaweed produce several bioactive compounds, which are mainly used as biofertilizers, animal feed, and human foods [32]. Macroalgae are also considered biomonitoring agents due to their limited mobility, significant biomass, simple identification, long life, availability, and their capacity to collect metals [33]. Green macroalgae or green seaweeds are an important source of food for millions of people [33]. They are rich in bioactive compounds such as proteins (9.13–25.1%), carbohydrates (31.97–56.07%), lipids (3.1–10.1%), ashes (53%), amino acids, phytohormones such as auxins, gibberellins, cytokinins and abscisic acid, and antimicrobial compounds and minerals such as nitrogen, phosphorus, and potassium [34]. Seaweeds and seaweed-based products can be raised in aquaculture [35] for food and feed [36], biofuels [37,38], cosmetics, dyes, and therapeutic applications [39]. Biofertilizers derived from seaweeds have been used in agriculture to improve soil management, water efficiency, nutritional strategies, and drought tolerance [40,41]. Thus, the key characteristics of seaweed, such as metal biosorption and bioaccumulation, have drawn the attention of international authorities such as the European Food Safety Authority (EFSA) and the United States Environmental Protection Agency (USEPA) [33].
Therefore, this study focuses on the assessment of the bioaccumulation of heavy metals in sea lettuce (Ulva spp.) along the coast of Alexandria, Egypt. Ecological risk assessment was also evaluated for such metals in the coastal zone. The ultimate goal was to provide information that is important to the sustainable management of this vital area.
2. Materials and Methods
2.1. Selected Sites and Sampling
The Alexandria shoreline stretches for about 35 km along Egypt’s Mediterranean coast. The shoreline is characterized by natural rock outcroppings that stretch along the coastline, inland, and into the water, separated by long sandy beaches. Sea lettuce (Ulva spp.) was collected along with seawater and sediments from seven sites on the Alexandria coast that had a large amount of sea lettuce and were separated by approximately 5 km each (Figure 1): El-Tabia (L1), Abu Qir (L2), El-Mandara (L3), Sidi Bishr (L4), Roshdy (L5), El-Raml Station (L6) and Qaitbay Castle (L7) (Table 1 and Figure 2). A graphical summary of this study, including all measurements and analyses, is presented in Figure 3.
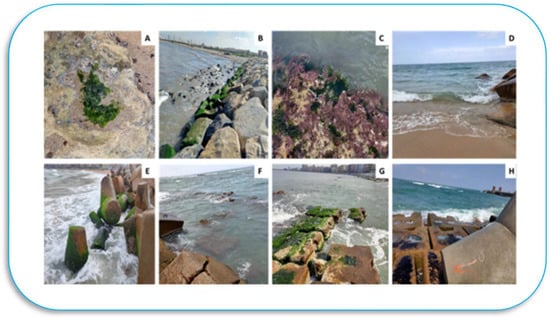
Figure 1.
A general view of sea lettuce (Ulva spp.) and the locations that were selected for the sampling of seaweed, water and sediments: (A) Ulva spp, (B) EL-Tabia (L1), (C) Abu Qir (L2), (D) El-Mandra (L3), (E) Sidi Bishr (L4), (F) Roshdy (L5), (G) El-Raml Station (L6) and (H) Qaitbay Castle (L7).

Table 1.
Descriptions of the selected sampling locations.
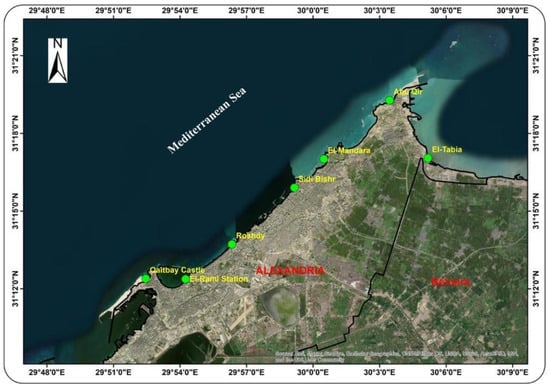
Figure 2.
A map showing the locations selected for sampling and study near Alexandria, Egypt.
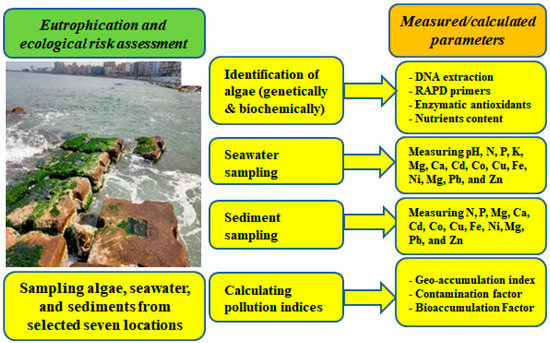
Figure 3.
An overview of the current study, including the sampling of seaweed, seawater, and sediment, the measurements made, and calculated indices for each type of sample.
In total, 63 samples of each seaweed (Ulva spp.), seawater, and sediment (7 locations × 3 samples × 3 replicates) were randomly collected during October 2020. All samples were collected in one day under similar weather and environmental conditions: smooth sea, sunny with no wind, and no recent rain. Benthic sediment samples were collected from each location at a depth of around 50 cm from the water or seaweed surface. Seaweed was collected from an area of 10–20 m2 from each location. All seaweed thalli were carefully washed to remove rock debris, sand, and epiphytes using seawater. Seaweed, sediment, and seawater samples were sorted and transported separately in plastic bags on ice to the laboratory. Using a plastic grab device, surficial sediment samples were collected from the upper 0–20 cm, removing non-sediment objects and stones by hand. They were then placed into polyethylene bags. The collected sediment samples were dried and homogenized at room temperature and then stored at −20 °C until analysis. About 2 L of water sample was collected from each location in triplicate. The water samples were taken from the top of the water surface down to 50 cm in plastic bottles. The seaweed collected from each location was sun dried, cut into 1–3 mm particles using a knife, washed with distilled water, filtered, and dried overnight at 60 °C to prepare the samples for analyses.
2.2. Seaweed Analyses
Dried seaweed was crushed into a powder and digested using a mixture of sulfuric, nitric, and perchloric acids (2:2:1) [42]. The digested material was brought to a volume of 50 mL with distilled water. A blank sample was made using the mixture of acids only without seaweed, in order to offer a chemical background. Atomic Absorption (Perkin Elmer pin AAcle 500, Waltham, MA, USA) was used to determine the types and amounts of trace elements in the extract.
Total phosphorus was determined using a modified version of the John method [43]. First, 0.1 mL of clear digestate was diluted with 9 mL of distilled water. Two drops of a 0.1% solution of the indicator (2,4 dinitrophenol) were added, followed by the addition of 5 M NaOH drop by drop until the solution turned yellow. Next, 2 M HCl was added drop by drop until the solution became colorless. Then, 1 mL of the combined reagents was added, and the solution was gently shaken. The absorbance was measured at 710 nm after 30 min. The mixed reagent was prepared by mixing antimony molybdate acid and recently prepared 2.5% ascorbic acid in a 4:1 ratio. The mixture was stabilized for 1 day. The antimony molybdate acid was prepared by dissolving 0.75 g of (NH4)6Mo7O24·4H2O and 0.014 g of antimony potassium tartrate in 50 mL of distilled water. Then, 8.8 mL of concentrated H2SO4 was added, and the solution was cooled. The volume was adjusted to 100 mL with distilled water, and the solution was stored in a dark-colored glass bottle.
The phosphorus concentrations were estimated considering a standard curve in the 0–5 µg range of phosphorus. Dried samples were used to determine the total nitrogen using the Kjeldahl technique. The samples were weighed and transported to Kjeldahl digestion flasks that contained 7.00–10.0 g of a catalyst made from a mixture of K2SO4 (9 g), in addition to CuSO4.5H2O (1 g) and 25 mL of concentrated H2SO4. Following the digestion, the distillation occurred in the Kjeldahl distillation unit by adding more baser, followed by the boiling and condensation of the NH3 gas in a receiving solution of 5% H3BO3 that contained methyl red and methylene blue indicators. It was then titrated with 0.1 N HCl. The nitrogen (%) was calculated on a dry matter basis [44].
2.3. Water Analyses
Seawater samples were filtered and the pH of the untreated samples was measured using a pH meter (JENWAY 3510, Staffordshire, UK) in the laboratory. Then, 1 L of seawater was acidified using 2% HNO3 at 60 °C, and it was then concentrated to 50 mL to measure the elemental contents by Graphite Furnace Atomic Absorption Spectrometry (GBC Avanta E, Victoria, Australia) according to APHA [45]. Levels of N, P, K, Mg, Ca, Cu, Co, Cd, Fe, Ni, Mg, Pb, and Zn were determined in the clear extract using Atomic Absorption (Perkin Elmer pin AAcle 500, USA).
2.4. Sediment Analyses
Dried sediment samples were digested in a mixture of nitric, sulfuric, and perchloric acid (2:2:1) [42]. After digestion, the samples were cooled and the extract was brought to a volume of 50 mL with distilled water. A blank sample was made using the mixture of acids with no sediment digestion to provide a chemical background. The levels of Mg, Ca and trace elements were determined in the clear extract using Atomic Absorption (Perkin Elmer pin AAcle 500, USA). The N content of the sediments was measured using the Kjeldahl method [46], and a spectrophotometer (Double beam UV/Visible Spectrophotometer Libra S80PC, Cambridge, England) was used to measure P [47].
2.5. Calculation of Pollution Indices
Two pollution indices were calculated to evaluate sediment contamination at the study sites, the geo-accumulation index (Igeo) and the enrichment factor (EF). To compare the level of elements in the studied sediments with the mean background contents (MBC) (mg kg−1), the ecological risk was assessed, as suggested by Kabata-Pendias [48]. A comparison of the common pollution indices and what they measure is given in Brevik et al. [49]. It is important to use pollution indices as the absolute value of trace elements does not necessarily indicate the human health threat posed by them [9].
2.5.1. The Geo-Accumulation Index
The geo-accumulation index is utilized to assess the contamination level in soil or sediment [50]. It compares present and predicted pre-industrial concentrations using Equation (1):
where C is the concentration of trace elements n in the sediment, B is the content of trace elements in the geochemical background, and 1.5 is a constant that allows the analysis of fluctuations in the trace element content due to natural processes. The outcomes are divided into 7 classes (0, 1, 2, 3, 4, 5, and 6) as follows:
Igeo = log2 [C/1.5B]
- Class 0 = Igeo ≤ 0 is uncontaminated;
- Class 1 = 0 < Igeo ≤ 1 is uncontaminated to moderately contaminated;
- Class 2 = 1 < Igeo ≤ 2 is moderately contaminated;
- Class 3 = 2 < Igeo ≤ 3 is moderately to heavily contaminated;
- Class 4 = 3 < Igeo ≤ 4 is heavily contaminated;
- Class 5 = 4 < Igeo ≤ 5 is heavily to extremely contaminated; and
- Class 6 = Igeo > 5 is extremely contaminated [11,51].
2.5.2. Contamination Factor
The contamination factor is a one-element index that defines the degree of pollution of a given toxic material in the ecosystem [52] using Equation (2):
where Csample is the current trace elements content in the sediment and Cbackground is background concentration. The contamination factor is categorized into the following: CF < 1 indicates a small amount of contamination; 1 ≤ CF< 3 refers to medium contamination; 3 ≤ CF < 6 is significant contamination; and CF ≥ 6 is very high contamination.
CF = Csample/Cbackground
2.6. Bioaccumulation Factor (BAF)
The BAF was evaluated to show how effective the seaweed or algae was at accumulating trace elements from the sediment or seawater using Equation (3) [53]:
where Calgae= trace element concentrations in algae or seaweed tissues (mg kg−1) and Csediment and Cseawater are trace element concentrations in sediment and seawater, respectively (mg L−1).
BAF = Calgae/Csediment or Calgae/Cseawater
2.7. DNA Extraction
To extract algal DNA from the samples that were frozen at −20 °C, a 150 mg sample was ground in liquid nitrogen using a mortar and pestle. The DNA was isolated using the Cetyl-trimethyl ammonium bromide method [54], and the concentrations were determined using a Nanodrop spectrophotometer (Implen, Westlake Village, CA, USA).
2.8. PCR and Gel Electrophoresis
A polymerase chain reaction (PCR) was performed with six decamer random amplified polymorphic DNA (RAPD) primers. PCRs were performed in the presence of 1X Taq DNA polymerase buffer (i.e., 10 mM Tris-HCl at pH 8.3, 50 mM KCl and 1.5 mM MgCl2), 100 μM dNTPs, 10 picomole of a random primer, 25 ng DNA template, and a half unit of Taq DNA polymerase in a whole volume of 25 μL. PCR was carried out in an automated thermal cycler (MJ-Mini, Bio-Rad, Hercules, CA, USA). The first step was performed at 95 °C for 4 min, then 35 cycles were performed at 94 °C for 1 min., at 36 °C for 30 s and at 72 °C for 3 min for denaturation, annealing, and polymerization, respectively, followed by a final expansion step at 72 °C for 7 min. The products of amplification were separated on 1.5% agarose gel in a 0.5 × TBE buffer versus molecular size standard 1 Kbp ladder. Gels were visualized under UV light and depicted by the gel documentation system (UVITEC, Cambridge, UK).
2.9. Quantification of Antioxidant Enzymatic Activities
The activities of antioxidant enzymes, including catalase, peroxides, and polyphenol oxidase were measured in the algal samples. Catalase (CAT; EC 1.11.1.6) activity was determined using H2O2 at 240 nm [55]. The reaction combination (1 mL overall) included 20 mg total protein, 50 mM sodium phosphate buffer (pH 7.0) and 10 mM H2O2. For each measure, the blank paralleled the absorbance of the combination at time zero, and the real reading paralleled the absorbance that was measured after 1 min. One unit of CAT activity was described as a 0.01 decrease in absorbance at 240 nm/mg of protein/min. Peroxidase (POX; EC 1.11.1.7) activity was determined based on the procedure described by Hammerschmidt et al. [56], and polyphenol oxidase (PPO; EC 1.10.3.1) activity was determined according to Malik and Singh [57].
2.10. Quality Control and Quality Assurance
All blanks, measurements, triplicate trace element measurements in extracts, and certified reference materials for each studied element were included for quality control, and uncertainty was calculated. All the equipment was calibrated according to the manufacturer’s specifications. Internal and external quality assurance systems were applied according to the requirements of ISO/IEC 17025-2017 [58]. Certified reference materials obtained from Phenova Certified Reference Materials (Torrance, CA, USA; WS0718; September 2018) were used for quality control to calculate the analyses’ efficiencies. The recovery was between 92% and 103% depending on the studied element, whereas the average relative standard deviation (RSD) was less than 5%. The standard deviation (SD) of the measurements was above 5% in a few cases. These values were not included in the statistical analyses. The detection limits obtained for Cd, Co, Cu, Fe, Ni, Pb and Zn were 0.02, 0.05, 0.04, 0.06, 0.04, 0.05, and 0.04 mg L−1, respectively.
2.11. Statistical Analyses
The means and analysis of variance were calculated using Costat Version 6.311 statistical software [59]. The means were separated by least significant difference (LSD) and Duncan’s multiple range tests, and significance was determined at p ≤ 0.01.
Amplification profiles were generated using the RAPD primers and recorded as 1 or 0 for the presence or absence, respectively, of a band of a specific molecular size, in order to produce a binary matrix that was subjected to cluster analysis. The similarity matrix was assessed by Jaccard’s genetic similarity index [60]. A dendrogram was produced by cluster analysis using the arithmetic averages (UPGMA) by the un-weighed pair group technique. The PAST statistics software version 2.17 package was utilized to analyze the data [61].
3. Results
3.1. Ulva and Pollution
3.1.1. Chemical Analyses of Ulva spp.
All seaweed samples varied in their content (in mg kg−1) of K (7670–20,820), Mg (14,000–17,820), P (2960–5810), N (860–3360), Ca (400–33,330), Cu (7.7–26.7), Fe (533–4437), and Zn (14.2–19.5) in all locations (Table 2). The Mg content was the highest element tested in all the algal samples from all locations. When comparing locations, the algal samples from L1 had the highest P and Fe contents, whereas the samples from L3 contained the highest N and Mg. The highest K content was recorded at L7. The trace elements concentrations varied significantly among the locations. Pb and Ni showed the highest trace elements concentrations (28.6–35.8 and 23.9–33.8 mg kg−1, respectively) in the samples from all locations compared to the other trace elements. The highest significant mean concentrations of Co, Ni and Pb were 20.9, 33.8, and 35.8 mg kg−1, respectively, at L3. The highest significant mean concentrations of Fe, Cu and Zn were 4437, 26.7, and 19.5 mg kg−1, respectively, at L1. The highest mean concentration of Cd was 12.8 mg kg−1 at L5.
Table 2.
The mean concentrations of major elements and heavy metals (mg kg−1) in seaweed (Ulva spp.) samples collected near Alexandria, Egypt.
3.1.2. Antioxidant Enzymes Activity of Ulva spp.
The activities of some antioxidant enzymes were measured for the seaweed samples at each location (Figure 4). These antioxidants were catalase (CAT), peroxidase (POX) and polyphenol oxidase (PPO). The samples from L4 had the highest activities of all antioxidant enzymes studied, followed by the samples from L1, and the algal samples from L3 had the lowest values of CAT and POX. The CAT and POX enzyme activity decreased in samples from L4 toward the L7 location. The activities of the antioxidant enzymes studied reflected the degree of pollution at these sites. These findings indicate that L4 was associated with the highest level of human activity near Alexandria. Based on the values of antioxidant activities, the sites were ordered as follows: L4 ˃ L1 ˃ L5 ˃ L7 ˃ L2 ˃ L6 ˃ L3.
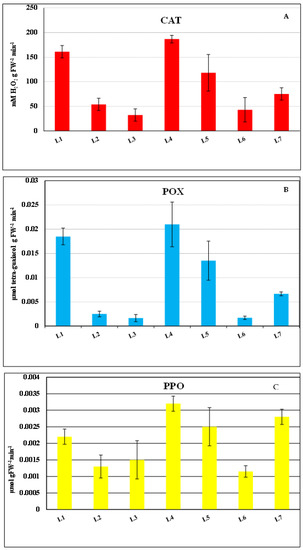
Figure 4.
Antioxidant enzyme activities of Ulva spp., including (A) catalase (CAT), (B) peroxidase (POX) and (C) polyphenol oxidase (PPO) for the study locations. All location (L1 to L7) details can be found in Table 1.
3.1.3. Genetic Diversity of Ulva spp.
Six RAPD primers were used for four populations of Ulva spp. from the studied costal locations (Table 3). The RAPD primers effectively created scoreable and instructive bands. The RAPD profiles of the magnified products are presented in Figure 5. Various banding shapes were formed from various primers. The level of polymorphism was 100% with all the investigated primers except OPF08, which had 90% polymorphism through all examined Ulva populations. Primer OPD12 yielded the most bands (12) while primers OPC04, OPF08, and OPV02 amplified the fewest (9). The highest similarity value (0.43) was recorded for the L1 and L2 populations, while the lowest value (0.06) was recorded for L7 populations. Similarity coefficient matrices were utilized to make a dendrogram of the four Ulva spp. studied, according to UPGMA analysis (Figure 6).
Table 3.
The sequence of the RAPD primers used in this study.
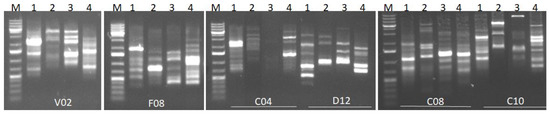
Figure 5.
Agarose gel electrophoresis of RAPD profiles for the Ulva spp. seaweed. (M): 100 bp DNA ladder, 1–4 represents Ulva spp. collected from Qaitbay Castle, El Tabia, Sidi Bishr and Abu Qir coastal regions, respectively. V02, F08, C04, D12, C08, and C10 refer to primer numbers.
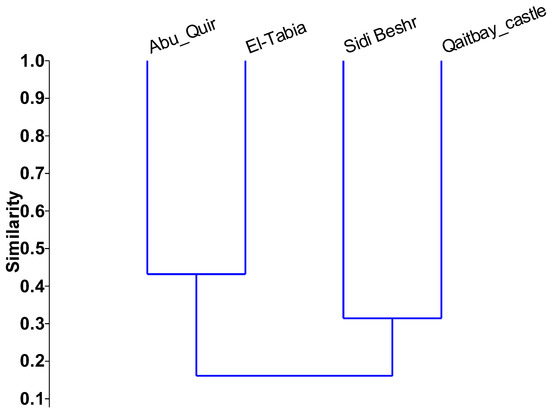
Figure 6.
Randomly amplified polymorphic DNA-based phylogenetic tree and clustering analysis among four Ulva spp. collected from selected coastal locations using the unweighted pair group method.
3.2. Chemical Characterization of Seawater
The seawater samples significantly varied in their characteristics among the different locations (Table 4). In general, Sidi Bishr (L4) had the highest concentrations of both K (1031 mg L−1) and Mg (384 mg L−1), whereas Abu Qir had the highest concentrations of trace elements such as Pb (4.11 mg L−1), Ni (3.81 mg L−1), Co (2.38 mg L−1), and Cd (0.507 mg L−1). The chemical analysis of seawater showed that all locations had high concentrations of trace elements compared to the normal level of these elements in seawater. The concentrations of trace elements in aquatic compartments such as sediments reflect either anthropogenic impacts or the chemical composition of the bedrock. The pH values were 7.18, 7.88, 7.93, 7.92, 7.74, 7.68, and 7.84 in the studied locations, respectively.
Table 4.
Concentration of elements in seawater (mg L−1) collected from different locations near Alexandria, Egypt.
3.3. Chemical Properties of Sediments
The chemical composition of sediment samples varied significantly among the locations (Table 5). The sediment samples ranged (in mg kg−1) from 5660–7250, 338–1585, 4223–11,546, 80–1280, 1.2–13.5, 1000–9656, and 78.1–149.5 for N, P, Mg, Ca, Cu, Fe, and Zn, respectively. The differences between the concentrations of the various metals were highly significant (p ≤ 0.01).
Table 5.
The content of studied elements in sediments (mg kg−1) from locations near Alexandria, Egypt.
3.4. Ecological Risk Assessment
Two selected pollution indices (CF and Igeo) were calculated to evaluate sediment contamination as part of the ecological risk assessment (Table 6). All sites had low Cu, Fe, and Zn contamination based on the CF values (i.e., CF = 1 ≤ CF < 3), while they were very highly contaminated by the other metals studied (i.e., CF ≥ 6). The values of the bioaccumulation factor (BAF) were calculated using both sediments and seawater, and are shown in Table 7. The BAF values were higher than 1 at all sites for all metals, except Cu at L6 and Fe at 4 locations. This indicated that the algae accumulated these metals in their tissues at most of the study sites and were classified as metal accumulators. Geo-accumulation (Igeo) index values were extremely high and showed polluted conditions for Cd at all locations, whereas Fe and Zn values for this index indicated uncontaminated to moderately contaminated conditions. All locations had Igeo index values that ranged between 1 and 2 for Pb, whereas the values were between 2 and 3 for Co.
Table 6.
Contamination factor (CF) and geo-accumulation index (Igeo) of the studied trace elements.
Table 7.
Bioaccumulation factor (BAF) based on seawater or sediment for the studied trace elements by location.
3.5. Principal Component Analysis (PCA) and Correlation
The PCA showed two principal components (Figure 7), PCA1 and PCA2, which accounted for 74.81 and 12.51% of the whole variance in the data matrix, respectively. The estimated Kaiser–Meyer–Olkin Measure (KMO) value was 0.70 and the Bartlett’s level of significance was <0.01, indicating the general suitability of the data for PCA. This suggested that all elements were included in PCA1 except N, which was included in PCA2. PCA1 was heavy with the positive loading of Zn, Co, Pb and Ni, which indicates that these metals have similar sources. This result is supported by the results of the strong relationships among these metals, demonstrated by the correlation analysis (Table 8). PCA2 included only N, indicating that N in this area has a different source to the other elements studied. The correlation between the studied heavy metals was significantly higher than 96% (R2) for Co, Pb, Ni, Mg, and Zn.
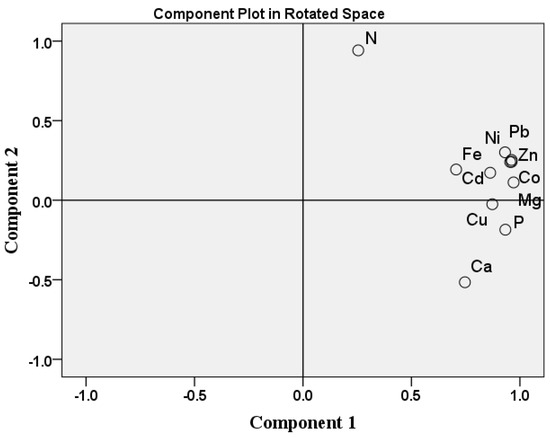
Figure 7.
The principal component analysis loading plot for the studied elements.
Table 8.
Pearson’s correlation coefficients for the studied metals and elements.
4. Discussion
Several coastal zones all over the world suffer from the effects of intensive human activities, which lead to the pollution of these aquatic environments. In the current study, the coastal zone along Alexandria, Egypt, was selected as a case study of a eutrophicated area due to human activities. To evaluate the environmental effects of human activity, samples of seawater, seaweed from the genus Ulva, and sediments were collected from seven locations along the Alexandria coastal zone.
4.1. Seaweed and Eutrophication in Selected Locations
The chemical properties of seaweed showed that all locations had high concentrations of trace elements compared to the typical values reported in the literature. This finding means that the seaweed species is a hyperaccumulator of the studied heavy metals and, therefore, of important bioindicators for eutrophicated locations. The reason for the high heavy metal values may be due to the intensive human activities in these coastal zones, which provide many sources of pollution; this includes untreated sewage, oil spillage, oil transport, and industrial wastewater [62]. The populations were separated into two marked clusters by the unweighted pair group method. The first was comprised of the L1 and L2 populations, while the second cluster consisted of the L4 and L7 populations. According to their morphological characteristics, the four Ulva populations collected from L1, L2, L4 and L7 were U. lactuca, U. compressa, U. fasciata and U. linzea, respectively. These results clearly indicate that U. lactuca was phylogenetically close to the species U. compressa. The phylogenetic relationship indicated by the dendrogram in Figure 7 agreed with the results obtained by Guidone et al. [63] and Ismail and Mohamed [64]. The distribution of green macroalgae, such as the Ulva spp., in coastal zones worldwide is presented in Table 9. The green tides composed of green macroalgae have been observed at multiple locations worldwide. These green tides are considered bioindicators of pollution, and different mitigation strategies have been applied to overcome this global problem. Eutrophication mitigation strategies should include controlling nutrient loads and organic matter, as well as the restoration of ecosystems so that they can function in a sustainable way [65]. These strategies should be investigated for absolute environmental sustainability assessments [66].
Table 9.
Distribution of green macroalgae of the genus Ulva at eutrophicated coasts worldwide.
4.2. Seawater Eutrophication in Selected Locations
Nutrients (i.e., N, P, Fe, Mg, etc.) are commonly abundant in the coastal zone. These nutrients and their concentrations depend on the source and level of input. Human activities may also introduce pollutants, including heavy metals and nutrient overloads, into coastal waters and sediments. In the current study, all metals were found in high concentrations in seaweed, seawater, and sediment according to the expected background concentrations reported by Kabata-Pendias and Mukherjee [81] and Kabata-Pendias [48]. These findings reflect the presence of pollution in this area, which emphasizes the impact of human activities, such as the release of industrial wastes from sewage sludge and factories. The locations studied were eutrophicated, and the pollution indices for trace elements in the seawater from these sites confirmed the presence of pollution. There are many reasons for this, including the adsorption of these elements into organic compounds and their deposition in sediments [48]. These findings are in an agreement with the results of Alprol et al. [3], who reported that the pollution levels in the Alexandria coastal zone had increased over time. Trace elements that are soluble in seawater may be linked to water pollution in the studied locations [82]. Seaweed is a sink of trace elements that efficiently sequesters these elements in its tissues; elemental levels in the tissues correlate to the elemental levels in both the water and sediment [34]. Seawater intrusion may decrease the toxicity of heavy metals in coastal zones, but might increase the ecological risk for coastal groundwater, as reported in India [83].
4.3. Sediments under Eutrophication in Selected Locations
Coastal zones are under anthropogenic pressures that vary from one area to another depending on the type and intensity of human activity. Therefore, suitable indicators of negative effects from this pressure are critical in order to evaluate coastal ecological quality, which is temporally and spatially variable [17]. Sediments are an important component of the aquatic environment and are a significant indicator of pollution levels. The concentrations of trace elements in the studied locations were higher than their background concentrations in many other parts of the world, as determined from the literature. The distribution of green macroalgae, such as Ulva spp., in coastal zones worldwide is presented in Table 10. This implies that the coastline of Alexandria was more polluted than other coastal zones in many locations around the world. This may be due to environmental pollutants that originate on land (discharge of urban domestic sewage, agricultural and industrial wastewater, disturbance of soil during agricultural and construction activities, etc.) and reach the sea via riverine inputs or aerial depositions, alongside the high level of human ocean-based activity in this area, including shipping and port services, fishing, and aquaculture.
Table 10.
A comparison of heavy metal concentrations for surface seawater (compared to their concentrations in drinking water (mg L−1) and sediment in different locations worldwide. Kabata-Pendias [48] indicates background levels for seawater.
All the metal concentrations in the sediment were higher than the sediment quality guidelines for the protection of aquatic life (marine) [90]. Water pollutants, depending on their physicochemical properties, may stay in the water column or bind to particles that are subsequently deposited on the seabed [91]. If there are a considerable amount of these elements adsorbed in the sediments, the elements may become a hazard to aquatic life when released, due to changes in the physicochemical properties of the seawater. Mining, manufacturing, and municipal wastewaters are all anthropogenic activities that have a strong link with trace elements in waters and sediments [48]. The concentrations of trace elements in the sediments were higher than the maximum allowable concentrations of these elements in agricultural soils. The concentration of many studied elements in the recent study were high, as reported by El Zokm et al. [92].
4.4. Ecological Risk Assessment of Selected Locations
There is an urgent need to use potential ecological risk assessments to determine the effects of pollutants or nutrients and their role in the eutrophication phenomenon. Assessment of sediment pollution is considered crucial for evaluating the health of ecosystems; however, the determination of metals concentrations alone is not enough to assess possible anthropogenic and environmental health impacts [49]. Thus, several quantitative indices have been developed to assess the level of pollution and ecological risk posed by metals in the environment [49,93]. Bibak et al. [94] stated that ecological risk assessment indicated that elemental sediment pollution has occurred as a result of anthropogenic activities.
The suggested indices of risk assessment are important tools for identification of environmental health risk in coastal zones and should be integrated into eutrophication evaluations [95]. The seven studied locations are along the coastline of Alexandria, which includes major harbors, is considered one of the most industrialized zones in Egypt, and receives considerable amounts of petroleum product inputs [96]. These sources of pollution have generated eutrophication due to green tides along the coastal zones of Alexandria. The pollution of these coastal zones has been described by several authors focusing on pollutants such as polycyclic aromatic hydrocarbons [97], heavy metals [92,98], and urban dust, rich in HMs [99]. Furthermore, Alexandria possesses approximately 40% of Egypt’s industry and is the main summer resort in Egypt [3].
There are many indices for monitoring the pollution of aquatic environments that have been used in the evaluation of the eutrophication phenomenon. The degree of metal contamination ranged between zero (or low) to moderate contamination for Cd in approximately half of the studied sites, and was significant in the remaining sites. Cu contamination was low to moderate at all the studied sites. Zn contamination was very high, and Co, Ni, and Pb contamination was high at all sites. According to the Igeo values, all sites were uncontaminated or moderately contaminated by Cu, Fe, and Zn, while all sites were moderately contaminated by Ni and Pb. All sites were extremely contaminated by Cd. The Pb and Cd concentrations in seawater in the current study were many times higher than those in natural seawater and drinking water. These findings indicate the presence of pollution in this area, which reflects the impact of human activities, such as the release of industrial wastes from sewage sludge and factories [48].
Algae are used in the assessment of marine ecosystems due to their high capacity for HMs bioaccumulation; they are considered good bioindicators. Some algae species can survive in polluted environments because of the genetic mutations they undergo. We calculated BAF values related to both sediments and seawater. The BAF examines the degree to which elements are mobilized from the environment and travel into plants, by determining the efficiency with which plants accumulate elements that are in the environment [93]. When the BAF > 1, the given element is more likely to accumulate in the plant’s tissues [100,101]. According to Alvarez-Mateos et al. [102] and Elbehiry et al. [100], plants are classified as hyperaccumulators (>5 mg kg−1), accumulators <5 mg kg−1 and (>1 mg kg−1), and excluders (<1 mg kg−1), based on their BAF values. Correlation analysis was applied to explain the relationships among the examined elements and factors that may affect their interactions [103]. The highest strong positive correlation was observed between Ni and Pb; Co and Ni; Pb, Zn, and Mn; and Cd and Co. These results confirm that the sources of these elements are similar, as are the results of the ecological risk assessment. PCA is also an effective tool in order to confirm the main potential pollution source in the environment and to condense a huge number of indicators into a more manageable set [11,100]. The PCA analysis also indicated that all the elements studied, except for N, have a similar source.
The values of the bioaccumulation factors show that these algae are good accumulators for all metals except Fe (BAFsediment > 1) (as depicted in Table 10). Copper and Zn are essential microelements for algae, but in higher concentrations, they become toxic. Cd and Pb translocated into plant tissues due to an interference with essential elements, which become toxic when they accumulate in high enough concentrations [104]. The BAFsediment was higher than 1 at all sites for all metals except Cu at L6 and Fe at all locations [101]. Ulva spp. BAFseawater values were higher than for BCFsediment. The maximum BAFseawater value recorded for algae was higher than 1 for all metals, which means that bioaccumulation was confirmed. The BAFseawater comparison between the metals was Zn > Cu > Fe > Cd > Co > Pb > Ni (Table 10). Other studies showed that the concentrations of heavy metals vary from species to species [105].
4.5. Suggested Sustainable Management of Eutrophication
Several pollutants may result from human activities, including heavy metals and organic chemicals from sources such as fertilizers, pesticides, medical activities, waste disposal, and industrial activities [106]. The concentrations of these pollutants can become elevated in aquatic ecosystems, leading to toxicity for aquatic biota [107]. Eutrophication (mainly from N and P) can lead to harmful algal blooms (mainly Cyanophyta), as presented in Figure 8. Therefore, there is an urgent need to identify sustainable approaches for the management of coastal zones in order to prevent eutrophication, such as applying Bacillariophyta and Chlorophyta to inhibit harmful Cyanophyta blooms [32]. Additional strategies include reducing phosphorus input [29], estimating nutrient thresholds [30], monitoring water temperature [31], reducing the abundance of Cyanophyta [32], the integrated risk assessment approach [95], marine green economics [108], and the use of biological nanomaterials for the nanoremediation of polluted water [109]. It is possible that the blooms that cause this eutrophication could be harvested to provide organic fertilizer for agricultural production or be used directly as a human food source. However, doing so requires an understanding of the potential for contaminates to bioaccumulate in ocean plants such as seaweed. Several approaches are needed for the sustainable management of eutrophication. Preventing the problem and using bioindicators such as seaweed to monitor pollution is the best solution [110].
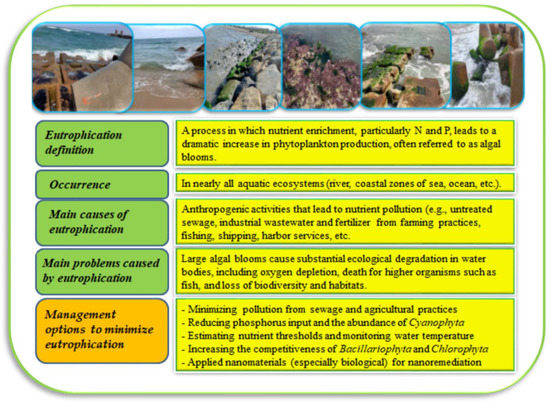
Figure 8.
Eutrophication and its definition, the common places this phenomenon occurs, the main causes and problems, and suggested management approaches.
5. Conclusions
Alexandria has several eutrophicated coastal zones that result from the growth of extensive green tides of macroalgae. Seven coastal zone sites were selected to evaluate these green tides and the environmental conditions in which they exist. The results confirmed that Ulva spp. was a biomarker and accumulator for contamination in this area, especially for trace element contamination. The ecological risk assessment results confirmed the different degrees of pollution by a variety of elements at the studied locations. Owing to the very high nutrient content, particularly N, P, Ca, K, and Mg in the Ulva species, this seaweed could act as an effective biofertilizer or human food source. However, these species should be further investigated regarding ecotoxicology if they are to be used in human nutrition or biofertilizers. The trace element contamination seen in this study is a concern and must be addressed before the seaweed can be applied to these other uses. Therefore, while this seaweed has promise in terms of helping to meet food security goals, the trace element contamination levels seen in this study represent a concern. Further research should focus on the use of algal extracts, which are effective in organic farming, and are an eco-friendly approach to sustainable agriculture. It is imperative to develop a comprehensive program for the management and restoration of the coastline of Alexandria through monitoring of the water quanlity. Municipal, industrial, fish farm, and other wastes must be controlled and/or treated before being discharged into the sea.
Author Contributions
Conceptualization and visualization, M.E.E.-M.; methodology, A.E.-B., F.S.M. and Y.M.H.; software, Q.M.; validation, Y.H.D., E.C.B. and H.E.-R.; formal analysis, M.E.E.-M.; investigation, F.E. and Y.M.H.; resources, H.E.-R.; data curation, M.E.E.-M.; writing—original draft preparation, H.E.-R., Y.H.D., F.E. and E.C.B.; writing—review and editing, all authors; visualization, H.E.-R.; supervision, M.E.E.-M.; project administration, H.E.-R. All authors have read and agreed to the published version of the manuscript.
Funding
This study was not supported by external funding.
Institutional Review Board Statement
Not applicable.
Informed Consent Statement
Not applicable.
Data Availability Statement
All data sets presented in this study are available upon reasonable request from Mohammed El-Mahrouk.
Acknowledgments
The authors thank the staff members of the Physiology and Breeding of Horticultural Crops Laboratory, Department of Horticulture, Faculty of Agriculture, Kafrelsheikh University for their technical support.
Conflicts of Interest
The authors declare no conflict of interest.
References
- Merhaby, D.; Rabodonirina, S.; Net, S.; Ouddane, B.; Halwani, J. Overview of sediments pollution by PAHs and PCBs in Mediterranean basin: Transport, fate, occurrence, and distribution. Mar. Pollut. Bull. 2019, 149, 110646. [Google Scholar] [CrossRef]
- Monier, M.N.; Soliman, A.M.; Al-Halani, A.A. The seasonal assessment of heavy metals pollution in water, sediments, and fish of grey mullet, red seabream, and sardine from the Mediterranean coast, Damietta, North Egypt. Reg. Stud. Mar. Sci. 2023, 57, 102744. [Google Scholar] [CrossRef]
- Alprol, A.E.; Ashour, M.; Mansour, A.T.; Alzahrani, O.M.; Mahmoud, S.F.; Gharib, S.M. Assessment of Water Quality and Phytoplankton Structure of Eight Alexandria Beaches, Southeastern Mediterranean Sea, Egypt. J. Mar. Sci. Eng. 2021, 9, 1328. [Google Scholar] [CrossRef]
- El-Saharty, A.A. Radioactive survey of coastal water and sediments across Alexandria and Rashid coasts. Egypt. J. Aquat. Res. 2013, 39, 21–30. [Google Scholar] [CrossRef]
- Ibrahim, N.; El Afandi, G. Phytoremediation uptake model of heavy metals (Pb, Cd and Zn) in soil using Nerium oleander. Heliyon 2020, 6, e04445. [Google Scholar] [CrossRef]
- Abdel Wahaab, R.; Mahmoud, M.; van Lier, J.B. Toward achieving sustainable management of municipal wastewater sludge in Egypt: The current status and future prospective. Renew. Sustain. Energy Rev. 2020, 127, 109880. [Google Scholar] [CrossRef]
- Zhou, C.; Gaulier, C.; Luo, M.; Guo, W.; Baeyens, W.; Gao, Y. Fine scale measurements in Belgian coastal sediments reveal different mobilization mechanisms for cationic trace metals and oxyanions. Environ. Int. 2020, 145, 106140. [Google Scholar] [CrossRef]
- Li, L.; Shuaijie, W.; Xinqiang, S.; Jiang, M. Ecological risk assessment of heavy metal pollution in the water of China’s coastal shellfish culture areas. Environ. Sci. Pollut. Res. 2020, 27, 18392–18402. [Google Scholar] [CrossRef]
- Brevik, E.C.; Slaughter, L.; Singh, B.R.; Steffan, J.J.; Collier, D.; Barnhart, P.; Pereira, P. Soil and human health: Current status and future needs. Air Soil Water Res. 2020, 13, 1178622120934441. [Google Scholar] [CrossRef]
- Elbehiry, F.; Elbasiouny, H.; Cappuyns, V.; Brevik, E.C. Available concentrations of some potentially toxic and emerging contaminants in different soil orders in Egypt and assessment of soil pollution. J. Soils Sediments 2021, 21, 3645–3662. [Google Scholar] [CrossRef]
- Elbehiry, F.; Elbasiouny, H.; El-Ramady, H.; Brevik, E.C. Mobility, distribution, and potential risk assessment of selected trace elements in soils of the Nile Delta, Egypt. Environ. Monit. Assess. 2019, 191, 713. [Google Scholar] [CrossRef]
- Yuan, Z.; Nag, R.; Cummins, E. Human health concerns regarding microplastics in the aquatic environment—From marine to food systems. Sci. Total Environ. 2022, 823, 153730. [Google Scholar] [CrossRef]
- Haghshenas, V.; Kafaei, R.; Tahmasebi, R.; Dobaradaran, S.; Hashemi, S.; Sahebi, S.; Sorial, G.A.; Ramavandi, B. Potential of green/brown algae for monitoring of metal(loid)s pollution in the coastal seawater and sediments of the Persian Gulf: Ecological and health risk assessment. Environ. Sci. Pollut. Res. 2020, 27, 7463–7475. [Google Scholar] [CrossRef]
- Li, Y.; Sarpong, L.; Cheng, Y.; Norgbey, E.; Nooni, I.K.; Nasiru, S.; Setordjie, V.E.; Duodu, R.A.B.; Dzakpasu, M. A sediment diagenesis model on sediment oxygen demand in managing eutrophication on Taihu, China. Environ. Sci. Pollut. Res. 2022, 1–15. [Google Scholar] [CrossRef]
- Wei, Y.; Ding, D.; Gu, T.; Xu, Y.; Sun, X.; Qu, K.; Sun, J.; Cui, Z. Ocean acidification and warming significantly affect coastal eutrophication and organic pollution: A case study in the Bohai Sea. Mar. Pollut. Bull. 2023, 186, 114380. [Google Scholar] [CrossRef] [PubMed]
- Sá, A.K.D.S.; Cutrim, M.V.J.; Feitosa, F.A.N.; Flores-Montes, M.J.; Cavalcanti, L.F.; Costa, D.S.; da Cruz, Q.S. Multiple stressors influencing the general eutrophication status of transitional waters of the Brazilian tropical coast: An approach utilizing the pressure, state, and response (PSR) framework. J. Sea Res. 2022, 189, 102282. [Google Scholar] [CrossRef]
- Wu, H.Y.; Fu, S.F.; Hu, W.J.; Chen, F.G.; Cai, X.Q.; Chen, Q.H.; Wu, Y.B. Response of different benthic biotic indices to eutrophication and sediment heavy metal pollution, in Fujian coastal water, East China sea. Chemosphere 2022, 307, 135653. [Google Scholar] [CrossRef]
- Padedda, B.M.; Sechi, N.; Lai, G.G.; Mariani, M.A.; Pulina, S.; Sarria, M.; Satta, C.T.; Virdis, T.; Buscarinu, P.; Lugliè, A. Consequences of eutrophication in the management of water resources in Mediterranean reservoirs: A case study of Lake Cedrino (Sardinia, Italy). Glob. Ecol. Conserv. 2017, 12, 21–35. [Google Scholar] [CrossRef]
- Nakakuni, M.; Loassachan, N.; Ichimi, K.; Nagao, S.; Tada, K. Biophilic elements in core sediments as records of coastal eutrophication in the Seto Inland Sea, Japan. Reg. Stud. Mar. Sci. 2022, 50, 102093. [Google Scholar] [CrossRef]
- Soro, M.-P.; N’goran, K.M.; Ouattara, A.A.; Yao, K.M.; Kouassi, N.L.B.; Diaco, T. Nitrogen and phosphorus spatio-temporal distribution and fluxes intensifying eutrophication in three tropical rivers of Côte d’Ivoire (West Africa). Mar. Pollut. Bull. 2023, 186, 114391. [Google Scholar] [CrossRef]
- Da Le, N.; Nguyen, T.H.; Duong, T.T.; Rochelle-Newall, E.; Hoang, T.T.H.; Vu, T.H.; Pham, T.M.H.; Dinh, L.M.; Phung, T.X.B.; Nguyen, T.D.; et al. Risk of eutrophication in the seawater of the coastal Red River aquaculture zone (Thai Binh province, Vietnam). Reg. Stud. Mar. Sci. 2022, 55, 102587. [Google Scholar] [CrossRef]
- Morsy, A.; Ebeid, M.; Soliman, A.; Abdel Halim, A.; Ali, A.; Fahmy, M. Evaluation of the water quality and the eutrophication risk in Mediterranean sea area: A case study of the Port Said Harbour, Egypt. Environ. Chall. 2022, 7, 100484. [Google Scholar] [CrossRef]
- Abdelsalam, A.H.; Saber, A.A.; El-Kafrawy, S.; Abo-Taleb, H. Long-term evaluation of eutrophication problem using multi-sensor satellite data along El-Max Bay, Alexandria coast and Abu-Qir Bay, Egypt. Egypt. J. Aquat. Biol. Fish. 2020, 24, 233–258. [Google Scholar] [CrossRef]
- Elbasiouny, H.; Elbehiry, F.; El-Ramady, H.; Brevik, E.C. Phosphorus Availability and Potential Environmental Risk Assessment in Alkaline Soils. Agriculture 2020, 10, 172. [Google Scholar] [CrossRef]
- Harris, R.J.; Niemand, C.; Pilditch, C.A. Decomposing macroalgae (Ulva spp.) impacts benthic macrofauna and surface sediment erosion. Geo-Mar. Lett. 2020, 40, 281–294. [Google Scholar] [CrossRef]
- Dominguez, H.; Loret, E.P. Ulva lactuca, a source of troubles and potential riches. Mar. Drugs 2019, 17, 357. [Google Scholar] [CrossRef]
- Fort, A.; Mannion, C.; Fariñas-Franco, J.M.; Sulpice, R. Green tides select for fast expanding Ulva strains. Sci. Total Environ. 2020, 698, 134337. [Google Scholar] [CrossRef]
- Liu, H.; Liu, Q.; Zhao, J.; Zhang, X.; Ding, L.; Liu, Y.; Fu, G. Spatiotemporal variation of phosphorus use efficiency across 70 lakes in China: Implications for lake eutrophication management. Ecol. Indic. 2022, 142, 109293. [Google Scholar] [CrossRef]
- Poikane, S.; Kelly, M.G.; Várbíró, G.; Borics, G.; Erős, T.; Hellsten, S.; Kolada, A.; Lukács, B.A.; Solheim, A.L.; López, J.P.; et al. Estimating nutrient thresholds for eutrophication management: Novel insights from understudied lake types. Sci. Total Environ. 2022, 827, 154242. [Google Scholar] [CrossRef]
- Zhao, F.; Zhan, X.; Xu, H.; Zhu, G.; Zou, W.; Zhu, M.; Kang, L.; Guo, Y.; Zhao, X.; Wang, Z.; et al. New insights into eutrophication management: Importance of temperature and water residence time. J. Environ. Sci. 2022, 111, 229–239. [Google Scholar] [CrossRef]
- Lai, C.; Ma, Z.; Liu, Z.; Sun, H.; Yu, Q.; Xia, F.; He, X.; Bao, Q.; Han, Y.; Liu, X.; et al. Alleviating eutrophication by reducing the abundance of Cyanophyta due to dissolved inorganic carbon fertilization: Insights from Erhai Lake, China. J. Environ. Sci. 2023, 131, 68–83. [Google Scholar] [CrossRef]
- Imchen, T.; Singh, K.S. Marine algae colorants: Antioxidant, anti-diabetic properties and applications in food industry. Algal Res. 2023, 69, 102898. [Google Scholar] [CrossRef]
- Shahri, E.; Sayadi, M.H.; Yousefi, E.; Savabieasfehani, M. Metal Contamination of Oman Sea Seaweed and Its Associated Public Health Risks. Biol. Trace Elem. Res. 2021, 200, 2989–2998. [Google Scholar] [CrossRef]
- Ruangrit, K.; Chaipoot, S.; Phongphisutthinant, R.; Duangjan, K.; Phinyo, K.; Jeerapan, I.; Pekkoh, J.; Srinuanpan, S. A successful biorefinery approach of macroalgal biomass as a promising sustainable source to produce bioactive nutraceutical and biodiesel. Biomass Convers. Biorefin. 2021, 13, 1089–1099. [Google Scholar] [CrossRef]
- García-Poza, S.; Leandro, A.; Cotas, C.; Cotas, J.; Marques, J.C.; Pereira, L.; Gonçalves, A.M.M. The Evolution Road of Seaweed Aquaculture: Cultivation Technologies and the Industry 4.0. Int. J. Environ. Res. Public Health 2020, 17, 6528. [Google Scholar] [CrossRef]
- Lebata-Ramos, M.J.H.L.; Solis, E.F.D. Can Ulva reticulata replace Gracilariopsis heteroclada as natural food for the abalone Haliotis asinina? J. Appl. Phycol. 2021, 33, 1869–1872. [Google Scholar] [CrossRef]
- Agrawal, K.; Bhatt, A.; Bhardwaj, N.; Kumar, B.; Verma, P. Algal Biomass: Potential Renewable Feedstock for Biofuels Production—Part I. In Biofuel Production Technologies: Critical Analysis for Sustainability. Clean Energy Production Technologies; Srivastava, N., Srivastava, M., Mishra, P., Gupta, V., Eds.; Springer: Singapore, 2020. [Google Scholar] [CrossRef]
- Sarwer, A.; Hamed, S.M.; Osman, A.I.; Jamil, F.; Al-Muhtaseb, A.H.; Alhajeri, N.S.; Rooney, D.W. Algal biomass valorization for biofuel production and carbon sequestration: A review. Environ. Chem. Lett. 2022, 20, 2797–2851. [Google Scholar] [CrossRef]
- Salehi, B.; Berkay, Y.Y.; Antika, G.; Boyunegmez, T.T.; Mahomoodally, F.M.; Lobine, D.; Akram, M.; Riaz, M.; Capanoglu, E.; Sharopov, F.; et al. Insights on the Use of α-Lipoic Acid for Therapeutic Purposes. Biomolecules 2019, 9, 356. [Google Scholar] [CrossRef]
- Polikovsky, M.; Califano, G.; Dunger, N.; Wichard, T.; Golberg, A. Engineering bacteria-seaweed symbioses for modulating the photosynthate content of Ulva (Chlorophyta): Significant for the feedstock of bioethanol production. Algal Res. 2020, 49, 101945. [Google Scholar] [CrossRef]
- Ashour, M.; Al-Souti, A.S.; Hassan, S.M.; Ammar, G.A.G.; Goda, A.M.A.-S.; El-Shenody, R.; Abomohra, A.E.-F.; El-Haroun, E.; Elshobary, M.E. Commercial Seaweed Liquid Extract as Strawberry Biostimulants and Bioethanol Production. Life 2023, 13, 85. [Google Scholar] [CrossRef]
- Allen, S.E.; Grimshaw, H.M.; Rowland, A.P. Chemical Analysis. In Methods in Plant Ecology; Moore, P.D., Chapman, S.B., Eds.; Blackwell: London, UK, 1986; pp. 285–344. [Google Scholar]
- John, M.K. Colorimetric determination of phosphorus in soil and plant materials with ascorbic acid. Soil Sci. 1970, 109, 214–220. [Google Scholar] [CrossRef]
- Beljkaš, B.; Matić, J.; Milovanović, I.; Jovanov, P.; Mišan, A.; Šarić, L. Rapid method for determination of protein content in cereals and oilseeds: Validation, measurement uncertainty and comparison with the Kjeldahl method. Accredit. Qual. Assur. 2010, 15, 555–561. [Google Scholar] [CrossRef]
- APHA. Standard Methods for the Examination of Water and Waste Water, 22nd ed.; American Public Health Association, American Water Works Association, Water Environment Federation: Washington, DC, USA, 2012. [Google Scholar]
- Bremner, J.M.; Mulvaney, C.S. Total nitrogen. In Methods of Soil Analysis, 2nd ed.; Part II Chemical and Microbiological Properties; Agronomy No. 9. American Society of Agronomy: Madison, WI, USA, 1982; pp. 595–624. [Google Scholar]
- Olsen, S.R.; Sommers, L.E. Phosphorus. In Methods of Soil Analysis, 2nd ed.; Part 2; Page, A.L., Miller, R.H., Keeney, D.R., Eds.; Agronomy No. 9. American Society of Agronomy: Madison, WI, USA, 1982; pp. 403–430. [Google Scholar]
- Kabata-Pendias, A. Trace Elements in Soils and Plants, 4th ed.; Taylor and Francis Group, LLC.: Abingdon, UK; CRC Press: Boca Raton, FL, USA, 2011. [Google Scholar]
- Brevik, E.C.; Khaledian, Y.; El-Ramady, H. Assessing the complex links between soils and human health: An area of pressing need. Front. Soil Sci. 2021, 1, 731085. [Google Scholar] [CrossRef]
- Muller, G. Heavy-metals in sediment of the Rhine-changes since 1971. Umschau. Wissenschaft. Technik. 1979, 79, 778–783. [Google Scholar]
- Li, X.; Chi, W.; Tian, H.; Zhang, Y.; Zhu, Z. Probabilistic ecological risk assessment of heavy metals in western Laizhou Bay, Shandong Province, China. PLoS ONE 2019, 14, e0213011. [Google Scholar] [CrossRef] [PubMed]
- Hakanson, L. An ecological risk index for aquatic pollution control. A sedimentological approach. Water Res. 1980, 14, 975–1001. [Google Scholar] [CrossRef]
- Peng, Z.; Guo, Z.; Wang, Z.; Zhang, R.; Wu, Q.; Gao, H.; Wang, Y.; Shen, Z.; Lek, S.; Xiao, J. Species-specific bioaccumulation and health risk assessment of heavy metal in seaweeds in tropic coasts of South China Sea. Sci. Total Environ. 2022, 832, 155031. [Google Scholar] [CrossRef]
- Doyle, J.J.; Doyle, J.L. Isolation of plant DNA from fresh tissue. Focus 1990, 12, 13–15. [Google Scholar]
- Aebi, H. Catalase in vitro. Methods Enzym. 1984, 105, 121–126. [Google Scholar]
- Hammerschmidt, R.; Nuckles, E.M.; Kuć, J. Asso1ciation of enhanced peroxidase activity with induced systemic resistance of cucumber, to Colletotrichum lagenarium. Physiol. Plant Pathol. 1982, 20, 73–82. [Google Scholar] [CrossRef]
- Malik, C.P.; Singh, M.B. Plant Enzymology and Histo-Nzymology; Kalyani Publishers: New Delhi, India, 1980; p. 286. [Google Scholar]
- ISO/IEC 17025, 2017; General Requirements for the Competence of Testing and Calibration Laboratories. International Organization for Standardization (ISO); The International Electrotechnical Commission (IEC): Geneva, Switzerland, 2017.
- Cardinali, A.; Nason, G.P. Costationarity of Locally Stationary Time Series Using Costat. J. Stat. Softw. 2013, 55, 1–22. Available online: http://www.jstatsoft.org/v55/i01/ (accessed on 9 January 2023). [CrossRef]
- Jaccard, P. New research on floral distribution. Bull. Soc. Vaud. Sci. Nat. 1908, 44, 223–270. [Google Scholar]
- Hammer, O.; Harper, D.A.; Ryan, P.D. Palaeontological statistics software package for education and data analysis. Palaeontol. Electron. 2001, 4, 9. [Google Scholar]
- Hamdy, R.; Langeneck, J.; Atta, M.M.; Dorgham, M.M.; El-Rashidy, H.H.; Musco, L. Diversity and ecology of crustaceans from shallow rocky habitats along the Mediterranean coast of Egypt. Mar. Biodivers. 2019, 49, 221–233. [Google Scholar] [CrossRef]
- Guidone, M.; Thornber, C.; Wysor, B.; O’Kelly, C.J. Molecular and morphological diversity of Narragansett Bay (RI, USA) Ulva (Ulvales, Chlorophyta) populations. J. Phycol. 2013, 49, 979–995. [Google Scholar] [CrossRef]
- Ismail, M.M.; Mohamed, S.E. Differentiation between some Ulva spp. by morphological, genetic and biochemical analyses. Vavilov. J. Genet. Breed. 2017, 21, 360–367. [Google Scholar] [CrossRef]
- Luk, S.Y.; Hoagland, P.; Rheuban, J.E.; Costa, J.E.; Doney, S.C. Modeling the effect of water quality on the recreational shell fishing cultural ecosystem service of Buzzards Bay, Massachusetts. Mar. Pollut. Bull. 2019, 140, 364–373. [Google Scholar] [CrossRef]
- Vea, E.B.; Bendtsen, J.; Richardson, K.; Ryberg, M.; Hauschild, M. Spatially differentiated marine eutrophication method for absolute environmental sustainability assessments. Sci. Total Environ. 2022, 843, 156873. [Google Scholar] [CrossRef]
- Wang, Z.; Fan, B.; Yu, D.; Fan, Y.; An, D.; Pan, S. Monitoring the Spatio-Temporal Distribution of Ulva prolifera in the Yellow Sea (2020–2022) Based on Satellite Remote Sensing. Remote Sens. 2023, 15, 157. [Google Scholar] [CrossRef]
- Nukapothula, S.; Yunus, A.P.; Chen, C. Signals of intense primary production in response to Ulva prolifera bloom in the Yellow Sea during summer 2021. Phys. Chem. Earth Parts A/B/C 2022, 128, 103257. [Google Scholar] [CrossRef]
- Zheng, L.; Wu, M.; Cui, Y.; Tian, L.; Yang, P.; Zhao, L.; Xue, M.; Liu, J. What causes the great green tide disaster in the South Yellow Sea of China in 2021? Ecol. Indic. 2022, 140, 108988. [Google Scholar] [CrossRef]
- Liu, R.; Jiang, W.; Li, F.; Pan, Y.; Wang, C.; Tian, H. Occurrence, partition, and risk of seven heavy metals in sediments, seawater, and organisms from the eastern sea area of Shandong Peninsula, Yellow Sea, China. J. Environ. Manag. 2021, 279, 111771. [Google Scholar] [CrossRef] [PubMed]
- Sousa, G.T.; Neto, M.C.L.; Choueri, R.B.; Castro, I.B. Photoprotection and antioxidative metabolism in Ulva lactuca exposed to coastal oceanic acidification scenarios in the presence of Irgarol. Aquat. Toxicol. 2021, 230, 105717. [Google Scholar] [CrossRef]
- Zhang, C.; Lu, J.; Wu, J. Enhanced removal of phenolic endocrine disrupting chemicals from coastal waters by intertidal macroalgae. J. Hazard. Mater. 2021, 411, 125105. [Google Scholar] [CrossRef]
- Zhao, S.; Xu, B.; Yao, Q.; Burnett, W.; Charette, M.; Su, R.; Lian, E.; Yu, Z. Nutrient-rich submarine groundwater discharge fuels the largest green tide in the world. Sci. Total Environ. 2021, 770, 144845. [Google Scholar] [CrossRef] [PubMed]
- Hiraoka, M.; Tanaka, K.; Yamasaki, T.; Miura, O. Replacement of Ulva ohnoi in the type locality under rapid ocean warming in southwestern Japan. J. Appl. Phycol. 2020, 32, 2489–2494. [Google Scholar] [CrossRef]
- Sun, K.; Sun, J.; Liu, Q.; Lian, Z.; Ren, J.S.; Bai, T.; Wang, Y.; Wei, Z. A numerical study of the Ulva prolifera biomass during the green tides in China-toward a cleaner Porphyra mariculture. Mar. Pollut. Bull. 2020, 161, 111805. [Google Scholar] [CrossRef]
- Wang, K.K.; Tian, Y.; Li, P.F.; Liu, C.Y.; Yang, G.P. Sources of nitric oxide during the outbreak of Ulva prolifera in coastal waters of the Yellow Sea off Qingdao. Mar. Environ. Res. 2020, 162, 105177. [Google Scholar] [CrossRef]
- Duplá, M.V. Eelgrass-associated mesograzers limit the distribution of bloom-forming Ulva via top-down control of its early life stages. Mar. Environ. Res. 2020, 161, 105061. [Google Scholar] [CrossRef]
- Balar, N.; Sharnagat, P.; Kumari, P.; Mantri, V.A. Variation in the proximate composition of edible marine macroalga Ulva rigida collected from different coastal zones of India. J. Food Sci. Technol. 2019, 56, 4749–4755. [Google Scholar] [CrossRef]
- Samanta, P.; Shin, S.; Jang, S.; Song, Y.C.; Oh, S.; Kim, J.K. Stable carbon and nitrogen isotopic characterization and tracing nutrient sources of Ulva blooms around Jeju coastal areas. Environ. Pollut. 2019, 254, 113033. [Google Scholar] [CrossRef] [PubMed]
- Zhang, C.; Lu, J.; Wu, J.; Luo, Y. Phycoremediation of coastal waters contaminated with bisphenol A by green tidal algae Ulva prolifera. Sci. Total Environ. 2019, 661, 55–62. [Google Scholar] [CrossRef]
- Kabata-Pendias, A.; Mukherjee, A.B. Trace Elements from Soil to Human; Springer: Berlin/Heidelberg, Germany, 2007. [Google Scholar]
- Nafea, E.M.A.; Zyada, M.A. Biomonitoring of heavy metals pollution in Lake Burullus, Northern Delta, Egypt. Afr. J. Environ. Sci. Technol. 2015, 9, 1–7. [Google Scholar]
- Bhagat, C.; Kumar, M.; Mahlknecht, J.; Hdeib, R.; Mohapatra, P.K. Seawater intrusion decreases the metal toxicity but increases the ecological risk and degree of treatment for coastal groundwater: An Indian perspective. Environ. Pollut. 2022, 310, 119771. [Google Scholar] [CrossRef]
- Wang, X.; Zhao, L.; Xu, H.; Zhang, X. Spatial and seasonal characteristics of dissolved heavy metals in the surface seawater of the Yellow River Estuary, China. Mar. Pollut. Bull. 2018, 137, 465–473. [Google Scholar] [CrossRef]
- Arikibe, J.E.; Prasad, S. Determination and comparison of selected heavy metal concentrations in seawater and sediment samples in the coastal area of Suva, Fiji. Mar. Pollut. Bull. 2020, 157, 111157. [Google Scholar] [CrossRef]
- Nour, H.E.; El-Sorogy, A.S. Heavy metals contamination in seawater, sediments and seashells of the Gulf of Suez, Egypt. Environ. Earth Sci. 2020, 79, 274. [Google Scholar] [CrossRef]
- Liu, J.; Xia, J.; Zhuang, M.; Zhang, J.; Yu, K.; Zhao, S.; Sun, Y.; Tong, Y.; Xia, L.; Qin, Y.; et al. Controlling the source of green tides in the Yellow Sea: NaClO treatment of Ulva attached on Pyropia aquaculture rafts. Aquaculture 2021, 535, 736378. [Google Scholar] [CrossRef]
- Nour, H.E.; El-Sorogy, A.S.; Abd El-Wahab, M.; Mohamaden, M.; Al-Kahtany, K. Contamination and ecological risk assessment of heavy metals pollution from the Shalateen coastal sediments, Red Sea, Egypt. Mar. Pollut. Bull. 2019, 144, 167–172. [Google Scholar] [CrossRef]
- Soliman, N.F.; Nasr, S.M.; Okbah, M.A. Potential ecological risk of heavy metals in sediments from the Mediterranean coast, Egypt. J. Environ. Health Sci. Eng. 2015, 13, 70. [Google Scholar] [CrossRef]
- CCME (Canadian Council of Ministers of the Environment). Protocol for the Derivation of Canadian Sediment Quality Guidelines for the Protection of Aquatic Life; CCME EPC-98E; CCME: Winnipeg, MB, Canada, 1998. [Google Scholar]
- Kanwischer, M.; Asker, N.; Wernersson, A.S.; Wirth, M.A.; Fisch, K.; Dahlgren, E.; Osterholz, H.; Habedank, F.; Naumann, M.; Mannio, J.; et al. Substances of emerging concern in Baltic Sea water: Review on methodological advances for the environmental assessment and proposal for future monitoring. Ambio 2022, 51, 1588–1608. [Google Scholar] [CrossRef]
- El Zokm, G.M.; Ibrahim, M.I.; Mohamed, L.A.; El-Mamoney, M. Critical geochemical insight into Alexandria coast with special reference to diagnostic ratios (TOC/TN & Sr/Ca) and heavy metals ecotoxicological hazards. Egypt. J. Aquat. Res. 2020, 46, 27–33. [Google Scholar] [CrossRef]
- Aitta, A.; El-Ramady, H.; Alshaal, T.; El-Henawy, A.; Shams, M.; Talha, N.; Elbehiry, F.; Brevik, E.C. Seasonal and spatial distribution of soil trace elements around Kitchener drain in the northern Nile Delta, Egypt. Agriculture 2019, 9, 152. [Google Scholar] [CrossRef]
- Bibak, M.; Sattari, M.; Tahmasebi, S.; Kafaei, R.; Sorial, G.A.; Ramavandi, B. Trace and major elements concentration in fish and associated sediment–seawater, northern shores of the Persian Gulf. Biol. Trace Elem. Res. 2021, 199, 2717–2729. [Google Scholar] [CrossRef]
- Njock, P.G.A.; Zhou, A.; Yin, Z.; Shen, S.L. Integrated risk assessment approach for eutrophication in coastal waters: Case of Baltic Sea. J. Clean. Prod. 2023, 387, 135673. [Google Scholar] [CrossRef]
- Ahmed, O.E.; Mahmoud, S.A.; El Nady, M.M. Organic sources in the Egyptian seawater around Alexandria coastal area as integrated from polycyclic aromatic hydrocarbons (PAHs). Egypt. J. Pet. 2017, 26, 819–826. [Google Scholar] [CrossRef]
- El-Naggar, N.A.; Emara, H.I.; Moawad, M.N.; Soliman, Y.A.; El-Sayed, A.A. Detection of polycyclic aromatic hydrocarbons along Alexandria’s coastal water, Egyptian Mediterranean Sea. Egypt. J. Aquat. Res. 2018, 44, 9–14. [Google Scholar] [CrossRef]
- Khaled, A.; Ahdy, H.H.; El Sayed, A.E.; Ahmed, H.O.; Razek, F.A.A.; Fahmy, M.A. Spatial distribution and potential risk assessment of heavy metals in sediment along Alexandria Coast, Mediterranean Sea, Egypt. Egypt. J. Aquat. Res. 2021, 47, 37–43. [Google Scholar] [CrossRef]
- Jadoon, W.A.; Abdel-Dayem, S.M.M.A.; Saqib, Z.; Takeda, K.; Sakugawa, H.; Hussain, M.; Shah, G.M.; Rehman, W.; Syed, J.H. Heavy metals in urban dusts from Alexandria and Kafr El-Sheikh, Egypt: Implications for human health. Environ. Sci. Pollut. Res. 2021, 28, 2007–2018. [Google Scholar] [CrossRef] [PubMed]
- Elbehiry, F.; Elbasiouny, H.; Ali, R.; Brevik, E.C. Enhanced Immobilization and Phytoremediation of Heavy Metals in Landfill Contaminated Soils. Water Air Soil Pollut. 2020, 231, 204. [Google Scholar] [CrossRef]
- Radziemska, M. Study of applying naturally occurring mineral sorbents of Poland (dolomite halloysite, chalcedonite) for aided phytostabilization of soil polluted with heavy metals. Catena 2018, 163, 123–129. [Google Scholar] [CrossRef]
- Alvarez-Mateos, P.; Ales-Alvarez, F.; Garcia-Martin, J.F. Phytoremediation of highly contaminated mining soils by Jatropha curcas L. and production of catalytic carbons from the generated biomass. J. Environ. Manag. 2019, 231, 886–895. [Google Scholar] [CrossRef]
- Bednářová, Z.; Kalina, J.; Hájek, O.; Sáňka, M.; Komprdová, K. Spatial distribution and risk assessment of metals in agricultural soils. Geoderma 2016, 284, 113–121. [Google Scholar] [CrossRef]
- Jitar, O.; Teodosiu, C.; Oros, A.; Plavan, G.; Nicoara, M. Bioaccumulation of heavy metals in marine organisms from the Romanian sector of the Black Sea. New Biotechnol. 2015, 32, 369–378. [Google Scholar] [CrossRef]
- Trevizani, T.H.; Figueira, R.C.L.; Ribeiro, A.P.; Theophilo, C.Y.S.; Majer, A.P.; Petti, M.A.V.; Corbisier, T.N.; Montone, R.C. Bioaccumulation of heavy metals in marine organisms and sediments from Admiralty Bay, King George Island, Antarctica. Mar. Pollut. Bull. 2016, 106, 366–371. [Google Scholar] [CrossRef] [PubMed]
- Steffan, J.J.; Brevik, E.C.; Burgess, L.C.; Cerdà, A. The effect of soil on human health: An overview. Eur. J. Soil Sci. 2018, 69, 159–171. [Google Scholar] [CrossRef] [PubMed]
- Gu, Y.G.; Gao, Y.P.; Chen, F.; Huang, H.H.; Yu, S.H.; Jordan, R.W.; Jiang, S.J. Risk assessment of heavy metal and pesticide mixtures in aquatic biota using the DGT technique in sediments. Water Res. 2022, 224, 119108. [Google Scholar] [CrossRef]
- Sun, J.; Zhai, N.; Miao, J.; Mu, H.; Li, W. How do heterogeneous environmental regulations affect the sustainable development of marine green economy? Empirical evidence from China’s coastal areas. Ocean Coast. Manag. 2023, 232, 106448. [Google Scholar] [CrossRef]
- Ji, M.; Li, B.; Majdi, A.; Alkhalifah, T.; Alturise, F.; Ali, H.E. Application of nano remediation of mine polluted in acid mine drainage water using machine learning model. Chemosphere 2023, 311, 136926. [Google Scholar] [CrossRef]
- Bonanno, G.; Veneziano, V.; Piccione, V. The alga Ulva lactuca (Ulvaceae, Chlorophyta) as a bioindicator of trace element contamination along the coast of Sicily, Italy. Sci. Total Environ. 2020, 699, 134329. [Google Scholar] [CrossRef]
Disclaimer/Publisher’s Note: The statements, opinions and data contained in all publications are solely those of the individual author(s) and contributor(s) and not of MDPI and/or the editor(s). MDPI and/or the editor(s) disclaim responsibility for any injury to people or property resulting from any ideas, methods, instructions or products referred to in the content. |
© 2023 by the authors. Licensee MDPI, Basel, Switzerland. This article is an open access article distributed under the terms and conditions of the Creative Commons Attribution (CC BY) license (https://creativecommons.org/licenses/by/4.0/).