Creative Economy and Sustainable Development: Shaping Flexible Cultural Governance Model for Creativity
Abstract
1. Introduction
2. Literature Review
2.1. Theoretical Research on Cultural and Creative Industries
2.2. Cultural Development Indicators
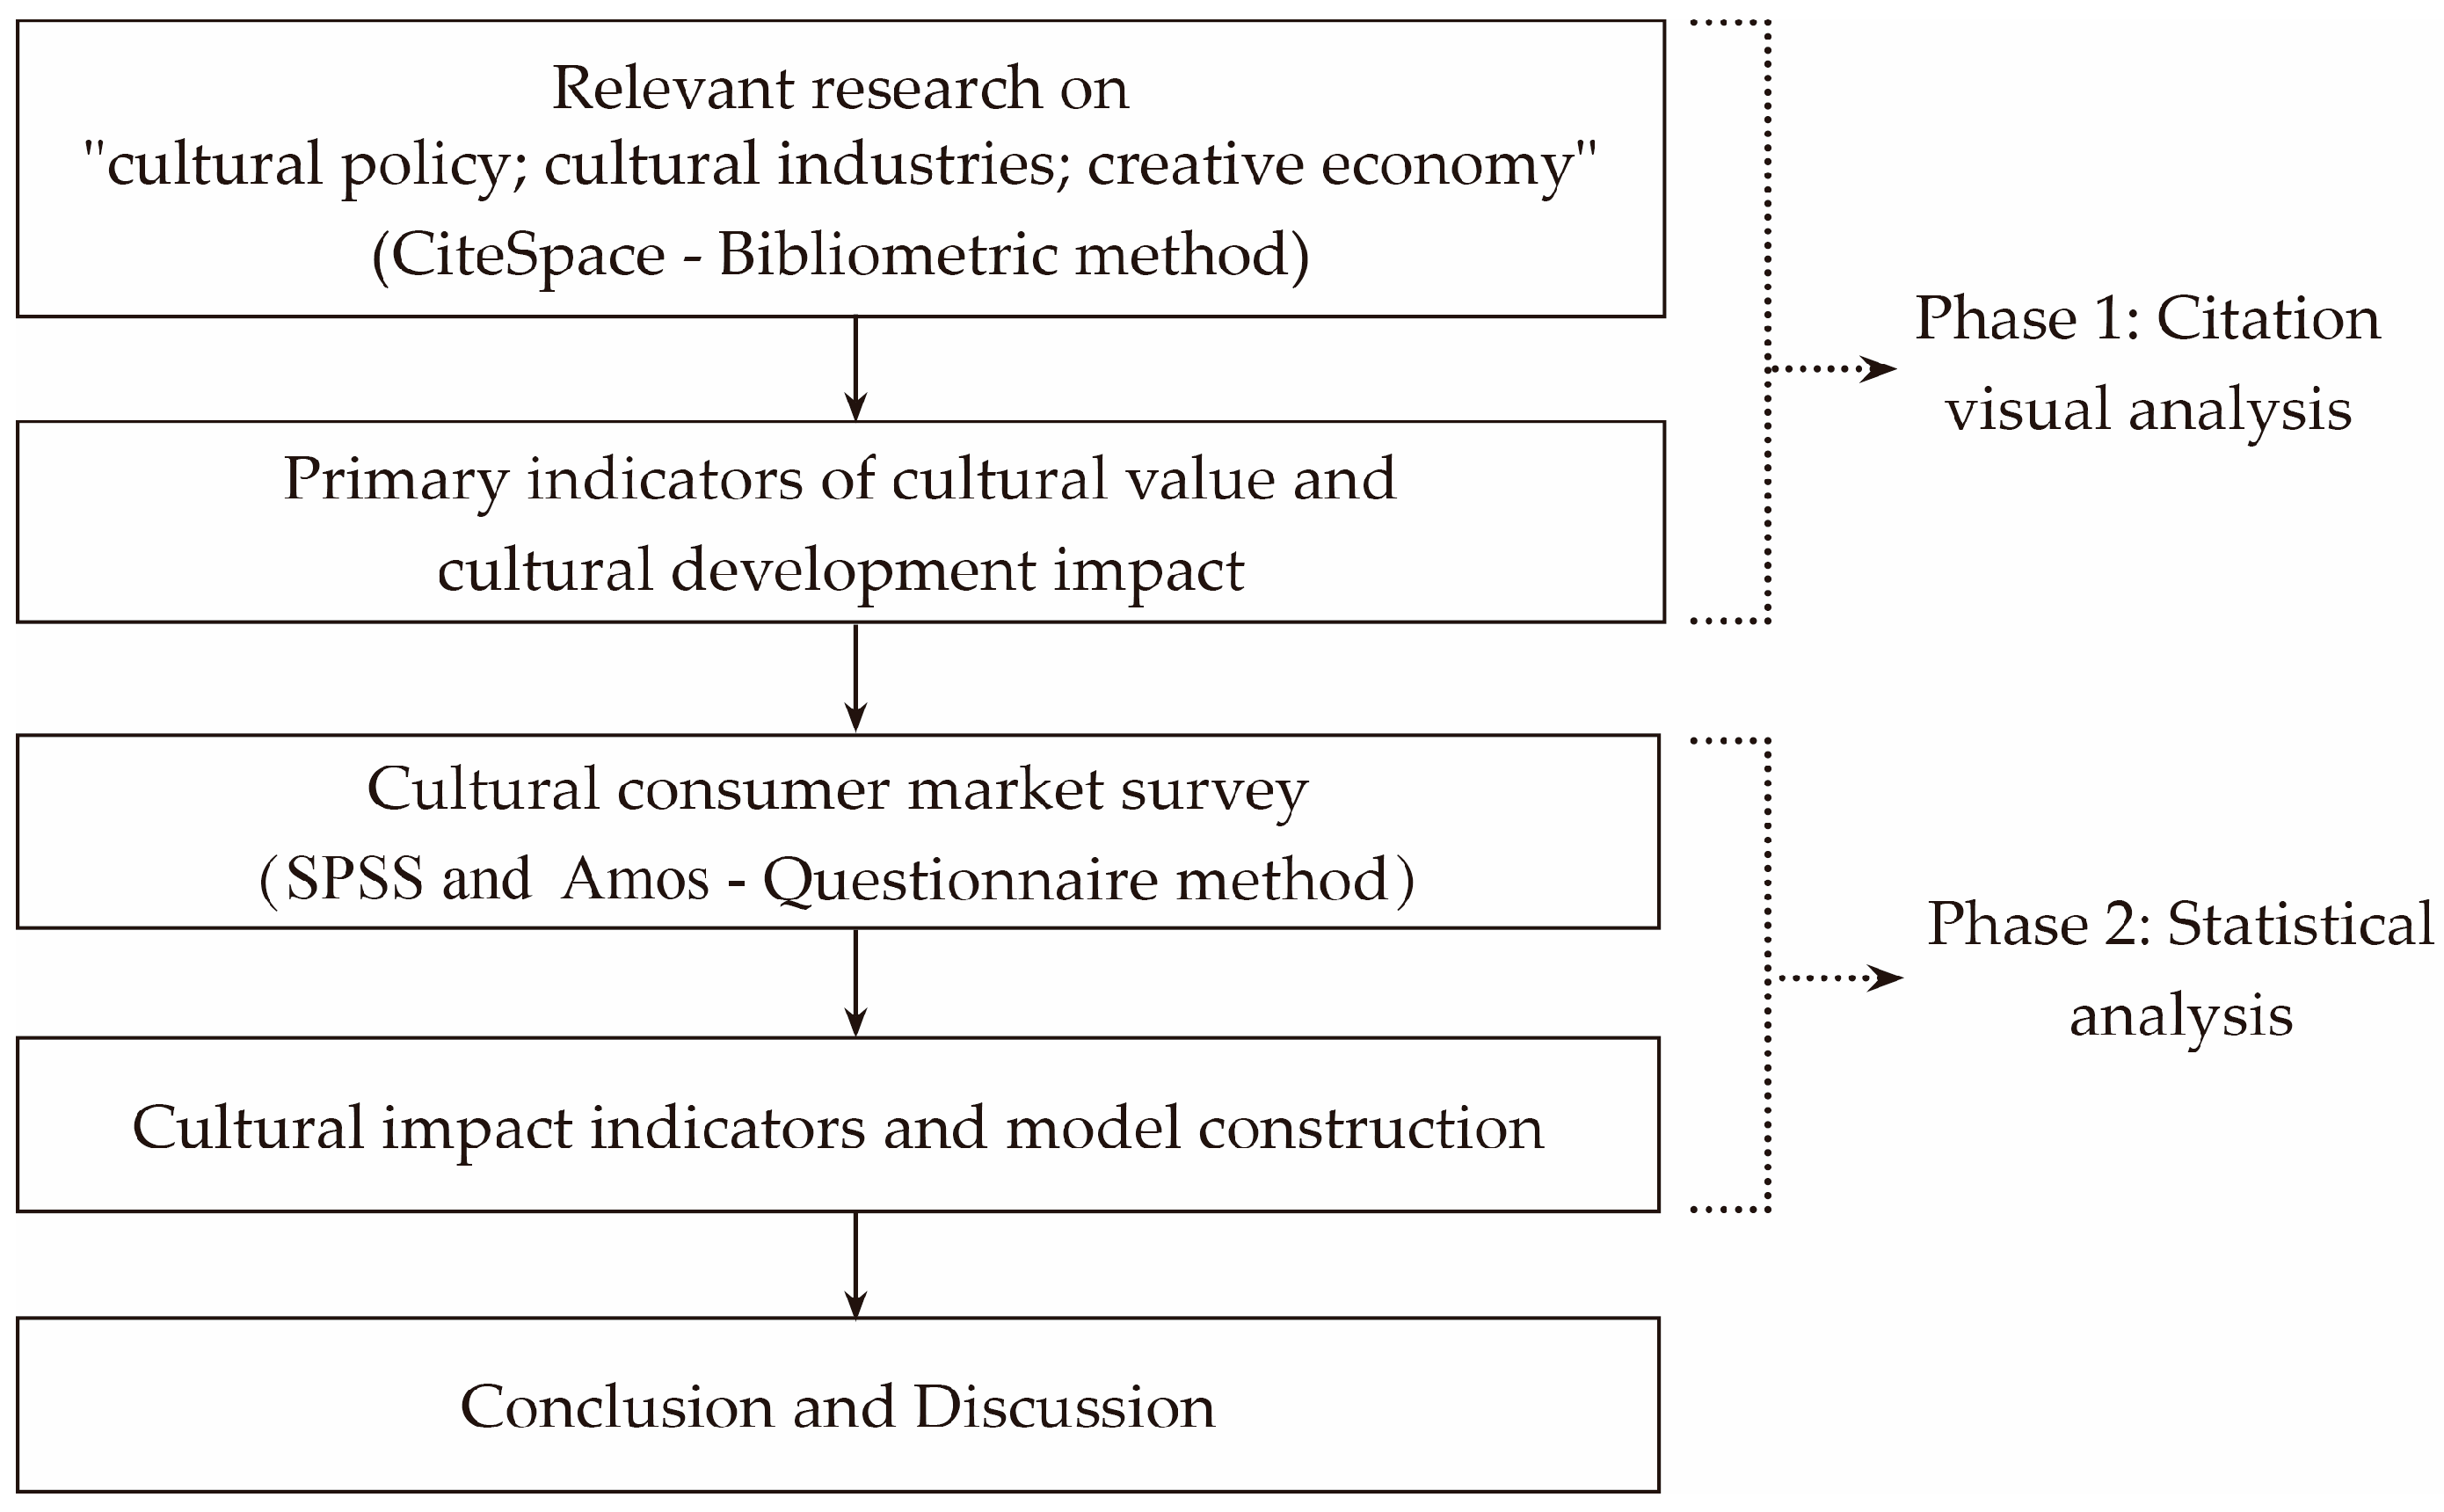
2.3. Study Design
3. Materials and Methods
3.1. Science Mapping
3.1.1. Data Collection
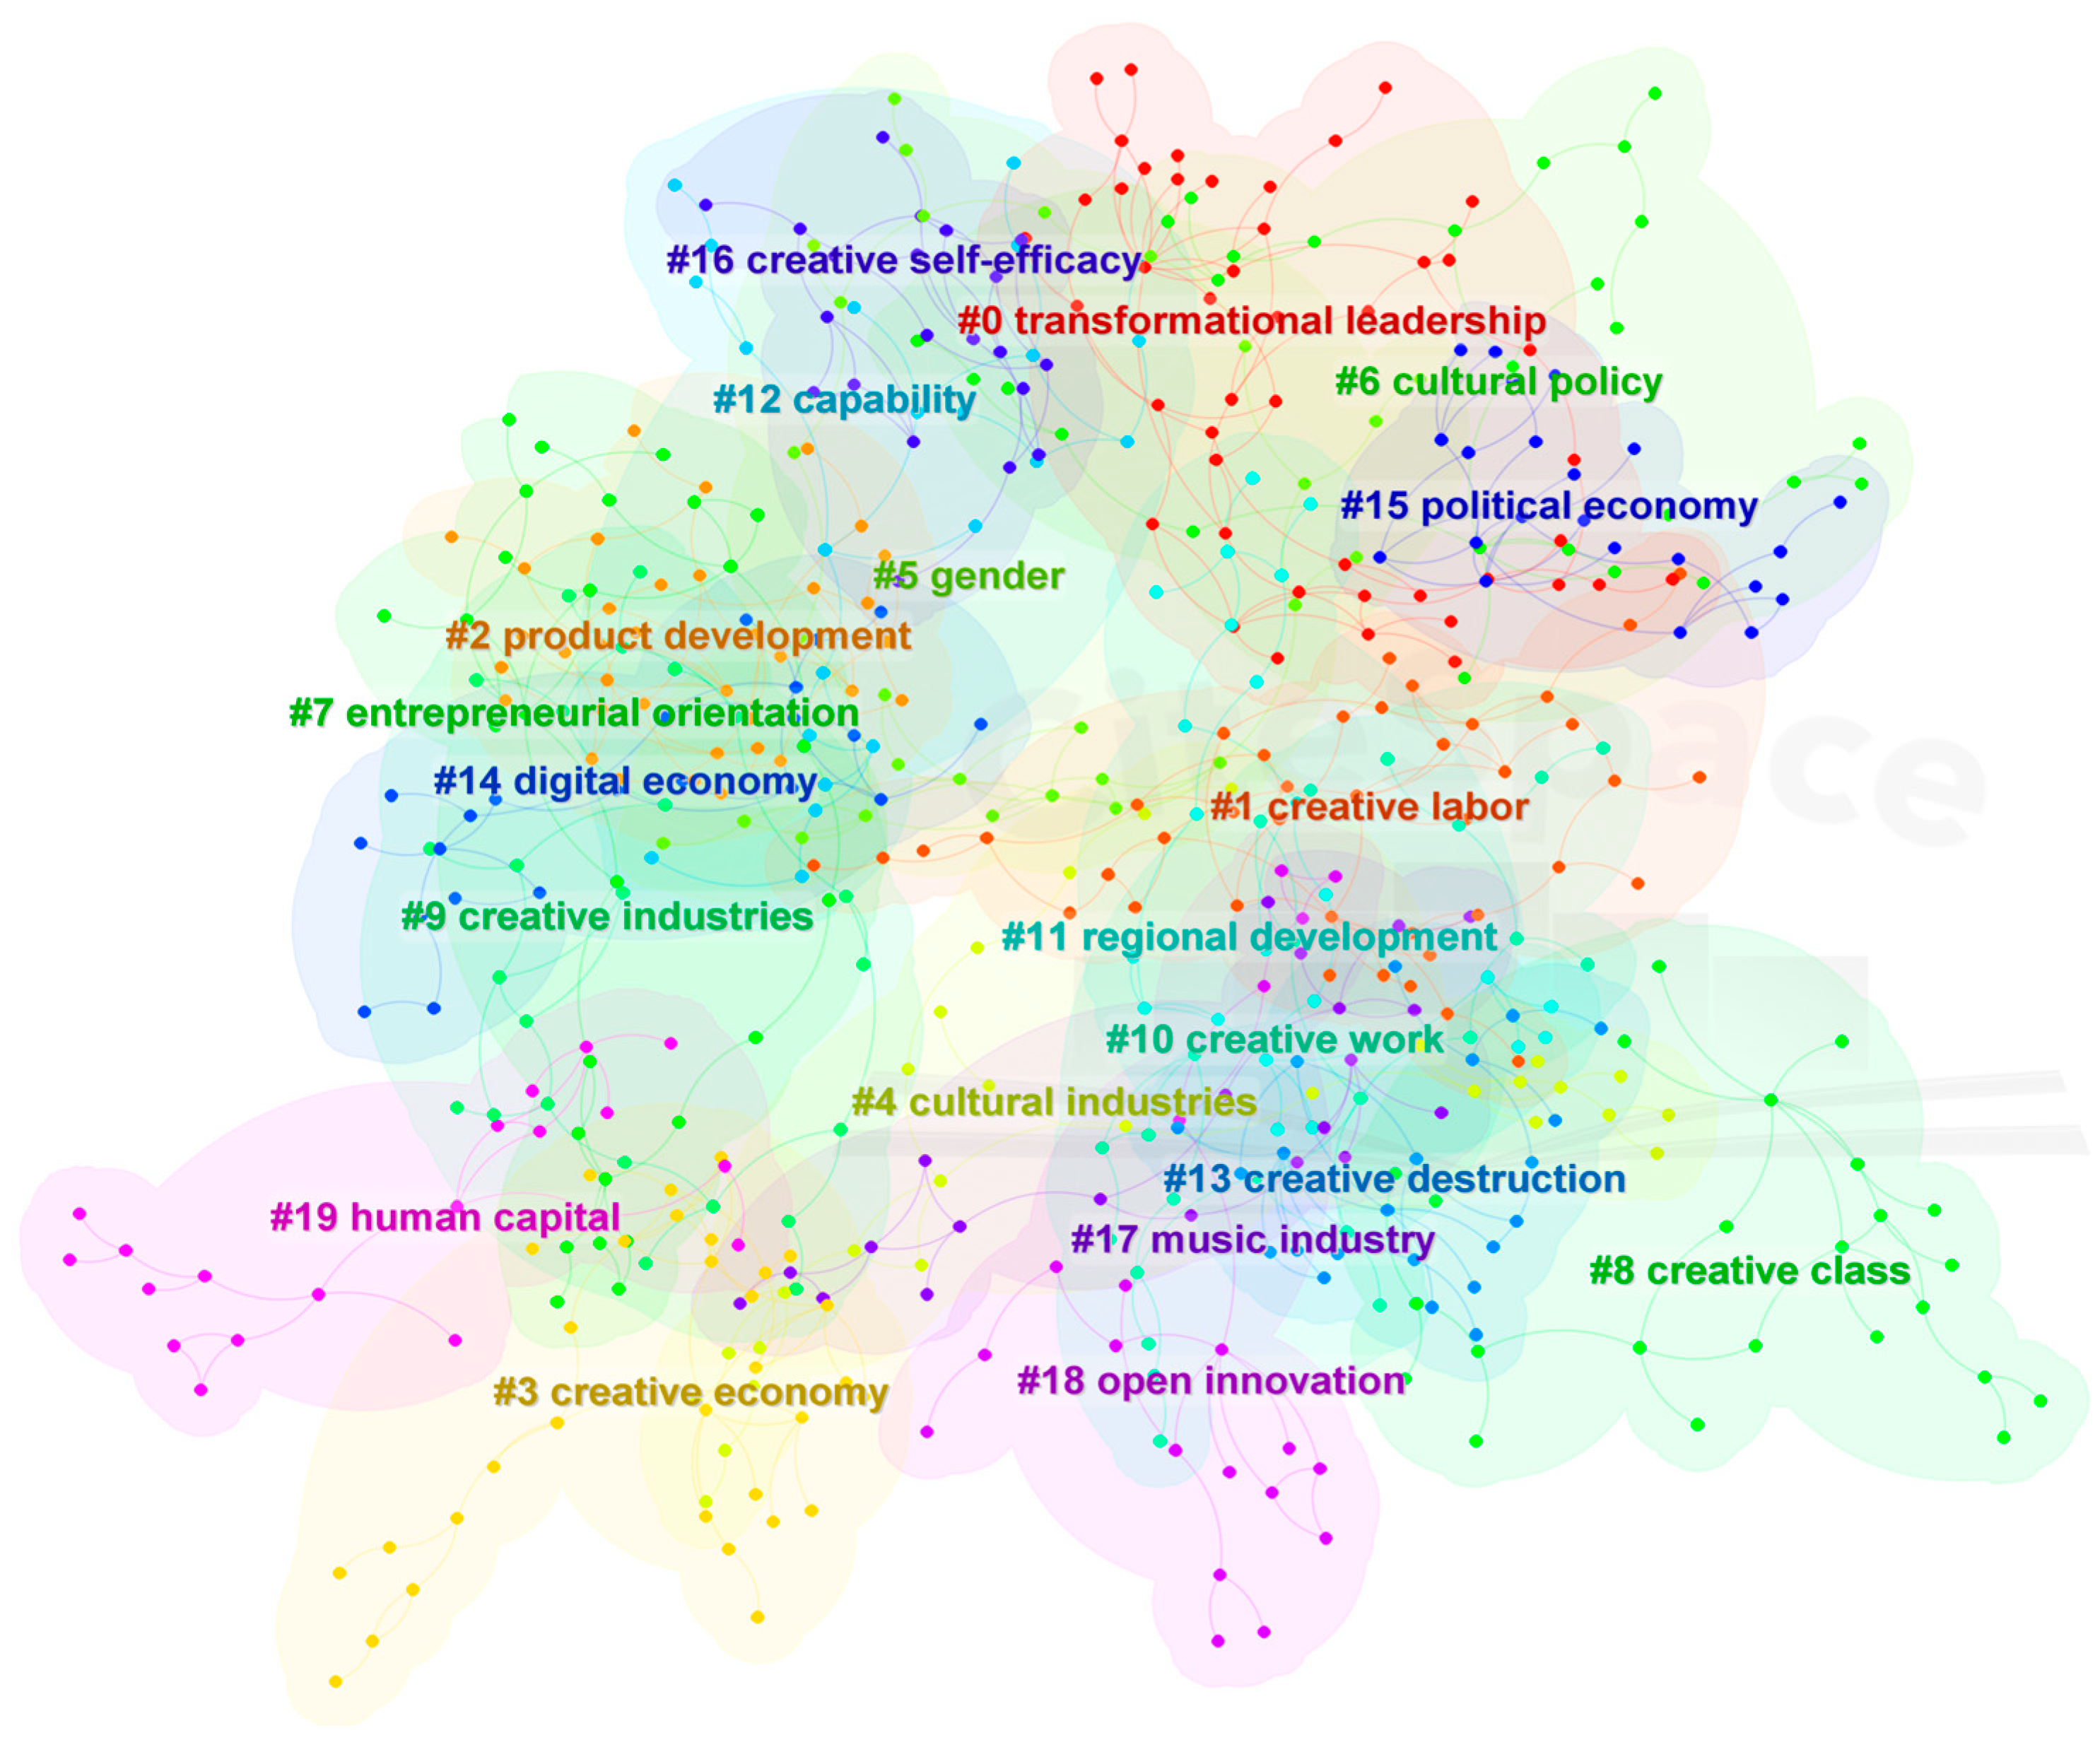
3.1.2. Visualization and Analysis
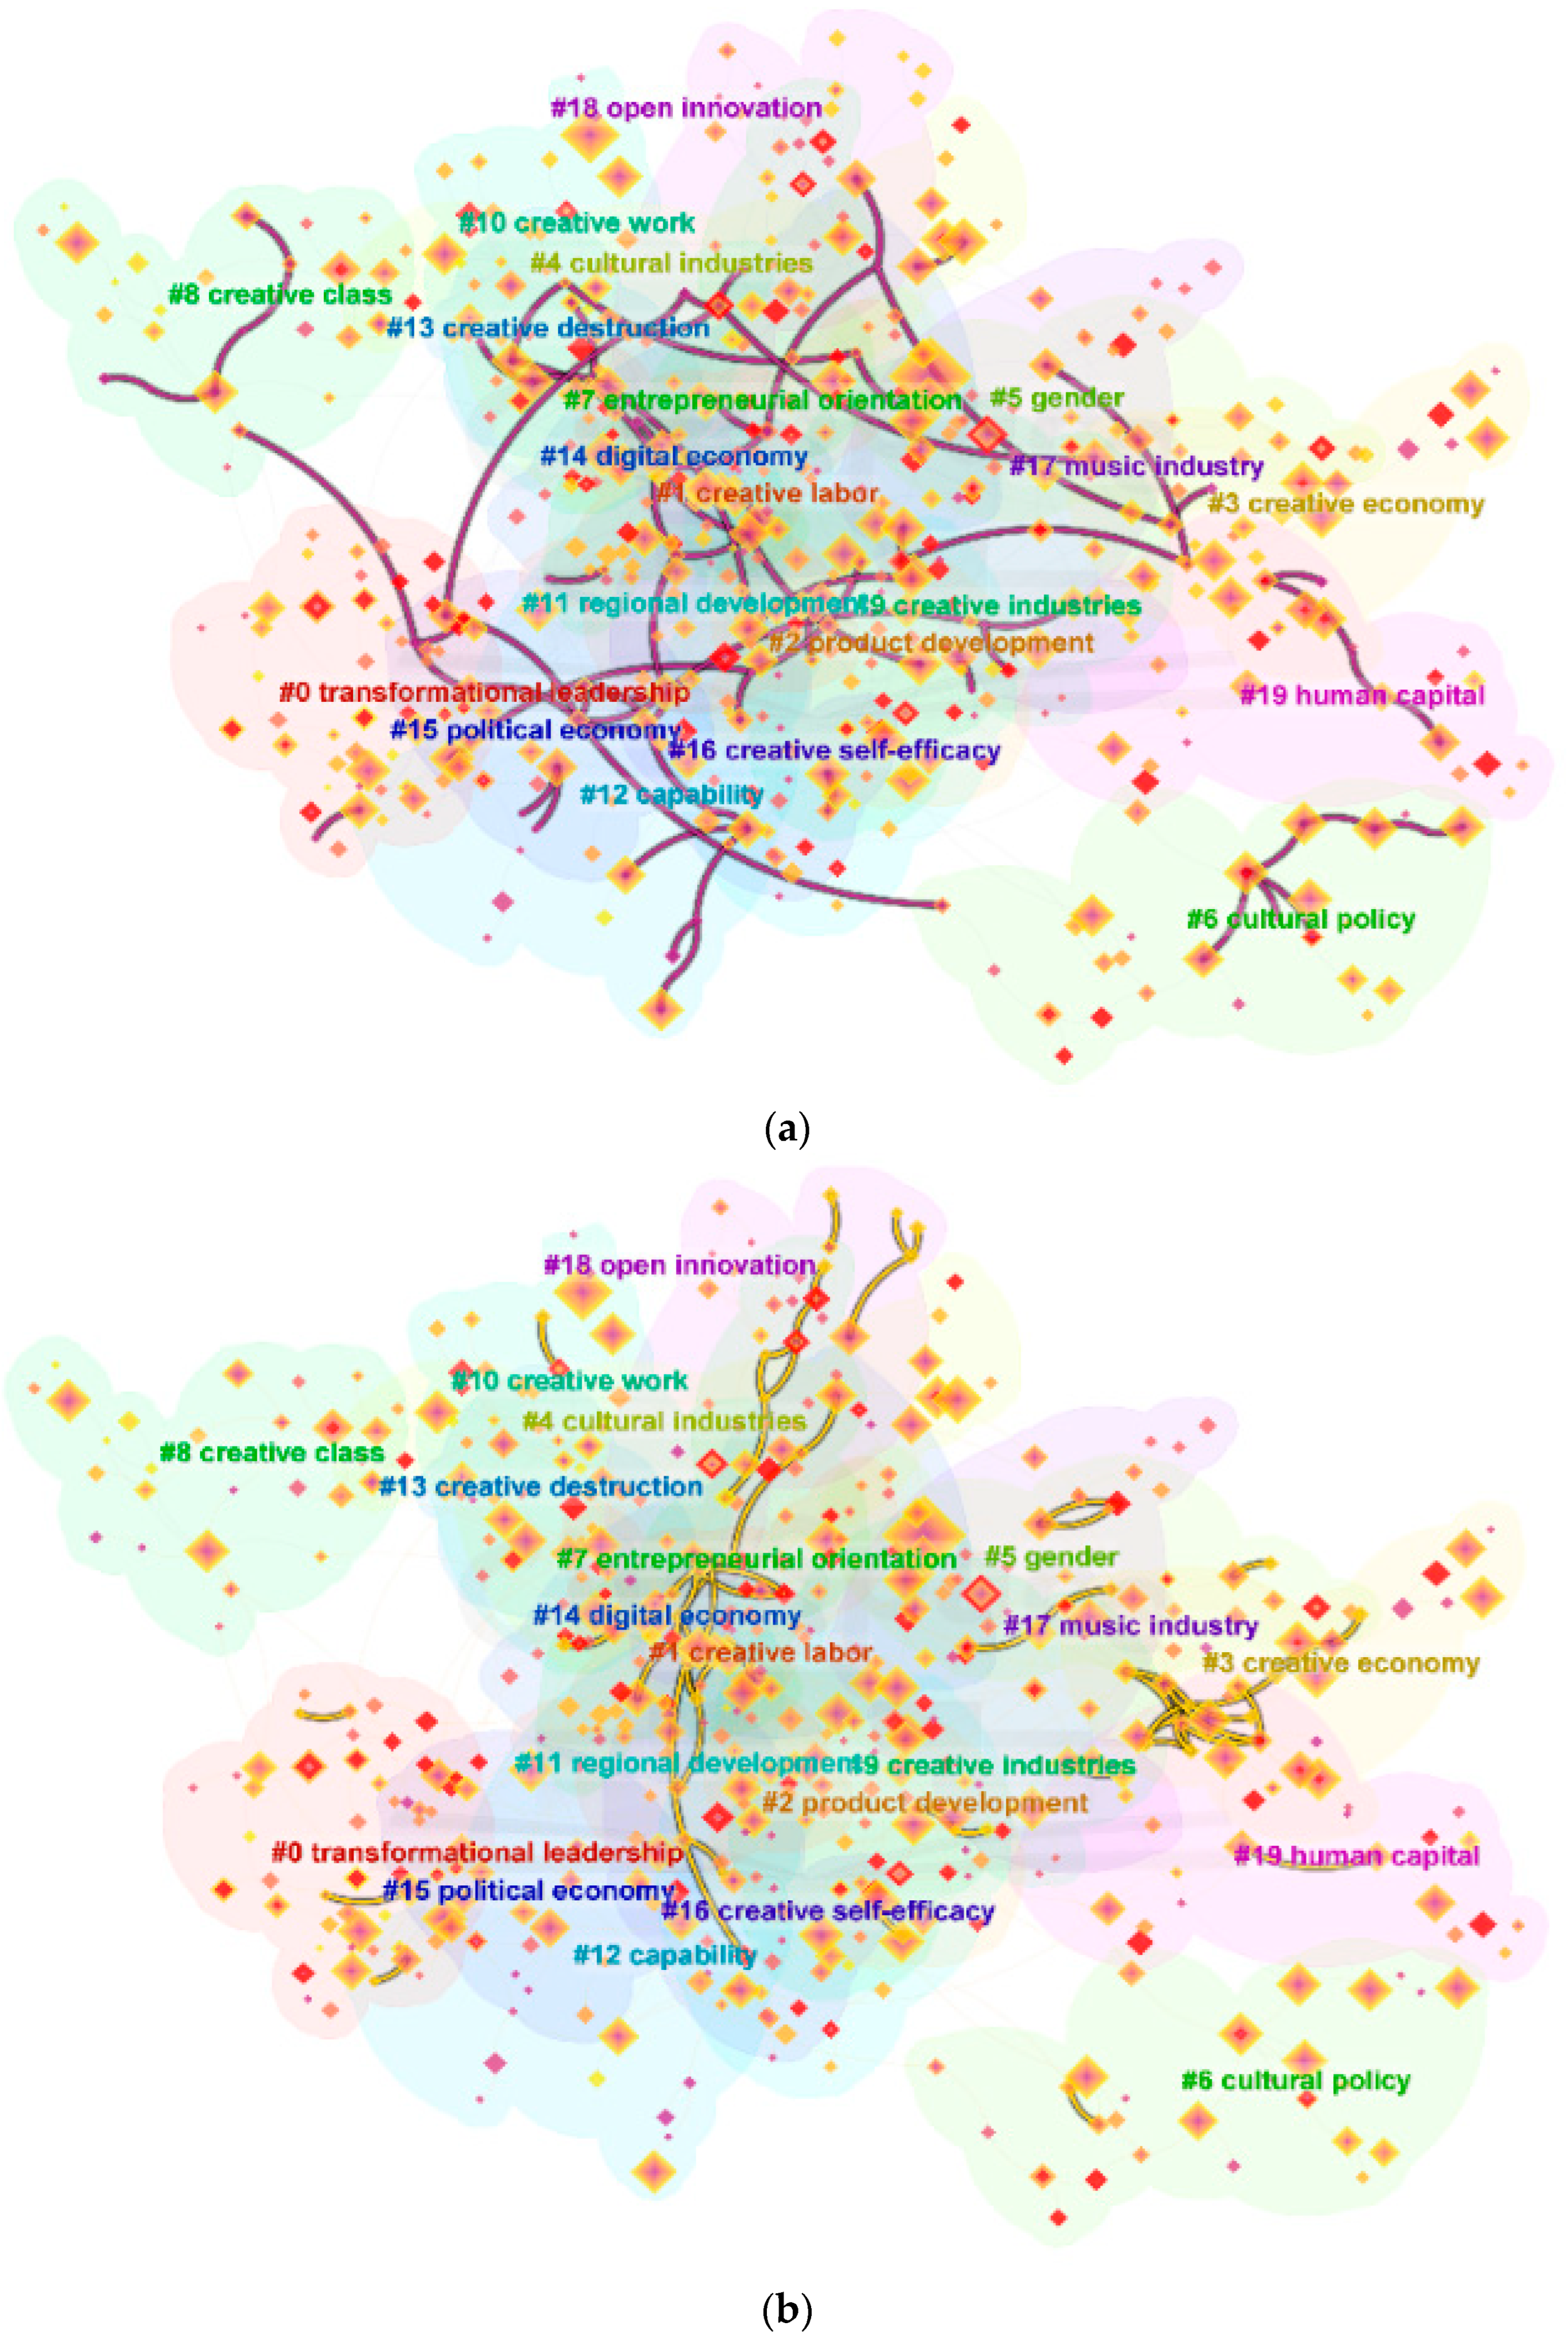
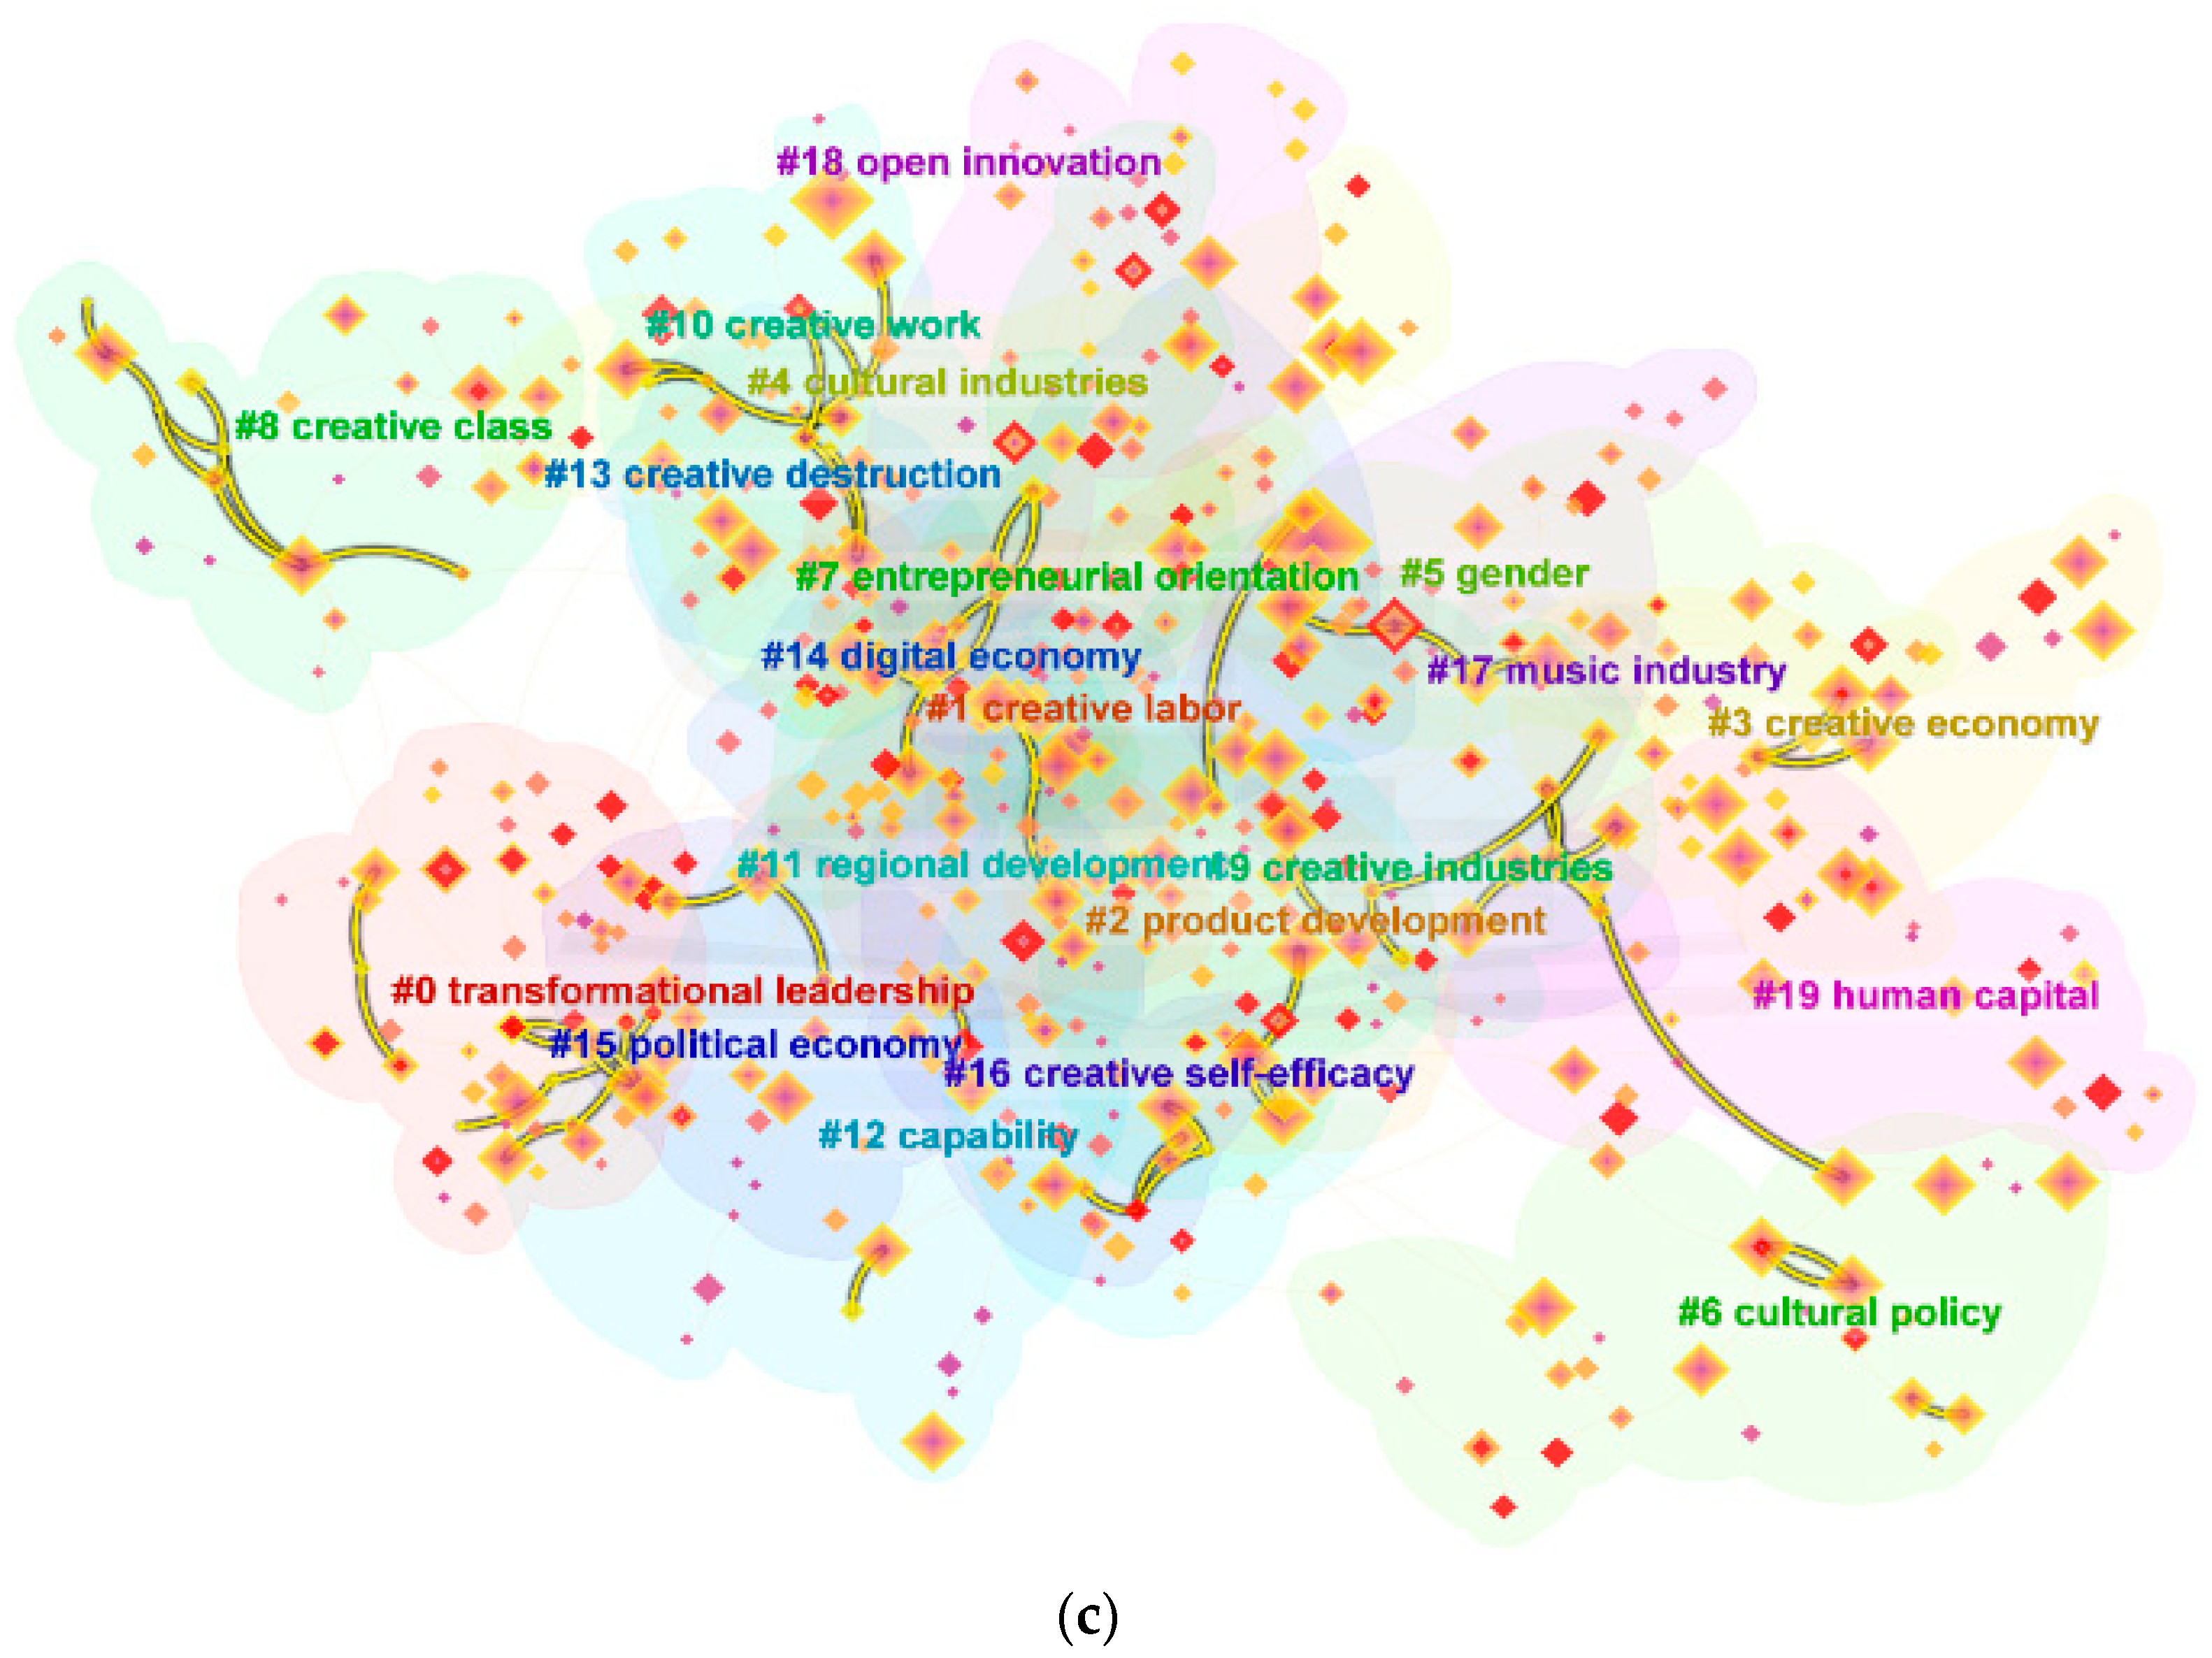
3.1.3. Timeline View
3.2. Cultural Values and Cultural Consumption Market Survey
3.2.1. Data Collection
3.2.2. Descriptive Statistics and Analysis
3.2.3. AMOS Fitness Analysis
4. Results
4.1. The Mediating Effect of Cultural Innovation on Cultural Sustainability
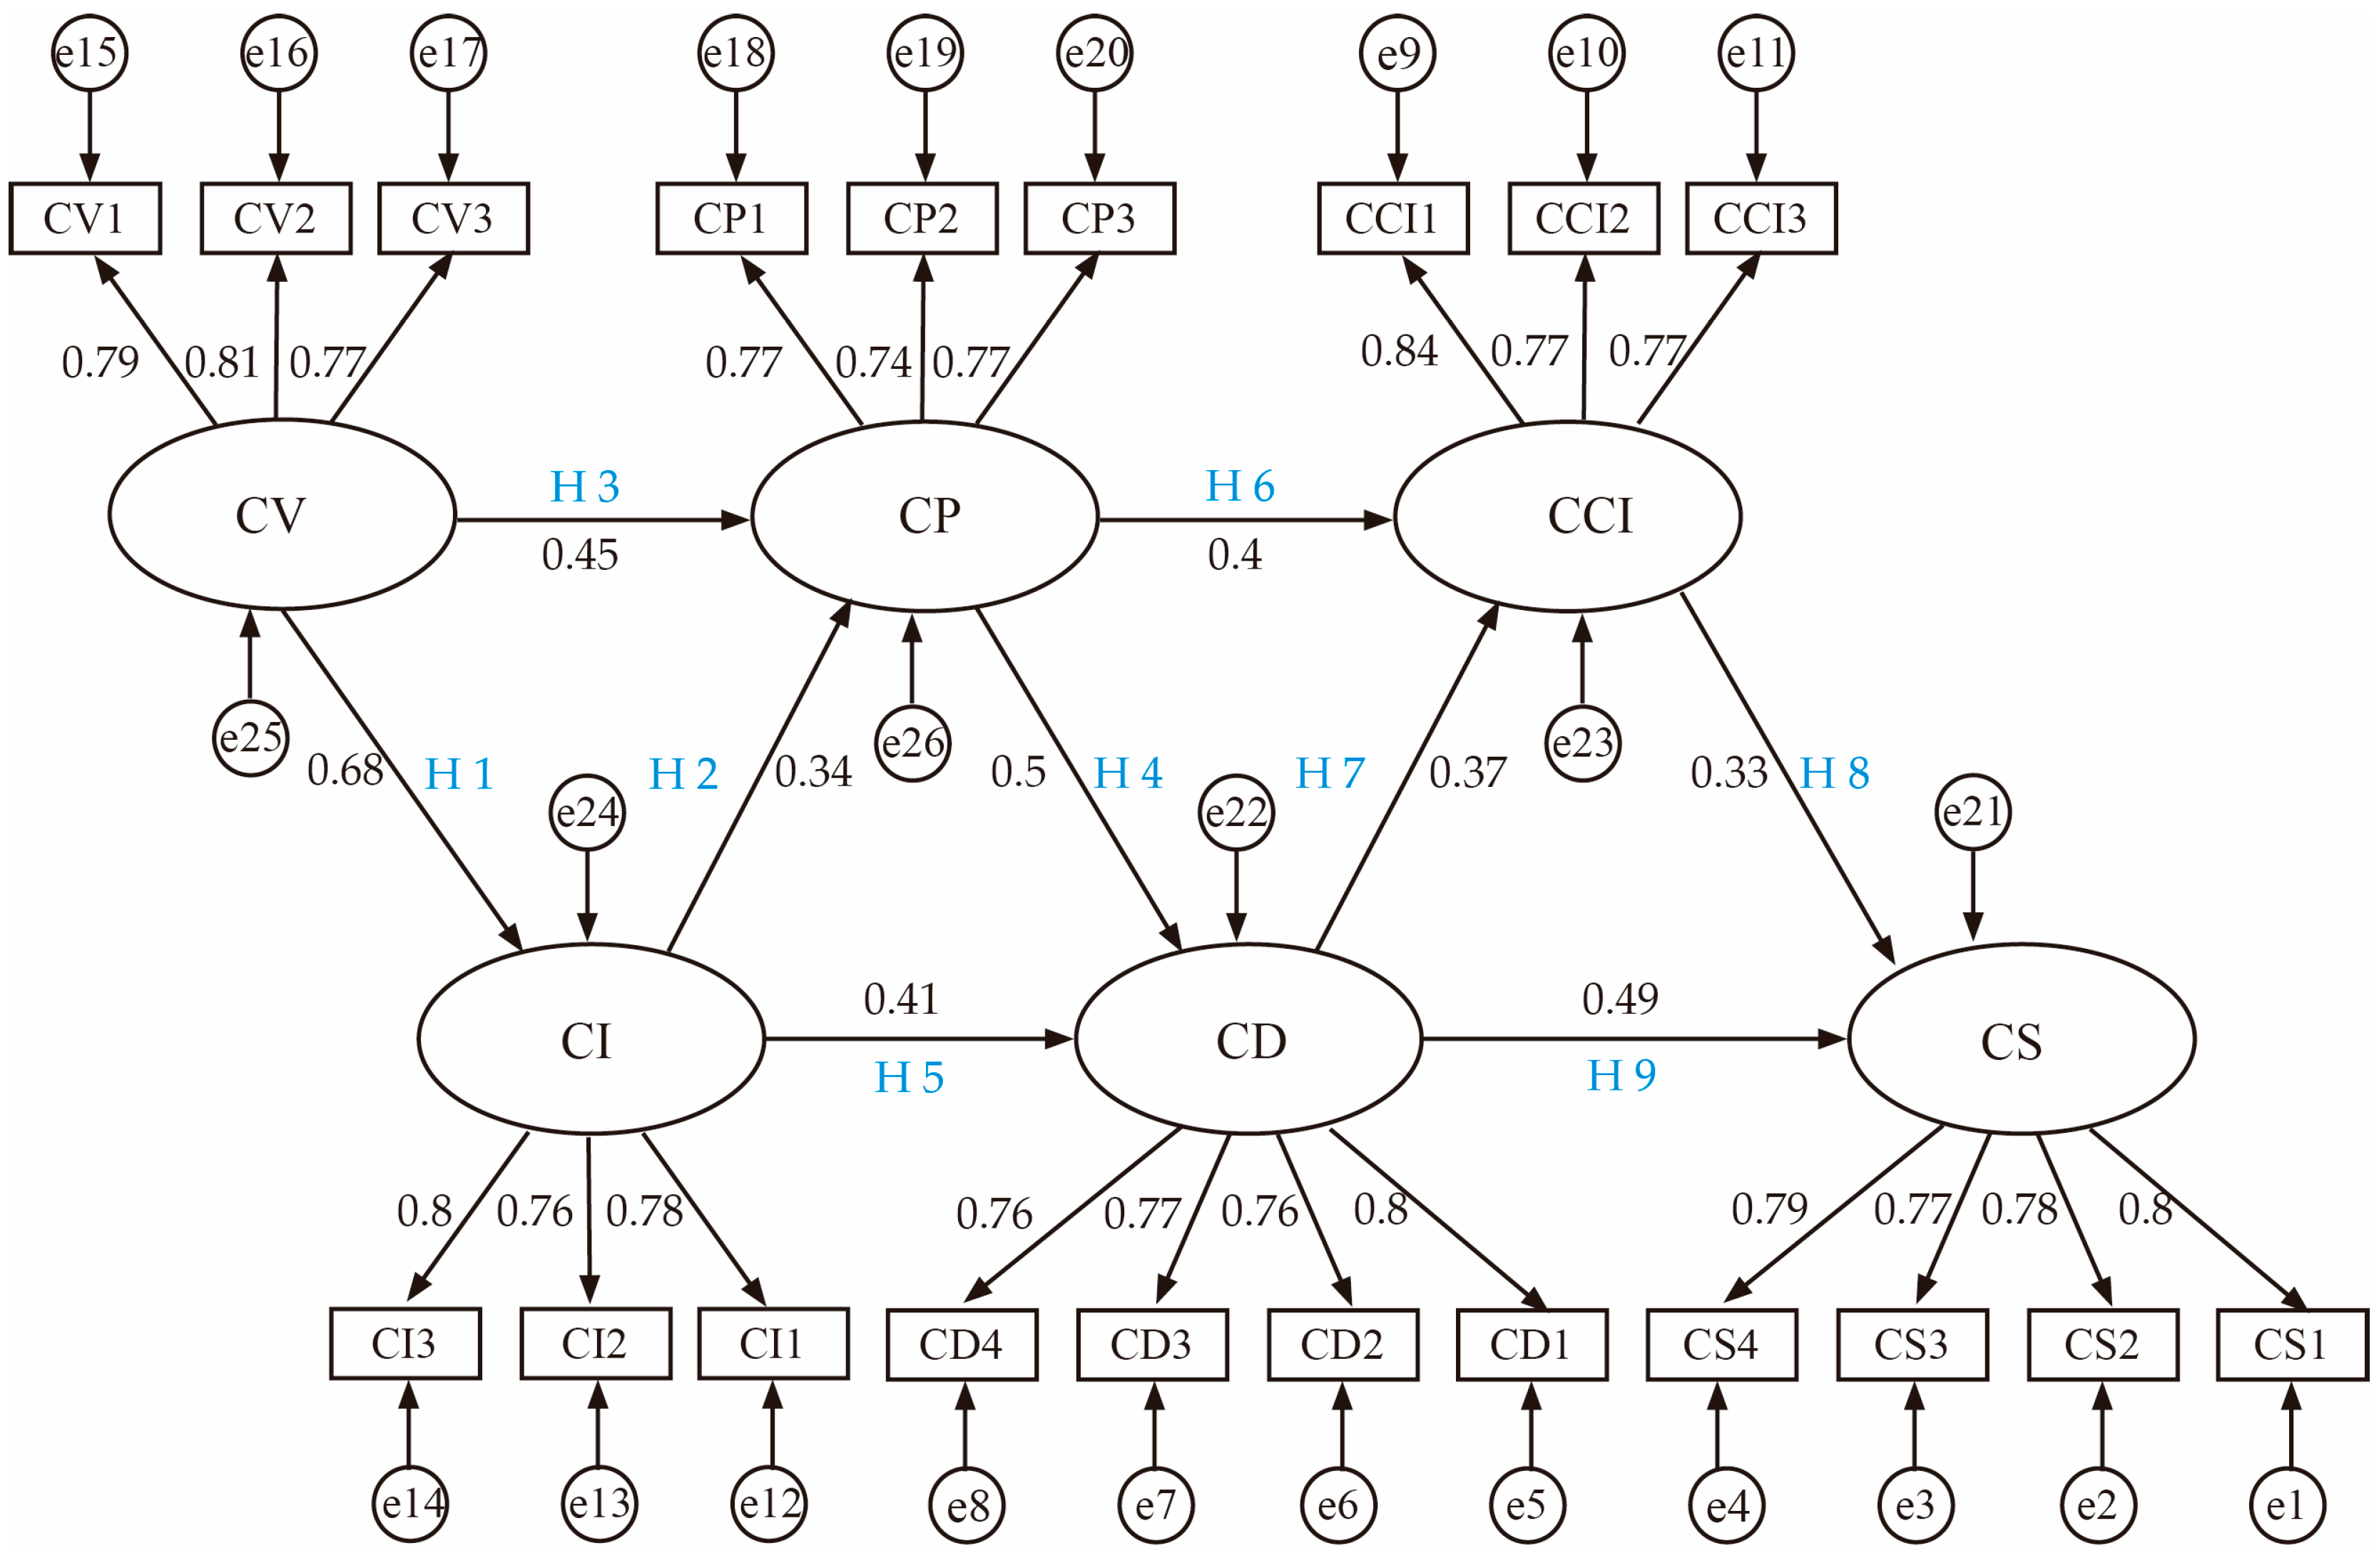
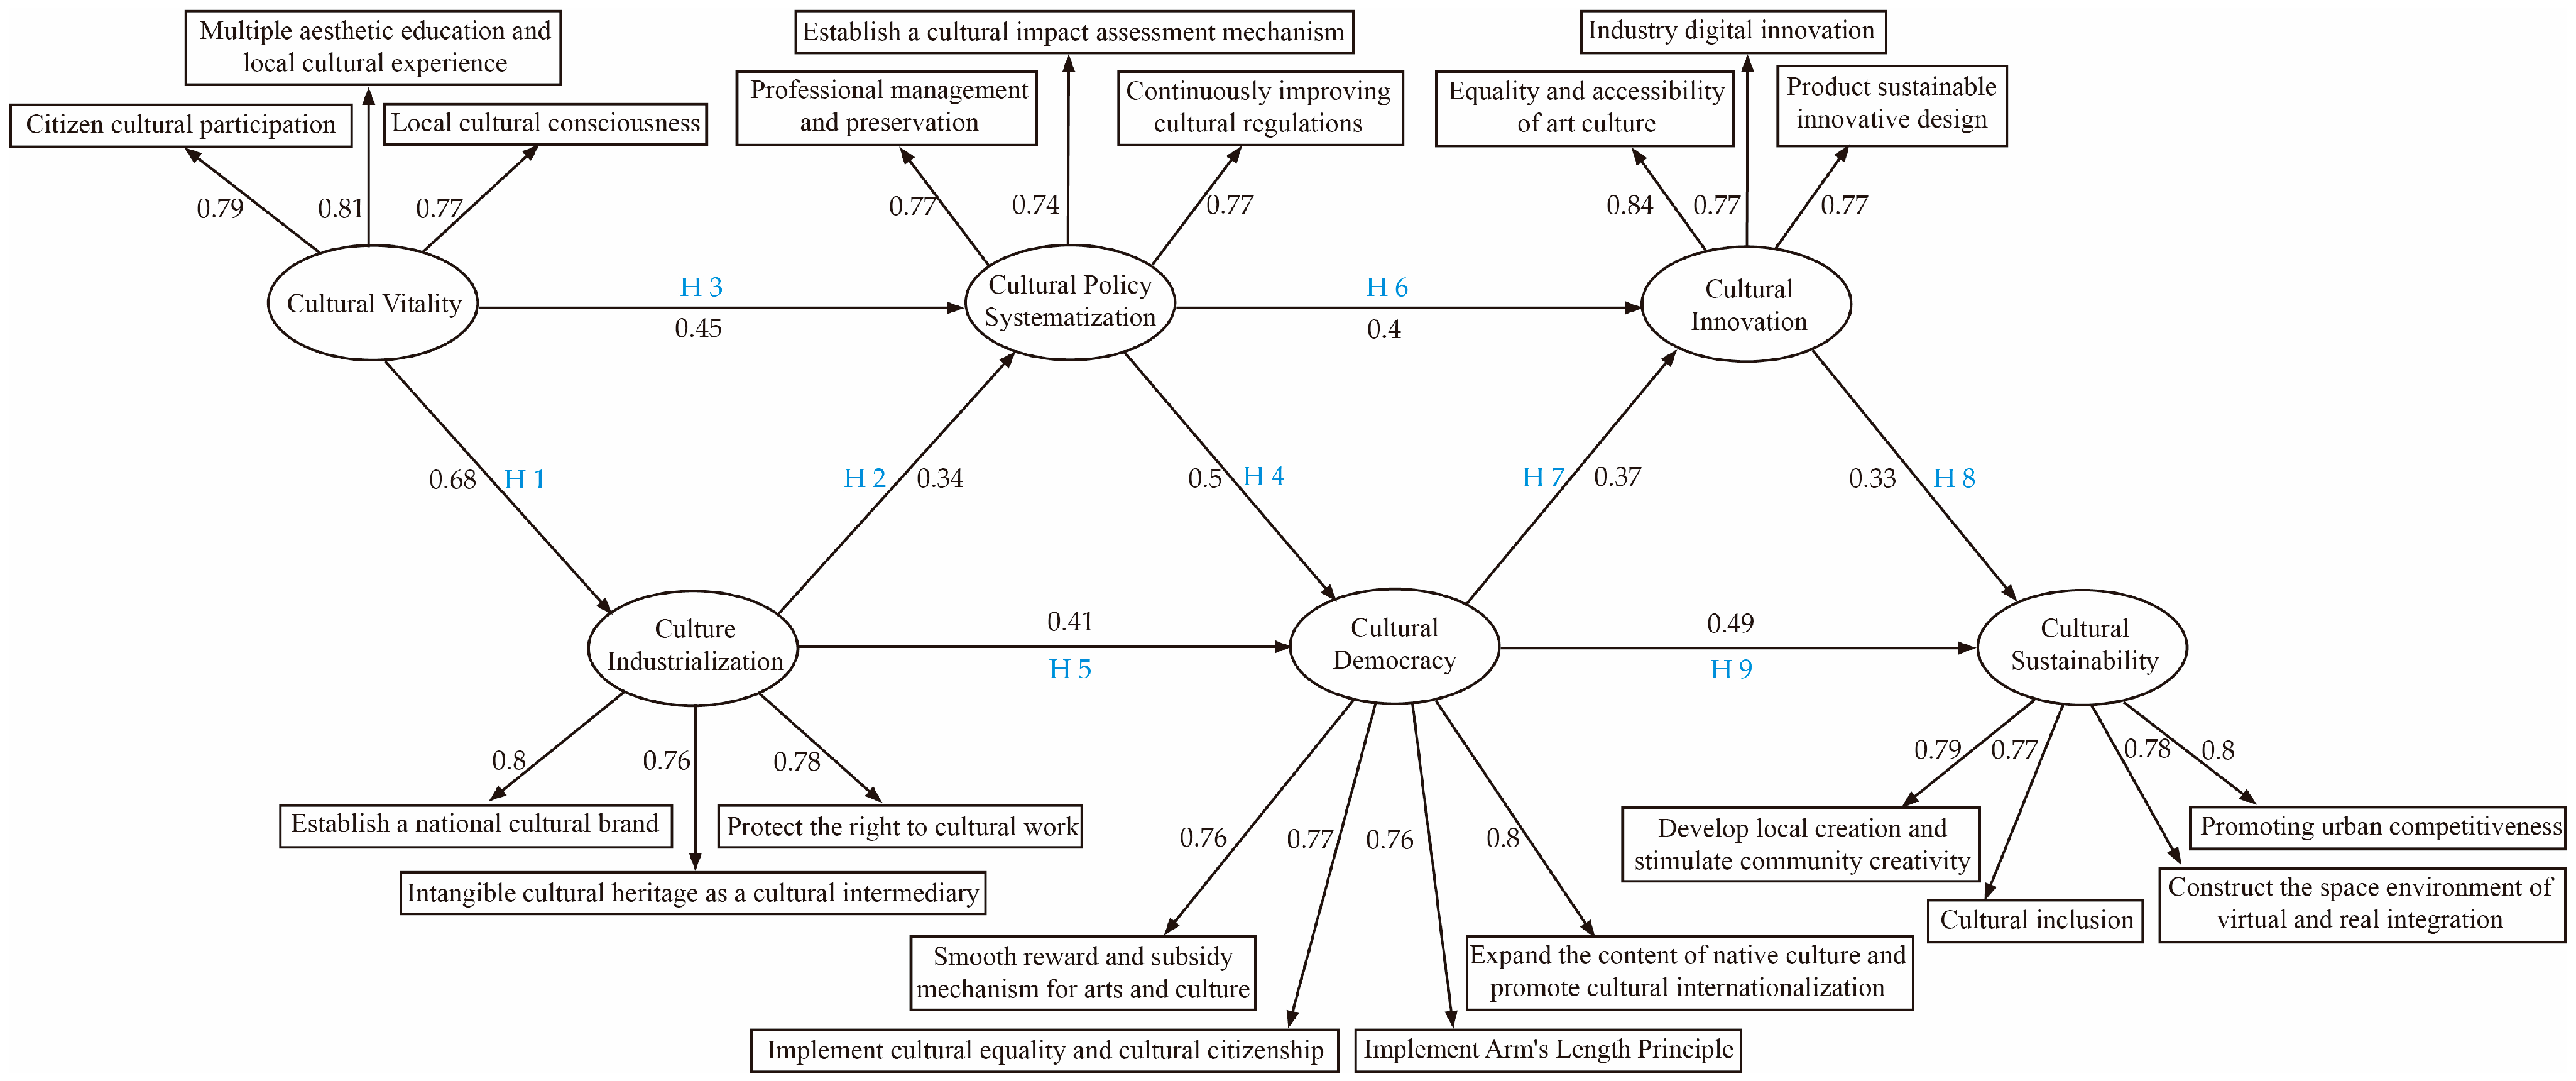
- The total effect value of CCI on CP was 0.396, the direct effect value was 0.396, the indirect effect value was 0.185, the mediating interval [0.205,0.626] did not include 0, and the p-value was 0.012. CCI ← CP had a complete mediating effect;
- The total effect value of CCI on CD was 0.37, the direct effect value was 0.37, the mediating interval [0.105,0.535] did not include 0, and the p-value was 0.05. CCI ← CD had a partial mediating effect;
- The total effect value of CD on CP was 0.499, the direct effect value was 0.05, the mediating interval [0.349,0.618] did not include 0, and the p-value was 0.016. CD ← CP had a partial mediating effect. The mediating effect of CCI ← CD ← CP was established;
- The direct effect value of CI on CP was 0.34, and the direct effect value of CV on CI was 0.679. The indirect effect value of CV on CP was 0.45, and the indirect effect value of CI on CP was 0.34. The mediating effect of CP ← CI ← CV was established.
4.2. Flexible Cultural Development Impact Indicators
4.3. Comparison of Cultural Impact Indicators under the Framework of Cultural Governance
5. Conclusions and Discussion
5.1. The Sustainability of a Cultural Economic Ecosystem
5.2. Research Contribution
5.3. Research Limitations and Future Work
Author Contributions
Funding
Institutional Review Board Statement
Informed Consent Statement
Data Availability Statement
Conflicts of Interest
Appendix A
| Cluster ID | Size | Silhouette | Mean (Year) | Label by LSI (Latent Semantic Indexing) | Label by LLR (Log-Likelihood Ratio, p = 0.0001) |
|---|---|---|---|---|---|
| 0 | 46 | 0.882 | 2016 | transformational leadership; transactional leadership; dialectical thinking; leadership comparison; green process innovation | employee creativity; hindrance-related stress; challenge-related stress; supervisory task feedback; voice theory | (79.42, 0.0001) transformational leadership (58.65, 0.0001) employee creativity (38.48, 0.0001) knowledge sharing (35.7, 0.0001 creative self-efficacy (30.06, 0.0001) creativity |
| 1 | 41 | 0.915 | 2015 | creative industries; creative city; city branding; tourism labour migrant; pharmaceutical industry | creative labor; creative city policy; tourism labour migrant; pharmaceutical industry; creative cluster | (50.44, 0.0001) creative labour (17.58, 0.0001) creative thinking (17.58, 0.0001) precariat (16.58, 0.0001) work (16, 0.0001) digital media |
| 2 | 36 | 0.823 | 2016 | creative industries; manufacturing industries; developing country; information technology; cultural diversity | design thinking; product development; stakeholders engagement; green innovation; medium size enterprises | (28.82, 0.0001) product development (24.53, 0.0001) design thinking (21.04, 0.0001) competitive advantage (20.31, 0.0001) information technology (20.31, 0.0001) absorptive capacity |
| 3 | 32 | 0.965 | 2015 | creative economy; human capital; regression analysis; intellectual activity; adaptive resilience | creative industries; creative city; city branding; adaptive resilience; night-time economy | (103.54, 0.0001) creative economy (50.42, 0.0001) creative city (42.06, 0.0001) economic development (29.49, 0.0001) higher education (28.79, 0.0001) creative cities |
| 4 | 29 | 0.87 | 2016 | creative industries; entertainment industries; urban growth machine; text analysis; planning culture | creative economy; creative city; cultural economy; economic development; cultural policy | (38.85, 0.0001) cultural industries (34.49, 0.0001) urban development (27.63, 0.0001) cultural industry (22.2, 0.0001) urban (19.17, 0.0001) city |
| 5 | 28 | 0.964 | 2016 | creative industries; social networks; informal economy; radical innovation; creativity method | city; place; economy; geography; neighborhood | (21.88, 0.0001) gender (13.05, 0.001) gender inequality; (13.05, 0.001) production; (13.05, 0.001) intersectionality; (13.05, 0.001) feminism |
| 6 | 27 | 0.933 | 2014 | creative industries; emotional labour; urban growth machine; night-time economy; pink accounts | cultural policy; creative ecosystem; developing countries; digital industries; inter-organizational learning | (42.41, 0.0001) cultural policy (31.1, 0.0001) south Africa (30.16, 0.0001) Cultural production (21.9, 0.0001) policy mobilities (18.94, 0.0001) politics |
| 7 | 27 | 0.878 | 2017 | creative performance; gender difference; innovation speed; sensing capability; organizational resources | social media; dynamic capabilities; advertising agency; innovation speed; sensing capability | (33.34, 0.0001) entrepreneurial orientation (29.32, 0.0001) creative performance (22.58, 0.0001) business performance (22.56, 0.0001) social media (21.26, 0.0001) big data |
| 8 | 24 | 0.957 | 2016 | creative class; public policy; location factors; tourism labour migrant; management model | creative industries; labour precarity; primary school age; knowledge-based development; knowledge-intensive businesses | (32.5, 0.0001) creative class (19.82, 0.0001) creative workers (19.82, 0.0001) social networks (14.39, 0.001) digital transformation (12.74, 0.001) multivariate linear regression |
| 9 | 24 | 0.864 | 2014 | creative industries; social networks; informal economy; firm characteristics; techno-creative innovation | creative industry; creative class; creative clusters; creative spaces; mental maps | (188.43, 0.0001) creative industries (53.14, 0.0001) cultural and creative industries (27.55, 0.0001) creative industry (27.21, 0.0001) sustainable development (20.04, 0.0001) Fashion |
| 10 | 23 | 0.938 | 2015 | creative industries; creative work; career management; arts management; team composition | innovation; ecosystem; disruption; strategy; technology | (34.82, 0.0001) creative work (25.81, 0.0001) cultural work (17.8, 0.0001) energy transition (16.35, 0.0001) research and development (11.86, 0.001) O31 |
| 11 | 23 | 0.904 | 2015 | creative industries; cultural tourism; cultural heritage; historical centre; network | regional development; creative class; regional policy; high-growth firms; knowledge base | (36.59, 0.0001) regional development (20.38, 0.0001) creative tourism (19.36, 0.0001) system (19.29, 0.0001) cultural tourism (16.5, 0.0001) cultural heritage |
| 12 | 23 | 0.953 | 2014 | creative industries; information technology; manufacturing industries; developing country; cultural regeneration model | creative economy; policy; city; rethinking; entrepreneurship | (17.53, 0.0001) capability (12.48, 0.001) product (12.48, 0.001) everyday life (12.48, 0.001) technology transfer (12.48, 0.001) tradition |
| 13 | 22 | 0.905 | 2016 | creative destruction; factor reallocation; digital delivery; news production; magazine revenue | business model; digital distribution; decorative marks; symbolic production; process innovations | (58.11, 0.0001) creative destruction (22.38, 0.0001) sharing economy (22.38, 0.0001) disruptive innovation (19.62, 0.0001) law (19.62, 0.0001) intellectual property |
| 14 | 22 | 0.86 | 2016 | knowledge economy; innovation district; place quality; delphi method; artificial neural network | knowledge-based urban development; knowledge industry; knowledge worker; urban competitiveness; artificial neural network | (26.56, 0.0001) digital economy (25.71, 0.0001) knowledge economy (25.15, 0.0001) knowledge-based urban development (22.79, 1.0 × 10⁻⁴) artificial intelligence (22.64, 1.0 × 10⁻⁴) industry 4.0 |
| 15 | 22 | 0.934 | 2014 | political economy; climate change; emissions trading; instrument choice; environmental economics | creative industries; cultural industries; cultural economics; innovation policy; soft innovation | (85.98, 0.0001) political economy (13.35, 0.001) climate change (13.27, 0.001) firm (13.17, 0.001) new media (13.17, 0.001) outsourcing |
| 16 | 21 | 0.929 | 2017 | creative self-efficacy; job satisfaction; hotel industry; organizational support; knowledge transfer | innovative behavior; task interdependence; resources theory; in-role behavior; three-way interaction | (37.78, 0.0001) creative self-efficacy (27.32, 0.0001) creative industries (14.51, 0.001) human resource management (14.08, 0.001) phenomenology (14.08, 0.001) servant leadership |
| 17 | 21 | 0.865 | 2014 | creative industries; creative work; music journalism; unpaid work; survie des nouvelles entreprises | music industry; social network service; music journalism; unpaid work; survie des nouvelles entreprises | (64.67, 0.0001) music industry (29.39, 0.0001) popular music (26.78, 0.0001) new economy (18.8, 0.0001) music industries (13.37, 0.001) digital technology |
| 18 | 20 | 0.94 | 2017 | open innovation; knowledge-based engineering; manufacturing process innovation; knowledge management; collective intelligence | satisfaction; performance; mediating role; physical environment; innovation | (20.99, 0.0001) open innovation (19.41, 0.0001) value co-creation (14.97, 0.001) service design (14.39, 0.001) tourist experience (13.81, 0.001) creative industries |
| 19 | 20 | 0.883 | 2015 | human capital; creative class; regional economics; labour market; entrepreneurial discovery process | economic growth; reflexive capitalism; smart specialisation; entrepreneurial discovery process; secular stagnation | (43.32, 0.0001) human capital (17.14, 0.0001) economic growth (15.51, 0.0001) 21st-century skills (13.76, 0.001) creative industries (13.36, 0.001) intellectual capital |
References
- Dominic, P. Culture, Creativity and Experience in Nordic and Scandinavian Cultural Policy. Int. J. Cult. Policy 2009, 15, 445–460. [Google Scholar] [CrossRef]
- Chang, Y.H. History of cultural and creative industries: A general picture above research constructions. Artist. TNNUA 2014, 9, 77–108. [Google Scholar]
- Liu, J.Y. ReOrient: An East Asian Approach on Cultural Policy and Cultural Governance; Chuliu Book: New Taipei City, Taiwan, 2016; pp. 240–336. [Google Scholar]
- Stuart, H. The Centrality of Culture: Note on the Cultural Revolutions of Our Tine. In Media and Cultural Regulation; Thompson, K., Ed.; Sage: London, UK, 1997; pp. 207–238. [Google Scholar]
- Charles, L. The Creative City: A Tookit for Urban Innovators; Stylus Pub LLC: London, UK, 2000. [Google Scholar]
- UNESCO. UCCN Mission Statement. Available online: https://en.unesco.org/creative-cities/sites/default/files/uccn_mission_statement_rev_nov_2017.pdf (accessed on 4 February 2023).
- UNESCO. Reshaping Cultural Policies—A Decade Promoting the Diversity of Cultural Expressions for Development. Available online: http://uis.unesco.org/sites/default/files/documents/reshaping-cultural-policies-a-decade-promoting-the-diversity-of-cultural-expressions-for-development-2015-en_0.pdf (accessed on 4 February 2023).
- Crossick, G.; Kaszynska, P. Understanding the Value of Arts & Culture: The AHRC Cultural Value Project. Available online: https://www.ukri.org/wp-content/uploads/2021/11/AHRC-291121-UnderstandingTheValueOfArts-CulturalValueProjectReport.pdf (accessed on 4 February 2023).
- Liu, J.Y.; Huang, S.M.; Huang, W.R. Available online: https://www.ncafroc.org.tw/files/official/5-3%E5%B0%88%E9%A1%8C%E5%A0%B1%E5%91%8A_%E8%87%BA%E7%81%A3%E6%96%87%E5%8C%96%E5%83%B9%E5%80%BC%E5%85%88%E6%9C%9F%E8%AA%BF%E6%9F%A5%E7%A0%94%E7%A9%B6.pdf (accessed on 4 February 2023).
- Yan, W.-J.; Li, K.-R. Sustainable Cultural Innovation Practice: Heritage Education in Universities and Creative Inheritance of Intangible Cultural Heritage Craft. Sustainability 2023, 15, 1194. [Google Scholar] [CrossRef]
- Daubaraite, U.; Startiene, G. Creative Industries Impact on National Economy in Regard to Sub-sectors. Procedia Soc. Behav. Sci. 2015, 213, 129–134. [Google Scholar] [CrossRef]
- Pappalepore, I.; Maitland, R.; Smith, A. Prosuming Creative Urban Areas: Evidence from East London. Ann. Tour. Res. 2014, 44, 227–240. [Google Scholar] [CrossRef]
- Yu, S.H.; Liu, Y.L. Comprehensive evaluation of global creative industry trade quality. J. Hunan Univ. 2017, 31, 85–92. [Google Scholar]
- Wang, T.; Si, Y.N.; Yuan, X.P. The Development Efficiency and Regional Differences of China’s Cultural and Creative Industries: An Analysis Based on Malmquist Index. Times Econ. Trade 2021, 9, 107–112. [Google Scholar]
- Pan, D.Y. From Technological Change to Creative Drive: The Cultural and Creative Mechanism of the Paradigm Shift of Economic Innovation in the Digital Era. J. Shenzhen Univ. 2020, 37, 74–81. [Google Scholar]
- Liao, H.; Li, C.L. A Review of Research on the Integration of Domestic Tourism and Cultural and Creative Industries Based on CiteSpace. J. Wuhan Bus. Univ. 2022, 36, 32–37. [Google Scholar]
- Wang, K.G. Knowledge of cultural and creative products (I). Forbid. City 2022, 3, 153–159. [Google Scholar]
- UNESCO. Culture for Development Indicators: Methodology Manual. Available online: https://unesdoc.unesco.org/ark:/48223/pf0000229608.locale=zh (accessed on 4 February 2023).
- UNESCO. Building Resilient and Sustainable Cultural and Creative Sectors. Available online: https://cultureactioneurope.org/files/2022/02/380474eng.pdf (accessed on 4 February 2023).
- UNESCO. Cultural and Creative Industries in the Face of COVID-19: An Economic Impact Outlook. Available online: https://unesdoc.unesco.org/ark:/48223/pf0000377863 (accessed on 4 February 2023).
- UNESCO. Culture and Sustainable Development: A Still Untapped Potential. Available online: https://unesdoc.unesco.org/ark:/48223/pf0000380502 (accessed on 4 February 2023).
- Ferres, K.; Adair, D.; Jones, R.; Cory, M. Vital Signs: Cultural Indicators for Australia. Available online: https://www.arts.qld.gov.au/images/documents/artsqld/Research/Vital_Signs_Report-2014.pdf (accessed on 4 February 2023).
- Jackson, M.R.; Kabwasa-Green, F.; Herranz, J. Cultural Vitality in Communities: Interpretation and Indicators. Available online: https://communityindicators.net/wp-content/uploads/2017/11/311392-Cultural-Vitality-in-Communities-Interpretation-and-Indicators.pdf (accessed on 4 February 2023).
- Mö Aotearoa, T.A. Cultural Indicators for New Zealand. Available online: https://mch.govt.nz/files/CulturalIndicatorsReport.pdf (accessed on 4 February 2023).
- World Values Survey. Values Change the World. Available online: https://www.iffs.se/media/1931/wvs-brochure-web.pdf (accessed on 4 February 2023).
- TAICCA. 2021 Taiwan Cultural and Creative Industries Annual Report. Available online: https://taicca.tw/ (accessed on 4 February 2023).
- Ministry of Culture. 2018 Culture Policy: The White Paper. Available online: https://tttcp.ntua.edu.tw/ (accessed on 4 February 2023).
- Scott, C. Emerging paradigms: National approaches for measuring cultural value. Cult. Trends 2014, 23, 79–81. [Google Scholar] [CrossRef]
- PWC. Global Culture Survey 2021: The Link between Culture and Competitive Advantage. Available online: https://www.pwccn.com/zh/consulting/people-and-organisation/culture-survey-sep2021.pdf (accessed on 4 February 2023).
- Chen, C.M. CiteSpace II: Detecting and visualizing emerging trends and transient patterns in scientific literature. J. Am. Soc. Inf. Sci. Technol. 2006, 57, 359–377. [Google Scholar] [CrossRef]
- Wu, M.L. Structural Equation Model: Operation and Application of AMOS, 2nd ed.; Chongqing University Press: Chongqing, China, 2019. [Google Scholar]
- Wang, C.H. A Conceptual Exploration for an Analytic Framework. Shih Hsin J. Humanit. Soc. 2020, 11, 1–38. [Google Scholar]
- Liu, J.Y. Global Cites Cultural Governance and Cultural Strategies; Chuliu Book: New Taipei City, Taiwan, 2013; pp. 55–78. [Google Scholar]
- Rhodes, R.A.W. Control and Power in Central-Local Government Relations, 2nd ed.; Ashgate Publishing Ltd.: London, UK, 1999. [Google Scholar]
- Holden, J. The Ecology of Culture. Available online: https://publicartonline.org.uk/downloads/news/AHRC%20Ecology%20of%20Culture.pdf (accessed on 4 February 2023).



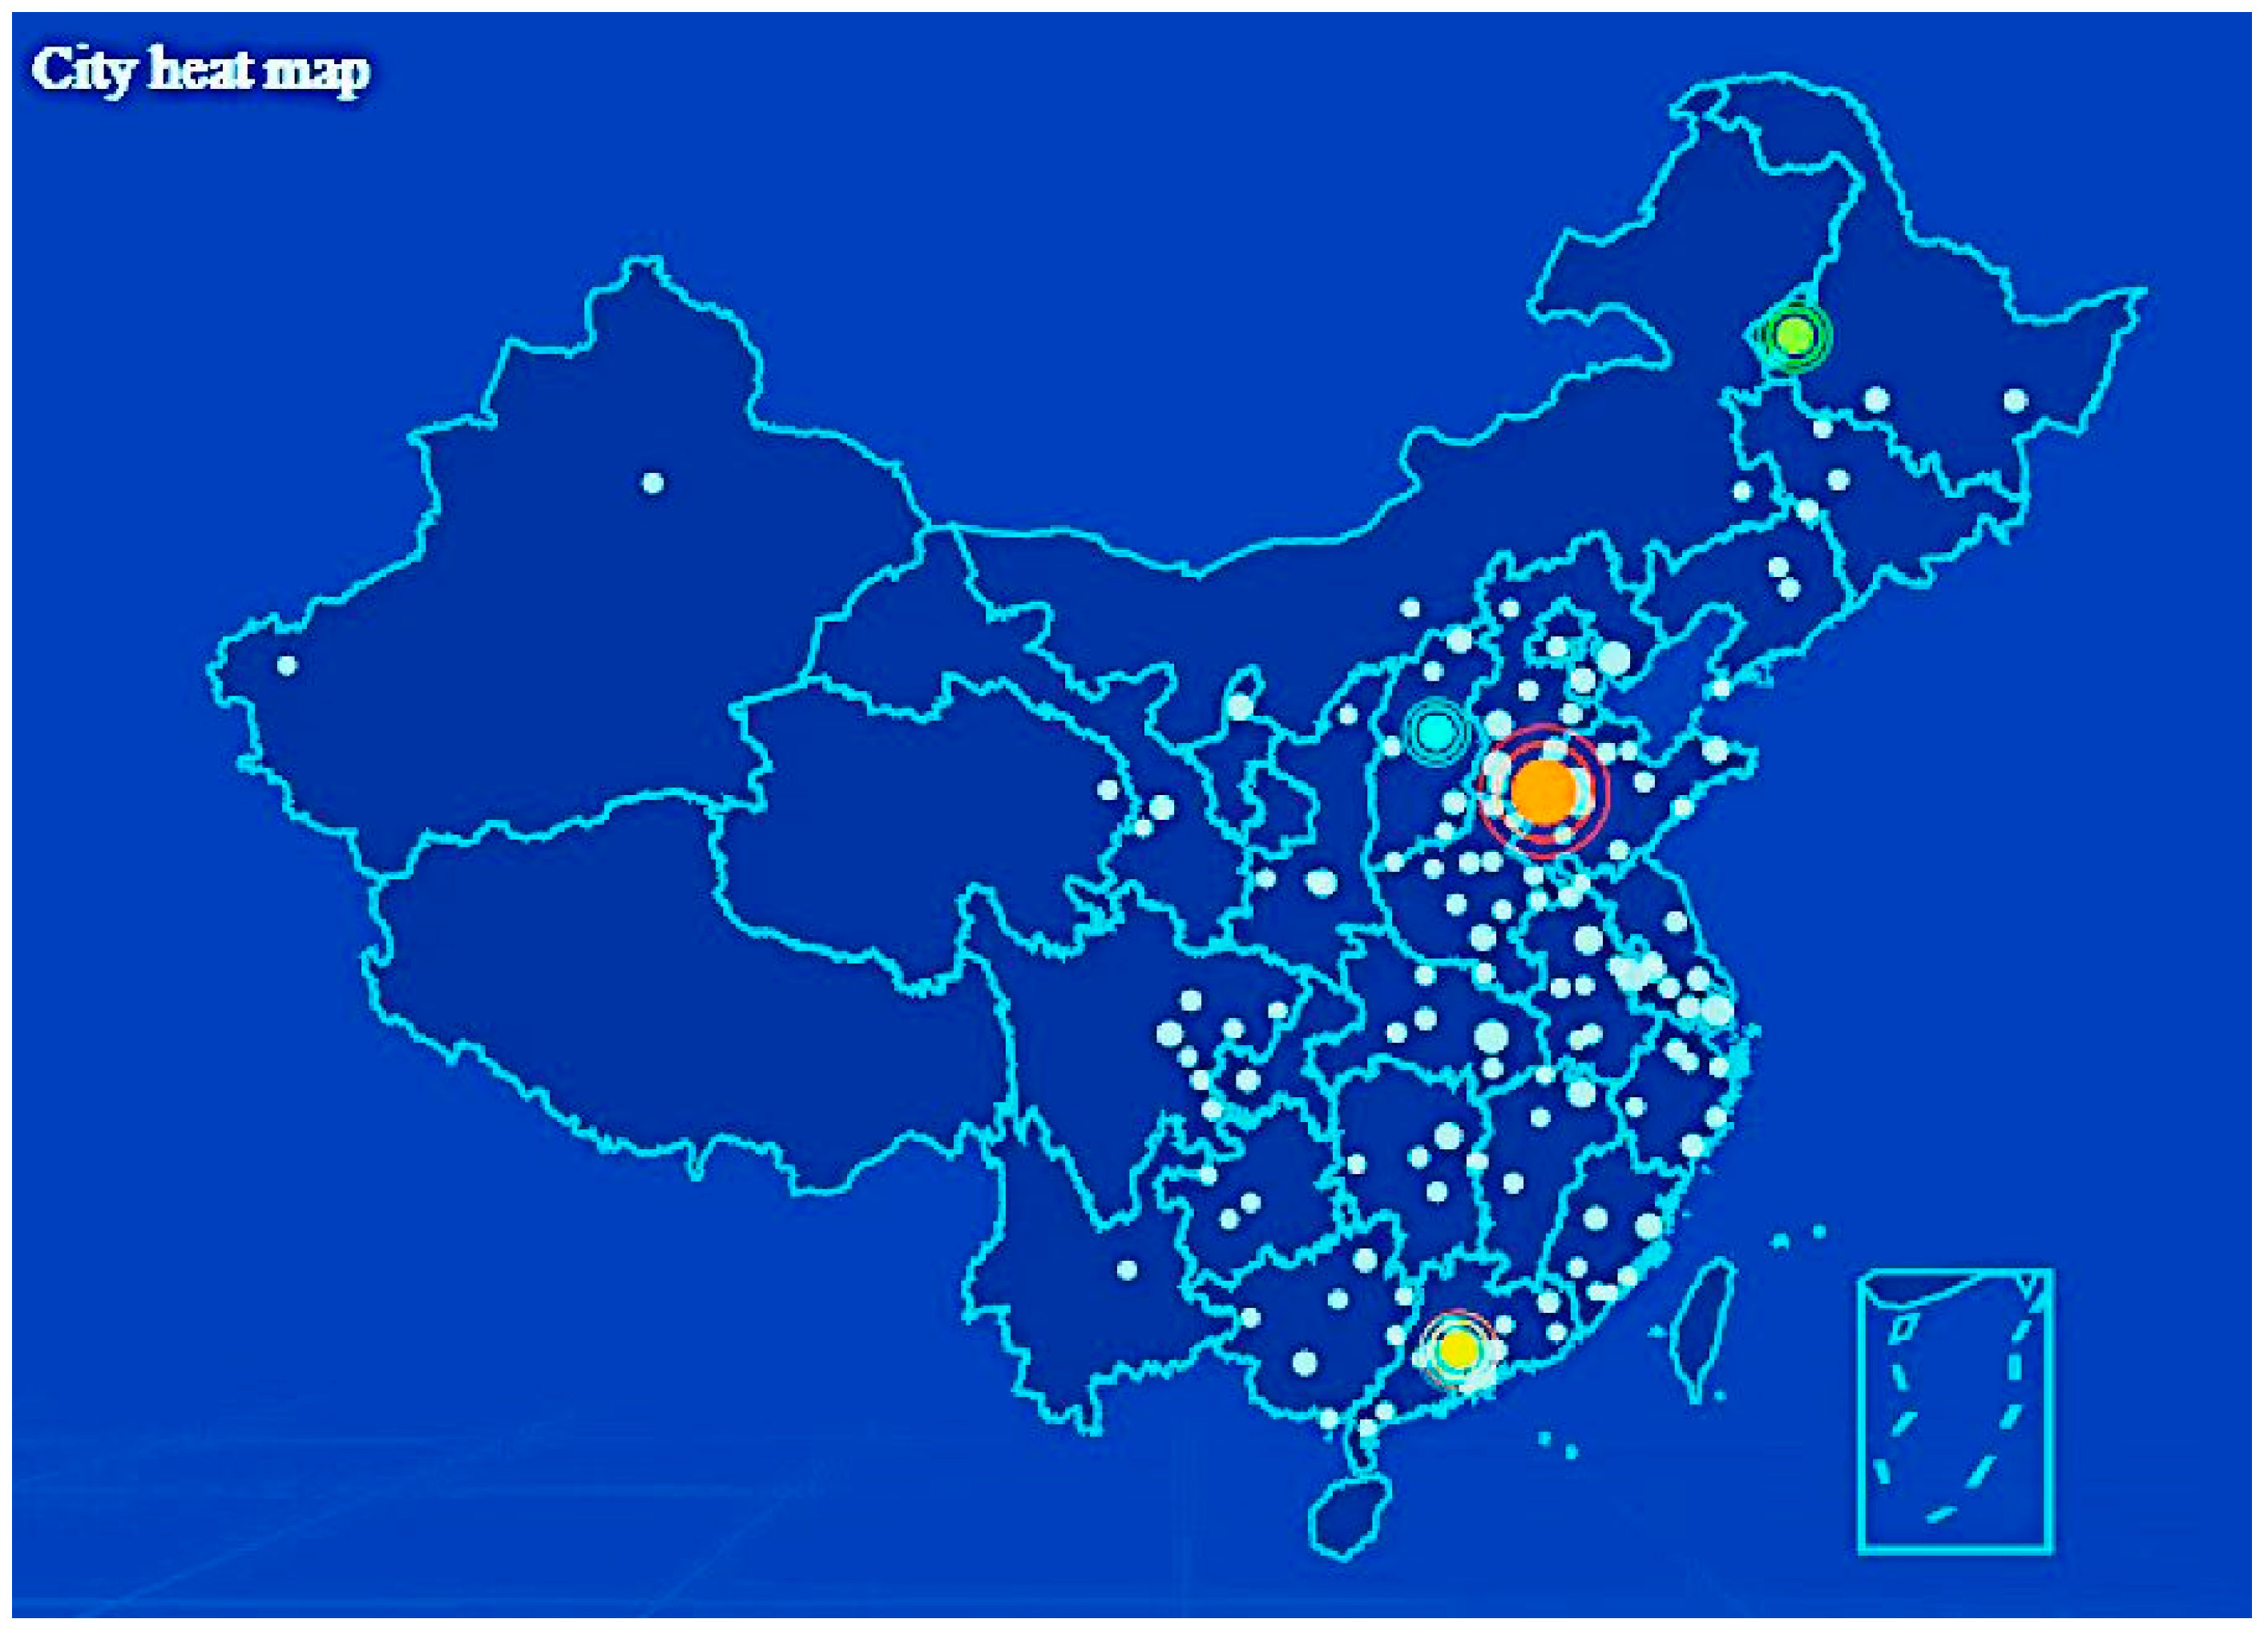


| Cultural Indicator | Report |
|---|---|
| Reflective individuals, Civic engagement, The self, Communities, Regeneration, Space, Economy, Health, aging, Wellbeing, Arts in education | Understanding the Value of Arts & Culture: The AHRC Cultural Value Project (2016) [8] |
| Economy: GDP, Employment, Household expenditure Education: Inclusive education, Multilingual education, Arts education, Professional training Governance: Standard-setting framework, Policy and institutional framework, Arts education, Professional training Social: Going-out participation, Identity-building participation, Intercultural trust, Interpersonal trust, Self-determination Gender: Gender equality outputs, Perception of gender equality Communication: Freedom of expression, Internet use, Diversity of media content Heritage: Heritage sustainability | UNESCO. Culture for development indicators: methodology manual (2014) [18] |
| Arm’s-length governance: Delegated models at the national level Multistakeholder governance: Civil society, Non-government actors, and the Private sector Interministerial governance: Cross-portfolio engagement Multilevel governance: Decentralized models at all government tiers | UNESCO. Building resilient and sustainable cultural and creative sectors (2022) [19] |
| Citizenship, Equalities, Education, Innovation, Local government, Justice | BOP. Cultural and Creative Industries in the Face of COVID-19: An Economic Impact Outlook (2021) [20] |
| Professional and formal cultural and creative sectors; Education and training: retaining talent; Arts education | UNESCO. Culture and sustainable development: a still untapped potential (2022) [21] |
| Economic development: Cultural employment, Government support for culture, Voluntary work in arts and culture, Economic contribution of cultural industries Cultural value: Cultural assets, Talent (human capital), Cultural identity, Innovation (new work/companies), Global reach Engagement and social impact: Cultural attendance, Cultural participation, Access, Education in arts and culture | Vital Signs: cultural indicators for Australia (2011) [22] |
| Cultural vitality: the presence of opportunities for cultural participation, cultural participation itself, and support for arts and cultural activities. | Cultural Vitality in Communities: Interpretation and Indicators (2006) [23] |
| Engagement: Cultural employment, Heritage protection, Access to arts, culture, and heritage activities and events Cultural Identity: Local Content on television, The importance of culture to national identity Diversity: Cultural grants to minority ethnic groups, Attendance at and participation in ethnic cultural activities, Minority cultural activities Social Cohesion: Other-ethnicities attendance, Community cultural experiences Economic development: Income of the cultural industries, Value-added contributed by the creative industries, The creative industries’ proportion of total industry value-added | Cultural indicators for New Zealand (2009) [24] |
| Self-expression values, Survival values, Secular-rational values, Traditional values | World values survey. Values change the world (2008) [25] |
| Deeply cultivate cultural “sense of history”, Shaping the “international sense” of culture, Cultural diversity and freedom as a “sense of value” Stimulate “cultural creativity” | TAICCA. 2021 Taiwan Cultural & Creative industries Annual Report (2021) [26] |
| Cultural democracy: Promoting cultural governance reform and organizational reengineering Cultural creativity: Support the freedom of artistic creation and cultivate aesthetic cultivation Cultural vitality: Cultural preservation and rooting, linking land and people’s historical memory Cultural sustainability: The sustainability of the cultural economy and the ecosystem “cultural and creative industries” Cultural inclusiveness: Promoting the development and exchange of cultural diversity Cultural transcendence: Carry out cultural future, Create cultural science and technology, Cross-domain co-creation and sharing | Ministry of culture. 2018 culture policy the white paper (2018) [27] |
| Place and identity, Engagement, Identity, Social cohesion, Diversity | Carol Scott (2014) [28] |
| Cultural consistency, Diversity, Justice, Inclusive perception bias | PWC. Global Culture Survey 2021 (2021) [29] |
| Time | 2013 | 2014 | 2015 | 2016 | 2017 | 2018 | 2019 | 2020 | 2021 | 2022 |
| Records | 404 | 427 | 489 | 515 | 556 | 642 | 731 | 692 | 697 | 290 |
| Keywords | Year | Strength | Begin | End | 2013–2022 |
|---|---|---|---|---|---|
| creative cla | 2013 | 12.95 | 2013 | 2015 |  |
| cultural industry | 2013 | 5.88 | 2013 | 2015 |  |
| economic geography | 2013 | 4.66 | 2013 | 2016 |  |
| music | 2013 | 4.44 | 2013 | 2015 |  |
| enterprise | 2013 | 3.3 | 2013 | 2015 |  |
| value creation | 2013 | 2.9 | 2013 | 2015 |  |
| amenity | 2014 | 4.18 | 2014 | 2017 |  |
| university | 2014 | 3.95 | 2014 | 2018 |  |
| creative field | 2014 | 3.65 | 2014 | 2016 |  |
| contextual factor | 2014 | 3.16 | 2014 | 2017 |  |
| work environment | 2014 | 2.8 | 2014 | 2017 |  |
| film industry | 2015 | 2.93 | 2015 | 2017 |  |
| service innovation | 2015 | 2.64 | 2015 | 2017 |  |
| search | 2016 | 4.03 | 2016 | 2018 |  |
| cultural diversity | 2016 | 2.93 | 2016 | 2018 |  |
| united states | 2017 | 4.22 | 2017 | 2019 |  |
| creative proce | 2017 | 3.01 | 2017 | 2019 |  |
| workplace | 2017 | 2.71 | 2017 | 2019 |  |
| creative practice | 2017 | 2.41 | 2017 | 2019 |  |
| smart city | 2018 | 6.53 | 2018 | 2020 |  |
| history | 2018 | 2.99 | 2018 | 2020 |  |
| globalisation | 2013 | 2.51 | 2018 | 2020 |  |
| perception | 2014 | 2.48 | 2018 | 2020 |  |
| student | 2019 | 5.25 | 2019 | 2022 |  |
| law | 2019 | 4.14 | 2019 | 2022 |  |
| precarity | 2019 | 3.59 | 2019 | 2022 |  |
| video game | 2019 | 3.59 | 2019 | 2022 |  |
| creative self-efficacy | 2019 | 3.23 | 2019 | 2022 |  |
| digital economy | 2018 | 3.17 | 2019 | 2022 |  |
| social innovation | 2019 | 2.76 | 2019 | 2022 |  |
| entrepreneurial orientation | 2018 | 2.62 | 2019 | 2022 |  |
| Cluster ID | Size | Silhouette | Mean (Year) | Label by LLR (Log-Likelihood Ratio, p = 0.0001) |
|---|---|---|---|---|
| 0 | 46 | 0.882 | 2016 | (79.42, 0.0001) Transformational leadership (58.65, 0.0001Employee creativity (38.48, 0.0001) Knowledge sharing (35.7, 0.0001) Creative self-efficacy (30.06, 0.0001) Creativity |
| 1 | 41 | 0.915 | 2015 | (50.44, 0.0001) Creative labor (17.58, 0.0001) Creative thinking (17.58, 0.0001) Precariat (16.58, 0.0001) Work (16, 0.0001) Digital media |
| 2 | 36 | 0.823 | 2016 | (28.82, 0.0001) Product development (24.53, 0.0001) Design thinking (21.04, 0.0001) Competitive advantage (20.31, 0.0001) Information technology (20.31, 0.0001) Absorptive capacity |
| 3 | 32 | 0.965 | 2015 | (103.54, 0.0001) Creative economy (50.42, 0.0001) Creative city (42.06, 0.0001) Economic development (29.49, 0.0001) Higher education (28.79, 0.0001) Creative cities |
| 4 | 29 | 0.87 | 2016 | (38.85, 0.0001) Cultural industries (34.49, 0.0001) Urban development (27.63, 0.0001) Cultural industry (22.2, 0.0001) Urban (19.17, 0.0001) City |
| 5 | 28 | 0.964 | 2016 | (21.88, 0.0001) Gender (13.05, 0.001) Gender inequality; (13.05, 0.001) Production; (13.05, 0.001) Intersectionality; (13.05, 0.001) Feminism |
| 6 | 27 | 0.933 | 2014 | (42.41, 0.0001) Cultural policy (31.1, 0.0001) South Africa (30.16, 0.0001) Cultural production (21.9, 0.0001) Policy mobilities (18.94, 0.0001) Politics |
| 7 | 27 | 0.878 | 2017 | (33.34, 0.0001) Entrepreneurial orientation (29.32, 0.0001) Creative performance (22.58, 0.0001) Business performance (22.56, 0.0001) Social media (21.26, 0.0001) Big data |
| 8 | 24 | 0.957 | 2016 | (32.5, 0.0001) Creative class (19.82, 0.0001) Creative workers (19.82, 0.0001) Social networks (14.39, 0.001) Digital transformation (12.74, 0.001) Multivariate linear regression |
| 9 | 24 | 0.864 | 2014 | (188.43, 0.0001) Creative industries (53.14, 0.0001) Cultural and creative industries (27.55, 0.0001) Creative industry (27.21, 0.0001) Sustainable development (20.04, 0.0001) Fashion |
| 10 | 23 | 0.938 | 2015 | (34.82, 0.0001) Creative work (25.81, 0.0001) Cultural work (17.8, 0.0001) Energy transition (16.35, 0.0001) Research and development (11.86, 0.001) O31 |
| 11 | 23 | 0.904 | 2015 | (36.59, 0.0001) Regional development (20.38, 0.0001) Creative tourism (19.36, 0.0001) System (19.29, 0.0001) Cultural tourism (16.5, 0.0001) Cultural heritage |
| 12 | 23 | 0.953 | 2014 | (17.53, 0.0001) Capability (12.48, 0.001) Product (12.48, 0.001) Everyday life (12.48, 0.001) Technology transfer (12.48, 0.001) Tradition |
| 13 | 22 | 0.905 | 2016 | (58.11, 0.0001) Creative destruction (22.38, 0.0001) Sharing economy (22.38, 0.0001) Disruptive innovation (19.62, 0.0001) Law (19.62, 0.0001) Intellectual property |
| 14 | 22 | 0.86 | 2016 | (26.56, 0.0001) Digital economy (25.71, 0.0001) Knowledge economy (25.15, 0.0001) Knowledge-based urban development (22.79, 0.0001) Artificial intelligence (22.64, 0.0001) Industry 4.0 |
| 15 | 22 | 0.934 | 2014 | (85.98, 0.0001) Political economy (13.35, 0.001) Climate change (13.27, 0.001) Firm (13.17, 0.001) New media (13.17, 0.001) Outsourcing |
| 16 | 21 | 0.929 | 2017 | (37.78, 0.0001) Creative self-efficacy (27.32, 0.0001) Creative industries (14.51, 0.001) Human resource management (14.08, 0.001) Phenomenology (14.08, 0.001) Servant leadership |
| 17 | 21 | 0.865 | 2014 | (64.67, 0.0001) Music industry (29.39, 0.0001) Popular music (26.78, 0.0001) New economy (18.8, 0.0001) Music industries (13.37, 0.001) Digital technology |
| 18 | 20 | 0.94 | 2017 | (20.99, 0.0001) Open innovation (19.41, 0.0001) Value co-creation (14.97, 0.001) Service design (14.39, 0.001) Tourist experience (13.81, 0.001) Creative industries |
| 19 | 20 | 0.883 | 2015 | (43.32, 0.0001) Human capital (17.14, 0.0001) Economic growth (15.51, 0.0001) 21st-century skills (13.76, 0.001) Creative industries (13.36, 0.001) Intellectual capital |
| Measuring Items | Sources |
|---|---|
| The role of cultural heritage as a cultural intermediary. | [22,24] |
| The role of CCI in local, regional, national, and supranational economies. | [20] |
| Cultural governance strategy. | [19,26,28] |
| Art education and professional training. | [18] |
| Cultural assets preservation strategy. | [18,22,24] |
| Sustainable development strategy of the cultural economy and the CCI ecosystem. | [28] |
| Policies to promote the development and exchange of cultural diversity. | [23] |
| Creating culture, technology, cross-regional co-creation and sharing, and cultural governance strategies. | [18,22,24] |
| Ways to participate in the protection of cultural heritage. | [19,20,22] |
| Cultural consumption attitudes towards intangible cultural heritage and cultural and creative products. | [23,24] |
| No. | Date | Name of Questionnaire | Distribution Channels | Number of Releases | Total Answers |
|---|---|---|---|---|---|
| 1 | 12 December 2022 | Formal questionnaire | Credamo data mart | 100 | 130 |
| 2 | 13 December 2022 | Formal questionnaire | Credamo data mart | 100 | 126 |
| 3 | 13 December 2022 | Formal questionnaire | Credamo data mart | 100 | 130 |
| 4 | 14 December 2022 | Formal questionnaire | Credamo data mart | 200 | 249 |
| Number of questionnaires answered | 635 | ||||
| Number of valid questionnaires | 500 | ||||
| Female | 308 | 61.6% | |||
| Male | 192 | 38.4% | |||
| Items | Category | Number of Responses | Percentage |
|---|---|---|---|
| Age group | 18–20 | 21 | 4.2% |
| 21–30 | 243 | 48.6% | |
| 31–40 | 189 | 37.8% | |
| 41–50 | 29 | 5.8% | |
| 51–60 | 17 | 3.4% | |
| Over 60 | 1 | 0.2% | |
| Occupation type | Student | 67 | 13.4% |
| state-owned enterprise | 111 | 22.2% | |
| government-affiliated institutions | 32 | 6.4% | |
| civil servant | 10 | 2% | |
| private enterprise | 264 | 52.8% | |
| foreign enterprise | 16 | 3.2% |
| Cronbach’s Alpha | Cronbach’s Alpha Based on Standardised Items | N of Items |
|---|---|---|
| 0.905 | 0.887 | 51 |
| Variance | Item | Factor Loadings | Cronbach’s Alpha | AVE | CR |
|---|---|---|---|---|---|
| CS | CS1 | 0.800 | 0.865 | 0.559 | 0.835 |
| CS2 | 0.756 | ||||
| CS3 | 0.735 | ||||
| CS4 | 0.697 | ||||
| CD | CD1 | 0.799 | 0.859 | 0.527 | 0.816 |
| CD2 | 0.716 | ||||
| CD3 | 0.707 | ||||
| CD4 | 0.678 | ||||
| CCI | CCI1 | 0.795 | 0.832 | 0.582 | 0.806 |
| CCI2 | 0.768 | ||||
| CCI3 | 0.724 | ||||
| CI | CI1 | 0.844 | 0.824 | 0.576 | 0.802 |
| CI2 | 0.727 | ||||
| CI3 | 0.700 | ||||
| CV | CV1 | 0.790 | 0.830 | 0.566 | 0.796 |
| CV2 | 0.737 | ||||
| CV3 | 0.730 | ||||
| CP | CP1 | 0.817 | 0.811 | 0.563 | 0.794 |
| CP2 | 0.731 | ||||
| CP3 | 0.699 |
| Kaiser–Meyer–Olkin Measure of Sampling Adequacy. | 0.942 | |
| Bartlett’s Test of Sphericity | Approx. Chi-Square | 5504.622 |
| df | 190 | |
| Sig. | 0.000 | |
| Component | Initial Eigenvalues | Extraction Sums of Squared Loadings | Rotation Sums of Squared Loadings | ||||||
|---|---|---|---|---|---|---|---|---|---|
| Total | % of Variance | Cumulative % | Total | % of Variance | Cumulative % | Total | % of Variance | Cumulative % | |
| 1 | 9.214 | 46.070 | 46.070 | 9.214 | 46.070 | 46.070 | 2.907 | 14.537 | 14.537 |
| 2 | 1.282 | 6.411 | 52.482 | 1.282 | 6.411 | 52.482 | 2.766 | 13.828 | 28.365 |
| 3 | 1.156 | 5.780 | 58.262 | 1.156 | 5.780 | 58.262 | 2.339 | 11.696 | 40.060 |
| 4 | 1.118 | 5.589 | 63.851 | 1.118 | 5.589 | 63.851 | 2.236 | 11.181 | 51.242 |
| 5 | 0.952 | 4.761 | 68.612 | 0.952 | 4.761 | 68.612 | 2.222 | 11.110 | 62.351 |
| 6 | 0.950 | 4.748 | 73.361 | 0.950 | 4.748 | 73.361 | 2.202 | 11.009 | 73.361 |
| Hypothesis | Standardized Path Coefficient | Standard Error | Bias-Corrected 95%CI | p Value | Support | |
|---|---|---|---|---|---|---|
| Lower | Upper | |||||
| H1: CI ← CV | 0.679 | 0.052 | 0.594 | 0.752 | 0.012 | Yes |
| H2: CP ← CI | 0.340 | 0.068 | 0.193 | 0.440 | 0.020 | Yes |
| H3: CP ← CV | 0.450 | 0.064 | 0.318 | 0.580 | 0.011 | Yes |
| H4: CD ← CP | 0.499 | 0.069 | 0.349 | 0.618 | 0.016 | Yes |
| H5: CD ← CI | 0.405 | 0.066 | 0.277 | 0.575 | 0.004 | Yes |
| H6: CCI ← CP | 0.396 | 0.094 | 0.205 | 0.626 | 0.012 | Yes |
| H7: CCI ← CD | 0.370 | 0.081 | 0.105 | 0.535 | 0.050 | Yes |
| H8:CS ← CCI | 0.334 | 0.057 | 0.190 | 0.463 | 0.009 | Yes |
| H9:CS ← CD | 0.488 | 0.060 | 0.373 | 0.621 | 0.008 | Yes |
| Statistical Test Quantity | Criterion or Threshold for Adaptation | Test Result Data | Model Fit Judgement |
|---|---|---|---|
| Absolute Fit Measures | |||
| RMSEA (Root Mean Square Residual) | <0.05 | 0.045 | √ |
| GFI (Goodness-of-Fit Index) | >0.90 | 0.943 | √ |
| Baseline Comparisons | |||
| NFI (Normed Fit Index) | >0.90 | 0.943 | √ |
| RFI (Relative Fit Index) | >0.90 | 0.932 | √ |
| IFI (Incremental Fit Index) | >0.90 | 0.971 | √ |
| TLI (Tucker–Lewis Coefficient) | >0.90 | 0.965 | √ |
| CFI (Comparative Fit Index) | >0.90 | 0.971 | √ |
| Parsimony-Adjusted | |||
| PGFI (Parsimony Goodness-of-Fit Index) | >0.50 | 0.723 | √ |
| PNFI (Parsimony-Adjusted NFI) | >0.50 | 0.799 | √ |
| PCFI (Parsimony-Adjusted CFI) | >0.50 | 0.822 | √ |
| CN (Critical N) | >200 | 320.177 | √ |
| CMIN/DF (Chi-Square/Degrees of Freedom) | <3.00 | 1.989 | √ |
| CAIC (Consistent Akaike’s Information Criterion) | The theoretical model value is less than the independent model value, and at the same time less than the saturated model value. | 673.693 < 1515.068 673.693 < 5732.911 | √ |
| 95% Confidence Interval | ||||
|---|---|---|---|---|
| Estimate | BC/PC p Value | BC | PC | |
| Total Effect | ||||
| CI ← CV | 0.679 | 0.012/0.010 | 0.594~0.752 | 0.596~0.756 |
| CP ← CI | 0.340 | 0.020/0.010 | 0.193~0.440 | 0.198~0.469 |
| CP ← CV | 0.450 | 0.015/0.010 | 0.612~0.749 | 0.614~0.759 |
| CD ← CP | 0.499 | 0.016/0.010 | 0.349~0.618 | 0.362~0.626 |
| CD ← CI | 0.405 | 0.009/0.010 | 0.466~0.704 | 0.198~0.697 |
| CCI ← CD | 0.370 | 0.050/0.042 | 0.105~0.535 | 0.123~0.538 |
| CCI ← CP | 0.396 | 0.006/0.010 | 0.473~0.741 | 0.459~0.722 |
| CS ← CCI | 0.334 | 0.009/0.010 | 0.190~0.463 | 0.189~0.457 |
| CS ← CD | 0.488 | 0.012/0.010 | 0.471~0.709 | 0.478~0.713 |
| Direct Effect | ||||
| CI ← CV | 0.679 | 0.012/0.010 | 0.594~0.752 | 0.596~0.756 |
| CP ← CI | 0.340 | 0.020/0.010 | 0.193~0.440 | 0.198~0.469 |
| CP ← CV | 0.450 | 0.015/0.010 | 0.612~0.749 | 0.614~0.759 |
| CD ← CP | 0.499 | 0.016/0.010 | 0.349~0.618 | 0.362~0.626 |
| CD ← CI | 0.405 | 0.009/0.010 | 0.466~0.704 | 0.198~0.697 |
| CCI ← CD | 0.370 | 0.050/0.042 | 0.105~0.535 | 0.123~0.538 |
| CCI ← CP | 0.396 | 0.006/0.010 | 0.473~0.741 | 0.459~0.722 |
| CS ← CCI | 0.334 | 0.009/0.010 | 0.190~0.463 | 0.189~0.457 |
| CS ← CD | 0.488 | 0.012/0.010 | 0.471~0.709 | 0.478~0.713 |
| Indirect Effect | ||||
| CP ← CV | 0.231 | 0.007/0.010 | 0.146~0.343 | 0.138~0.323 |
| CD ← CI | 0.170 | 0.011/0.010 | 0.093~0.248 | 0.094~0.251 |
| CD ← CV | 0.616 | 0.025/0.010 | 0.543~0.671 | 0.551~0.681 |
| CCI ← CP | 0.185 | 0.021/0.043 | 0.101~0.297 | 0.071~0.282 |
| CCI ← CI | 0.347 | 0.007/0.010 | 0.256~0.455 | 0.247~0.452 |
| CCI ← CV | 0.497 | 0.014/0.010 | 0.433~0.571 | 0.436~0.580 |
| CS ← CD | 0.123 | 0.018/0.042 | 0.061~0.207 | 0.038~0.193 |
| CS ← CP | 0.437 | 0.016/0.010 | 0.330~0.530 | 0.349~0.541 |
| CS ← CI | 0.396 | 0.009/0.010 | 0.310~0.506 | 0.303~0.506 |
| CS ← CV | 0.466 | 0.007/0.010 | 0.411~0.545 | 0.406~0.543 |
| Dimension | Variable | Content |
|---|---|---|
| Cultural Sustainability (CS) | CS1 | Promoting urban competitiveness |
| CS2 | Construct the space environment of virtual and real integration | |
| CS3 | Cultural inclusion | |
| CS4 | Stimulate community vitality and develop local creation | |
| Cultural Democracy (CD) | CD1 | Expand the content of native culture and promote cultural internationalization |
| CD2 | Implement Arm’s-Length governance | |
| CD3 | Implement cultural equality and cultural citizenship | |
| CD4 | Smooth reward and grants mechanism for arts and culture | |
| Cultural Innovation (CCI) | CCI1 | Equality and accessibility of art culture |
| CCI2 | Industry digital innovation | |
| CCI3 | Product sustainable innovation design | |
| Culture Industrialization (CI) | CI1 | Protect the right to cultural work |
| CI2 | Intangible cultural heritage as a cultural intermediary | |
| CI3 | Establish a national cultural brand | |
| Cultural Vitality (CV) | CV1 | Citizen cultural participation |
| CV2 | Multiple aesthetic education and local cultural experience | |
| CV3 | Local cultural consciousness | |
| Cultural Policy Systematisation (CP) | CP1 | Professional management and preservation |
| CP2 | Establish a cultural impact assessment mechanism | |
| CP3 | Continuously improving cultural regulations |
| Taicca [27] | This Study | |
|---|---|---|
| Cultural Sustainability | Cultural economy and the sustainability of cultural and creative industry ecosystem | ● Promoting urban competitiveness ● Construct the space environment of virtual and real integration ● Cultural inclusion ● Stimulate community vitality and develop local creation |
| Cultural Democracy | Promote cultural governance reform and organizational restructuring | ● Expand the content of native culture and promote cultural internationalization ● Implement Arm’s-Length governance ● Implement cultural equality and cultural citizenship ● Smooth reward and grants mechanism for arts and culture |
| Cultural Innovation | Support the freedom of artistic and literary creation and cultivate the sense of beauty | ● Equality and accessibility of art culture ● Industry digital innovation ● Product sustainable innovation design |
| Cultural Vitality | Cultural preservation and rooting, linking land and people’s historical memory | ● Citizen cultural participation ● Multiple aesthetic education and local cultural experience ● Local cultural consciousness |
| Cultural Tolerance | Promote the development and exchange of cultural diversity: | |
| Cultural Transcendence | Carry out cultural future, create cultural technology, and create and share across regions | |
| Culture Industrialisation | - | ● Protect the right to cultural work ● Intangible cultural heritage as a cultural intermediary ● Establish a national cultural brand |
| Cultural Policy Systematisation | - | ● Professional management and preservation ● Establish a cultural impact assessment mechanism ● Continuously improving cultural regulations |
Disclaimer/Publisher’s Note: The statements, opinions and data contained in all publications are solely those of the individual author(s) and contributor(s) and not of MDPI and/or the editor(s). MDPI and/or the editor(s) disclaim responsibility for any injury to people or property resulting from any ideas, methods, instructions or products referred to in the content. |
© 2023 by the authors. Licensee MDPI, Basel, Switzerland. This article is an open access article distributed under the terms and conditions of the Creative Commons Attribution (CC BY) license (https://creativecommons.org/licenses/by/4.0/).
Share and Cite
Yan, W.-J.; Liu, S.-T. Creative Economy and Sustainable Development: Shaping Flexible Cultural Governance Model for Creativity. Sustainability 2023, 15, 4353. https://doi.org/10.3390/su15054353
Yan W-J, Liu S-T. Creative Economy and Sustainable Development: Shaping Flexible Cultural Governance Model for Creativity. Sustainability. 2023; 15(5):4353. https://doi.org/10.3390/su15054353
Chicago/Turabian StyleYan, Wen-Jie, and Shu-Tang Liu. 2023. "Creative Economy and Sustainable Development: Shaping Flexible Cultural Governance Model for Creativity" Sustainability 15, no. 5: 4353. https://doi.org/10.3390/su15054353
APA StyleYan, W.-J., & Liu, S.-T. (2023). Creative Economy and Sustainable Development: Shaping Flexible Cultural Governance Model for Creativity. Sustainability, 15(5), 4353. https://doi.org/10.3390/su15054353


