Article

Operational and Environmental Assessment of Weaving Section for Urban Roads: Case Study, Aljouf Region, KSA

1
Department of Civil Engineering, College of Engineering, Jouf University, Sakaka 72388, Saudi Arabia
2
Faculty of Engineering and Technology, Badr University in Cairo (BUC), Cairo 11829, Egypt
3
Department of Civil Engineering, Faculty of Engineering, Suez University, Suez 43512, Egypt
*
Author to whom correspondence should be addressed.
Sustainability 2023, 15(5), 4275; https://doi.org/10.3390/su15054275
Submission received: 20 December 2022 / Revised: 30 January 2023 / Accepted: 22 February 2023 / Published: 27 February 2023
(This article belongs to the Special Issue Sustainable Mobility in Urban and Peri-Urban Areas)

Abstract

:
The urban weaving sections are more complex due to the various disturbing elements within the weaving section, such as lane-change situations. These turbulences reduced road capacity and increased vehicle exhaust emissions. The Highway Capacity Manual (HCM 2010) has a methodology for the analysis of weaving sections for the free highways; the methodology for the analysis of urban roads is not investigated in the HCM. Therefore, the main objective of this research is to present a systematic analysis of the factors that could potentially affect the capacity and exhaust emissions of urban weaving sections. These factors include the main road traffic volume, the weaving section length (WL), the volume ratio (VR), and the percentage of heavy vehicles (HV%). Two weaving sections were selected in the Aljouf Region, KSA; the Sakakah–Dumat Al-Jandal road. The collected data were used in the development of microsimulation using VISSIM models. The results indicated that increasing the volume ratio and percentage of heavy vehicles caused a decrease in capacity and an increase in exhaust emissions. It was discovered that the increase of weaving length resulted in increasing the capacity. However, increasing the weaving length was not beneficial for reducing exhaust emissions. Finally, regression models were developed for capacity estimation and emissions prediction of urban weaving sections based on weaving length and volume ratio, resulting in relatively high R2 values.

1. Introduction

In the current decade, with the fast growth of the urban population, economy, and car ownership, many cities suffer from traffic congestion. Consequently, traffic congestion problems have become a common daily occurrence in metropolitan areas. Congestion has many drawbacks, such as the loss of time, potentially missed business opportunities, increased stress, and frustration. It also leads to lower worker productivity, fewer trade opportunities, delivery delays, and higher fuel consumption. It is considered the main parameter for increasing transportation costs [1].
Most international societies have focused on developing urban expressways to improve the current state of urban traffic and transportation efficiency for urban road networks. Reduced driving time will result in less traffic congestion, improving quality of life. Congestion on highways exists mostly around road network interruptions such as merging and weaving sections [2]. Martinez et al. [3] developed an equation for modelling traffic flow in urban areas. In the same way, Habtie et al. [4] prepared an approach for estimating the traffic state using the artificial neural network.
Furthermore, improvements in traffic congestion require a careful analysis of several influencing factors. Several methods are used to capture the nature of traffic congestion, thus enabling the estimation of the significance of future changes in the system’s performance. Performance measures include efficiency in time and cost, security, and environmental impact. Evidence has indicated that expressway weaving sections are crucial components and are more expected to be crash-prone locations; there is a relationship between the characteristics of weaving section and traffic variables and crashes. In the weaving section, if a diverging area follows a merging area, the driver may need to perform mandatory lane-changing at a limited distance to enter his/her target lanes.
The weaving section is defined as the distance between the noses of vehicles weaving and changing lanes. Additionally, it can be defined as discontinuities in the road network formed in the case of merged segments closely followed by diverging segments. Many lane changes occur at weaving sections due to their geometrical configuration. Even if the total traffic demand is less than the capacity of the weaving section, the discharge flow decreases because of the lane changes [5].
Weaving sections occur when two or more traffic streams drive in the same direction across a sufficient length of the road without the use of traffic control devices (Highway Capacity Manual (HCM) [6]). Furthermore, the two types of geometric configuration for weaving sections are one-sided and two-sided [5]. The weaving ratio is the ratio of the smaller of the two weaving volumes to the total weaving volume. In the same way, the volume ratio is the ratio of the weaving volume to the total volume. The maximum length of the weaving section influences the performance of the segment. In cases where the short length is less than the maximum length, it acts as a weaving segment; otherwise, it represents a merge and diverge segment [5].
Weaving segments are crucial components of urban highways and must be evaluated thoroughly. Vehicle acceleration and deceleration rates are frequently significant criteria in establishing roadway designs. On the other hand, the geometric design of weaving segments causes conflict between approaching (accelerating) and departing (decelerating) drivers. This increases the likelihood of a crash and lowers the discharge flow [7]. Consequently, congestion occurs when traffic demands exceed the capacity at weaving areas, affecting the efficiency of the operation for the whole freeway section. Traffic operational issues are common in weaving areas, even in the case of the traffic demands having less capacity. Those operational problems may be encountered at a lower level of traffic flow conditions due to the complex interactions of vehicles, i.e., increased lane changing, resulting in a reduction in the level of service (LOS) and safety issues [8]. Like many other traffic problems, traffic in weaving sections has been studied using regression analysis, an empirical model, or a simulation model [7,8,9,10,11].
The effects of the geometric design and other factors on the efficiency of the traffic performance at the weaving section of the expressway are not well investigated. Furthermore, there is a need to develop a model to assist the processes of geometric design and traffic operation [7]. The Highway Capacity Manual has a methodology for the analysis of weaving sections for the free highways; however, for the urban roads, it has not been investigated yet in the HCM.
Therefore, the objective of this research is to present a systematic analysis of the different factors, including the main road traffic volume, the weaving section length (WL), the volume ratio (VR), and the percentage of heavy vehicles (HV%). These factors could potentially impact the urban weaving sections’ capacity and exhaust emissions. It also aims to develop models for the capacity estimation and exhaust emission prediction of urban weaving sections.

2. Literature Review

The HCM technique may be used to determine the weaving segments’ capacity and operational speed. HCM developed three significant models to examine weaving segments. Because there are not enough weaving data from multilane highways and in the few freeways that exist, the models are logical and rely on different judgment rules [8]. On urban roadways, weaving has become a major safety hazard. So weaving turned out to be a great place to start when designing a third iteration of the HCM. Parallel to this operation, new approaches to studying the weaving section started to emerge [8].
Only a few studies have been performed on urban weaving sections, even though there is a substantial body of literature on the analysis of highway weaving sections. In their study, Stewart et al. [12] investigated the impact of weaving length and type on the capacity of weaving sections. They determined an estimate of the capacity by utilizing integration software in addition to the approach from 1985 HCM [13]. According to the findings of the study, weaving length had a greater impact on capacity than weaving section type. To forecast the capacity of weaving sections, Lertworawanich and Elefteriadou [14] used two analytical formulas: a model of gap acceptance and linear optimization. The authors demonstrated that capacity is affected by demand, weaving vehicle ratios, and weaving and non-weaving vehicle speeds.
Ngoduy [15] described the lane-changing probability as a function of traffic density, speed, the weaving flow fraction, and traffic compositions. By quantifying each section’s critical length, the authors created a useful model that may be applied to a geometric design for weaving sections. In order to calculate the number of lane changes away from and toward the motorway, as well as the average speed of weaving and non-weaving vehicles, Roess and Ulerio [16] developed an analytical approach. On the other hand, Roess and Ulerio [17] suggested an analytical declaration of weaving segment capacity. They suggested a new approach in both studies [17,18], which was adopted in the most recent iteration of the HCM [6], to create the weaving portions that vary from nation to nation. For weaving sections, such as those in Simone or VISSIM, Shoraka and Puan [18] revealed that simulations can be carried out either at microscopic or macroscopic levels.
VISSIM was used in a different study by Pesti et al. [19] to model freeway weaving portions in Texas with various geometry and traffic patterns. They looked into the spaces between ramps based on field data and traffic simulation techniques. According to the study’s findings, a connection between speed, geometry, and traffic circumstances has been established. Yang et al.’s [20] procedures for using VISSIM simulation to calculate the capacity of highway weaving portions suggested that the capacity of weaving segments depends on the volume ratio, length, and distribution of both weaving flow and non-weaving volume.
By taking into account three different variables—the weaving section length, the weaving section volume ratio, and the weaving ratio—Calvert and Minderhoud [21] created a straightforward model for the analytical model to evaluate the capacity of weaving sections. Using tiny data from 130 weaving maneuvers from a ramp to a freeway, Sarvi [22] came to the conclusion that the nearby freeway vehicles had an impact on the weaving vehicle’s acceleration behavior. However, mergers have been thoroughly studied from both an empirical and a modeling perspective. Macroscopic empirical studies were employed by Marczak et al. [23] to identify bottleneck activation for two weaving portions. The authors looked at the oblique curves for oblique cumulative vehicle counts using loop detectors that were positioned at distances of 400 and 500 m inside the weaving zone. The findings demonstrate that “disruptive freeway to ramp lane transitions were responsible for bottleneck activations at both weaving stretches.” They concluded that the discharge flow is significantly influenced by the lane changes from the freeway to the ramp along the weaving stretch.
The impact of weaving traffic on the capacity of highway segments is unpredictable due to the complexity of the operation. The HCM defines values for each weaving segment capacity. Numerous factors need to be taken into account, including weaving length, volume ratio, number of lanes, free flows on the freeway or multilane highway, and segment geometric design [6]. It is abundantly obvious that the lane-change maneuver that is executed within the weaving segment plays a significant role in determining the performance of the weaving segment. As a result, understanding the impact of contributing variables on traffic operations is complicated and ambiguous.
Notably, these studies focused on freeway-weaving sections even though many of the earlier studies are now available in the literature. However, only a limited amount of research has been conducted to simulate and examine certain configurations of urban weaving sections. In this work, experimental simulations using real-life data and related exhaust emissions were utilized to analyze the capacity of weaving sections on urban roads. In addition, mathematical models for estimating the capacity and forecasting exhaust emissions of urban weaving sections were established.

3. Methodology

The research methodology used in the current study can be divided into three main steps. The first step of the data collection was selecting the test site and collecting the field data. The selected sections are urban arterial roads with traffic-weaving conditions. The collected data include geometric dimensions and traffic characteristics.
The collected data were employed in the second step to develop, calibrate, and validate a microsimulation model using VISSIM 9.00 software for the selected sections.
Finally, to simulate the urban weaving sections for various combinations of weaving lengths, heavy vehicle conditions, and traffic volume conditions, an experimental analysis with synthetic demands was conducted using the VISSIM microscopic model. Furthermore, it also includes the development of models for estimating capacity and predicting exhaust emissions. Figure 1 illustrates the details of the applied methodology in the current study.

3.1. Selection of Test Site and Field Data Collection

To achieve the objective of this research, two weaving sections at Sakakah–Dumat Al-Jandal Road (Road No. 65), Aljouf Region, Kingdom of Saudi Arabia, were selected. The selected sections are located in front of the Jouf University campus. The investigated road is regarded as one of the most important because it connects Aljouf to the capital of KSA (Riyadh). The corridor is classified as a main arterial road with a 120 km/h speed limit according to the AASHTO classification system [24]. The corridor in this section includes a main road and two service roadways. This section has three lanes for the main road and two lanes for the service roadway (5.5 m width). The connections between the service and main roadways exist at specific locations. Two weaving sections of 525 m and 1600 m in length were considered for weaving sections (A) and (B), respectively. The selected weaving sections are categorized as having a two-sided configuration as described in HCM 2010 [6]. The layout of the selected weaving sections of the arterial road is depicted in Figure 2.
The basic field data were collected, including the geometric characteristics for the main road and service road, traffic volume, traffic composition, and speed. The traffic data were collected during the weekdays when the pavement surface was dry and the weather conditions were normal. The traffic volume data show that peak hour volumes were from 7:30 a.m. to 8:30 a.m. and 1:00 p.m. to 2:00 p.m. for the weaving sections A and B, respectively. In addition, the traffic composition was 4% and 2% for both sections, respectively.

3.2. Development, Calibration, and Validation for Simulation Model

Traffic simulation is a widely used analysis tool to mimic the time-evolving traffic operations in a traffic stream [25,26]. Many software packages are used to simulate the urban weaving section, such as VISSIM, INTEGRATION, and CORISM [27]. This research utilizes the VISSIM micro-simulation software to simulate and analyze the selected weaving section under various combinations of weaving lengths and traffic volume conditions. VISSIM can simulate a wide range of traffic operations in both an interrupted and continuous traffic environment [28]. Micro-simulation models’ calibration and validation processes are essential to ensure their accuracy and reliability under local conditions. Model calibration is the process of modifying the model parameters to reflect the real-world observations. The purpose of model validation is to compare the results of the calibrated model to a different set of field measurements not used in the calibration [29,30]. The developed models were calibrated and validated based on the existing weaving section conditions.
Consequently, the average speed and average travel time were chosen as measures of effectiveness (MOE). The collected data from the investigated weaving sections were divided into two parts. The weaving section (A) data were utilized in the calibration process, while the weaving section (B) data were used for the validation stage.

3.3. Expermental Design

The operational and environmental analysis of the weaving section was conducted using the developed models. While the capacity was used in the operational analysis, the vehicle exhaust emissions (CO, NOX, HC) were used in the environmental analysis. The analysis considered some important factors that significantly affect the capacity and exhaust emissions of the case study weaving sections. These factors varied and were related to the weaving section geometry and traffic volume conditions, namely the weaving length (WL), the volume ratio (VR), and the percentage of heavy vehicles (HV%). The levels of these factors were determined based on the geometry and volume conditions of the investigated weaving sections. Four levels for the weaving section length, five levels for the traffic volume on the main road, four levels for the volume ratio, and two values for the heavy vehicle percentage were selected for the current study. In total, 160 simulation runs were conducted, and the capacity and exhaust emissions were estimated. Each combination of factor levels is a run, and the entire set of runs represents the scenarios that will be investigated using VISSIM. Table 1 presents the geometric and traffic volume parameters for the studied weaving sections considered in this research.

4. Results and Discussion

4.1. Model Calibration and Validation

As mentioned earlier, travel times can be used as indicators for driver behavior parameter calibration and model validation. They were calculated for each analysis period based on the average results of the simulation runs. In the VISSIM micro-simulation model, the values of travel time were calculated for a number of vehicles passing the travel time sections during a specific time interval. These values were compared with the values of travel time obtained from field measurements. It should be observed that the data from weaving section (A) were used in the calibration process, while the data of section (B) were used for the validation process.
Table 2 presents the percent error values between the observed and simulated travel times of the investigated weaving sections. It was found that the value of the percent error based on the measurement of travel time for weaving section (A) using the default parameters was 10% higher compared to other sections. This indicates that the developed models with the default parameters will not perform reasonably. Consequently, the models need to be calibrated. The calibration process was performed by replacing the values of the driving behavior parameters for VISSIM models. The statistics of the calibrated models indicated a significant improvement in the results compared to the results of the default models.
The weaving section (B) data were used to validate the model. The results of the validation process are demonstrated in Table 2. It was found that the value of percent error based on the measurement of travel time for weaving section (B) decreased to 4%. Based on this finding, the validation of the developed models was considered to be successfully completed. Table 3 demonstrates the default and calibrated driving behavior parameters of VISSIM.

4.2. Results of Simulation Scenarios

The significance of the different parameters, such as main road traffic volume level, volume ratio, weaving length, and percentage of heavy vehicles, was investigated through the experimental simulations. It is worth noting that the highway capacity is not a direct output of VISSIM micro-simulation or any simulation tool. The only way to estimate the capacity is to observe the system elements and the relation between throughput and demand. In the case where the system is unable to accommodate any more vehicles, the maximum throughput considers the capacity [31].
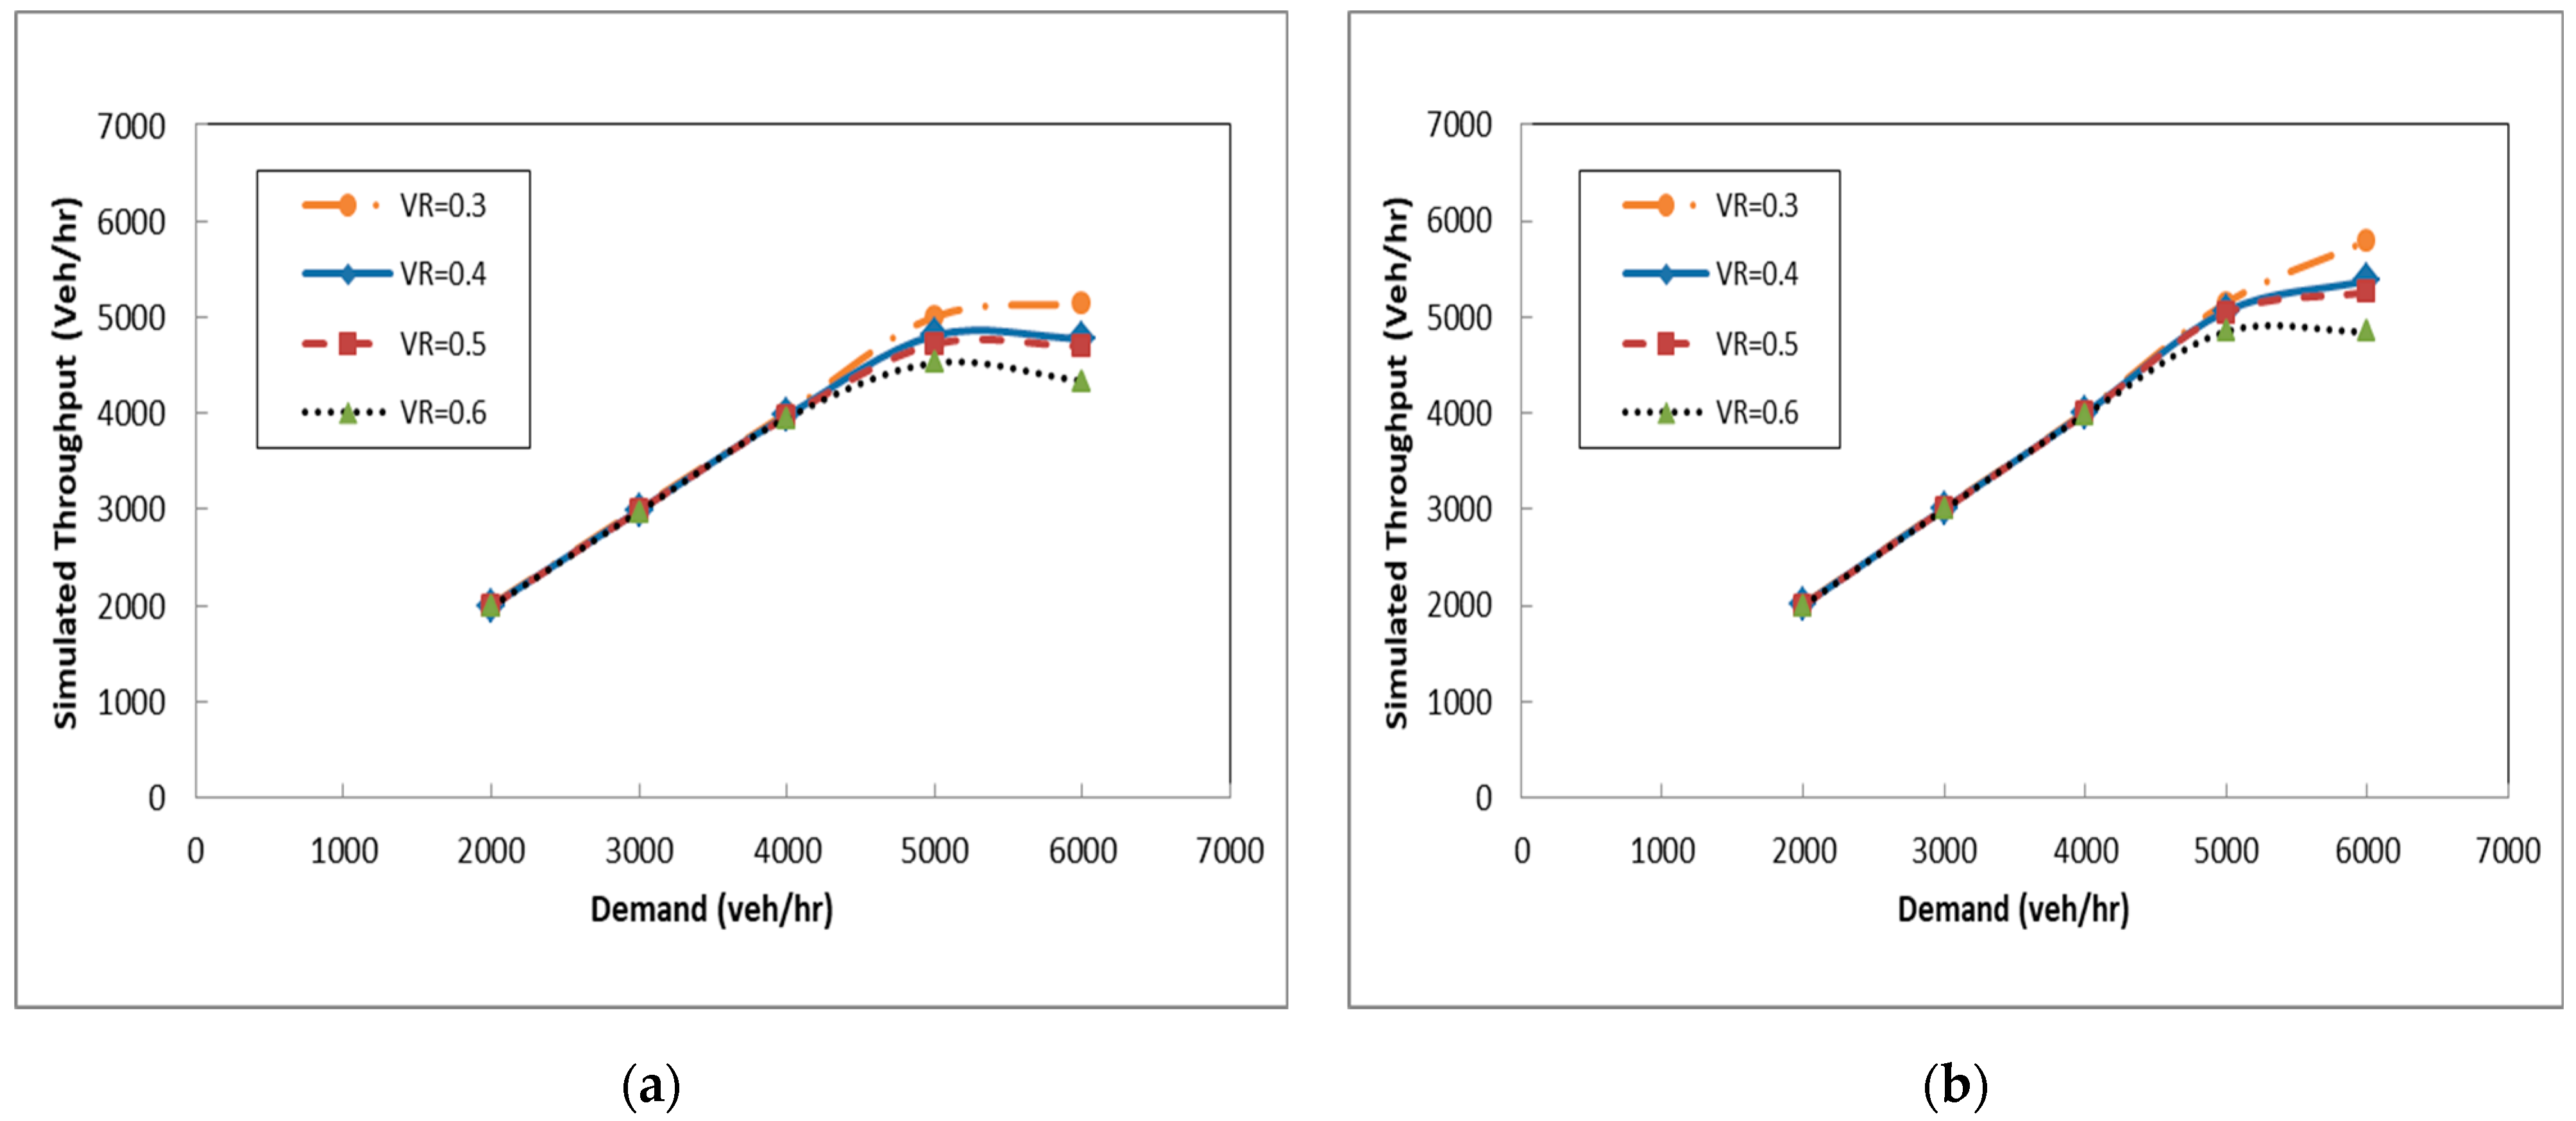
Examples of the relationship between demand and simulated throughput for the weaving section at different lengths of weaving section are illustrated in Figure 3. This figure shows that as the section’s total volume increases, the throughput increases until it reaches a certain limit. After this limit, no more vehicles could be accommodated. Figure 3 also shows that the capacity decreases as the volume ratio increases. For higher values of volume ratio, such as VR = 0.6, there is a reduction in capacity after the demand value of 5000 veh/hr. This might be attributed to the higher number of lane changes, which reduces the speed of vehicles within a traffic stream. It is worth noting that an apparent increase in section capacity can be depicted with the increase in weaving length, which can be due to the fact that increasing the weaving length provides smooth lane-changing maneuvers.
Table 4 and Table 5 illustrate the summary of the results of the capacity and exhaust emissions associated with the different volume ratios for all weaving lengths at different heavy vehicle percentages, respectively.

4.2.1. Effect of Weaving Length and Volume Ratio on Road Capacity

The relationship between weaving section capacity and weaving length for various volume ratios is shown in Figure 4. The significance of weaving length on the highway capacity is clear, and as the length increases and the volume ratio decreases, the road capacity increases.

4.2.2. Effect of Weaving Length and Volume Ratio on Exhaust Emissions

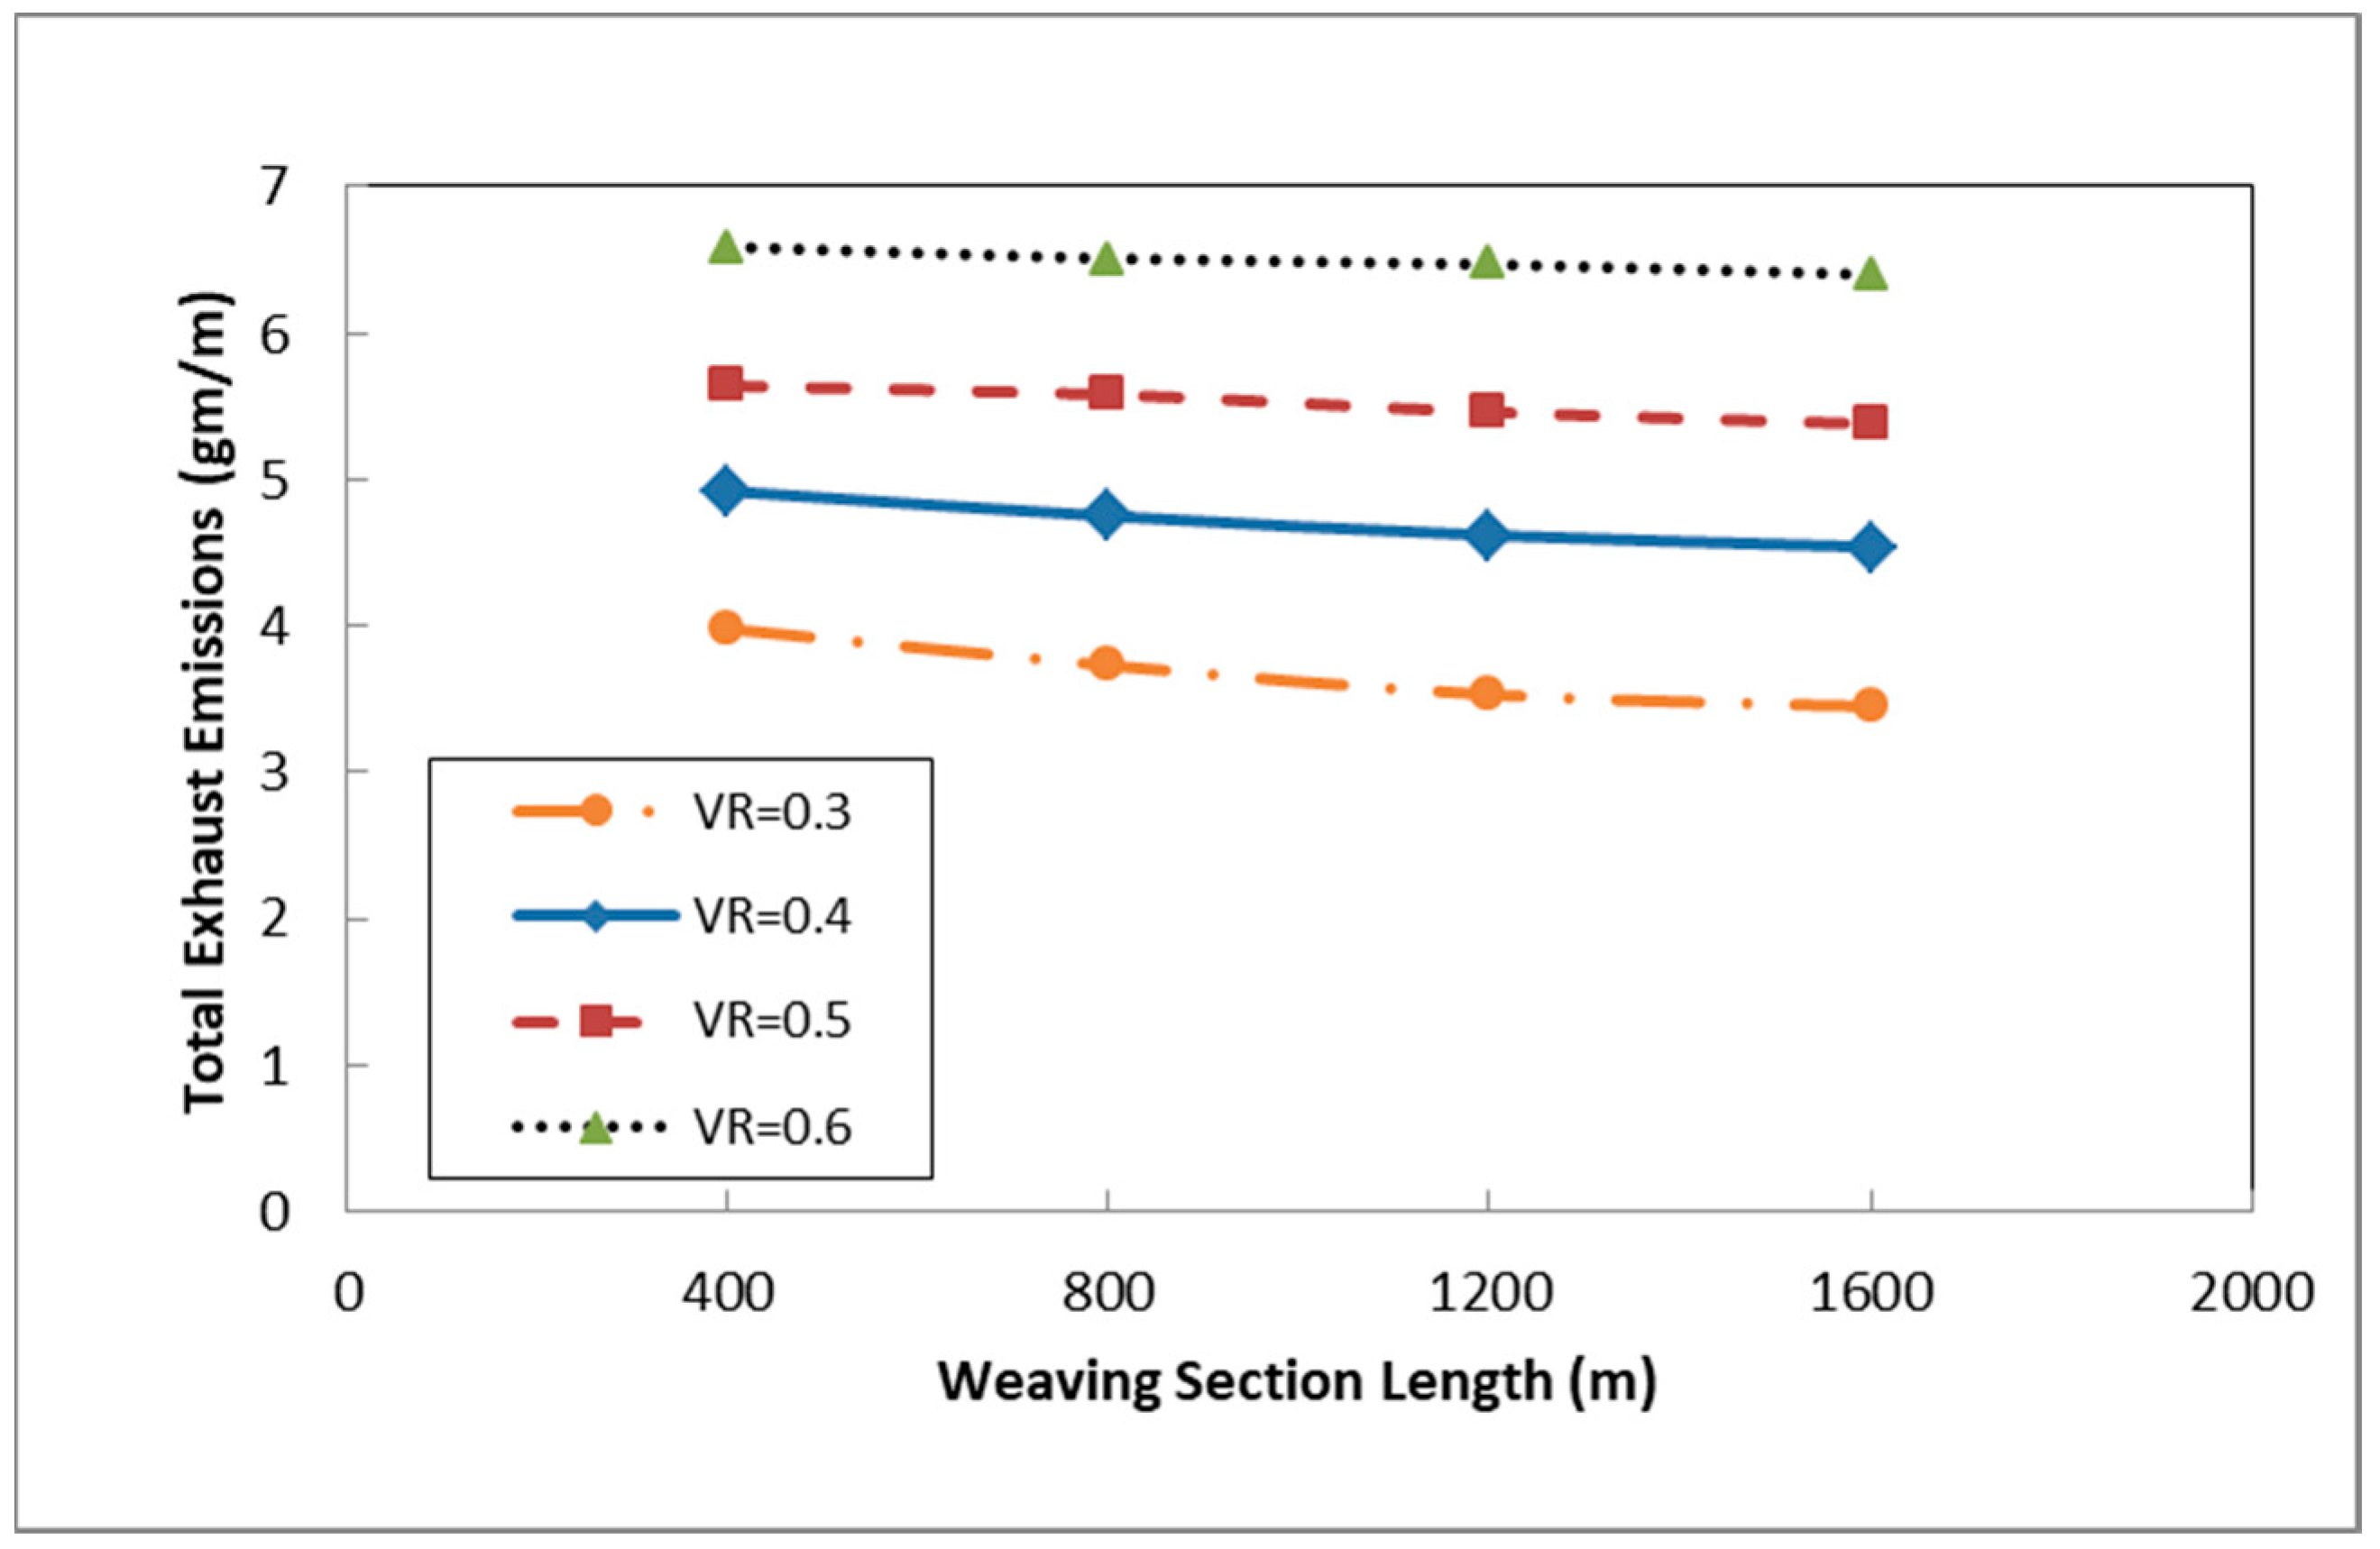
Figure 5 shows the effect of weaving section length on the total exhaust emissions (CO, NOX, and HC) determined at the maximum demand for the different volume ratios. It can be noticed that as the volume ratio increases, exhaust emissions increase. The figure also shows a slight decrease in exhaust emissions with the increase in weaving length, which may be due to the higher number of lane changes with the increase in volume ratio. The lane-changing maneuvers change vehicles’ speed and acceleration within a traffic stream in contrast to an increase in weaving length.

4.2.3. Effect of Heavy Vehicle Percentage on Capacity and Exhaust Emissions

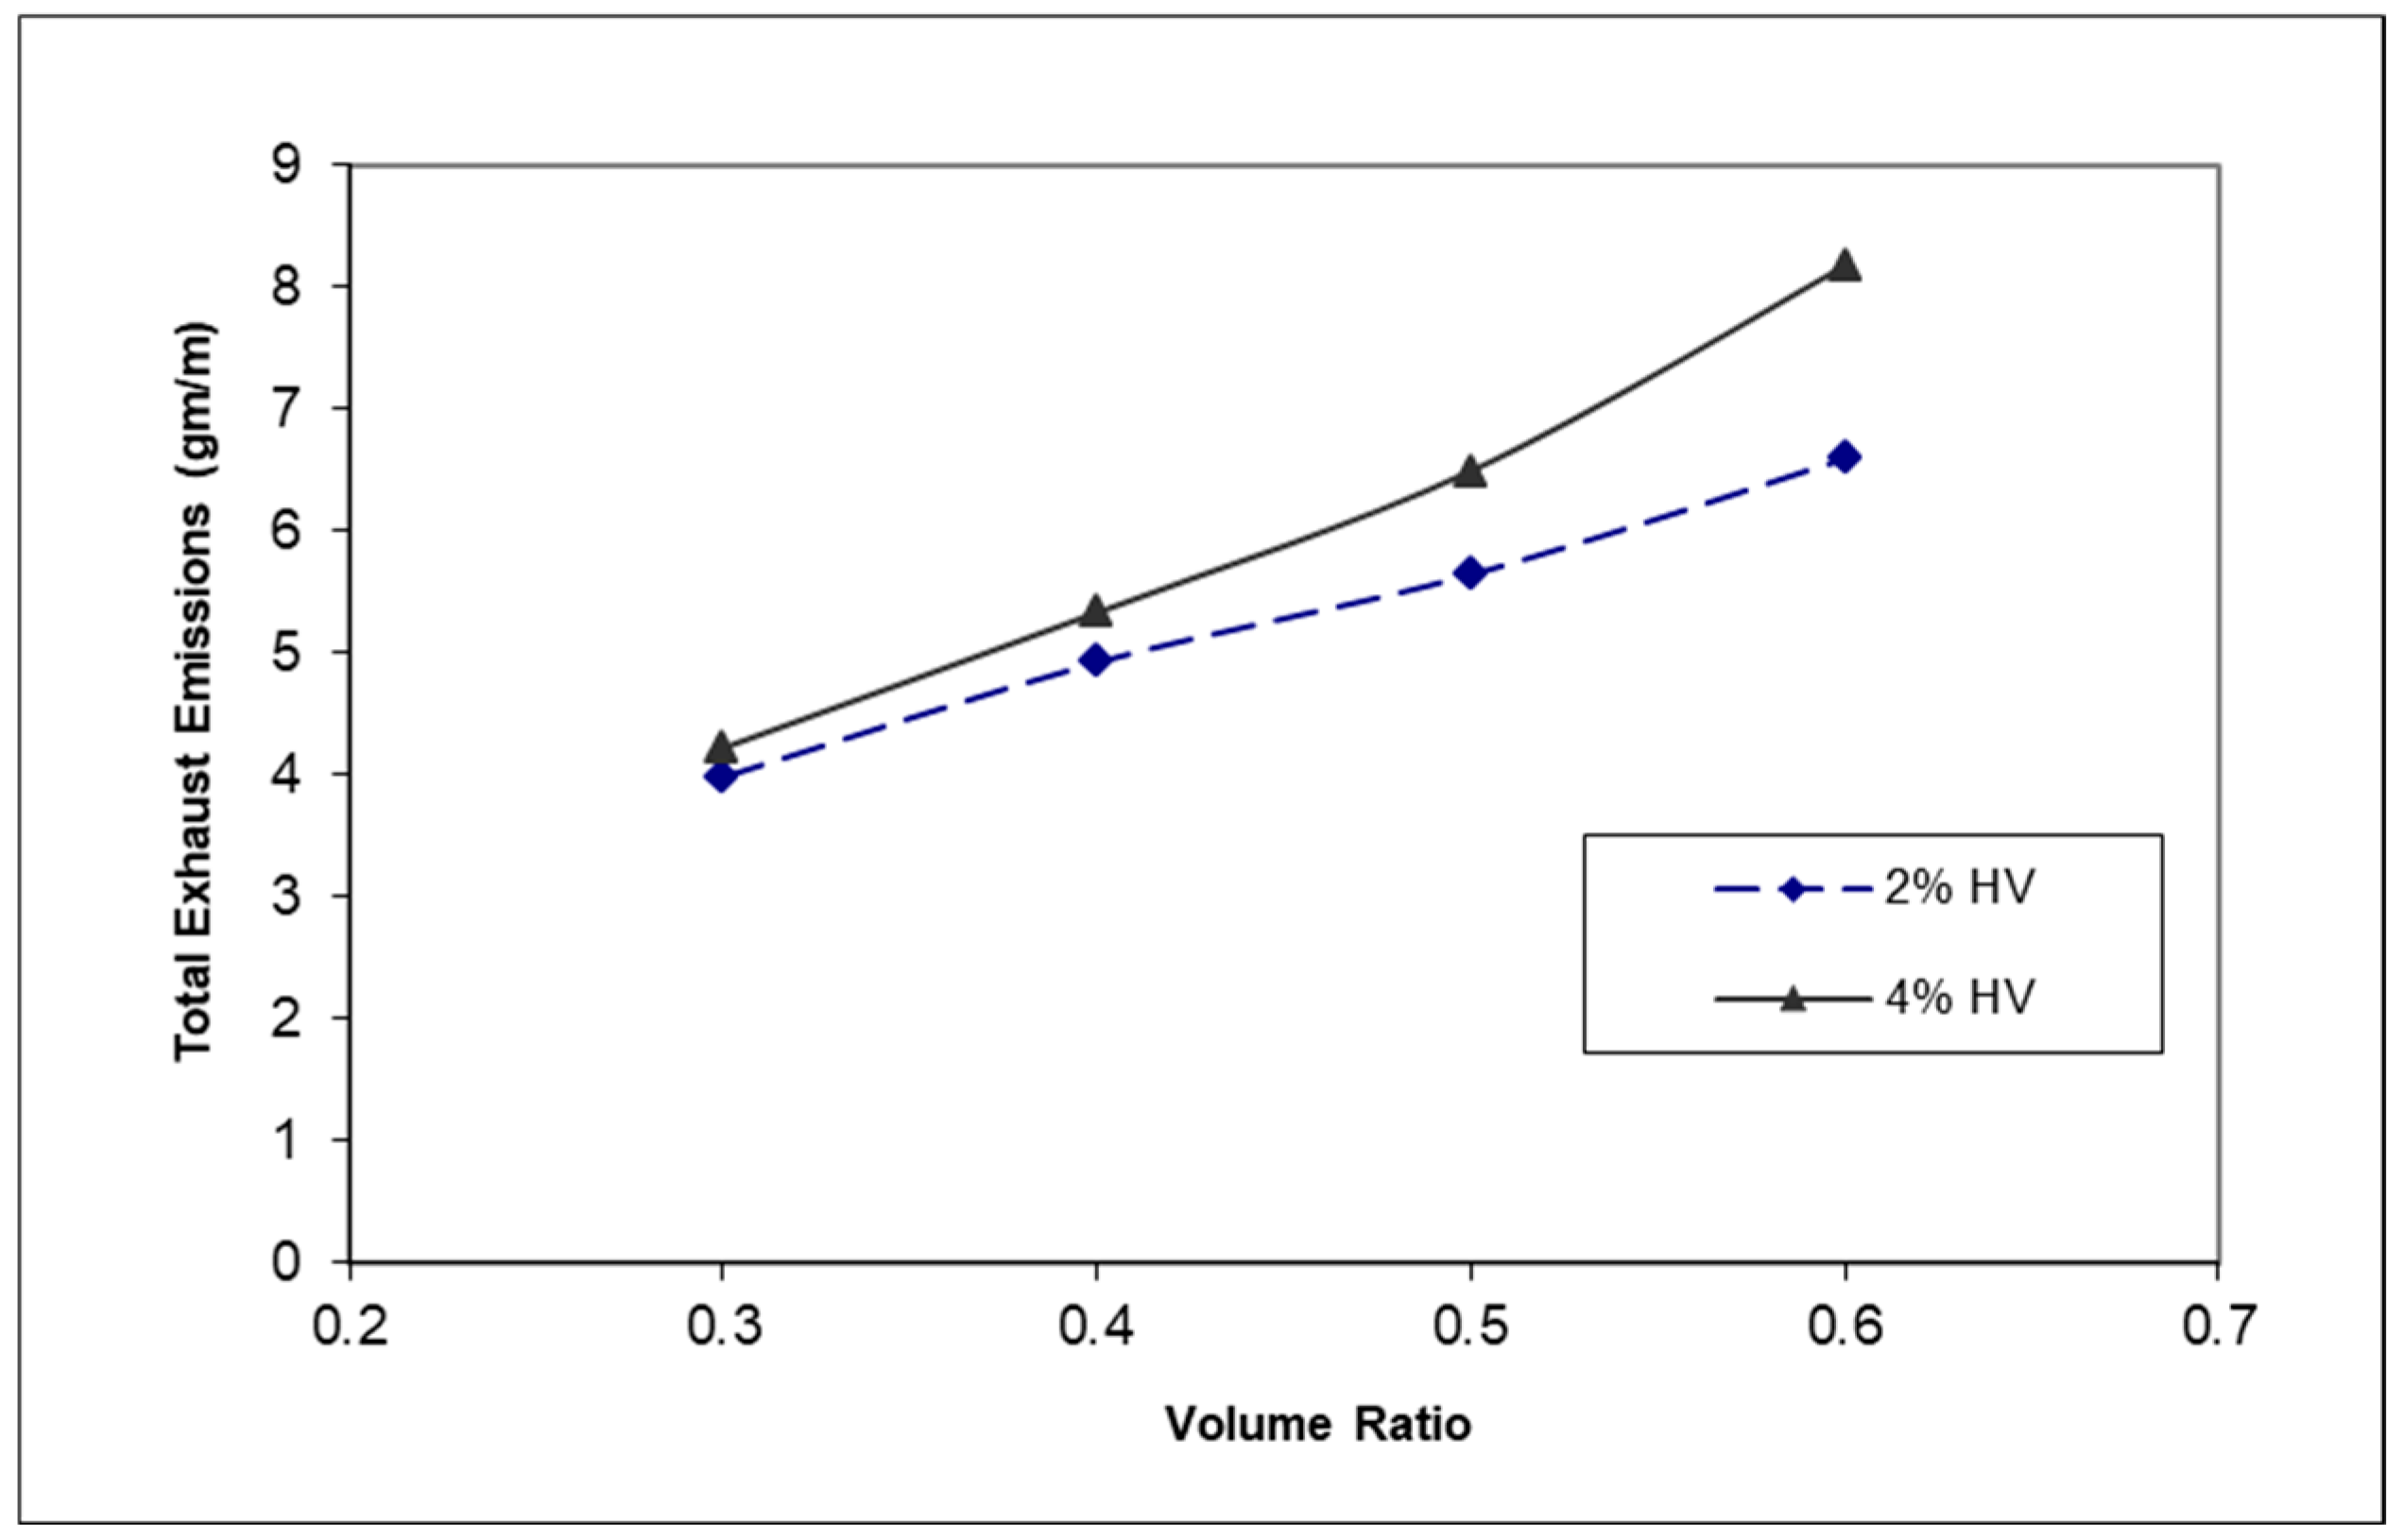
Figure 6 and Figure 7 display the effect of heavy vehicle percentage on the capacity and exhaust emissions for different volume ratios, respectively. According to Figure 6, increasing the percentage of heavy vehicles results in lower section capacity. Figure 7 shows that an increase in the percentage of heavy vehicles always results in higher exhaust emissions. At low volume ratios of up to 0.4, the effect of a higher percentage of heavy vehicles on exhaust emissions is minor. After this value, the effect becomes more significant.

4.3. Models for Capacity Estimation and Exhaust Emission Prediction

A regression analysis was conducted using the obtained data from the simulation to develop the relationship between capacity and the different affecting variables using the SPSS statistical computer program [32]. The capacity was set as the dependent variable, while the volume ratio and the weaving length were set as the independent variables. Two types of regression analysis were applied: linear regression and nonlinear regression. The same approach was used to propose a link between exhaust emissions, volume ratio, and weaving length.
Table 6 presents the results of regression analysis and t-test for both capacity estimation models and exhaust emission prediction. Logical coefficient signs were perceived. As for capacity estimation models, the negative sign of the volume ratio means that the capacity tends to decrease as the volume ratio increases. In contrast, the positive sign of the weaving length means that capacity tends to increase as the weaving length increases. On the other hand, for exhaust emission prediction models, the volume ratio positively correlated with exhaust emissions. This means that exhaust emissions tend to increase as the volume ratio increases. Moreover, the weaving length has a slightly negative effect on exhaust emissions. It is important to note that there are several factors that affect exhaust emissions, including driver aggressiveness, weather conditions, and engine condition [33].
Having applied the previous criteria, the linear regression model between capacity, volume ratio, and the weaving length is given as follows:
CAP = 5768.4 − 2739 VR + 0.483 WL,
where CAP = weaving section capacity (veh/hr); VR = volume ratio; and WL = weaving section length (m).
Similarly, the linear regression model between total exhaust emissions, volume ratio, and the weaving length is given as follows:
E = 1.212 + 9.267 VR − 0.0001 WL,
where E = total exhaust emissions (gm/m):
A nonlinear regression model with a similar expression of the HCM 2010 model for freeways has the following form:
CAP = 6000 − 525.4 (1 + VR)2.72 + 0.484 WL,
The resulting coefficient of determination (R2) of the developed models reflects a high goodness-of-fit of the models. It is important to note that the scope of the developed models is limited to the urban arterial weaving sections having the same geometric characteristics, configuration, and traffic conditions under study. Extensive investigation is necessary to generalize these models. The traffic flow characteristics of weaving sections in urban arterials clearly differ from those of freeways. They involve higher rates of conflicts, more lane changes, lower speeds, and lower capacities compared to freeway conditions [34]. Consequently, it is not convenient to compare the developed models for capacity estimation with the HCM 2010 model for freeways.

5. Conclusions and Recommendations

This paper presented an attempt to model two-sided urban weaving sections. The collected data were used in the development of micro-simulation models for case study sections on the Sakakah–Dumat Al-Jandal road located in the Aljouf Region, KSA. VISSIM software was used to analyze the capacity and exhaust emissions. It was utilized to model and simulate the investigated weaving sections through an experimental analysis with four important factors: main road traffic volume (five different levels), volume ratio (four different values), weaving length (four different lengths), and percentage of heavy vehicles (two levels). Furthermore, a regression analysis was conducted to develop mathematical models for capacity estimation and exhaust emission prediction of urban weaving sections.
  • The volume ratio has a significant impact on capacity and exhaust emissions. Increasing the volume ratio caused a decrease in capacity and an increase in exhaust emissions;
  • The volume ratio has a significant impact on capacity and exhaust emissions. Increasing the volume ratio caused a decrease in capacity and an increase in exhaust emissions;
  • Although the weaving length has a significant effect on the capacity of the weaving sections, it has a slight influence on the exhaust emissions;
  • The increase in the heavy vehicle percentage always generated lower-section capacity; however, it always exhibited higher-exhaust emissions. At low-volume ratios of up to 0.4, the effect of a higher percentage of heavy vehicles on exhaust emissions is minor. After this value, the effect becomes more significant;
  • Mathematical models were developed for the estimation of capacity and exhaust emission predictions of urban weaving sections. The proposed models have relatively high values of R2.
The developed models for estimating capacity and predicting exhaust emissions allow practitioners to improve traffic operations and lower exhaust emissions at urban weaving sections. It is worth noting that the scope of this study is limited to two-sided configurations of weaving sections on urban arterials having the same geometric characteristics and traffic conditions. Further research should be performed to generalize these models for different configurations of weaving sections under various traffic conditions that are not considered in the present study.

Author Contributions

Conceptualization, A.A. and M.R.; Methodology, A.A. and F.A.; Software, A.A. and M.R.; Validation, M.R.; Formal analysis, A.A. and M.R.; Investigation, F.A. and M.A.O.; Resources, F.A. and M.R.; Data curation, F.A.; Writing—original draft, A.A. and M.R.; Writing—review & editing, A.A. and M.A.O.; Visualization, F.A. and M.A.O. All authors have read and agreed to the published version of the manuscript.

Funding

This work was funded by the Prince Nawaf bin Abdelaziz Chair for Sustainable Development in collaboration with the Deanship of Scientific Research at Jouf University under grant No (DSR2021-Prince Nawaf bin Abdulaziz Chair-012).

Institutional Review Board Statement

Not applicable.

Informed Consent Statement

Not applicable.

Data Availability Statement

Data is included within the article.

Acknowledgments

This work was funded by the Prince Nawaf bin Abdelaziz Chair for Sustainable Development in collaboration with the Deanship of Scientific Research at Jouf University under grant No (DSR2021-Prince Nawaf bin Abdulaziz Chair-012).

Conflicts of Interest

The authors declare that they have no known competing financial interest or personal relationships that could have appeared to influence the work reported in this paper.

References

  1. Al-Majhad, H.; Bramantoro, A.; Syamsuddin, I.; Yunianta, A.; Basori, A.; Prabuwono, A.; Barukab, O. A Traffic Congestion Framework for Smart Riyadh City based on IoT Services. Int. J. Adv. Comput. Sci. Appl. (IJACSA) 2018, 9, 4. [Google Scholar] [CrossRef] [Green Version]
  2. Wang, F.; Gu, D.; Chen, A. Analysis of Traffic Operation Characteristics and Calculation Model of the Length of the Connecting Section between Ramp and Intersection. Sustainability 2022, 14, 629. [Google Scholar] [CrossRef]
  3. Zambrano-Martinez, J.L.; Calafate, C.T.; Soler, D.; Cano, J.-C.; Manzoni, P. Modeling and Characterization of Traffic Flows in Urban Environments. Sensors 2018, 18, 2020. [Google Scholar] [CrossRef] [PubMed] [Green Version]
  4. Habtie, A.B.; Abraham, A.; Midekso, D. Artificial Neural Network Based Real-Time Urban Road Traffic State Estimation Framework. In Computational Intelligence in Wireless Sensor Networks: Recent Advances and Future Challenges; Springer: Berlin/Heidelberg, Germany, 2017; pp. 73–97. [Google Scholar]
  5. Golob, T.F.; Recker, W.W.; Alvarez, V.M. Safety aspects of freeway weaving sections. Transp. Res. Part A Policy Pract. 2004, 38, 35–51. [Google Scholar] [CrossRef] [Green Version]
  6. TRB. Highway Capacity Manual; National Research Council: Washington, DC, USA, 2010.
  7. Zheng, Z.; Xiang, Q.; Gu, X.; Ma, Y.; Zheng, K. The influence of individual differences on diverging behavior at the weaving sections of an urban expressway. Int. J. Environ. Res. Public Health 2021, 18, 25. [Google Scholar] [CrossRef]
  8. Mohajeri, A.; Akbarzadeh, M. Appraisal of different HCM methodologies for analysis of weaving segments, case study: A weaving segment in Isfahan, Iran. Transp. Lett. 2019, 12, 408–416. [Google Scholar] [CrossRef]
  9. Kusuma, A.; Liu, R.; Choudhury, C.; Montgomery, F. Analysis of the Driving Behaviour at Weaving Section Using Multiple Traffic Surveillance Data. Transp. Res. Procedia 2014, 3, 51–59. [Google Scholar] [CrossRef] [Green Version]
  10. Kusuma, A.; Liu, R.; Choudhury, C. Modelling lane-changing mechanisms on motorway weaving sections. Transp. B Transp. Dyn. 2019, 8, 1–21. [Google Scholar] [CrossRef]
  11. Cantisani, G.; Del Serrone, G.; Di Biagio, G. Calibration and validation of and results from a micro-simulation model to explore drivers’ actual use of acceleration lanes. Simul. Model. Pract. Theory 2018, 89, 82–99. [Google Scholar] [CrossRef]
  12. Stewart, J.; Baker, M.; Van Aerde, M. Evaluating weaving section design using INTEGRATION. Transp. Res. Board 1996, 1555, 33–41. [Google Scholar] [CrossRef]
  13. TRB. Highway Capacity Manual; National Research Council: Washington, DC, USA, 1985.
  14. Lertworawanich, P.; Elefteriadou, L. A methodology for estimating capacity at ramp weaves based on gap acceptance and linear optimization. Transp. Res. Part B Methodol. 2003, 37, 459–483. [Google Scholar] [CrossRef]
  15. Ngoduy, D. Derivation of continuum traffic model for weaving sections on freeways. Transportmetrica 2006, 2, 199–222. [Google Scholar] [CrossRef]
  16. Roess, R.P.; Ulerio, J.M. Level of Service Analysis of Freeway Weaving Segments. Transp. Res. Rec. J. Transp. Res. Board 2009, 2130, 25–33. [Google Scholar] [CrossRef]
  17. Roess, R.P.; Ulerio, J.M. Capacity of Freeway Weaving Segments. Transp. Res. Rec. J. Transp. Res. Board 2009, 2130, 34–41. [Google Scholar] [CrossRef]
  18. Shoraka, M.; Puan, O.C. Review of evaluating existing capacity of weaving segments. Int. J. Civ. Struct. Eng. 2010, 1, 683–694. [Google Scholar]
  19. Pesti, G.; Chu, C.; Fitzpatrich, K.; Porter, R.; Le, T. Simulation of a weaving section between freeway ramps. In Proceedings of the Transportation Research Board 90th Annual Meeting, Washington, DC, USA, 23–27 January 2011. [Google Scholar]
  20. Yang, C.; Shao, C.; Liu, L. Study on Capacity of Urban Expressway Weaving Segments. Procedia Soc. Behav. Sci. 2012, 43, 148–156. [Google Scholar] [CrossRef] [Green Version]
  21. Calvert, S.; Minderhoud, M.M. Generic freeway weaving section capacity estimation through microsimulation. In Proceedings of the 91st Annual Meeting Transportation Research Board, Washington, DC, USA, 22–26 January 2012; Transportation Research Board (TRB): Washington, DC, USA, 2012. [Google Scholar]
  22. Sarvi, M. Freeway weaving phenomena observed during congested traffic. Transp. A Transp. Sci. 2013, 9, 299–315. [Google Scholar] [CrossRef]
  23. Marczak, F.; Daamen, W.; Buisson, C. Empirical Analysis of Lane Changing Behavior at a Freeway Weaving Section. Traffic Manag. 2016, 3, 139–151. [Google Scholar]
  24. A Policy on Geometric Design of Highways and Streets; American Association of State Highway and Transportation Officials (AASSHTO): Washington, DC, USA, 2001.
  25. Alanazi, F.; Yi, P.; Gehawi, N.E. Improving the Performance of Unsignalized T-Intersections Within Cavs Mixed Traffic. J. Appl. Eng. Sci. 2022, 20, 464–476. [Google Scholar] [CrossRef]
  26. Gomes, G.; May, A.; Horowitz, R. Congested Freeway Micro-simulation Model Using VISSIM. Transp. Res. Rec. 2004, 1876, 71–81. [Google Scholar] [CrossRef]
  27. Sabra, Z.; Wallace, C.; Lin, F. Traffic Analysis Software Tools. In Transportation Research Circular E-C014; Transportation Research Board, National Research Council: Washington, DC, USA, 2000. [Google Scholar]
  28. PTV ‘‘Planung Transport Verkehr A G”. VISSIM 9.00 User Manual; Innovative Transportation Concepts, Inc.: Karlsruhe, Germany, 2016. [Google Scholar]
  29. Kim, S.J.; Kim, W.; Rilett, L.R. Calibration of micro-simulation Models using Nonparametric Statistical Techniques. Transp. Res. Rec. 2005, 1935, 111–119. [Google Scholar] [CrossRef]
  30. Manjunatha, P.; Vortisch, P.; Mathew, T. Methodology for the Calibration of VISSIM in Mixed Traffic. In Proceedings of the Transportation Research Board 92nd Annual Meeting, Washington, DC, USA, 14–16 January 2013. [Google Scholar]
  31. Sarhan, M.; Talaat, H.; Mousa, R.M. Estimation of road capacity at weaving sections on urban arterials. In Proceedings of the he 94th Transportation Research Board Annual Meeting, Washington, DC, USA, 11–15 January 2015. [Google Scholar]
  32. SPSS for Windows; Rel. 11.0.0; SPSS Inc.: Chicago, IL, USA, 2013.
  33. Hashim, I.; Ragab, M.; Asar, G. Optimization of Vehicle Delay and Exhaust Emissions at Signalized Intersections. Adv. Transp. Stud. 2018, 46, 5–18. [Google Scholar]
  34. Soliman, A. Evaluation of Weaving Sections in Urban Areas: A Micro-Simulation-Based Approach. Master’s Thesis, Faculty of Engineering, Fayoum University, Fayoum, Egypt, 2016. [Google Scholar]
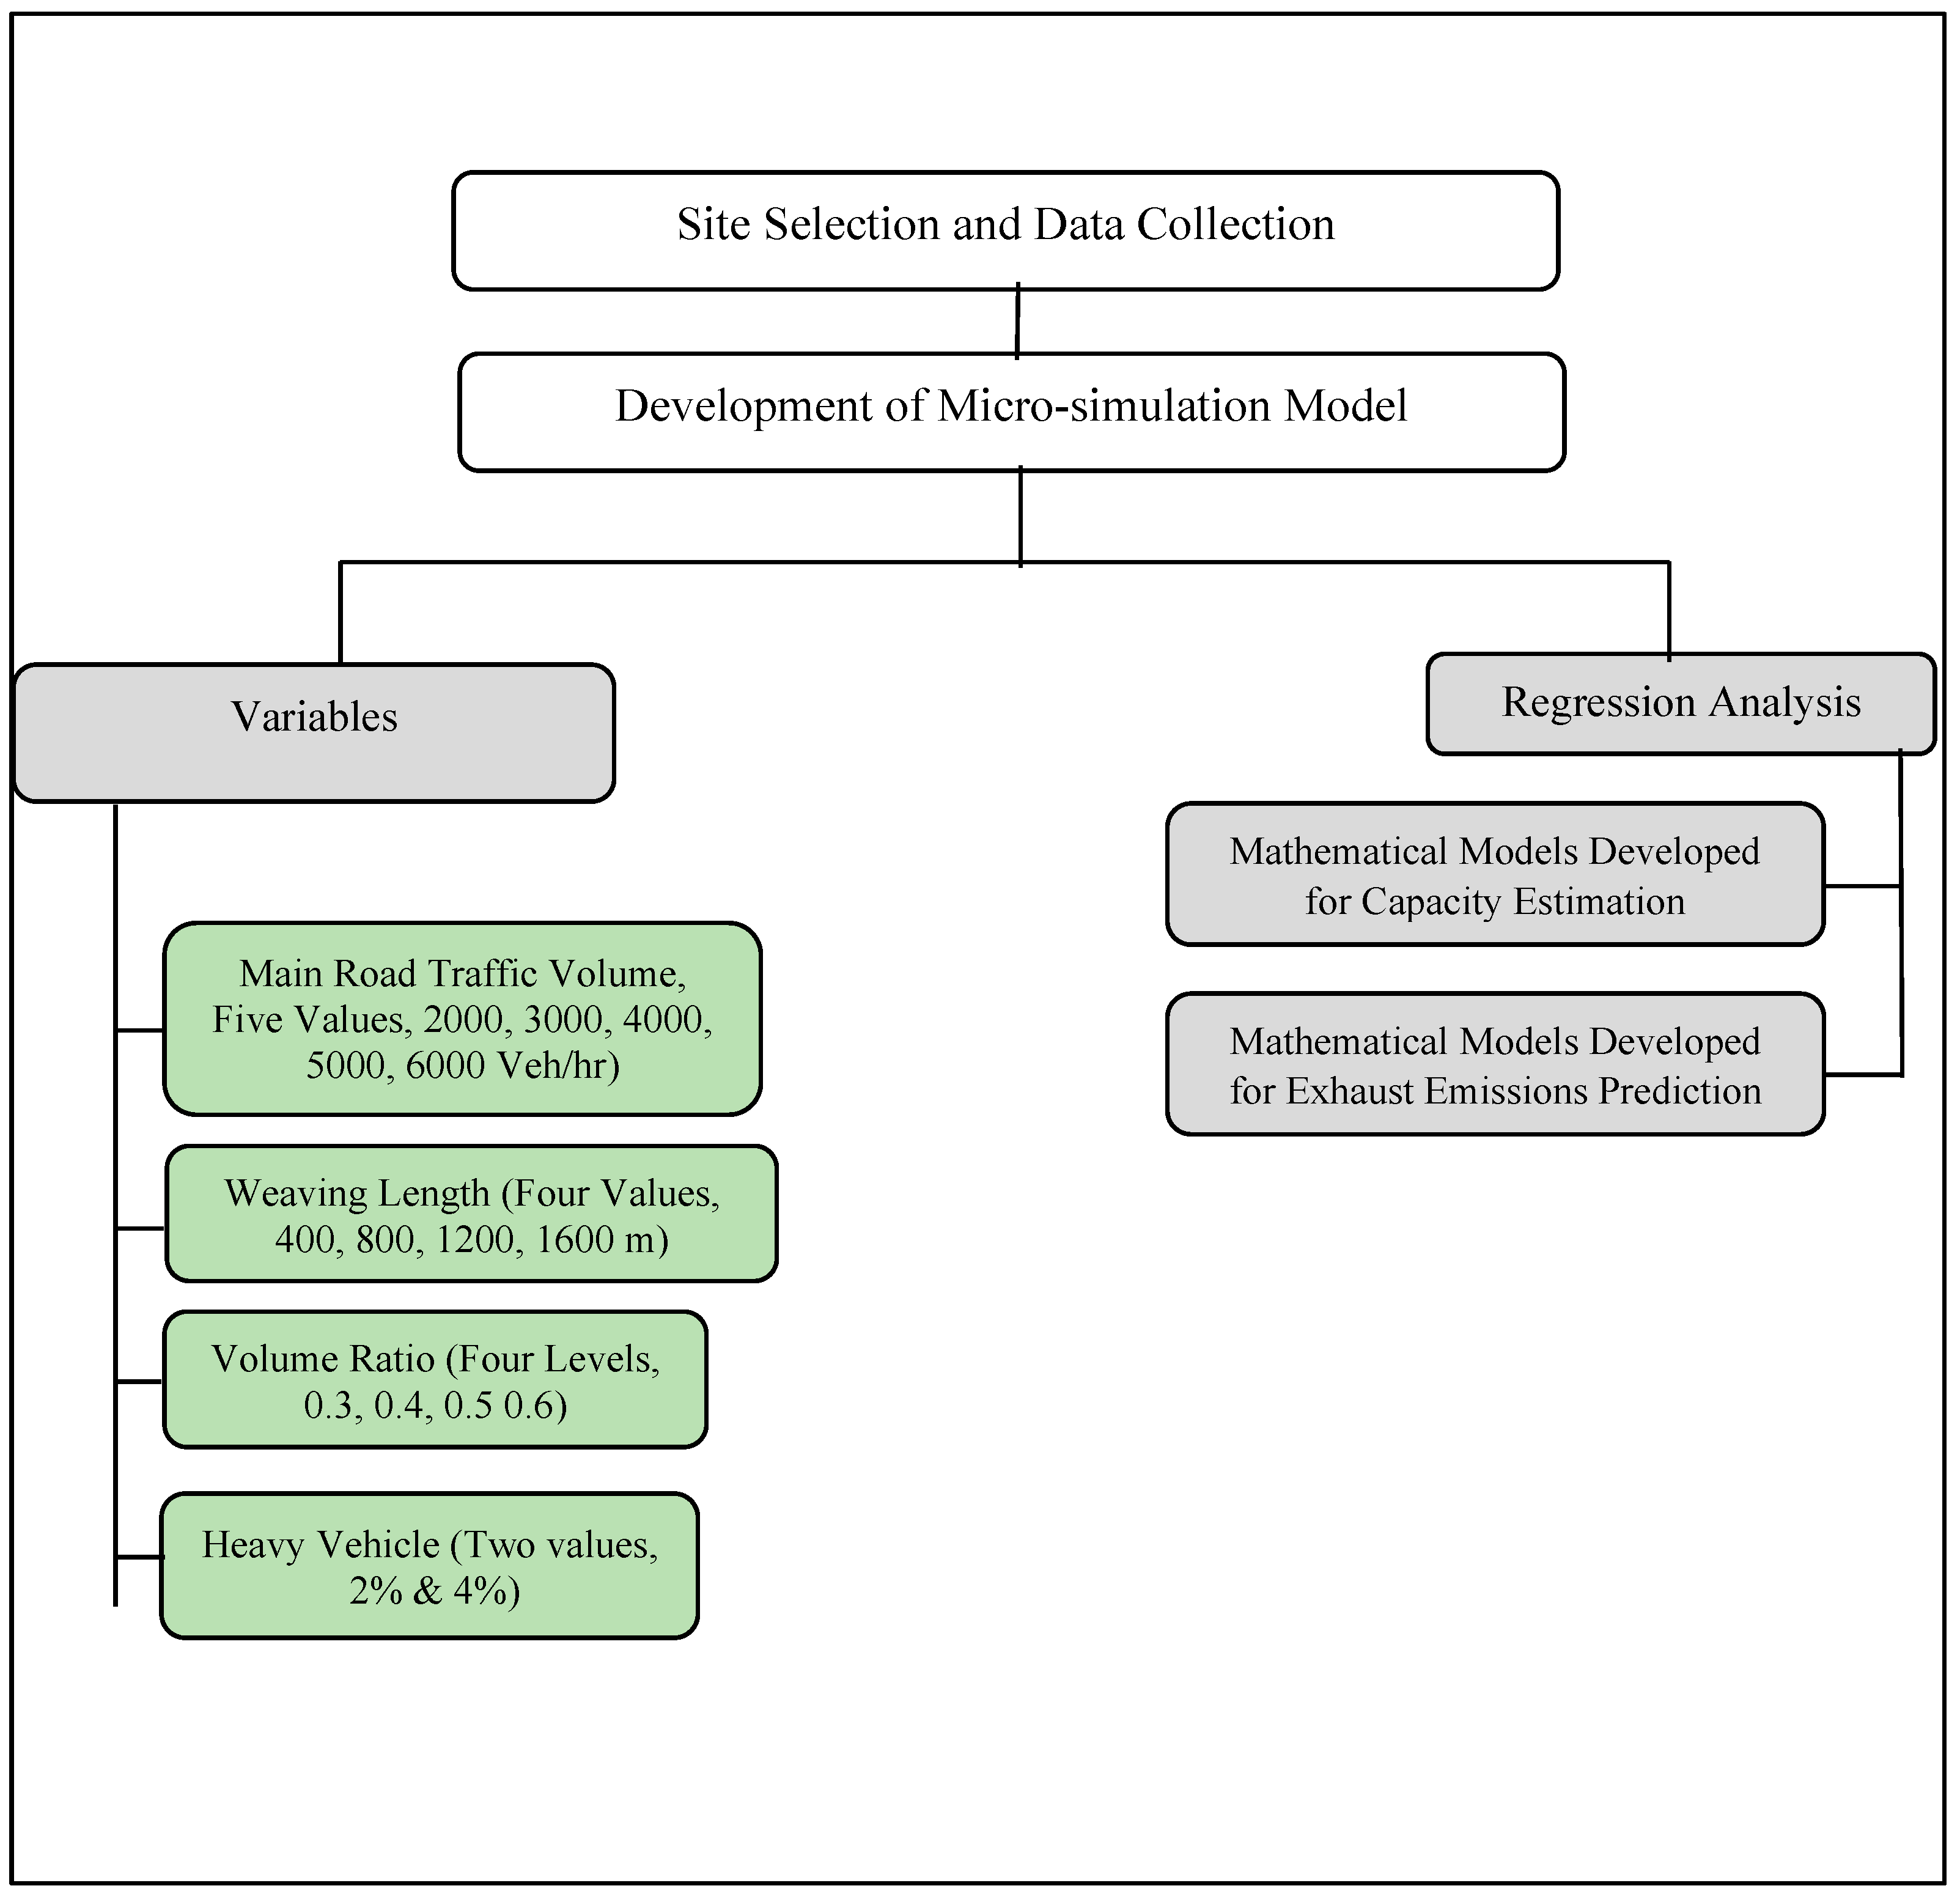
Figure 1. Flowchart of the research methodology.
Sustainability 15 04275 g001
Figure 2. Layout of the investigated site (Sakakah–Dumat Al-Jandal road-No. 65, Aljouf region, KSA).
Sustainability 15 04275 g002
Figure 3. Examples of the relationship between demand and simulated throughput (HV% = 2%) for different lengths of weaving section: (a) Weaving length = 400 m; (b) Weaving length = 1600 m.
Sustainability 15 04275 g003
Figure 4. Effect of Weaving Section length on capacity (HV% = 2%).
Sustainability 15 04275 g004
Figure 5. Effect of weaving section length on exhaust emissions (HV% = 2%).
Sustainability 15 04275 g005
Figure 6. Effect of heavy vehicles’ percentage on capacity (weaving length = 400 m).
Sustainability 15 04275 g006
Figure 7. Effect of heavy vehicles’ percentage on exhaust emissions (weaving length = 400 m).
Sustainability 15 04275 g007
Table 1. Geometric and traffic volume parameters for the investigated road.
ParameterValues
Weaving Section Length, m400, 800, 1200, and 1600
Main Road Volume, Veh/hr2000, 3000, 4000, 5000, and 6000
Volume Ratio0.3, 0.4, 0.5, and 0.6
Heavy Vehicles Percentage2 and 4
Table 2. Results of percent error measurement of travel time for model calibration and validation.
ProcessWeaving SectionTravel Time (sec)
ObservedSimulatedError (%)
Before Calibration A26.2429.4112.08
After Calibration A26.2427.153.47
Validation B69.1871.984.05
Table 3. Default and calibrated driving parameters of VISSIM.
Parameter Default ValuesCalibrated Values
Average Standstill Distance, m21
Additive part of Desired Safety Distance, m22
Multiple part of Desired Safety Distance, m32
Table 4. Capacity estimations from simulation scenarios.
HV%VRCapacity (veh/hr/dir)
WL = 400 mWL = 800 mWL = 1200 mWL = 1600 m
2% 0.35142534855565792
0.44776496151515378
0.54695487250535259
0.64335448546494846
4% 0.34828500551875396
0.44499466148255020
0.54426457947384928
0.64102423243784553
Table 5. Exhaust emissions estimations from simulation scenarios (demand = 6000 veh/hr).
HV%VRTotal Exhaust Emissions (gm/m)
WL = 400 mWL = 800 mWL = 1200 mWL = 1600 m
2% 0.33.983.733.533.45
0.44.924.754.624.54
0.55.645.585.465.38
0.66.596.516.476.40
4% 0.34.224.033.913.82
0.45.334.144.023.94
0.56.496.316.246.15
0.68.178.078.027.93
Table 6. Results of the linear regression models for capacity estimation and exhaust emission prediction.
Dependent Variable Independent Variable Coefficientst (p-Value)R2F (p-Value)
Capacity CAP (veh/hr) Constant5768.463.635 (0.000)0.967189.639 (0.000)
Volume Ratio (VR)−2739.0−15.917 (0.000)
Weaving Length (WL)0.48311.222 (0.000)
Exhaust Emissions, E (gm/m)Constant1.21212.789 (0.000)0.9951346.652 (0.000)
Volume Ratio (VR)9.26751.507 (0.000)
Weaving Length (WL)−0.0001−6.350 (0.000)
Disclaimer/Publisher’s Note: The statements, opinions and data contained in all publications are solely those of the individual author(s) and contributor(s) and not of MDPI and/or the editor(s). MDPI and/or the editor(s) disclaim responsibility for any injury to people or property resulting from any ideas, methods, instructions or products referred to in the content.