1. Introduction
Design thinking (DT) is an approach to solving complex problems that has gained considerate popularity in business and in academia. Initially, engineers used DT to solve problems related to product development and innovation in production processes, but the approach was later adopted by other fields, including architecture, cybernetics, ergonomics, marketing, and management [
1,
2,
3,
4]. Nowadays, it is used in many organizations of various types.
Organizations are highly interested in improving performance through DT. Indeed, there is some evidence for this method’s effectiveness; however, these data are fragmented and scarce. Previous DT research has tended to focus on the specific parts of the process (e.g., using personas, generating ideas, prototyping, and testing) rather than the effectiveness of the approach. For example, Skogstad and Leifer [
5] designed a study with teams consisting of Stanford University students who tackle industry-posed problems over the course of 7 months and were working to develop fully functional product prototypes of their solutions. They found that teams gained key insights efficiently through learning by doing (prototyping) rather than through theoretical pondering (or planning) of the merits of an idea. The other part of the DT process—interactions between team members were measured by Sonalkar et al. [
6] They showed that the utility of solutions was positively correlated with dialogues, the occurrence of humor and short yes-and-no responses.
Moreover, there are some explorative studies where the opinion about effectiveness and experience of companies using DT is being investigated. For example, Schmiedgen et al. [
7] asked 235 companies, which implemented DT as a part of their functioning, about their beliefs in the efficiency of DT. They showed that approximately 69% of respondents perceived the innovation process to be more efficient with DT, while almost none of the respondents measured its effectiveness (24%) and only a minority of them felt any financial benefits from using the DT approach (18%).
There is a very small body of experimental studies showing the effectiveness of DT. For example, Von Thienen et al. [
8] investigated and compared the effectiveness of homogeneous or interdisciplinary groups using DT methods or non-DT methods in developing programs which help people cope with trauma. Their results showed that DT solutions were perceived as more useful by experts but not more unique than non-DT methods, and interdisciplinary groups develop significantly worse solutions than homogeneous groups on all dimensions.
In this article, we present the process of designing the new, evidence-based design thinking method—the DTMethod, which is a result of a collaboration of an interdisciplinary team of researchers and practitioners. Because of the COVID-19-induced lockdown, we decided to make the new method fit for virtual teams and then tested it in both business and academic settings. The implementation of the DTMethod in actual organizational conditions showed very promising results in terms of teams’ performance. Most participants were satisfied with the new work method and with the results they achieved during the organizational challenge. We also presented the results of an empirical study that we have conducted to test the new methods’ effectiveness.
2. Design Thinking—Introduction and New Model Proposal
Different definitions of DT can be found in the literature (among others: [
2,
9,
10,
11,
12,
13,
14]. A review of these different approaches by Hassi and Laakso [
15] indicates that the DT concept comprises three dimensions: practice, cognitive approach, and mindset. The practice dimension includes the following components: human orientation, thinking by doing, visualization, the divergence–convergence approach, and collaboration. The cognitive approach dimension includes abductive reasoning, reflective problem transformation, holistic view, and integrative thinking. The mindset dimension includes an experimental and exploratory way of thinking, tolerating ambiguity, optimism, and a focus on the future. On the other hand, the systematic literature review by Magistretti et al. [
12] shows that DT could be described as a configuration of different processes: the deductive reasoning perspective adopted by individuals (design thinkers), experimental processes (developing hypotheses that are coming from observable information from the outside, and testing them with the market and users) with prototyping as a way of developing solutions and structure, which includes facilitators who control the time and objectives of each session.
The above dimensions are included in the most popular DT models: the Stanford model, created at the d.school (Stanford University, for the review of evolution of DT model see: Auerhammer and Roth, [
16]), and the double diamond model, described by the UK Design Council. However, these models are general, and they provide a framework, but not a specific structure. In the Stanford model, a typical workshop consists of five stages: Empathize: The purpose of this stage is to understand the user of the designed solution. Such understanding can be obtained with research tools, such as interviews, surveys, and observations. Define: The aim of this stage is to redefine the challenge faced by the design team in such a way that it relates to the knowledge obtained during the Empathize stage. Ideate: The goal of this stage is to generate as many ideas as possible that can respond to the challenge defined in the Define stage. Prototype: The goal of the stage is to build a tangible prototype that can be interacted with. Test: The purpose of this stage is to obtain feedback from users on the prototyped solution.
The aforementioned steps permeate and influence each other and can be repeated. DT is not a straightforward path to the best solution; rather, it is a series of steps back and forward. One of the model’s potential flaws is that it does not define which activities should be used during the workshops to achieve optimal benefits. Various users proceed with DT differently, and it remains uncertain which practices increase the effectiveness of this approach and which have no impact. For example, one practice commonly used in DT as a part of the Empathize stage is the creation of “personas”. A persona is a short description of a representative user to whom the solution will be addressed, created most often based on user research, and is a reference point a team uses when designing a solution to the problem; namely, it helps designers to understand and clarify user’s goals and behavior patterns [
17,
18]. Some create a persona based on a single interview with a representative of a stakeholder group, while others create a persona using the averaged results of several interviews, surveys, or observations. Chang, Lin, and Stolterman [
19] described different shortcomings of persona creations, such as: lack of data used for persona description, lack of data used to create persona when only one person is used as a model, time and cost of wide-ranging research for persona, and possible description of non-existent people due to combining information from different individuals into one persona. In fact, other research also showed that the use of a persona within DT processes may be ineffective or even have a negative effects [
20,
21,
22].
Another issue with the classical approach to DT is the assumption that “having fun” and maintaining a “good mood” among team members are crucial for DT’s effectiveness, especially during the idea generation phases. This is only partially accurate. For example, Friedman, Forster, and Denzler [
23], in three experiments, have shown that people are more creative during idea generation when their mood aligns with the task’s importance. That is, people indeed generate more ideas when their mood is positive, and the task is perceived as fun. However, if the task is important and is therefore perceived as serious, individuals generate more ideas when the mood is negative. Because DT is used to solve serious organizational problems, maintaining a ludic atmosphere might be an obstacle.
As some researchers [
7] have noted, evaluating the effectiveness of DT processes is difficult. Quantitative (especially experimental) studies on DT are, to the best of our knowledge, very rare, and demonstrating the effect of DT on organizations through qualitative research is difficult. This may be due to the lack of a standardized procedure.
As a team of academics and professionals interested in the popularization of DT, we decided to create an evidence-based DT method, which we term the “DTMethod”. In the next chapters, we present the process of designing the DTMethod (and associated tools) and the empirical study we conducted to test its effectiveness.
2.1. New DTMethod Development and Description
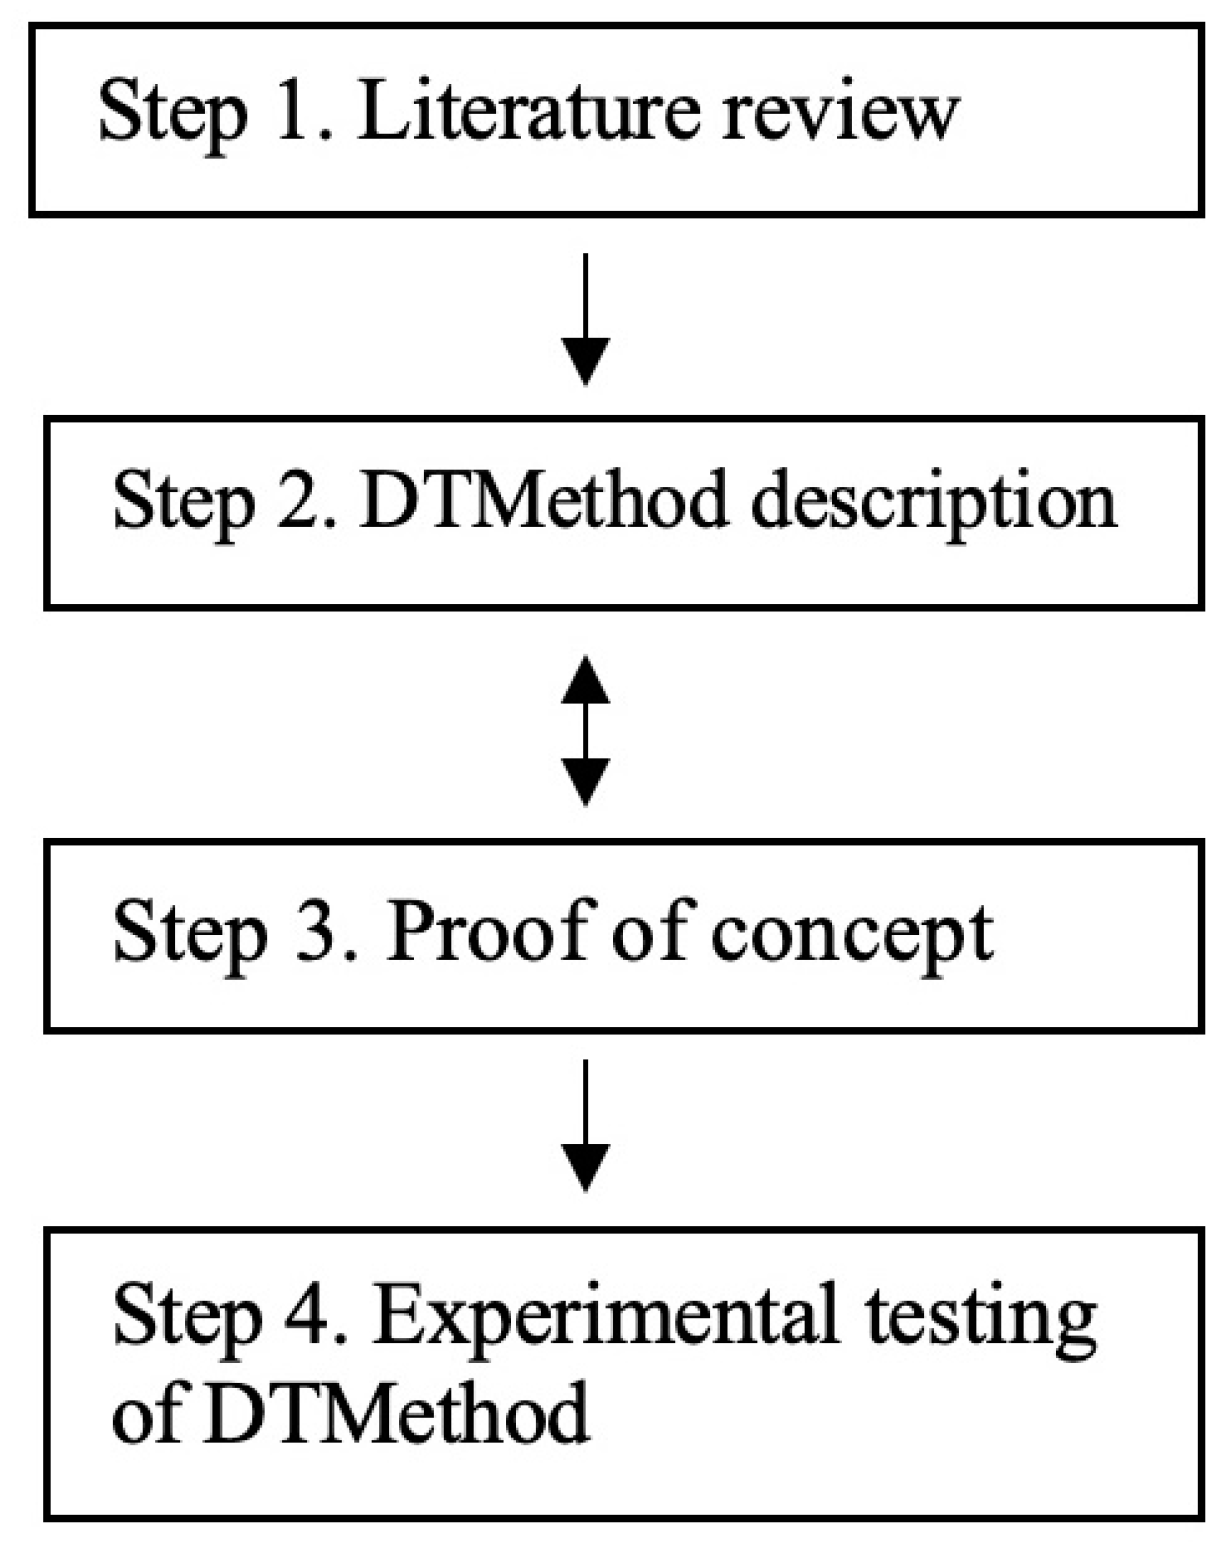
In response to the need for a standardized procedure that allows users to achieve maximum benefits during DT workshops, we created the DTMethod. The DTMethod is a procedure consisting of specific activities to help teams efficiently develop solutions to problems and create appropriate products and services. The creation of the procedure is shown at
Figure 1 and involved the following four steps:
Step 1: An extensive literature review was conducted on DT, creativity, and team collaboration. Due to the COVID-19 pandemic, the review was extended to include the literature on collaboration among remote teams. Over 100 books and articles were reviewed.
Step 2: Based on Step 1, a description of the process and rules to be followed when conducting DT workshops was created.
Step 3: As a proof-of-concept attempt, DT teams were established in two companies to find solutions to real organizational problems. Appropriate changes to the method were made based on this experience.
Step 4: During the experimental portion of this study, the developed DT methodology was tested in an academic environment.
DTMethod is a procedure that consists of the following: (1) A schedule of meetings divided into three phases (DTModel); and (2) a set of rules (DTRoles and Rules) and tools (DTTools).
The team working to develop solutions usually consists of three to five people, called “DTDesigners.” DTDesigners do not need any specific experience or competence. They participate in workshops conducted by the “DTFacilitator,” a person responsible for directing the team to carry out the DTMethod in accordance with its principles, upholding the correct use of tools, motivating the team, and providing suggestions on the effective use of the tools. The solution to be designed by the DTDesigners is focused on the challenge (problem) proposed by the “DTSponsor,” a person whose position in the organization allows them to involve employees in DT workshops. A DTSponsor is also the person to whom the DTDesigners provide the developed solution, and they decide what the organization does with the solution.
When carrying out the DTMethod, the team completes the following three phases of the DTModel: the exploratory phase (focused on exploring the challenges to be addressed), the creative phase (focused on stimulating creativity and generating ideas), and the construction phase (during which designers build prototypes of solutions and evaluate them with stakeholders). The DTFacilitator is responsible for ensuring that all participants follow the rules and perform their duties according to their roles (DTRules and Roles).
2.1.1. DTModel: Exploratory Phase
The aim of this phase is to learn about the challenge in detail. Stakeholder-oriented solutions are developed during DT; therefore, one of the main tasks of the exploratory phase is to examine and understand these needs. This approach should be inexpensive, dynamic, and fast. Therefore, the DTMethod uses the research reconnaissance approach, which involves surveying and interviewing a small sample.
2.1.2. DTModel: Creative Phase
During this phase, DTDesigners follow the four steps to generate as many ideas as possible. These steps are based on research on the effectiveness of creative sessions [
24,
25,
26].
Step 1: Groups generate categories of ideas based on the prioritized needs of stakeholders. Groups that generate ideas based on certain categories can be expected to generate more [
27] and more innovative ideas [
2,
28,
29] than groups that generate ideas without categories.
Step 2: Team members generate ideas individually. According to existing research, team members working individually generate up to twice as many ideas as the same number of people working together [
30,
31].
Step 3: Team members collaboratively discuss ideas. This step involves combining and improving ideas; according to Goldenberg, Larson, and Wiley [
32], doing so increases the efficiency of idea generation.
Step 4: Selecting ideas with the highest potential to solve the challenge (using the Relative Importance Grid [RIG] tool).
Through the above process, DTDesigners select three to five ideas with the greatest potential to solve the problem. These ideas are prototyped during the next phase of the DTModel.
2.1.3. DTModel: Construction Phase
The aim of this phase is to build prototypes (e.g., tangible examples, visualizations, products) to determine how each solution would work. The prototypes are then evaluated, and the feedback is collected from stakeholders. According to some research, e.g., [
33], prototyping has the following benefits: the solution addresses the challenge more effectively, the team quickly finds that the solution is ready, the cost of creating a solution is reduced, and designers have more confidence in the solution’s suitability and effectiveness.
After building prototypes, DTDesigners test them by collecting feedback from stakeholders and making changes and improvements. This iterative process leads to a solution that is both satisfactory to stakeholders and cost effective for the organization.
2.2. The New DTMethod Effectiveness Testing in Two Companies
We tested the DTMethod in two business organizations: an international IT company and an international consulting company. The latter was one of the “big four” accounting firms. In both companies, teams were created to find a solution to an internal problem. While teams completed the DT processes, we drew conclusions about DTModel, DTRules and Roles, and DTTools, and we used these conclusions to improve the methodology.
After the workshops, participants were asked to fill out a questionnaire to evaluate their engagement with teamwork, engagement with the team, and their satisfaction with the DT process. We also asked open questions about the pros and cons of the DTMethod and other conclusions and feedback. A total of 32 people answered the questionnaire. Workshop participants’ comments (selected examples) were mostly positive:
“I really like this method; the workshops were also very well conducted; overall, I am satisfied with the work with this method.”, “It is a very interesting method, very informative, and we will definitely use it more often. I am glad to be in the project group because it allowed me to get to know ideas for the implementation of our project, and we also had the opportunity to help the entire project with ideas for its implementation.”
There were negative comments as well:
“Intensity. While DT in itself is intense and that’s ok, with the sheer volume of daily work, it was hard to implement without neglecting your duties.”, “I don’t think this is a method for everyone. People who are not open cause some stagnation when creating new solutions.”
Both organizations declared that they would use the DTMethod for future internal processes and arranged for additional workshops to be conducted after the testing phase was complete. We also gathered insights from workshop facilitators. Based on all the feedback we received, the method was adjusted and improved. Next, we empirically verified the utility of the DTMethod by comparing it to the traditional approach.
2.3. The New DTMethod Empirical Testing Using Experimental Design
The goal of the current study is to establish the effectiveness of the newly developed DTMethod. Because the goal of the DTMethod is to provide evidence-based, standardized, and verified techniques, we designed the experiment to establish its effectiveness. Effectiveness was measured on three dimensions: (1) alignment with sponsors’ criteria; (2) design attributes/outcome evaluation; (3) teamwork and individual satisfaction. We wanted to test whether the DTMethod meets these three criteria more effectively than the alternative method. We predicted that, compared to the alternative method, the DTMethod would result in solutions that more accurately meet the owners’ criteria, result in better teamwork and individual satisfaction, and generate more positive evaluations of the final process outcome.
3. Materials and Methods
3.1. Procedure and Participants
Phase 1: Workshops and generating solutions. Participants were recruited at SWPS University, and all majored in the social sciences or the humanities (psychology, philology, graphics, law). Most participants had prior or current job experience and were attending university for additional competence enhancement. They were awarded with credit points for taking part in the experiments. Ultimately, 131 people took part in the study. The average age of the respondents was M = 29.49 (minimum 18 years, maximum 53; SD = 8.88); 99 participants were women and 29 were men.
The workshops were held online and lasted for approximately 5.5 h. They were conducted by six facilitators (one facilitator per workshop), each of whom had at least five years of experience with conducting workshops in business settings. The aim of the workshop was to develop a solution to the problem provided by the DTSponsor, namely to increase students’ interest in joining a science club. Our aim was to design a task that reflected a real need or problem in an organization that could be solved by its members.
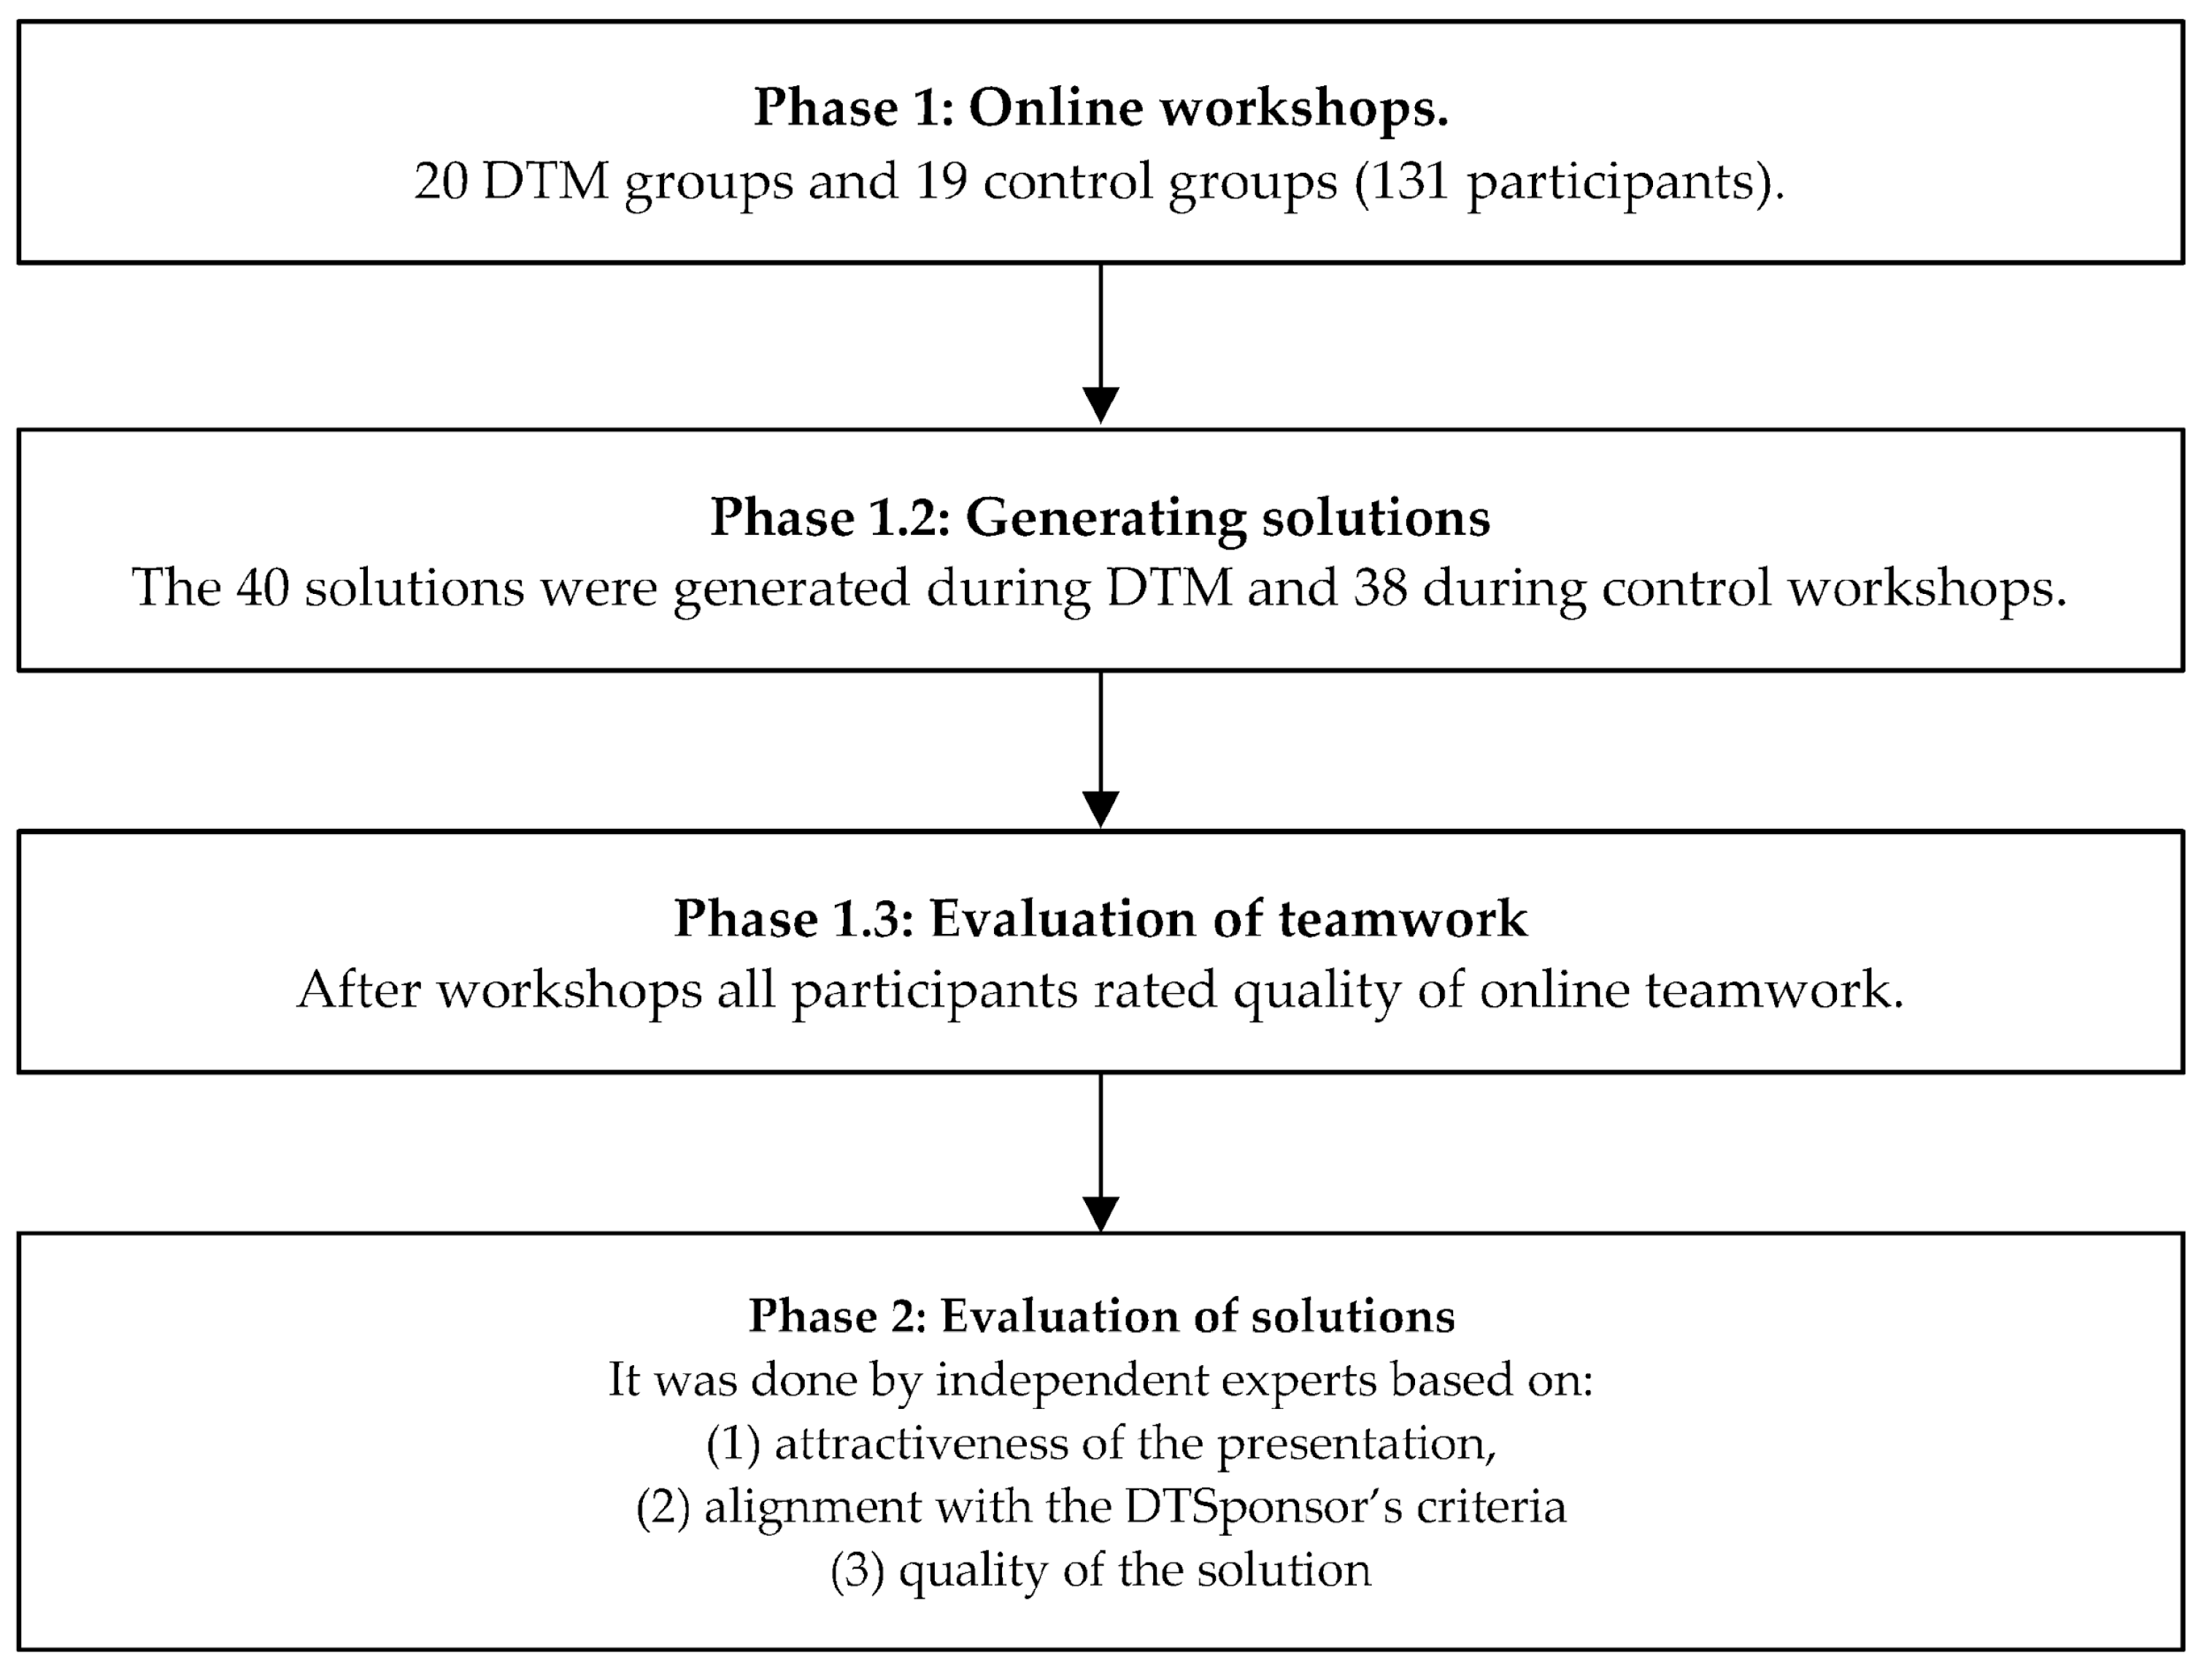
We provided participants with a short description of a made-up students’ science club and a list of the DTSponsor’s criteria. All groups had to develop two solutions. All solutions were later shared through a Microsoft PowerPoint presentation. Participants worked in groups of three or four, and they were randomly assigned to either the DTMethod or the control workshop group. Twenty DTMethod workshops were conducted during which a total of 40 solutions were developed, as each group developed two solutions. In 19 control workshops (no specific method of teamwork), 38 solutions were developed. After the workshops, each participant rated the quality of teamwork on several dimensions (see Materials below).
Phase 2: Evaluation of Solutions. All solutions were assessed by four independent experts, who had extensive work experience with recruiting participants to student science clubs. Each expert rated 39 solutions in a random order, based on three types of criteria: (1) attractiveness of the presentation, (2) alignment with the DTSponsor’s criteria, and (3) quality of the solution. Each solution was assessed independently by two judges, and a final assessment was a mean of those ratings. This procedure was necessary to estimate the reliability of the experts’ ratings and minimize the effect of expert bias. All phases of experimental procedure are illustrated on
Figure 2.
3.2. Materials
Attractiveness of the presentation. Because the attractiveness of a solution’s presentation could affect its assessment, regardless of its substantive factors, we decided to use this factor as a control variable. Experts assessed the attractiveness of each presentation on a scale of 1 (I completely disagree) to 7 (I fully agree) on three items: attractiveness, neatness, and visual appeal. The reliability of scale was good (Cronbach’s α = 0.924).
Meeting the DTSponsor’s criteria for the final results. This was the most important variable in terms of assessing the DTMethod’s effectiveness. The DTSponsor sets certain criteria, which are the key requirements used to determine whether solutions are appropriate. In this case, the DTSponsor set eight criteria, described below.
Independent experts rated all solutions on a seven-point scale (1: it does not meet the criteria at all; 7: it fully meets the criteria). Additionally, exploratory factor analysis was conducted (using the maximum likelihood method and VARIMAX rotation) to facilitate the data analysis and interpretation. The following two factors were revealed: (1) the quality of the solution, which consisted of four indicators: original, encourages students to quickly enroll in the club, ensures wide access and access for the group most likely interested in solution, and (2) the feasibility of the idea, which consisted of four indicators: online, cheap to implement, easy to organize, and possible to implement in one month. The reliability of both factors was good (α = 0.829 and α = 0.840, respectively).
Design attributes. A scale was used to assess product quality [
34]. The original scale contained 49 adjectives. For the purposes of the study, the items pertaining to material products were rejected (e.g., ergonomic, safe, rhythmic), and the remaining 27 adjectives were used. The experts’ task was to evaluate the degree to which the adjectives describe each solution on a scale of 1 (completely disagree) to 7 (completely agree). To simplify the statistical analyses, we decided to use content analysis and combine the adjectives into seven dimensions. Content analysis was conducted by two independent experts with work experience in the marketing field who were unaware of the hypotheses. They examined all the adjectives and combined them into wider dimensions that described a good marketing solution. Thus, six dimensions of quality were developed:
User-friendly: This dimension consisted of the following adjectives: emotional, entertaining, focused on needs, well-matched to user, non-user-friendly, user-friendly. The factor reliability was very good, α = 0.844.
Feasible: Consisted of the following adjectives: applicable, highly functional, valuable to business, practical, universal, and feasible (α = 0.751).
Innovative: Consisted of the following adjectives: novel, unique, likely to cause a perspective shift, improved, innovative, and trendy (α = 0.940).
Beneficial to business: Consisted of the following adjectives: effective, highly functional, valuable to business, professional, focused on needs, and fit to user (α = 0.829).
Complete/perfect: Consisted of the following adjectives: ideal, complete, well-arranged, manageable, sustainable, and well-balanced (α = 0.811).
Useful: Consisted of the following adjectives: applicable, effective, highly functional, valuable for business, practical, professional, and manageable (α = 0.763).
Emotions during workshop. After writing down their solutions, participants completed a questionnaire to assess job-related emotions, arousal, and satisfaction [
35,
36]. The tool consisted of 12 adjectives describing mood (e.g., annoyed). Respondents assessed the frequency with which they experienced each emotion during the workshops on a scale of 1 (never) to 7 (very frequently).
Teamwork quality. We used the teamwork quality scale TWQ, [
37], to measure three aspects of teamwork: teamwork quality, teamwork performance, and personal goals. This scale included 44 statements that participants rated from 1 (completely disagree/never) to 6 (fully agree/always). Items referred to subjective perceptions of teamwork. Examples include, “There was frequent communication within the team,” “The team did not see anything special in this project”, and “The team members were happy with the precision of the information received from other team members”.
The teamwork quality dimension consisted of subscales: communication (α = 0.710), coordination (α = 0.600), mutual support (α = 0.880), mutual effort (α = 0.609), team cohesion (α = 0.826), and work balance (α = −0.01); due to a very low reliability this subscale was removed from analysis). The teamwork performance dimension included only one subscale suitable for this study: effectiveness (α = 0.884) and the personal goals dimension included the subscales work satisfaction (α = 0.884) and learning (α = 0.884).
5. Discussion and Conclusions
In this article, we presented the process and outcomes of developing and testing the effectiveness of the evidence-based tool for productive teamwork. We invited an interdisciplinary team of academics and practitioners who, based on existing evidence, developed the DTMethod, a new Design Thinking methodology for cooperation in creative teams. This approach is in line with researchers’ call to create stronger ties between the theory and practice of design thinking [
12].
Therefore, after achieving satisfactory results during the testing phase, we have conducted the experiment, which aimed to compare the DTMethod to typical problem-solving teamwork sessions. We gathered 20 experimental groups and 19 control groups. We found that the solutions developed by the DTMethod teams, compared to the control group, were more effective in terms of quality, originality, overall range, and encouragement. Solutions developed by the control groups were more effective in terms of the availability for online use and feasibility. There were no differences in terms of the cost, ease of implementation, range among the target group, and ability to be implemented within one month.
To evaluate the socio-emotional aspects of teamwork, we used four factors: general emotionality (e.g., I feel relaxed, worried, pleased, tense), teamwork quality (e.g., communication, coordination, support), teamwork effectiveness, and personal goals (e.g., work satisfaction, learning). We found that the participants in the control condition exhibited more positive emotionality than those in the DTMethod condition. They declared themselves to be more relaxed, calm, and pleased, whereas participants in the experimental groups were more tense, anxious, and dispirited. This might be because the DTMethod entails a relatively strict procedure in comparison to the control condition. In other words, participants in the DTMethod condition were less at ease during the process because the process itself was restrictive. However, satisfaction with teamwork was higher in the DTMethod teams. Work cohesion, communication, and communal effort and support were all significantly higher among DTMethod team members. This might suggest that, even though personal emotional wellbeing was suboptimal, the teamwork spirit was high and satisfying. Future research might help to determine whether the more restrictive nature of the DTMethod affected the overall emotional response. Additionally, it would be beneficial to investigate whether improvements to the DTMethod could elicit more positive emotional responses from participants. Perhaps some techniques could be incorporated into the process to facilitate a more positive mood. Conversely, it is worth monitoring whether such changes would affect the key variables, such as work effectiveness. Finally, personal work satisfaction and learning were both higher for the DTMethod participants. This is a very beneficial outcome because, as studies show, work satisfaction is strongly connected to work engagement and turnover intention [
38]. We found no significant differences between the conditions regarding participants’ evaluation of teamwork effectiveness. In other words, both DTMethod teams and teams in the control condition evaluated teamwork effectiveness similarly. We demonstrated that the empirical testing of DT, although challenging [
7] in many respects, is indeed possible and should be encouraged. Our findings also contribute to the line of research on creativity in teams described earlier, such as the role of mood and emotionality or work satisfaction.
5.1. Practical Application
Various descriptions of design thinking, sometimes containing conflicting guidelines, can be an obstacle to the effective application of this approach. A lack of uniformity and discretion are obstacles to introducing this type of activity to companies due to unpredictability. A major advantage of the DTMethod is its clear structure, which is in accordance with the latest literature suggesting that complex and insufficiently defined problems require more systematic paradigms [
39]. A consistent methodology, including fundamental principles, roles, tools, and the proposed timetable will support organizations to start using design thinking in professional practice. Thanks to the structured and more predictable design thinking process, more organizations will be able to implement it in their practice. Such a level of predictability also makes it easier to determine the costs of applying this methodology. We provide a unified and validated framework that can be used for both practical and research purposes. The DTMethod can be used for all types of problems. It can serve as a tool for developing new products, services, or processes. No prior expertise in DT is required from participants. It can be used by teams working either online or offline.
5.2. Limitations and Future Research Directions
Though it produced useful results, our study also has some limitations. For example, we encountered a problem related to the subject matter experts. We engaged experts representing two distinct categories: business organization representatives and subject matter experts (representatives from academia). We found that the evaluations provided by the two types of experts to be significantly different to the point that we could not interpret them together. We decided to rely on the subject matter experts, who were more qualified to assess solutions to the problems at hand because they were related to their fields of study. Based on this experience, we would recommend that future researchers choose only one type of expert closely connected to the problem being solved. These experts do not necessarily need to hold a high-level position in the organizational structure, rather they should have sufficient experience in addressing the problems under evaluation.
The fact that the DTMethod participants experienced less positive emotional outcomes is a subject we find interesting and worth pursuing. Additionally, we would like to test the effectiveness of online vs. offline workshops through an exploratory approach.


