Abstract
Urban Heat Island (UHI) intensities are analyzed for the metropolitan areas of the two major Portuguese cities, Lisbon and Porto, in the period 2008–2017. Projections for the UHI intensity averaged over 2008–2017 and a future period 2021–2050 are calculated under the Representative Concentration Pathway (RCP) 8.5. The spatiotemporal characteristics of the UHI intensity are assessed for daytime, nighttime, and average daily conditions. This analysis is carried out for the winter (Dec-Jan-Feb, DJF) and summer (Jun-Jul-Aug, JJA) meteorological seasons. Maximum UHI intensities of about 3.5 °C were reached in 2008–2017 in both metropolitan areas, but over a wider region during winter nighttime than during summer nighttime. Contrariwise, the most intense urban cool island effect reached −1.5 °C/−1 °C in Lisbon/Porto. These UHI intensities were depicted during summer daytime and in less urbanized areas. Overall, the UHI intensities were stronger during the winter than in the summer for both cities. Results show that the UHI intensity is closely related to underlying surfaces, as the strongest intensities are confined around the most urbanized areas in both cities. Until 2050, under RCP8.5, the highest statistically significant trends are projected for summer daytime, of about 0.25 °C (per year) for Lisbon and 0.3 °C (per year) for the UHI 99th percentile intensities in both metropolitan areas. Conversely, the lowest positive statistically significant trends (0.03 °C/0.02 °C per year) are found for the winter daytime UHI intensities in Lisbon and the winter nighttime and average UHI intensities in Porto, respectively. These statistically significant patterns (at a 5% significance level) are in line with the also statistically significant trends of summer mean and maximum temperatures in Portugal, under RCP8.5 until 2050. Scientists, urban planners, and policymakers face a significant challenge, as the contribution of urbanization and the forcing promoted by global warming should be duly understood to project more sustainable, go-green, carbon-neutral, and heat-resilient cities.
1. Introduction
Large urbanized areas can experience higher temperatures, greater pollution, and aggravated negative health impacts when compared to more rural areas. This phenomenon is known as the Urban Heat Island effect [1,2,3,4,5,6,7,8,9,10], and its magnitude can be assessed by the Urban Heat Island intensity. Heat islands are created by a combination of heat-absorptive surfaces (such as dark pavement and roofing; ref. [11]), heat-generating activities, and the absence of vegetation that provides evaporative cooling [10,12]. Anthropogenic-generated heat is a key factor in the urban heat island effect, most noteworthy during nighttime [2]. The Urban heat island intensity is indeed characterized by accentuated temporal variations. It is well known that urban heat island intensity reaches its maximum value during the night in most cities, such as Beijing [5], Salamanca [13,14], London [4,15], and Seoul [3]. Furthermore, the urban heat island intensity variations can be due to the background climate [6] or time of day [16], but also dependent on the season [17]. Although the urban heat island intensity is typically stronger during the night in comparison with daytime (daily cycle), in some world cities, a stronger urban heat island intensity is also more frequent during winter (e.g., Beijing [5]), thus also revealing seasonality.
It is hypothesized that urban heat island intensity can be controlled by anthropogenic changes in surface energy balance [18]. These changes can include urban geometry, reduction of evaporative cooling, the release of anthropogenic heat, and the efficiency of convection between the urban surface and the atmospheric boundary layer. Indeed, the city’s intrinsic characteristics play a critical role in the physical processes during the early evening transition and, therefore, determine the nighttime urban heat island intensity. Moreover, external meteorological factors can also influence urban heat island effects characteristics, namely the role of the wind, leading, e.g., to the so-called Urban Heat Advection. In coastal cities, the passage of the sea breezes can help decrease the nighttime urban heat island [8].
The concentration of heat in urban areas may exacerbate health risks [19], both because of excessive heat exposure and the greater formation of air pollutants, particularly low-level ozone, during periods of high levels of atmospheric stability. The strong influence of the urban heat island effect on nighttime temperatures limits the ability of both buildings and people to cool down and recover before the heat of the next day [10,20], therefore adding a risk of illness and fatalities. Individuals most susceptible to heat include pregnant women, young children, the elderly, people with certain preexisting health vulnerabilities, such as diabetes or heart diseases, and people who work or exercise outdoors. Since the urban heat island intensity results in locally higher temperatures, it also impacts energy consumption [21,22]. Additional air conditioning is required to counter-balance the increased temperatures, thereby increasing greenhouse gas emissions and contributing to the anthropogenic forcing of the climate system [23,24]. This issue is especially meaningful since heat intensity is projected to increase significantly with climate change, thus eventually exacerbating the urban heat island effects in certain cities [25,26].
One of the major concerns when assessing the urban heat island intensities in most of the cities is the lack of data or its quality. Historical observational records frequently have poor quality and can even be discontinuous. The dynamical and thermal parameterization is also a relevant issue, as the complexity of water and energy exchanges between the atmosphere and the urban surfaces can play a critical role. New developments in this area are needed, as climate change may bring serious consequences in more vulnerable cities. Hamdi et al. [27], as well as Masson et al. [28], provide a state-of-the-art description of urban climate change modeling and observations, in which some of these topics are already being addressed. These new methodologies and paradigms also target building energetics, as well as urban vegetation, thus highlighting the relevance of urban climatology studies in the climate change global agenda.
Alcoforado and Andrade [29] examined the Lisbon urban climate by using stepwise multiple regression and a Geographical Information System to model the relation between air temperature (nocturnal air temperatures across Lisbon) and related land-use and topography parameters. The main conclusion highlighted the existence of a nocturnal urban heat island effect. Peng et al. [16] analyzed 419 big global cities, including Lisbon and Porto. However, this study has analyzed surface urban heat island intensities between 2003 and 2008, using the land surface temperature (LST) data with a 1 km grid resolution and at 8–day intervals. Nogueira and Soares [30] assessed the main drivers of the change of temperature extremes in Lisbon by improving the modeling framework to the strong sensitivity of summer mean and extreme temperature variability to local land-use characteristics. The outcomes for Lisbon revealed a very strong summer increase between the two analyzed periods: 1951–1980 and 1981–2010. Teixeira et al. [31] conducted a study in the urban area of Lisbon that evaluated different Urban Canopy Models parameterized within the Weather Research and Forecasting Model (WRF). This study considered several hindcast simulations for a selected period in July 2010, aiming to identify the synoptic conditions driving urban heat island effect formation. However, further studies regarding particularly the urban heat island for Lisbon and Porto areas are necessary for a better understanding of their spatial and temporal variability and risks under changing climates. Though several studies have been conducted for analyzing the statistically significant trends for air temperatures, precipitation, and even urban heat island intensities [32,33,34], in the past, no such studies for trend projections were conducted for Lisbon and Porto in Portugal.
In this study, the spatiotemporal characteristics of the urban heat island intensity will be assessed for Lisbon (with a 900 km2 domain size) and Porto (625 km2 domain size) metropolitan areas, between 2008 and 2017 (baseline climate), for daytime, nighttime, and daily average conditions. This analysis is carried out for the winter (December-January-February, DJF) and summer (June-July-August, JJA) meteorological seasons. For the baseline climate, the urban heat island intensity was computed by using the very high-resolution hourly dataset generated by the urban climate model UrbClim provided by the COPERNICUS climate data store (https://doi.org/10.24381/cds.c6459d3a, accessed on 28 March 2022, ref. [35]). Our study also includes projections for the urban heat island intensity attained from an ensemble of already bias-adjusted. Urban heat island values were then averaged over a future period of 2021–2050, under the Representative Concentration Pathway (RCP) 8.5, and for both metropolitan areas, periods, and seasons. Statistically significant trends for the projected seasonal (winter and summer) maximum and minimum 2 m air temperatures (in °C per year) for Portugal between 2021 and 2050 and under RCP8.5 are assessed. A trend analysis (at a 5% significance level, S.L.) for urban heat island intensities (mean and 99th percentile, in °C per year) is subsequently undertaken. A similar methodology was followed by van der Schriek et al. [36] for Athens, though in this case, the baseline climate urban heat island intensity was computed from observational station records.
Overall, this analysis is organized as follows: data and methods are described in Section 2; the spatial variation of the statistically significant trends (in °C per year) for the projected seasonal maximum and minimum 2 m air temperatures for Portugal and urban heat island intensities between 2021–2050 under RCP8.5 are assessed for Lisbon and Porto; the patterns for urban heat island intensities attained from a high-resolution dataset between 2008–2017 are also analyzed for the same seasons and daytime, mean and nighttime periods, in Section 3. Finally, in Section 4, a summary of the main conclusions and their discussion are presented.
2. Materials and Methods
2.1. Study Areas
Lisbon and Porto are the two major cities in mainland Portugal. Lisbon (38.72° N; −9.13° W) is the capital of Portugal and is located in the Centre-south of Portugal, near the North Atlantic coast (Figure 1). The population in the Lisbon municipality (city center) is approximately 545,923 (Censos 2021 [37]), with an area of 100.05 km2. However, this municipality is integrated into the larger Metropolitan area of Lisbon, with nearly 2,871,133 inhabitants (Censos 2021 [37]) spread over an area of 3001 km2. Porto (41.15° N; −8.62° W) is the second major city of the country, located in northern Portugal, also nearby the Atlantic coastline. The population of the city is about 231,962 inhabitants and comprises an area of 41.42 km2. Like Lisbon, the Porto municipality is a part of the Metropolitan area of Porto, which has nearly 1,772,374 inhabitants covering an area of about 2040 km2. Both Metropolitan regions are located on the banks of two rivers. Lisbon is located on the right bank of the Tejo/Tagus River, whilst Porto is on the right bank of the Douro/Duero River.
Following Köppen’s climate classification, the climate of Lisbon’s metropolitan area varies between the Warm Mediterranean with hot summer (CSa), inland, and the Warm Mediterranean with warm summer (CSb), near the coast (e.g., Figure 3b Andrade et al. [38]), whilst CSb is prominent in the Metropolitan region of Porto. Both metropolitan areas are characterized by a hilly orography but without mountain ranges. Hence, no major orographic effects are present in their climates and weather conditions.
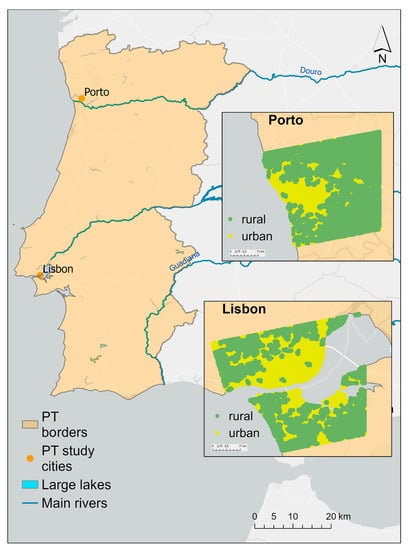
Figure 1.
Portuguese borders with Lisbon (900 km2 domain size) and Porto (625 km2 domain size) Metropolitan area locations and related rural-urban masks (the rural-urban masks were retrieved from the COPERNICUS dataset provided by Hooyberghs et al. [39]).
2.2. Urban Heat Island Intensities Derived from UrbClim Data between 2008 and 2017
In this study, the urban heat island intensity was computed by the difference in the 2 m air temperature between the city and the rural environment on the outskirts of the city. The daily 2 m air temperatures (in °C) for 2008–2017 were attained from the hourly 2 m air temperatures (in K) simulated by the urban climate model UrbClim at VITO. This high-resolution dataset (100 m × 100 m grid horizontal resolution) was retrieved from the COPERNICUS platform [39] and was available from January 2008 until December 2017. The simulated domain depends on the city, in this case, Lisbon and Porto (Figure 1), though it comprises the city and its immediate surroundings. As previously mentioned, the overall domain size is 900 km2 for Lisbon and 625 km2 for Porto. For the sake of succinctness, the Lisbon and Porto metropolitan areas will only be named Lisbon and Porto, respectively. The patterns of the 2 m minimum (TN), average (TG), and maximum (TX) air temperatures (in K converted to °C) are shown for the two metropolitan areas and for winter and summer separately (Figure A1 and Figure A2).
Two masks were used in the analysis: a rural-urban mask and a land-sea mask (Figure 1). Both masks were also retrieved from the COPERNICUS datasets [39], which are derived from the CORINE land cover of 2012 (Copernicus Corinne land cover 2012, 100 m resolution available from https://land.copernicus.eu/pan-european/corine-land-cover accessed on 28 March 2022, ref. [40]) and have the same resolution of the 2 m air temperature, i.e., 100 m × 100 m grid horizontal resolution. The rural-urban mask is derived from the rural classes of CORINE land cover of 2012, covering grassland, cropland, shrubland, woodland, broadleaf forest, and needle-leaf forest. Let us underline that the CORINE land cover of 2012 was one of the input variables for the urban climate model UrbClim at VITO that generated the high-resolution hourly 2 m air temperatures. In this mask, the urban areas represented by the urban classes of CORINE are masked as not a number (NaN). The latter is useful for calculating the urban heat island. Conversely, the land-sea mask, which represents the land area (land classes of CORINE) and sea areas, is masked as NaN. For each i-th grid point, the Urban Heat Island intensity is therefore defined as follows:
where Ti is the 2 m air temperature for each grid point and is the 2 m air temperature averaged over all rural grid points (excluding water pixels).
2.3. Urban Heat Island Intensities Derived from EURO-CORDEX Data between 2021–2050 under RCP8.5
Besides the high-resolution historical UrbClim dataset, the 2 m TN, TG, and TX from an ensemble of bias-adjusted EURO-CORDEX dataset, available on a 0.11° × 0.11° longitude-latitude grid, were retrieved from the COPERNICUS platform for the period 2021–2050 under RCP8.5 [41,42,43]. EURO-CORDEX provides projections for these variables under different RCPs and, in this case, the COPERNICUS dataset (https://doi.org/10.24381/cds.8be2c014 accessed on 28 March 2022, ref. [44]) provides an ensemble of yearly, seasonal (winter and summer), and percentiles of bias-adjusted temperatures. These data are generated by climate models and do not thus take into consideration details on urban parameterization or urban land cover, such as in the UrbClim model.
The urban heat island intensity projections for 2021–2050 under RCP8.5 were computed following Equation (1), assuming that the rural mask will not undergo major changes until 2050 in both metropolitan areas (Figure A3 and Figure A4). However, this research will be focused on the statistically significant trends that can provide further information than simply the spatial patterns of the urban heat island intensities. Therefore, we will focus our analysis on the changes in temperatures in mainland Portugal that will play a relevant role in predicting future changes in the urban heat island intensities in Lisbon and Porto metropolitan areas. The corresponding 99th percentile temperatures for 2021–2050 under RCP8.5 will also be analyzed, as they represent extremely hot events. For this purpose, the related urban heat island intensities were computed for both metropolitan areas, following the previous methodology.
The abovementioned datasets were developed within the CLIM4ENERGY project (https://climate.copernicus.eu/clim4energy accessed on 28 March 2022, ref. [45]) and are provided as an ensemble of already bias-corrected temperatures. The documentation enclosed by the data providers informs that the general Cumulative Distribution Function transform method was used by Vrac et al. [41] to bias correct the data, which uses the period 1979–2005 as the observational reference (baseline), using the WFDEI meteorological forcing dataset [43,46]. This bias correction was applied to five RCMs (WRF331F, ARPEGE51, HIRHAM5, RACMO22E, and RCA4), coupled with four GCM (IPSL-IPSL-CM5A-MR, CNRM-CERFACS-CNRM-CM5, ICHEC-EC-EARTH, and MPI-M-MPI-ESM-LR). This methodology also allows for correcting the bias of the tails of the distribution. This is a very important aspect, as the 99th percentile temperatures of the ensemble will be used herein. Further details can be found at https://cds.climate.copernicus.eu/since accessed on 28 March 2022 only the ensemble member averages are provided (https://doi.org/10.24381/cds.8be2c014 accessed on 28 March 2022, ref. [44]). The corresponding TG and TX 2021–2050 under RCP8.5 ensemble members’ standard deviation for the winter and summer patterns are shown in Figure 2 for mainland Portugal, highlighting the relatively high consistency among ensemble members over the two target areas, though with higher values in summer TX.
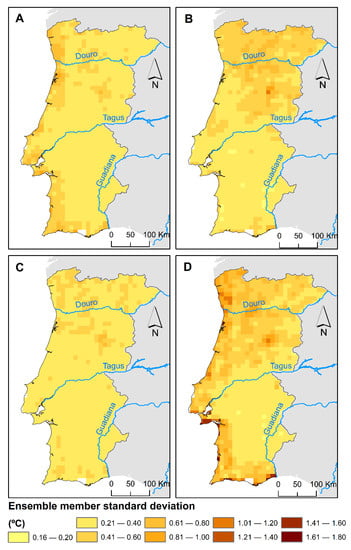
Figure 2.
The ensemble-member standard deviation for mean, and (TG) (A,B) maximum (TX) (C,D) 2 m air temperatures (°C) for winter (left column) and summer (right column) for Lisbon, averaged between 2021–2050 under RCP8.5 (COPERNICUS datasets provided by Hooyberghs et al. [39]).
Overall, the datasets used in this study are defined on a 0.11° × 0.11° longitude-latitude grid, comprising both the previously referred rural-land and urban-land masks, for Lisbon and Porto regions. For 2021–2050 under RCP8.5, the daily mean, daytime, and nighttime mean urban heat island intensities were computed for all grid points and are assessed for the winter (DJF) and summer (JJA) months separately.
2.4. Trend Analysis
Statistically significant trends (at a 5% significance level, S.L.) in TX and TG for Portugal and the urban heat island intensities (seasonal, as well as for the nighttime, mean, and daytime) for Lisbon and Porto areas for 2021–2050 under RCP8.5 were assessed by using the rank-based non-parametric Spearman’s rho (SR) statistical test [47,48]. This non-parametric test can be used to detect monotonic trends in time series. The magnitude of the slope of the trend (in °C per year) was estimated using Theil and Sen’s approach [46,47,48,49,50]. In this study, both tests were performed for each grid point in the period 2021–2050 (a 30-year time period) and for TX, TG, and urban heat island intensities under RCP8.5. In addition, the relationship between daytime and nighttime urban heat island intensities was tested for statistical significance at the 5% level, and the determination coefficient was also estimated.
A methodological schematic diagram is shown in Figure 3.
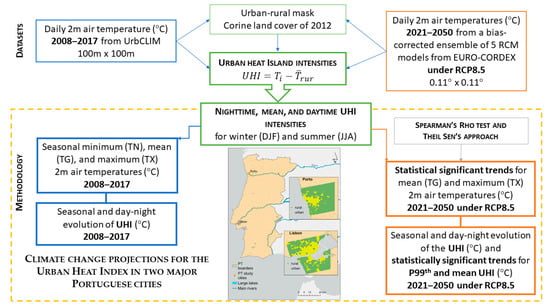
Figure 3.
The methodological schematics of this study.
3. Results
3.1. Mean and Maximum 2 m Temperatures Statistically Significant Trends under RCP8.5 for Mainland Portugal
The statistically significant trends (at a 5% S.L.) for 2021–2050 over mainland Portugal were computed for TG and TX, in winter (Figure 4a,c) and summer (Figure 4b,d), under RCP8.5.
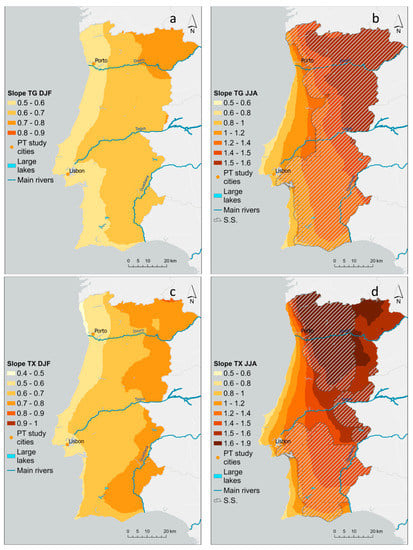
Figure 4.
Mean (TG, upper row) and maximum (TX, lower row) 2 m air temperatures statistically significant trends (°C per year) under RCP8.5 for (a,c) winter and (b,d) summer for mainland Portugal. Hatched areas correspond to statistically significant trends at a 5% significance level.
Results show upward trends in both the mean (Figure 4a,b) and maximum (Figure 4c,d) 2 m air temperatures trends, more accentuated and statistically significant (at a 5% S.L.) for summer, ranging from 0.5 °C to 1.6 °C per year for TG (0.5 °C to 1.9 °C per year for TX). These trends are much weaker and not statistically significant for winter (Figure 4a,c). The statistically significant trends in both TG and TX for summer are more prominent in the inner regions of the country until 2050 under RCP8.5. A clear longitudinal contrast is depicted in summer, for which the trends are expected to be lower near the coast and non-statistically significant, mainly in central Portugal. In the vicinity of Lisbon, the predicted statistically significant upward trends in mean/maximum temperatures are projected to be around 0.8 °C to 1.2 °C/0.8 °C to 1.4 °C per year for summer in the southern area of the Tagus river.
For Porto, the statistically significant trends for the mean/maximum temperatures are expected to be from 0.8 °C to 1.2 °C/1 °C to 1.4 °C per year for summer until 2050 under RCP8.5 (Figure 4) in the innermost regions of the metropolitan area.
3.2. Seasonal and Day-Night Evolution of the Urban Heat Island Intensities between 2008–2017
Figure 5 shows a clear day-night contrast for the urban heat island in Lisbon for the period 2008–2017 (attained from the UrbClim dataset), depicted for both winter and summer. Higher urban heat island intensities can be found in the inner regions of the metropolitan area nearby the Tagus River (Figure 5). It is worth mentioning that these areas overlap with high population density (urban) areas that were previously identified in Figure 1. Decreasing values are found from nighttime urban heat islands to average and daytime. Urban heat island intensities were stronger in winter (Figure 5a,c,e) and weaker in summer (Figure 5b,d,f) throughout the day. Maximum urban heat island reached 3.5 °C during nighttime for winter (Figure 5a), as well as during summer (Figure 5b), though over a smaller area in comparison with the spatial pattern depicted for winter. Conversely, a minimum urban heat island of about −1.5 °C was observed for daytime during the summer (Figure 5f) and distributed towards the coastal peripherical regions of the metropolitan area of Lisbon (less urbanized).
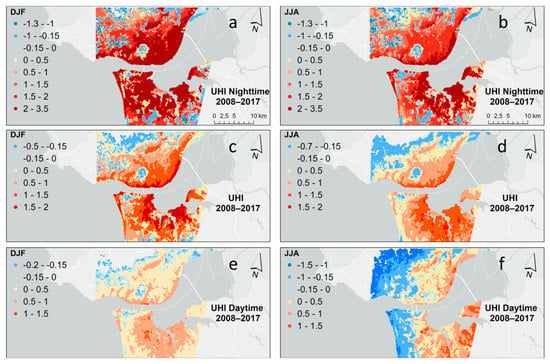
Figure 5.
Nighttime (a,b), mean (c,d), and daytime (e,f) Urban Heat Island (UHI) intensities (°C) for winter (left column) and summer (right column) for Lisbon, averaged between 2008–2017 (Note that urban heat island intensities were computed by using the UrbClim dataset [37]).
Overall, in both seasons, the urban heat island effect for Lisbon between 2008–2017 was stronger during the nighttime than on average or during the daytime.
For Porto, the spatial distribution of urban heat island intensities (Figure 6) shows higher values near the coast, as previously linked to highly urbanized areas (Figure 1). During the daytime, in both seasons and northwards, an urban cool island is found (Figure 6). At night, strong intensities are found near the mouth of Douro River due to the stronger release of heat storage in urban areas that is higher in the winter (Figure 6a,c,e) in comparison with the summer (Figure 6b,d,f).
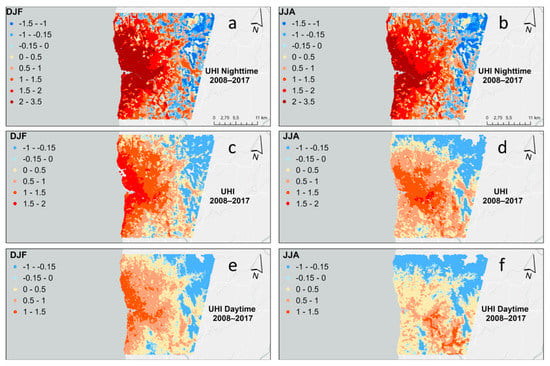
Figure 6.
Nighttime (a,b), mean (c,d), and daytime (e,f) Urban Heat Island (UHI) intensities (°C) for winter (left column) and summer (right column) for Porto, averaged between 2008–2017 (Note that urban heat island intensities were computed by using the UrbClim dataset [37]).
Maximum urban heat island reached 3.5 °C during nighttime for winter (Figure 6a), as well as during summer (Figure 6b) when considering the average period 2008–2017. Like previously for Lisbon, this maximum urban heat island intensity region was observed over a smaller area for summer in comparison with the spatial pattern depicted for winter. In opposition, minimum urban heat island intensities of about −1 °C were observed for daytime during the summer (Figure 6f) and distributed towards the northernmost regions of the Porto metropolitan area (less urbanized).
Table 1 summarizes the maximum and minimum averaged winter and summer urban heat island intensities between 2008 and 2017 for both Metropolitan areas. The higher urban heat island intensities are depicted during the winter nighttime, reaching 3.9 °C for Lisbon and 3.5 °C for Porto. On the contrary, the lowest value was found for the daytime during summer and reached −3.9 °C in Lisbon and −2.3 °C in Porto. In general, the highest values for both extremes were found in the Lisbon Metropolitan area. No statistically significant correlations between daytime and nighttime seasonal urban heat island were found for both cities (R2 = 0.01 winter, R2 = 0.25 summer for Lisbon; R2 = 0.07 winter, R2 = 0.17 summer for Porto). This suggests that the factors driving the heat island effect during the day were different from those at night.

Table 1.
Nighttime, mean, and daytime maximum and minimum Urban Heat Island intensities (°C) for winter and summer for the Metropolitan regions of Lisbon and Porto from 2008 to 2017.
3.3. Seasonal and Day-Night Statistically Significant Trends Projections for the Urban Heat Island Intensities between 2021–2050 under RCP8.5
Statistically significant trends at a 5% S.L. were assessed in the period 2021–2050 under RCP8.5 for the 99th percentile and average urban heat island for both winter and summer, and like previously for the nighttime, mean, and daytime. The outcomes show the highest statistically significant trends for the Lisbon Metropolitan area, until 2050 and under RCP8.5, of about 0.25 °C per year for the summer daytime urban heat island 99th percentile (Figure 7f). Increasingly higher longitudinal contrasts are found from the nighttime to mean and daytime trend intensities during the summer, stronger for the urban heat island 99th percentile (Figure 7b,d,f) in comparison with the mean urban heat island (Figure 7h,j,l). Lower statistically significant trends are found for the winter months, with the highest values reaching 0.1 °C per year for the daytime urban heat island 99th percentile (Figure 7e). Reversely, for Lisbon, the lowest positive statistically significant trends (0.03 °C per year) are found for the winter daytime urban heat island (Figure 7k).
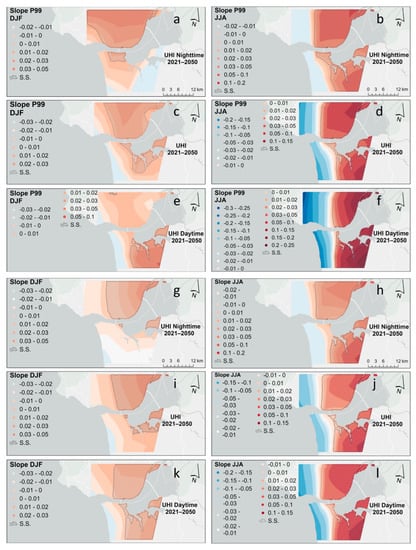
Figure 7.
Trends for nighttime (a,b,g,h), mean (c,d,i,j), and daytime (e,f,k,l) for the 99th percentile (a–f), and average (g–l) Urban Heat Island (UHI) intensities (in °C per year) for winter (left column) and summer (right column) for Lisbon, between 2021–2050 under RCP8.5. Hatched areas correspond to statistically significant trends at a 5% significance level.
The urban heat island intensities’ 99th percentile trends per year are generally higher for both seasons (Figure 7a–f) in comparison with the mean urban heat island trends (Figure 7g–l), though always higher for summer in both cases. It is worth emphasizing that statistically significant areas are linked to positive anomalies and associated with Lisbon’s urban areas (not shown).
For Porto, until 2050 under RCP8.5, the highest statistically significant trend of about 0.3 °C per year for the urban heat island intensities 99th percentile is verified for summer daytime (Figure 8f). As for Lisbon, increasingly higher longitudinal contrasts are projected from the nighttime to mean daytime trend intensities during the summer. Moreover, these projected trends per year are stronger for the urban heat island intensities’ 99th percentile (Figure 8b,d,f) when compared with the mean urban heat island intensities (Figure 8h,j,l). Lower statistically significant trends can be found for the winter months, with the highest values also reaching 0.1 °C per year for the daytime urban heat island intensities 99th percentile (Figure 8e). The lowest positive statistically significant trend (0.02 °C per year) is projected for the winter nighttime and average urban heat island intensities (Figure 8g,i), respectively. In general, the urban heat island intensities’ 99th percentile trends per year are higher for both seasons (Figure 8a–f) concerning the mean urban heat island intensities trends (Figure 8g–l). For Porto, these projected trends per year are always higher for the summer, in both cases until 2050 under RCP8.5. As previously noted, statistically significant areas are linked to positive anomalies and are associated with the inland Porto urban areas (not shown).
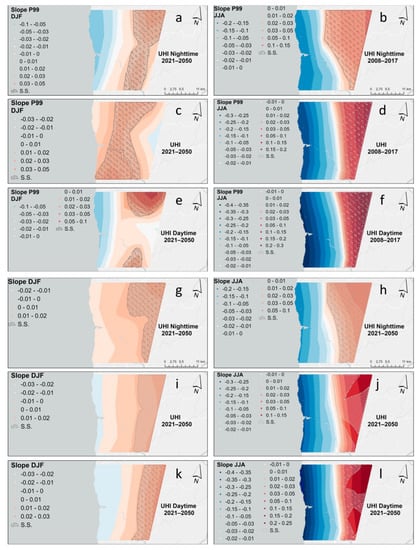
Figure 8.
Trends for nighttime (a,b,g,h), mean (c,d,i,j), and daytime (e,f,k,l) for the 99th percentile (a–f), and average (g–l) Urban Heat Island (UHI) intensities (in °C per year) for winter (left column) and summer (right column) for Porto, between 2021–2050 under RCP8.5. Hatched areas correspond to statistically significant trends at a 5% significance level.
High statistically significant correlations between daytime and nighttime summer urban heat island intensities (R2 = 0.94 for Lisbon; R2 = 0.99 for Porto) were found in both cities. For winter, weak statistically significant correlations were found for Lisbon (R2 = 0.15) and moderate for Porto (R2 = 0.53). This might suggest that the atmospheric factors driving heat islands may well be different in the future in comparison with the baseline climate, mainly during summer daytime.
4. Discussion
An urban heat island is a local event in which temperatures in urban areas are typically higher than in their rural surroundings [1,9,17]. Due to rapid urbanization in the last decades, the urban heat island effects have been extensively studied around the world [3,5,8,15,18,51,52,53]. Regarding Portugal, an analysis was undertaken for the two major cities in Portugal by Peng et al. [16], though only between 2003 and 2008, and with a very low spatial resolution on the spatial distribution maps for both cities. Alcoforado and Andrade [3] studied the nocturnal urban heat island in Lisbon. Nogueira and Soares [35] analyzed the effects of global warming from urbanization in temperature extremes for Lisbon, and Teixeira et al. [36] assessed the urban climate surface boundary layer in the urban area of Lisbon. Other authors like Founda et al. [32] have also analyzed the interdecadal variations and trends of the urban heat island in Athens and its response to heat waves over the period 1970–2004. The seasonal and temporal variability, as well as trends, were analyzed, and the results showed that nocturnal and daytime urban heat island intensities revealed different patterns. This outcome is in line with the results of this study for the past period. They have also concluded that the urban heat island intensities increased hot days frequency, and the effect is amplified during the nighttime due to heat waves. Lee et al. [34] have conducted a trend analysis of the urban heat island intensity according to urban area change in several Asian megacities from 1992 until 2012. Results showed that the urban heat island intensities depend on the city as well as on the season. This result is also in line with the outcomes of our study regarding the past period. Benas et al. [33] have analyzed the trends of urban surface temperature and heat island characteristics in the Mediterranean for the 17th largest cities for the period between 2001 to 2012. Authors have used the LST to identify the characteristics and trends of the surface urban heat island in these cities. A positive trend was found for both LST and the surface urban heat island in most of the studied cities. Note that no Portuguese city was considered in this research. Since no projections regarding the trends for the urban heat island intensities were assessed for Portugal, no detailed conclusions can be retrieved from these studies, and a direct comparison is difficult.
The spatial and seasonal features of urban heat island intensity in the Metropolitan areas of Lisbon and Porto were investigated between 2008–2017 using a very high-resolution dataset of 100 m × 100 m (attained from the UrbCLim dataset). The contributing factors of urban heat island intensity variation are considered out of the scope of this study and are therefore not analyzed herein. The urban heat island is closely related to underlying surfaces since the strongest intensities are confined around the most urbanized areas in both cities. For Lisbon and Porto, the urban heat island intensities reveal a noteworthy temporal variability, both diurnal and seasonal. The findings allow us to conclude that a maximum urban heat island intensity of about 3.5 °C was reached in 2008–2017 for both cities, but over a wider region during winter nighttime than summer nighttime (Figure 5 and Figure 6). In both cases, these maximum-intensity regions were found over highly urbanized areas. Conversely, the most intense urban cool island effects reached −1.5 °C in Lisbon (Figure 5f) and −1 °C in Porto (Figure 6f). These urban heat island intensities were identified during the daytime for summer and in less urbanized areas. This might be due to the stronger nighttime anthropogenic heating, which can be higher during winter. Additionally, urbanization exerts a comprehensive impact on surface energy balance, henceforth resulting in higher temperatures in urban areas. Overall, the urban heat island intensities were stronger during the winter than in the summer for both cities. Furthermore, the daytime urban heat island intensities magnitude seems to be significantly controlled by the vegetation evaporative cooling effect.
Until 2050, under RCP8.5, the highest statistically significant trends of about 0.25 °C per year for Lisbon and 0.3 °C per year for the urban heat island intensities’ 99th percentile for the summer daytime for Lisbon and Porto Metropolitan areas are projected (Figure 7f and Figure 8f). Conversely, the lowest positive statistically significant trends (0.03 °C/0.02 °C per year) are found for the winter daytime urban heat island intensities (Figure 7k) in Lisbon and the winter nighttime and average urban heat island intensities in Porto (Figure 8g,i), respectively. Increasingly higher longitudinal contrasts are projected for the mean nighttime and daytime trend intensities during summer for both regions. These overall projected trends (per year) will be stronger for the urban heat island intensities’ 99th percentile (Figure 7b,d and Figure 8b,d,f) than in the mean urban heat island intensities (Figure 7h,j,l and Figure 8h,j,l), with lower statistically significant trends (per year) for the winter months. It is worth emphasizing that for both metropolitan areas, the statistically significant patterns are linked to positive anomalies and are also associated with urban areas (not shown). These results are in line with the maximum and mean temperature anomalies (not shown) observed for Portugal until 2050 under RCP8.5 (Figure 4).
For the baseline climate, no statistically significant correlations between daytime and nighttime seasonal urban heat island intensities were found for both Metropolitan regions. This suggests that the factors driving the heat island effect during the day are different from those at night. Conversely, assuming that until 2050 the rural areas will be maintained, the summer daytime–nighttime urban heat island effect atmospheric driving factors will be highly correlated for both Metropolitan areas (under RCP8.5). Indeed, for the projected mean and maximum 2 m air temperatures between 2021 and 2050, statistically significant trends were only found for the summer under RCP8.5. These trends reached values between 1.2 to 1.4 °C per year in the vicinity of Porto and Lisbon, respectively. While for Lisbon, the statistically significant trend patterns are found in the southern bank of the Tagus river, in Porto, they are depicted inland, i.e., way from the coast (Figure 4b,d). Since it is herein assumed that the urban mask will not change until 2050, the 2 m air temperatures will thereby be the major trigger for the increasing urban heat island intensities.
5. Conclusions
Global warming and the increasing number of extreme events lead to an urgent need for a better understanding of its impacts in major cities throughout the world, mainly in the countries that will be most affected by this global increase in temperatures [32,33]. Not only the mean temperatures are increasing, but also the number of tropical nights [35,38]. This will undoubtedly increase the cooling power consumption in urban areas but will also increase the risk of exposure of urban areas to heatwaves and related extreme events [28]. The results enable us to conclude that in Lisbon and Porto metropolitan areas, the urban-land areas store more energy in the ground than the rural-land areas during the daytime. As a result, the urban surface and near-surface air are heated more at night due to the heat storage release (thermal inertia). Therefore, further investigation should be undertaken regarding the impact of climate conditions on the urban heat island effect magnitudes and spatial distribution in these Metropolitan areas, namely regarding wind speed, humidity, and cloud cover, as well as land cover. In the future, we must evaluate the implications of these effects when the most current, high-resolution datasets on climate-related variables become available and when new techniques overcome the limits of current methods [27,28]. A significant challenge is posed to both scientists and politicians, as the contribution of urbanization and the forcing promoted by global warming should be better understood.
In order to ensure more resilient urban policies and initiatives to mitigate the urban heat island effect and reduce the impact of pollution, more green spaces should be maintained, extended, or included in urban landscaping. Measures like green roofs or painting rooftops white, which allow in the latter measure, to increase solar reflectance and emittance, thus increasing albedo, are also strategies to take into consideration. The passive daytime radiative cooling roof application can help to significantly lower outdoor surface temperature while doubling the energy savings of a white roof [54,55]. These measures will foster more sustainable, go-green, carbon-neutral, and heat-resilient cities, with all the advantages for the entire society and environment.
Author Contributions
Conceptualization, C.A.; methodology, C.A. and J.A.S.; software, C.A.; validation, C.A., A.F. and J.A.S.; formal analysis, C.A.; investigation, C.A.; resources, C.A.; data curation, C.A.; writing—original draft preparation, C.A.; writing—review and editing, C.A., A.F. and J.A.S.; visualization, C.A.; funding acquisition, C.A. All authors have read and agreed to the published version of the manuscript.
Funding
This research was funded by National Funds by FCT—Portuguese Foundation for Science and Technology, under the project UIDB/04033/2020.
Institutional Review Board Statement
Not applicable.
Informed Consent Statement
Not applicable.
Data Availability Statement
Not applicable.
Acknowledgments
The authors would like to acknowledge the contribution of COPERNICUS climate data store, namely the urban climate model UrbClim (https://doi.org/10.24381/cds.c6459d3a) accessed on 1 March 2022 and EURO-CORDEX datasets, also retrieved from COPERNICUS (https://doi.org/10.24381/cds.8be2c014) accessed on 28 March 2022.
Conflicts of Interest
The authors declare no conflict of interest.
Appendix A
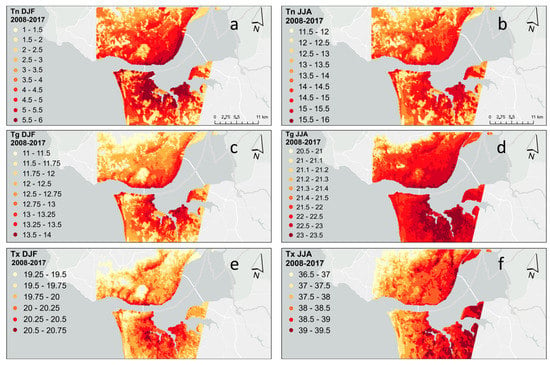
Figure A1.
Minimum (TN) (a,b), mean (TG) (c,d), and maximum (TX) (e,f) 2 m air temperatures (°C) for winter (left column) and summer (right column) for Lisbon, averaged between 2008–2017 (from UrbClim dataset [37]).
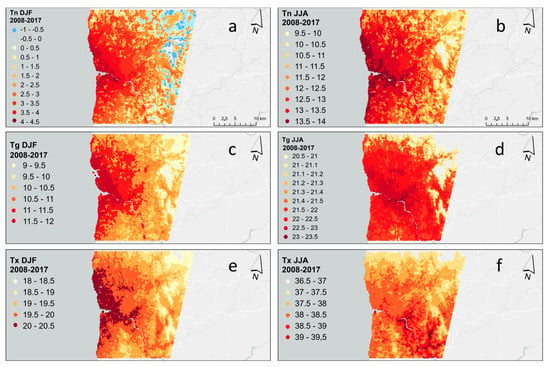
Figure A2.
Minimum (TN) (a,b), mean (TG) (c,d), and maximum (TX) (e,f) 2 m air temperatures (°C) for winter (left column) and summer (right column) for Porto, averaged between 2008–2017 (from UrbClim dataset [37]).
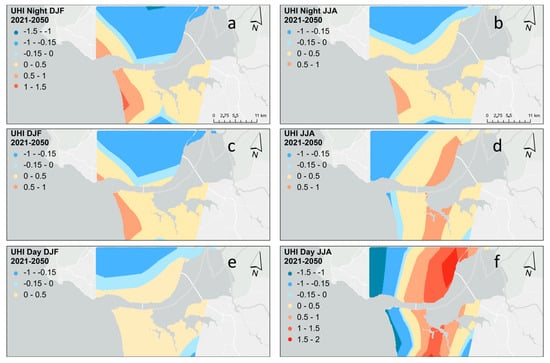
Figure A3.
Nighttime (a,b), mean (c,d), and daytime (e,f) Urban Heat Island intensities (°C) for winter (left column) and summer (right column) for Lisbon, averaged between 2021–2050 under RCP8.5 (Note that urban heat island intensities were computed by using EURO-CORDEX datasets [44]).
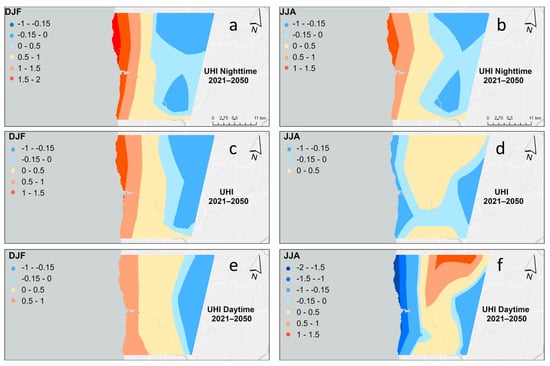
Figure A4.
Nighttime (a,b), mean (c,d), and daytime (e,f) Urban Heat Island intensities (°C) for winter (left column) and summer (right column) for Porto, averaged between 2021–2050 under RCP8.5 (Note that urban heat island intensities were computed by using EURO-CORDEX datasets [44]).
References
- Oke, T.R. The energetic basis of the urban heat island. Q. J. R. Meteorol. Soc. 1982, 108, 1–24. [Google Scholar] [CrossRef]
- Oke, T.R.; Johnson, G.T.; Steyn, D.G.; Watson, I.D. Simulation of surface urban heat islands under ‘ideal’ conditions at night part 2: Diagnosis of causation. Boundary-Layer Meteorol. 1991, 56, 339–358. [Google Scholar] [CrossRef]
- Kim, Y.H.; Baik, J.J. Maximum urban heat island intensity in Seoul. J. Appl. Meteorol. 2002, 41, 651–659. [Google Scholar] [CrossRef]
- Wilby, R.L. Past and projected trends in London s urban heat island. Weather 2003, 58, 251–260. [Google Scholar] [CrossRef]
- Yang, P.; Ren, G.; Liu, W. Spatial and Temporal Characteristics of Beijing Urban Heat Island Intensity. J. Appl. Meteorol. Clim. 2013, 52, 1803–1816. [Google Scholar] [CrossRef]
- Zhao, L.; Lee, X.; Smith, R.B.; Oleson, K. Strong contributions of local background climate to urban heat islands. Nature 2014, 511, 216–219. [Google Scholar] [CrossRef]
- Santamouris, M. Analyzing the heat island magnitude and characteristics in one hundred Asian and Australian cities and regions. Sci. Total Environ. 2015, 512–513, 582–598. [Google Scholar] [CrossRef]
- Hu, X.-M.; Xue, M. Influence of Synoptic Sea-Breeze Fronts on the Urban Heat Island Intensity in Dallas–Fort Worth, Texas. Mon. Weather. Rev. 2016, 144, 1487–1507. [Google Scholar] [CrossRef]
- Hu, X.-M.; Xue, M.; Klein, P.M.; Illston, B.G.; Chen, S. Analysis of Urban Effects in Oklahoma City using a Dense Surface Observing Network. J. Appl. Meteorol. Climatol. 2016, 55, 723–741. [Google Scholar] [CrossRef]
- Yang, J.; Kumar, D.L.M.; Pyrgou, A.; Chong, A.; Santamouris, M.; Kolokotsa, D.; Lee, S.E. Green and cool roofs’ urban heat island mitigation potential in tropical climate. Sol. Energy 2018, 173, 597–609. [Google Scholar] [CrossRef]
- Synnefa, A.; Karlessi, T.; Gaitani, N.; Santamouris, M.; Assimakopoulos, D.N.; Papakatsikas, C. Experimental testing of cool colored thin layer asphalt and estimation of its potential to improve the urban microclimate. Build. Environ. 2011, 46, 38–44. [Google Scholar] [CrossRef]
- Oberndorfer, E.; Lundholm, J.; Bass, B.; Coffman, R.R.; Doshi, H.; Dunnett, N.; Gaffin, S.; Köhler, M.; Liu, K.K.Y.; Rowe, B. Green Roofs as Urban Ecosystems: Ecological Structures, Functions, and Services. Bioscience 2007, 57, 823–833. [Google Scholar] [CrossRef]
- Alonso, M.S.; Labajo, J.L.; Fidalgo, M.R. Characteristics of the urban heat island in the city of Salamanca, Spain. Atmósfera 2003, 16, 137–148. [Google Scholar]
- Alonso, M.S.; Fidalgo, M.R.; Labajo, J.L. The urban heat island in Salamanca (Spain) and its relationship to meteorological parameters. Clim. Res. 2007, 34, 39–46. [Google Scholar] [CrossRef]
- Lee, D.O. Urban Warming?—An analysis of recent trends in london’s heat island. Weather 1992, 47, 50–56. [Google Scholar] [CrossRef]
- Peng, S.; Piao, S.; Ciais, P.; Friedlingstein, P.; Ottle, C.; Bréon, F.-M.; Nan, H.; Zhou, L.; Myneni, R.B. Surface Urban Heat Island Across 419 Global Big Cities. Environ. Sci. Technol. 2012, 46, 696–703. [Google Scholar] [CrossRef]
- Arnfield, A.J. Two decades of urban climate research: A review of turbulence, exchanges of energy and water, and the urban heat island. Int. J. Clim. 2003, 23, 1–26. [Google Scholar] [CrossRef]
- Morini, E.; Touchaei, A.G.; Rossi, F.; Cotana, F.; Akbari, H. Evaluation of albedo enhancement to mitigate impacts of urban heat island in Rome (Italy) using WRF meteorological model. Urban Climatol. 2018, 24, 551–566. [Google Scholar] [CrossRef]
- Heaviside, C.; Macintyre, H.; Vardoulakis, S. The Urban Heat Island: Implications for Health in a Changing Environment. Curr. Environ. Health Rep. 2017, 4, 296–305. [Google Scholar] [CrossRef]
- Steeneveld, G.J.; Koopmans, S.; Heusinkveld, B.G.; Van Hove, L.W.A.; Holtslag, B. Quantifying urban heat island effects and human comfort for cities of variable size and urban morphology in the Netherlands. J. Geophys. Res. Atmos. 2011, 116. [Google Scholar] [CrossRef]
- Asimakopoulos, D.; Santamouris, M.; Farrou, I.; Laskari, M.; Saliari, M.; Zanis, G.; Giannakidis, G.; Tigas, K.; Kapsomenakis, J.; Douvis, C.; et al. Modelling the energy demand projection of the building sector in Greece in the 21st century. Energy Build. 2012, 49, 488–498. [Google Scholar] [CrossRef]
- Costanzo, V.; Evola, G.; Marletta, L. Energy savings in buildings or UHI mitigation? Comparison between green roofs and cool roofs. Energy Build. 2016, 114, 247–255. [Google Scholar] [CrossRef]
- Kolokotroni, M.; Wines, C.; Babiker, R.M.; Da Silva, B.H. Cool and Green Roofs for Storage Buildings in Various Climates. Procedia Eng. 2016, 169, 350–358. [Google Scholar] [CrossRef]
- Andrade, C.; Mourato, S.; Ramos, J. Heating and Cooling Degree-Days Climate Change Projections for Portugal. Atmosphere 2021, 12, 715. [Google Scholar] [CrossRef]
- Giannakopoulos, C.; Hadjinicolaou, P.; Zerefos, C.; Demosthenous, G. Changing Energy Requirements in the Mediterranean under Changing Climatic Conditions. Energies 2009, 2, 805–815. [Google Scholar] [CrossRef]
- Zittis, G.; Hadjinicolaou, P.; Klangidou, M.; Proestos, Y.; Lelieveld, J. A multi-model, multi-scenario, and multi-domain analysis of regional climate projections for the Mediterranean. Reg. Environ. Chang. 2019, 19, 2621–2635. [Google Scholar] [CrossRef]
- Hamdi, R.; Kusaka, H.; Doan, Q.-V.; Cai, P.; He, H.; Luo, G.; Kuang, W.; Caluwaerts, S.; Duchêne, F.; Van Schaeybroek, B.; et al. The State-of-the-Art of Urban Climate Change Modeling and Observations. Earth Syst. Environ. 2020, 4, 631–646. [Google Scholar] [CrossRef]
- Masson, V.; Lemonsu, A.; Hidalgo, J.; Voogt, J. Urban Climates and Climate Change. Annu. Rev. Environ. Resour. 2020, 45, 411–444. [Google Scholar] [CrossRef]
- Alcoforado, M.J.; Andrade, H. Nocturnal urban heat island in Lisbon (Portugal): Main features and modelling attempts. Theor. Appl. Climatol. 2005, 84, 151–159. [Google Scholar] [CrossRef]
- Nogueira, M.; Soares, P.M.M. A surface modelling approach for attribution and disentanglement of the effects of global warming from urbanization in temperature extremes: Application to Lisbon. Environ. Res. Lett. 2019, 14, 114023. [Google Scholar] [CrossRef]
- Teixeira, J.; Fallmann, J.; Carvalho, A.; Rocha, A. Surface to boundary layer coupling in the urban area of Lisbon comparing different urban canopy models in WRF. Urban Clim. 2019, 28, 100454. [Google Scholar] [CrossRef]
- Founda, D.; Pierros, F.; Petrakis, M.; Zerefos, C. Interdecadal variations and trends of the Urban Heat Island in Athens (Greece) and its response to heat waves. Atmos. Res. 2015, 161–162, 1–13. [Google Scholar] [CrossRef]
- Benas, N.; Chrysoulakis, N.; Cartalis, C. Trends of urban surface temperature and heat island characteristics in the Mediterranean. Theor. Appl. Climatol. 2016, 130, 807–816. [Google Scholar] [CrossRef]
- Lee, K.; Kim, Y.; Sung, H.C.; Ryu, J.; Jeon, S.W. Trend Analysis of Urban Heat Island Intensity According to Urban Area Change in Asian Mega Cities. Sustainability 2020, 12, 112. [Google Scholar] [CrossRef]
- Urban Climate Model UrbClim Provided by the COPERNICUS Climate Data Store. Available online: https://doi.org/10.24381/cds.c6459d3a (accessed on 1 June 2022).
- van der Schriek, T.; Varotsos, K.V.; Giannakopoulos, C.; Founda, D. Projected Future Temporal Trends of Two Different Urban Heat Islands in Athens (Greece) under Three Climate Change Scenarios: A Statistical Approach. Atmosphere 2020, 11, 637. [Google Scholar] [CrossRef]
- Censos. 2021. Available online: https://www.ine.pt/scripts/db_censos_2021.html (accessed on 1 June 2022).
- Andrade, C.; Fonseca, A.; Santos, J.A. Are Land Use Options in Viticulture and Oliviculture in Agreement with Bioclimatic Shifts in Portugal? Land 2021, 10, 869. [Google Scholar] [CrossRef]
- Hooyberghs, H.; Berckmans, J.; Lauwaet, D.; Lefebre, F.; De Ridder, K. Climate Variables for Cities in Europe from 2008 to 2017, Version 1.0, Copernicus Climate Change Service (C3S) Climate Data Store (CDS). 2019. Available online: https://cds.climate.copernicus.eu/cdsapp#!/dataset/10.24381/cds.c6459d3a (accessed on 28 March 2022).
- Copernicus Corinne Land Cover 2012, 100 m Resolution. Available online: https://land.copernicus.eu/pan-european/corine-land-cover (accessed on 1 March 2022).
- Vrac, M.; Drobinski, P.; Merlo, A.; Herrmann, M.; Lavaysse, C.; Li, L.; Somot, S. Dynamical and statistical downscaling of the French Mediterranean climate: Uncertainty assessment. Nat. Hazards Earth Syst. Sci. 2012, 12, 2769–2784. [Google Scholar] [CrossRef]
- Christensen, O.B.; Gutowski, W.J.; Nikulin, G.; Legutke, S. CORDEX Archive Design. 2014. Available online: https://is-enes-data.github.io/cordex_archive_specifications.pdf (accessed on 22 March 2022).
- Weedon, G.P.; Balsamo, G.; Bellouin, N.; Gomes, S.; Best, M.J.; Viterbo, P. The WFDEI meteorological forcing data set: WATCH Forcing Data methodology applied to ERA-Interim reanalysis data. Water Resour. Res. 2014, 50, 7505–7514. [Google Scholar] [CrossRef]
- EURO-CORDEX Provided by the COPERNICUS Climate Data Store. Available online: https://cds.climate.copernicus.eu/cdsapp#!/dataset/10.24381/cds.8be2c014?tab=overview (accessed on 1 March 2022).
- CLIM4ENERGY Project Datasets Provided by the COPERNICUS Climate Data Store. Available online: https://climate.copernicus.eu/clim4energy (accessed on 28 March 2022).
- WFDEI Meteorological Forcing Data. Available online: https://rda.ucar.edu/datasets/ds314.2/ (accessed on 28 March 2022).
- Lehmann, E.L. Nonparametrics, Statistical Methods Based on Ranks; Holden.Day, Inc.: San Francisco, CA, USA, 1975. [Google Scholar]
- Sneyers, R. On the Statistical Analysis of Series of Observations; Technical Note Nº 143, WMO, Nº 415; World Meteorological Organization: Geneva, Switzerland, 1990. [Google Scholar]
- Theil, H. A rank-invariant method of linear and polynomial regression analysis. In Henri Theil’s Contributions to Economics and Econometrics. Advanced Studies in Theoretical and Applied Econometrics; Raj, B., Koerts, J., Eds.; Springer: Dordrecht, The Netherlands, 1992; Volume 23, pp. 345–381. [Google Scholar] [CrossRef]
- Sen, P.K. Estimates of the regression coefficient based on Kendall’s tau. J. Am. Stat. Assoc. 1968, 63, 1379–1389. [Google Scholar] [CrossRef]
- Philandras, C.M.; Metaxas, D.A.; Nastos, P. Climate Variability and Urbanization in Athens. Theor. Appl. Clim. 1999, 63, 65–72. [Google Scholar] [CrossRef]
- Miao, S.; Chen, F.; LeMone, M.A.; Tewari, M.; Li, Q.; Wang, Y. An Observational and Modeling Study of Characteristics of Urban Heat Island and Boundary Layer Structures in Beijing. J. Appl. Meteorol. Clim. 2009, 48, 484–501. [Google Scholar] [CrossRef]
- Fenner, D.; Meier, F.; Scherer, D.; Polze, A. Spatial and temporal air temperature variability in Berlin, Germany, during the years 2001–2010. Urban Clim. 2014, 10, 308–331. [Google Scholar] [CrossRef]
- Akbari, H.; Konopacki, S.; Pomerantz, M. Cooling energy savings potential of reflective roofs for residential and commercial buildings in the United States. Energy 1999, 24, 391–407. [Google Scholar] [CrossRef]
- Levinson, R.; Akbari, H.; Reilly, J.C. Cooler tile-roofed buildings with near-infrared-reflective non-white coatings. Build. Environ. 2007, 42, 2591–2605. [Google Scholar] [CrossRef]
Disclaimer/Publisher’s Note: The statements, opinions and data contained in all publications are solely those of the individual author(s) and contributor(s) and not of MDPI and/or the editor(s). MDPI and/or the editor(s) disclaim responsibility for any injury to people or property resulting from any ideas, methods, instructions or products referred to in the content. |
© 2023 by the authors. Licensee MDPI, Basel, Switzerland. This article is an open access article distributed under the terms and conditions of the Creative Commons Attribution (CC BY) license (https://creativecommons.org/licenses/by/4.0/).