Brief Report

A Participatory Inventory Project to Kick-Start the Creation of a Hospital Park: The Experience of the University of Verona (North-Eastern Italy)

1
University of Verona, 37129 Verona, Italy
2
CREA Research Centre for Vegetable and Ornamental Crops, 18038 Sanremo, Italy
3
Department of Architecture and Design, University of Genoa, 16123 Genoa, Italy
4
Department of Diagnostics and Public Health, University of Verona, 37134 Verona, Italy
5
Department of Economics, University of Verona, 37129 Verona, Italy
6
Department of Computer Science, University of Verona, 37134 Verona, Italy
*
Author to whom correspondence should be addressed.
Sustainability 2023, 15(5), 3905; https://doi.org/10.3390/su15053905
Submission received: 30 December 2022 / Revised: 29 January 2023 / Accepted: 16 February 2023 / Published: 21 February 2023
(This article belongs to the Section Sustainable Education and Approaches)

Abstract

:
The proximity and accessibility of a green space to places of care have recognized beneficial effects on healing processes. In this communication, we present the results of a pilot research action which has been focused on a neglected urban green area located near to a university hospital. The research action was conducted with a participatory approach, which mainly involved university students, to make the renovation project more inclusive and to create an opportunity for training on green and sustainability themes. The specific aims were: (i) to initiate the renovation of a green space of 18,000 square meters with potential benefits for users of both the hospital and the University of Verona (north-eastern Italy); (ii) to map and classify the greenery in the park; and (iii) to investigate the opinions and attitudes of the potential users of the green area. By performing digital identification and mapping, a detailed tree inventory of the green space was created. Results showed that five species accounted for more than 70% of the trees, with the majority being deciduous plants (59%) between 5 and 20 m tall (72.5%) and 20–200 cm in circumference (80.8%). Through interviews with the population, we highlighted a limited knowledge of the area but a consensus on the importance of the requalification. We highlight how the participatory methodology may represent a valuable tool for local policymakers to manage the city’s green spaces at various scales and implement greenery for the common well-being.

1. Introduction

The connection between landscape and human health has been known for a long time and by different cultures. In ancient China, Persia and Greece, people believed that the sight of natural elements, such as vegetation and water, had beneficial effects on health and well-being. This belief continued into the Middle Age, when the first hospitals in Europe were established within monastic communities and cloister gardens became an essential part of the healing process [1,2]. The role attributed to the therapeutic function of gardens was briefly lost in the second half of the 20th century, when hospitals were mainly designed as multi-story buildings with a strong orientation towards efficiency, but scarce relations with the outside world. After decades when a more technical approach to care and healing had been prominent, the role of the connection between nature and health has regained importance and has been developed in both research and international policies (European Landscape Convention) [3]. In recent years, the literature has embraced the One Health approach and highlighted the fundamental role of the natural environment on human health and how a split between human beings and nature negatively affects human well-being [4,5,6]. Based on the knowledge that a view of greenery can be beneficial to the healing process, the specific role that parks in the vicinity of a hospital can play has been investigated over the last 20 years, and three beneficial processes have been identified: relief of physical symptoms; reduction of stress and improvement of comfort; and increase of general well-being [7,8,9,10,11,12,13,14]. It is therefore essential to include green areas in towns and cities, particularly in places dedicated to healthcare.
With the progressive shift from a disease-centered approach to patient-centered care (first in the United States, then in England and finally in Italy), a spread of so-called ‘healing gardens’ has been observed. These green and open spaces are part of hospitals and social welfare facilities, specifically designed both for therapeutic purposes (as complementary treatment tools) and for the improvement of the well-being and quality of life of patients, employees and visitors. Green areas are used for therapy due to the relaxing atmosphere and the unconscious and emotional relationship with the garden [11]. On the other hand, a garden is a natural environment, and as such, it also brings elements that may pose dangers to fragile and recovering individual, such as poisonous or allergenic plant species, rough terrain or animals [12,15,16,17,18]. For these reasons, green spaces (particularly healing gardens) require careful design work, or re-design in the case of pre-existing green areas, so that they can be adapted to the specific needs of the users [19,20,21].
In this communication, we present the first phase of a project that aims to requalify a neglected green area located near a university hospital and to lead over time to the creation of a ‘healing garden’. The specific aims were: (i) to initiate a renovation action of a green space of 18,000 square meters with potential benefits for users of both the hospital and the University of Verona (north-eastern Italy); (ii) to map and classify the greenery in the park; and (iii) to investigate the opinions and attitudes of the potential users of the green area. This pilot project was carried out through a participatory research action, which is a consolidated approach in the world of environmental and ecological research. Specifically, participatory science is characterized by the involvement of the community in actions regarding the local reality; the aim is not only to collect useful data, but also to make community members more aware and involved in actions for change [22]. From a technological perspective, digital mapping of plants is not new [7,23,24,25] and recently it has been also associated with citizen participation as in the case of the creation of the New York City Tree Map (https://tree-map.nycgovparks.org/, accessed on 29 December 2022). However, in our case the novelty consists in the fact that the census has been performed by students at the University of Verona as the laboratory part of a class on the role and value of greenery in public spaces. In three subsequent editions of the course, about 30 students attended the class and participated to the digital mapping of the trees of the park. Four of them are also among the authors of this paper for their active role in the management of the interviews (see Section 2.2.2).

2. Materials and Methods

2.1. Setting

This study was conducted in an urban park located in the southern area of the city of Verona (north-eastern Italy). The park is located within the perimeter of the University hospital which was inaugurated in 1970, in an area of the city that has undergone significant urban development over the last 50 years (Figure 1). The current park is what remains of an ancient park dating back to the 1500s, dedicated to Saints James and Lazarus, which was intended for the confinement of leprosy patients and those suspected of carrying infectious diseases. During the 19th century, the area was transformed into a psychiatric hospital characterized by experimental and innovative management, which involved the employment of patients, mostly of peasant origin, in agricultural work. Today, the park covers an area of 18,000 square meters. The area is bordered by a modern irrigation canal, which separates the green space from the buildings of the Faculty of Medicine and the Scientific-Technological Pole of the University of Verona. The University facilities are connected to the park by a cycle–pedestrian walkway. This part of the city of Verona is rich in green areas: about 100 m to the east of the above-mentioned park is the old ‘San Giacomo’ park, 7830 square m in size and with centuries-old trees; and about 100 m to the north, in an old agricultural area, is the new San Giacomo park, the district’s main green lung, 72,000 square m in size with 375 plants, as well as pedestrian paths, benches and fountains.
The study area is therefore located in the middle between a large University hospital (550 beds, approximately 2000 employees and thousands of outpatients and visitors every day) and the most important teaching center of the University of Verona. The park is characterized by gentle slopes and the presence of some ruins of the old hospital, which, together with some tall trees that mitigate solar radiation, make it an ideal green space for staff, patients, visitors and students. However, the space is not equipped and there are no clearly defined paths. Currently, the University hospital only has a small garden dedicated to children, located in front of the building entrance. For these reasons, renovation to make this green area usable is advocated.

2.2. Methods

2.2.1. Web Application for Digital Mapping

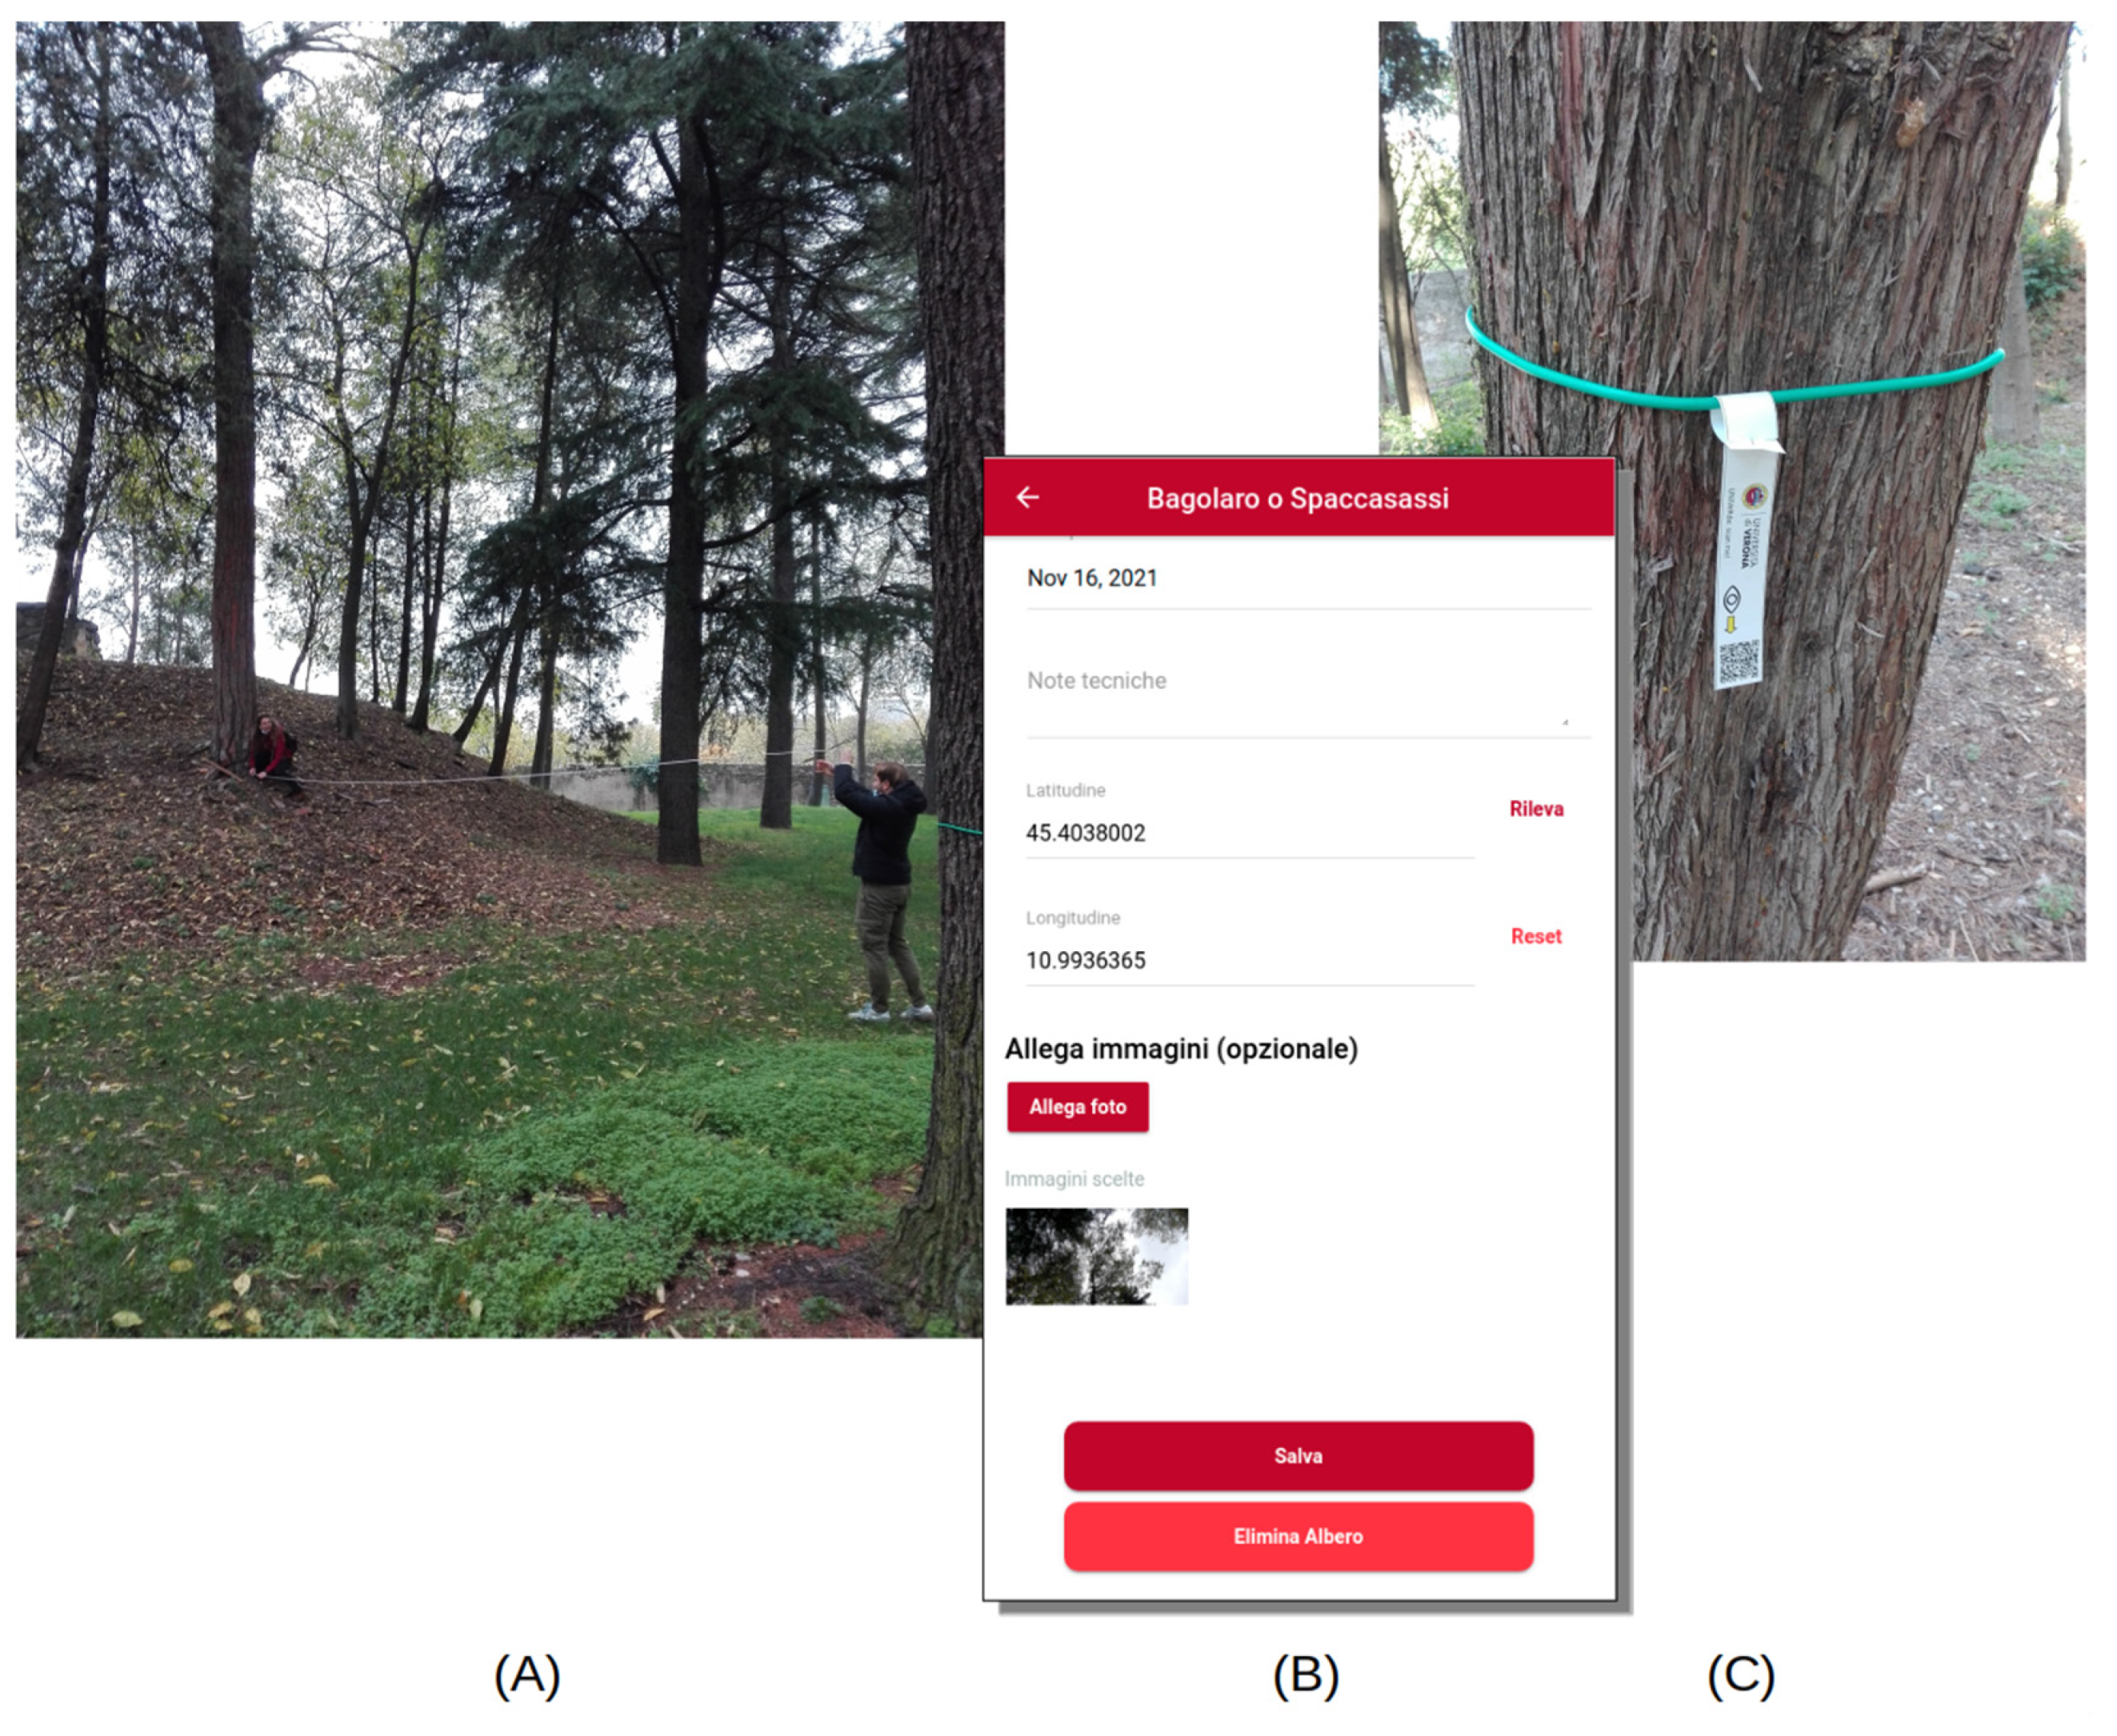
The renewal process of a green area requires detailed and up-to-date information on the presence of trees. The area under study is not under the direct control of the Municipality of Verona, so an inventory of trees was not available. This gave the opportunity to experiment with a participative approach to obtain an inventory of trees in the park. Participation in tree inventory operations by non-professionals has two advantages: it can be undertaken freely by private area owners, and it helps to increase awareness of the place among the local community. For the present study, a dedicated web application compatible with the most common smartphone models was created, and students from the University of Verona were invited to use it to take part in the tree inventory operations. The application allowed the volunteers to record their position and the characteristics of the trees in the target area (Figure 2A). Data collection was supported by a software application, with the aim of making the information available to everyone through the web (Figure 2B) (https://www.weplant.nino.cloud, accessed on 29 December 2022). Since the software tool is a cloud-based web application, it can be used on the smartphone without being downloaded from stores and installed; this fact fosters public participation. Plastic tags, each bearing a unique QR code, were prepared and applied to each tree (Figure 2C).
After the student applied the tag to the tree, he/she used the application on the smartphone to associate the specific QR code with a card on which a series of information could be entered: genus, species, height, circumference at 1.30 m from the ground, and geographic position obtained by using the Global Positioning System (GPS) sensor embedded in the smartphone. Free text notes and photographs could also be associated with the card. The QR code encodes not only a numerical ID, but also a complete web link (e.g., https://www.weplant.nino.cloud/#/intro?plant-id=100308, accessed on 29 December 2022). This feature, together with the fact that the application does not need to be downloaded and installed, allows anyone to retrieve plant information by simply scanning the QR code on the plastic tag with a barcode reader. No registration is required to browse the tree information, in order to reach the widest possible audience. Conversely, it is necessary to register as a user to create, edit and delete cards, so that actions on the cards can be tracked. Each time a user modifies and saves a card, the new version is added to the database, and all versions of a card are kept in the system’s archive. Even when a card is deleted by a user, it is only marked as deleted but not actually removed from the archive. These technical specifications were crucial for the success of a participatory inventory project, as non-professionals can easily make mistakes that need to be corrected, even by an a posteriori analysis of the collected information. The collected data are open, licensed under the Open Data Commons Open Database License as in the case of the ‘Open Street Map’ project. People are free to copy, distribute, transmit and adapt it, if credit is given to the application and its contributors. If data are modified or used for further analysis, they may only be distributed under the same licence from Open Knowledge Foundation.
The layout of the web application was configured to be correctly displayed on smartphones, tablets and laptops. The underlying concept was to create an open-source tool and focus on numerous functions, both specific to smartphones (e.g., card browsing in the field) and computers (e.g., detailed editing of contents).
A methodology was defined to verify data provided by students. The first step consisted of identifying the various versions of the same card to check if conflicting data were present. Then such versions were merged into a single card and missing fields were identified. The next step consisted of computing the height-to-circumference ratio to find suspected values. Finally, GPS values were used to report tree positions on a map to find strange placements (e.g., trees outside the area of the park or in the middle of a street or inside the irrigation channel on the edge of the park).

2.2.2. Interviews to Collect Preliminary and Explorative Data on Potential Users

Although digital green mapping is the first step to make a green area more visible, the collection of explorative data on actual and potential users is a crucial component that should complement the mapping activity [26]. Specifically, data collection should explore some thematic areas such as the level of knowledge of the green space, subjective evaluations of landscape benefits, type and frequency of use, preferences, expectations and suggestions on how to increase the visibility and interest in the green space.
Usually, the methodology for data collection involves the definition and selection of a representative sample of potential users and the design of a quantitative (online or face to face) survey in order to have statistically significant results [27,28]. However, in some cases researchers decide to adopt explorative and less structured approaches (focus groups and one-to-one interview), which are particularly interesting as a preliminary analysis especially when resources (human, time and financial) are limited and the intervention to be implemented is not yet clearly defined [29,30].
To collect our qualitative data, we adopted this second approach. In our opinion it is consistent with the main objectives and resources of the pilot project, specifically with the participatory approach and with the interdisciplinary vision that underlies this study. Moreover, it may give a relevant contribution in identifying possible strands of analysis to be pursued in subsequent steps with a more rigorous quantitative survey and in providing us with suggestions for planning and design of the park by landscape architecture experts and assessing the economic burden and expected benefits.
Once the participatory digital mapping of the green area was completed, the University students engaged in this project also contributed to the preliminary and explorative data collection on potential park users [31]. They were divided into three small groups (3–4 individuals) and, under the supervision of experts (mainly university professors and authors of this article) from different disciplines (medicine, computer science, biology, economics, and landscape architecture), carried out qualitative interviews to three identified target groups: (1) university students; (2) hospital staff; and (3) hospital patients and visitors. The outline of questions used to collect qualitative data consisted of a very small number of open-ended questions on specific topics, namely: characteristics of the respondent (age, gender, role), knowledge and type of use of San Giacomo Park, positive/negative attitudes toward this urban green area, subjective evaluations of expected green benefits related to visiting the park, personal opinion on the digital green mapping project and preferences/desires for the requalification of park. Given the type of interviewees, people passing through the area and with little time available, students had no more than 5 min for each interview, so the questions had to be short and simple. The onside interviews were conducted over the period June–September 2021 and overall, 50 face-to-face questionnaires were carried out.

3. Results

3.1. Results from the Digital Mapping

To analyze the data from the digital mapping of the area, a spreadsheet table was exported using a specific function of the application. From the initial 433 entries, rows with the same card ID were grouped to highlight repeated versions of a specific card and to merge the information accordingly. In some cases, there were two to five versions for the same tree. The tabs selected for data analysis were those with the most recent creation date and the most complete information. After data cleansing, the total number of trees mapped in the considered area was 292, with 261 cards (89.7%) having complete species identification information. This information was entered by the students at the time of mapping, by photographing leaves and trunk and using the Pl@ntNet application (https://plantnet.org/en, accessed on 29 December 2022) to identify the corresponding plant. The remaining sheets contained partial or incorrect data. The most frequent problems were attribution of genera without attribution of species, and missing/incorrect values for height or girth (e.g., out-of-scale measurements). The availability of high-quality images attached to each card by the students was very important in the revision phase. The average ratio of height-to-circumference was also calculated for each genus/species and used to identify additional suspect values. The most frequent source of error was the measurement of plant height, which was carried out using a manual trigonometric method based on a smartphone app acting as clinometer and considering the last tip of the plant. The circumference values were generally more easily evaluated. We also found that some GPS values were unreliable; in particular, several cards filled out by the same user in a short time interval contained the same GPS values; this is a well-known update problem of consumer GPS sensors that should be addressed in the future.
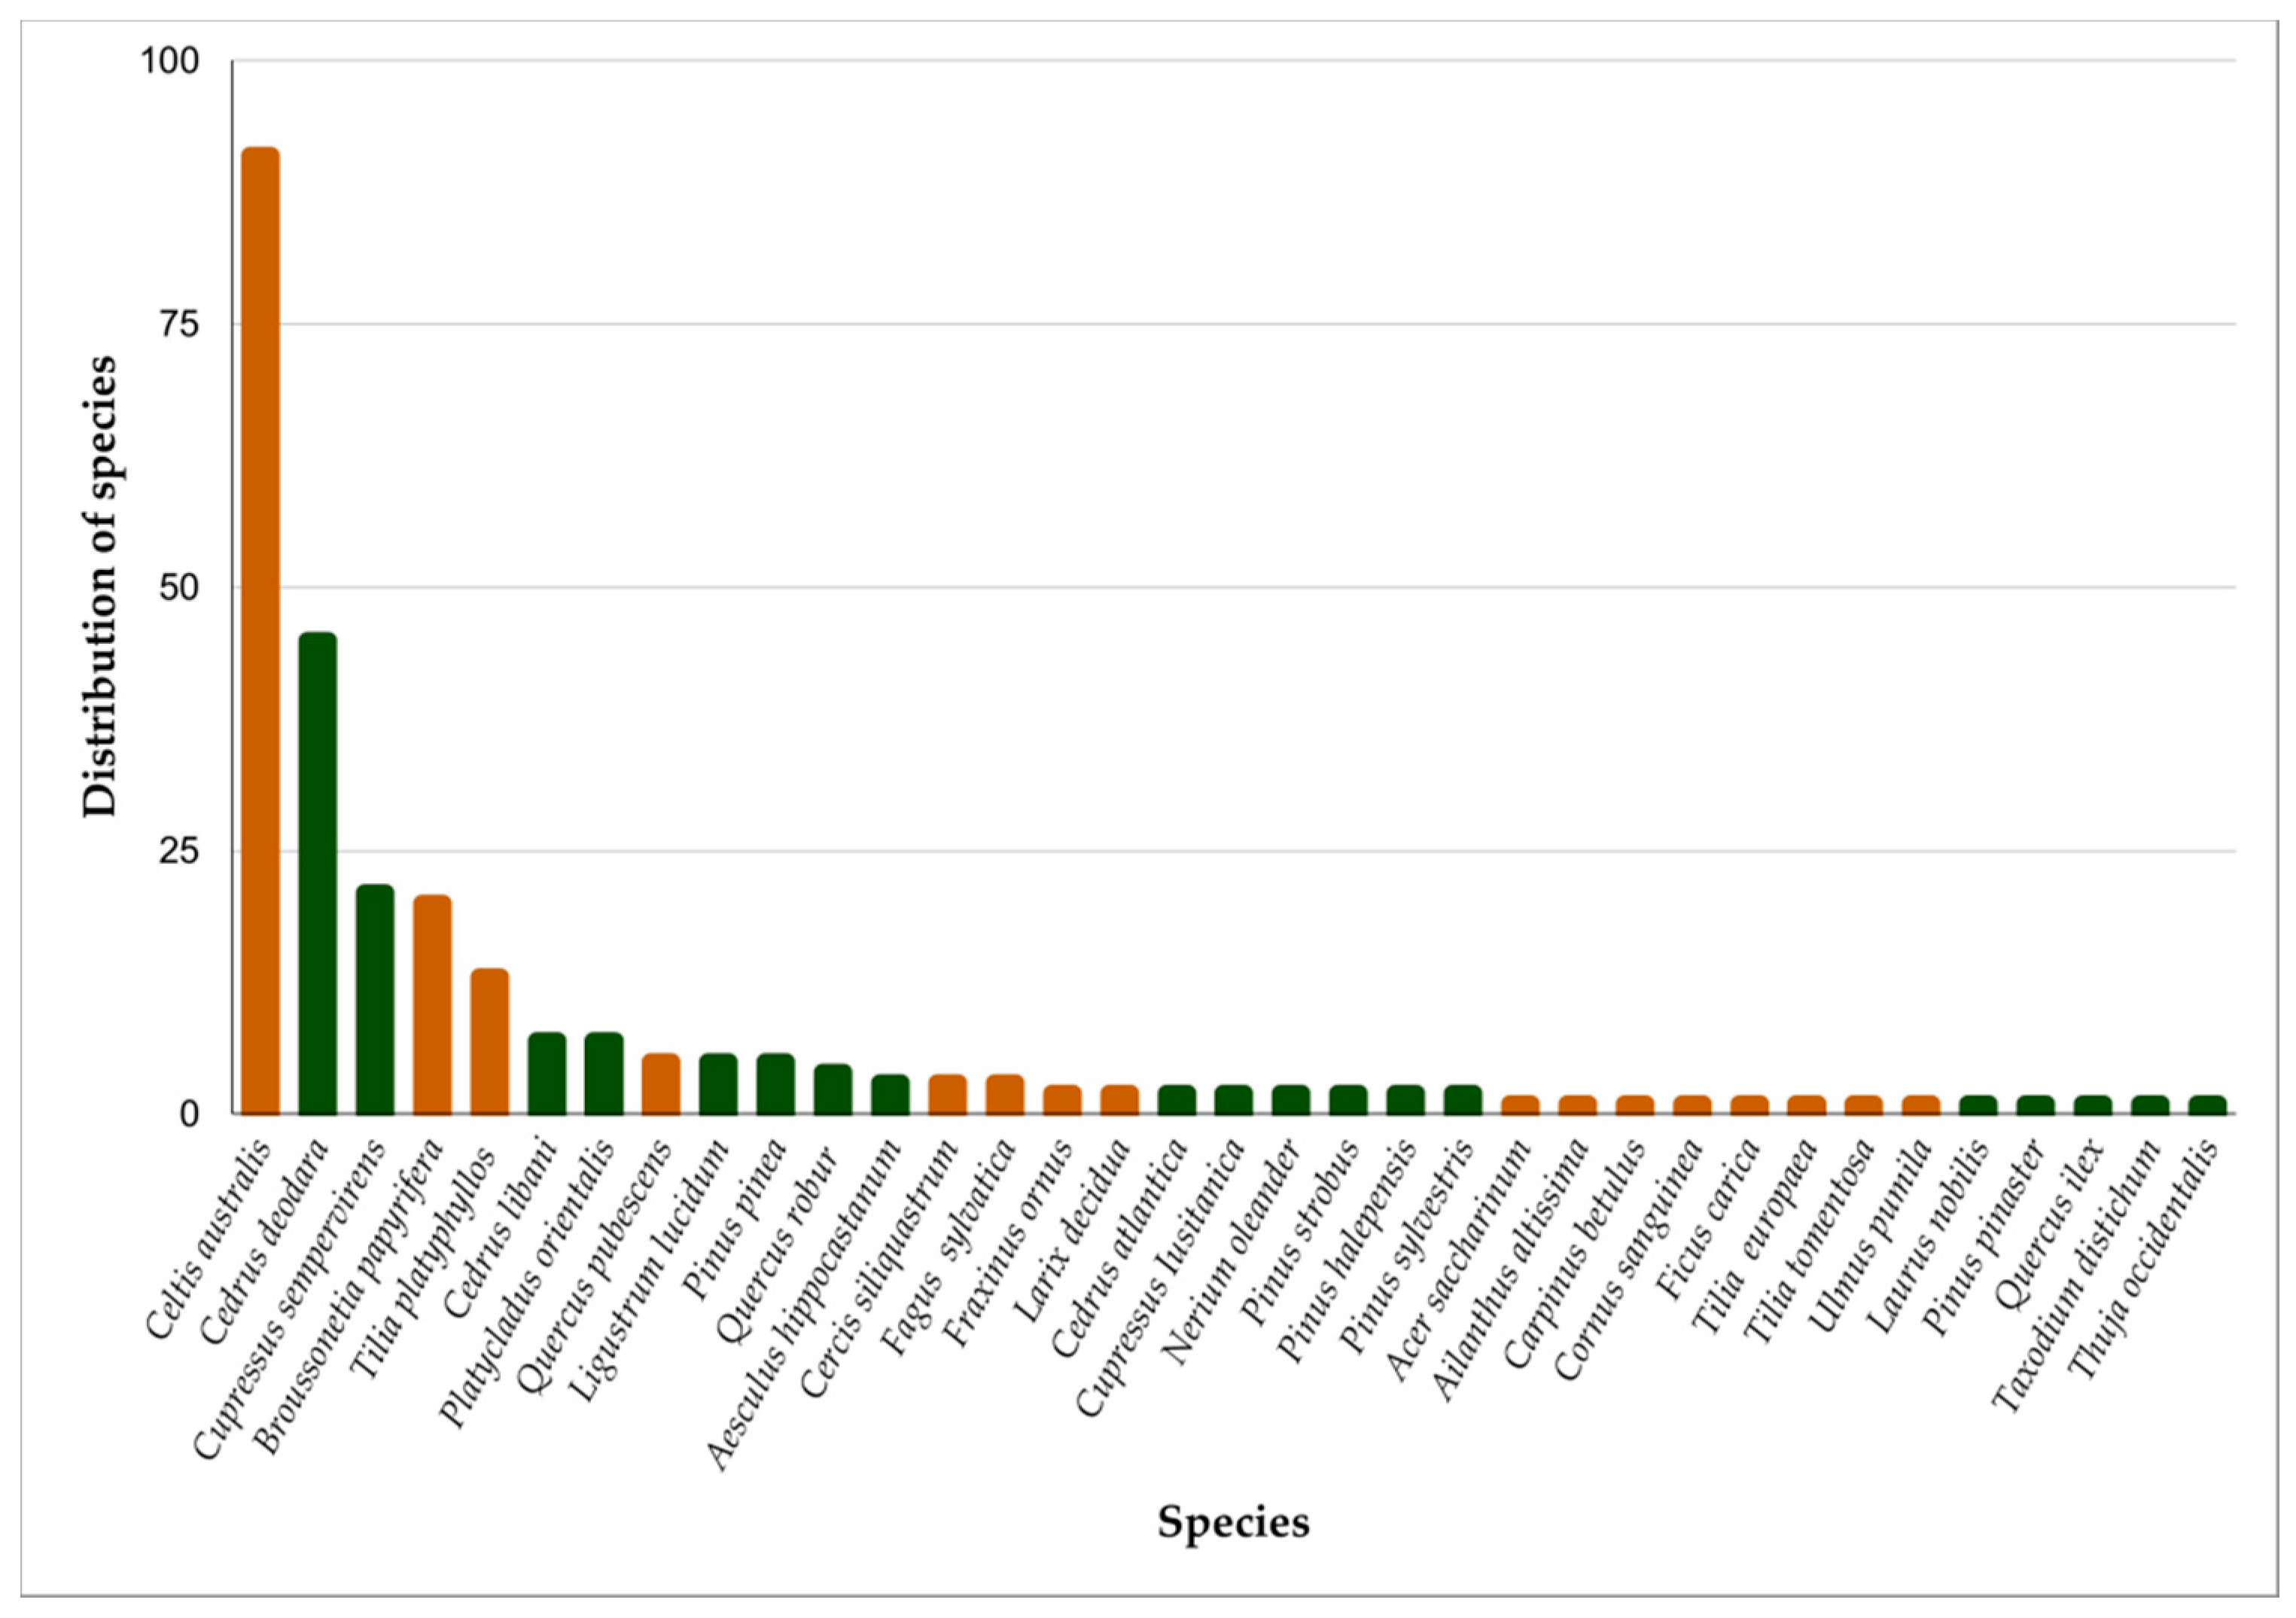
Taking into account the completed cards, 24 genera and 35 botanical species were counted (Figure 3). The most represented species were as follows: Celtis australis, Cedrus deodara, Cupressus sempervirens, Broussonetia papyrifera and Tilia platyphyllos, with 91, 45, 21, 20 and 13 specimens, respectively. Together, these five species accounted for 72.8% of the identified trees. A further nine species (Cedrus libani, Platycladus orientalis, Quercus pubescens, Ligustrum lucidum, Pinus pinea, Quercus robur, Aesculus hippocastanum, Cercis siliquastrum, Fagus sylvatica) presented between three and seven plant individuals. The remaining 21 species were represented by only one or two individuals. The distinction between deciduous and evergreen plants was also determined (colored bars in Figure 3): this information was important to assess the level of sunlight in the park in the various months of the year; trees with deciduous leaves were 154 out of the 261 identified plants (59%).
We also classified the specimens according to height and circumference: 72.5% of specimens were between 5 and 20 m, 15.8% over 20 m and 11.7% shorter than 5 m, while 80.8% had a circumference between 20 and 200 cm, 10.3% greater than 200 cm and 8.9% less than 20 cm. It appears that the most represented specimens were those of intermediate values.

3.2. Results from the Interviews

The interviews revealed a lack of knowledge of the green area (except for target group 2), mainly due to the lack of adequate signposting; a very modest use of the area, mainly as a ‘transit’ area for moving from one place to another within the University complex or for a quick stop; and a widespread perception of neglect and lack of appreciation.
In this article, we focus on the findings of the target group that we consider of particular interest for the future of the park, which are the hospital’s patients and visitors. This group included a rather large number of people with different ‘green’ preferences, depending on the reason for their admission. The total number of respondents was 15 individuals, including six visitors and nine patients, aged between 25 and 70 years. It is important to underline that our qualitative survey, which was mainly exploratory, was not designed to be statistically representative. Although the results cannot be generalised, we describe some qualitative aspects worthy of attention. A consensus seemed to emerge among the interviewees regarding the benefit of having a green area close to the hospital and the need for a restyling of this old park, ranging from a limited ‘marginal’ change, to better care and maintenance of the turf and trees, to a more incisive intervention aimed at enriching the green area’s heritage of plants and flowers, perceived as too homogeneous. The interviews also revealed the need for furniture: some benches for relaxing in the park and tables for the recreation areas, which are currently lacking. Some interviewees also asked for the installation of a refreshment area, also considering the level of crowding inside the hospital. The possibility offered by the digital green mapping to get to know the park’s tree heritage, through the QR code, was highly appreciated and raised curiosity in the interviewees. However, the average age of the patients would require the installation of some panels explaining, in a simple way, how to view the information with a smartphone. The possibility of digital interaction with the environment could also arouse interest in younger visitors and be an opportunity to share information with the in-patient relatives they visit, as well as to stimulate cognitive and digital skills of elderly patients.

4. Discussion

From the data and their analysis, it is possible to outline directions for the development of the area.

4.1. Towards a Healing Garden

The conceptual plan must be developed on ecological sustainability, to improve a low-maintenance green space system connected to the hospital park [32]. This can be achieved by increasing biodiversity, by restructuring the remaining small urban areas with pocket parks, by improving parking areas with vegetation and by separating pedestrian spaces from roads with green strips [13]. In addition, the proximity of the other two city parks suggests a possible system of dedicated user paths.
The landscape design is based on the evaluation of the vegetation to monitor its health status and on the analysis of the landscape structure to make changes, with the removal of plants in poor condition and the introduction of new plants to improve spatial definition. For this task, data obtained by the digital green mapping are valuable. At the same time, it is necessary to investigate environmental perception and behavior using data obtained through the interviews to understand people’s interaction with the site and their needs and interests, in order to design a safe and comfortable space in which they can find aesthetic enjoyment [25]. The opinions expressed by the respondents point to a lack of stimulation due to weak identity and lack of variety, poor organization of space for resting and slow walking and uninspiring repetition of vegetation. Conifers such as Cupressus sempervirens and Cedrus deodara create shady areas where it is possible to sit and walk in the summer but give the feeling of darkness and monotony due to the few shrubs and lack of ground cover plants. Broussonetia papyrifera is a particularly widespread allergenic invasive shrub that may be considered inappropriate in the vicinity of the hospital and replaced by other plants.
Natural elements can change the division of spaces, and introduce movement, views and new functions for different ages. Resting places and paths can invite people to explore the area and experience sounds, smells and shade intensity.
The choice of shrubs, herbaceous plants and ground cover can give a new structure to the area, using color variety to define spaces and create a dynamic distribution of plants. Textures and colors influence space, distance and perspective [31]. They can give the feeling of being in touch with nature through seasonal changes. Foliage in different shades of green, grey, bronze and purple, used sensibly, creates a series of connected gardens. People are attracted to the red and yellow-orange bark in winter (Cornus sanguinea, Acer griseum) and the pink and white flowers of magnolias that bloom in spring (Magnolia x soulangeana, Magnolia stellata, Magnolia liliiflora ‘Nigra’). Small trees with inedible red fruit in the summer (e.g., Crataegus spp., Malus spp.) are valued by humans and birds. Shrubs with a sweet and delicate scent (Chimonantus praecox, Calicanthus spp.) in winter and late spring (Philadelphus spp.) planted near sitting places give a sense of calm and tranquility.
In shady places, the use of evergreen ground cover plants under deciduous trees increases the pleasure of resting in the park, with the filtered effect of light on small, colorful flowers. The bright colors announce the arrival of spring and give a feeling of freshness in summer. Pachysandra terminalis, Lamium maculatum ‘White Nancy’, Ajuga reptans, etc. planted en masse cover the ground densely and can survive with little watering and maintenance.
The location, arrangement and choice of seating and furnishings require careful consideration of pavements and paths, to satisfy the need for social interaction and, at the same time, detachment from others. The ergonomic design considers the comfort of hospital patients and people visiting relatives, with benches also suitable for the elderly. L-shaped benches are suitable for supporting the conversational posture of two or three people. Semi-circular seats allow resting on both sides and are preferable for groups of students to create a sociable environment. Circular seats around mature trees provide moderate shade for south-facing seating and do not block winter sunlight. The seating groups should be easily visible. A beautiful view of the surrounding plants encourages relaxed contemplation of pieces of nature.
Although the renovation of a hospital park cannot properly be considered as designing a healing garden, the operations can restore the therapeutic properties of a landscape and thus contribute to the well-being of people. It should also be considered that the presence of wooded areas in urban spaces has a significant impact on the microclimate, leading to a drop in temperature of between 1 °C and 3 °C during the summer months, when solar radiation is most intense. This is due to the shading and transpiration of the trees, as each tree can transpire up to 450 L of water per day. There are different types of gardens, designed considering the pathologies of the users and the age of the patients. The three main design orientations are: traditional, ecological and patient-centered (e.g., for pediatrics or oncology).
The essential requirement for a healing garden is safe accessibility for everyone involved. Examples of this are: the introduction of appropriate signposting for patients with sensory impairment; simple, curved paths for wheelchair users; the presence of benches firmly fixed to the ground to allow safe standing for elderly or frail patients; and finally, easy access from the hospital. The presence of rest areas for meditation, socializing and nature observation, and the enhancement of tall trees to benefit from their shade, as in the case of the park we mapped, is remarkably important.
The benefits of gardens as a therapy translate into measurable effects, such as reducing hospitalization and drug use, speeding up the rehabilitation process and consequently decreasing the stress of employees and the risk of burn-out.
Another relevant aspect for the well-being of patients and operators is the possibility of gathering due to the fact that the green space is shared by different categories, such as the student population of the University of Verona, who could also represent an added value for a feeling of normalization of patients’ lives. Furthermore, the University would extend the usability of a green space that, traditionally in the Anglo-Saxon world, has always accompanied teaching facilities on their campuses. It should be considered that new generations could learn valuable lessons from meeting people in care, together with their caregivers, outside the hospital ward [15].

4.2. Discussion about Methodology

Digital mapping is not new [19] and since 2013 all Italian municipalities above 15,000 inhabitants must maintain a registry of the trees in their area. Usually, municipalities rely on professional services and we can compare them with our approach. First of all, professional services are provided by people with agronomical or biological background able to directly recognize genus and species while our students relied on smartphone apps to identify the trees. In addition, professional mapping is performed with specific equipment such as standalone Differential GPS sensors to check position and clinometers to obtain the height. In our case, we used services available on the smartphone. The quality of GPS data in the smartphone is affected by the sensitivity of the device in capturing satellite signals. However, usually professional mapping services are not devoted to directly increase the awareness of the citizens about the presence of trees in the public spaces, while in our case we not only aim to increase the awareness of students as users of the area but also at using digital mapping as a practical part of a learning action. Furthermore, professional services paid by the municipality authority hardly cover the mapping of private areas while participatory actions can do this.

5. Conclusions

In this study we presented a sustainable data-based methodology for the requalification of neglected green areas in our cities. The pilot research action deeply involved university students, who carried out both an inventory of trees and the administration of a questionnaire to potential users. The digital map of the tree heritage is now available to the public. Data regarding trees was combined with information from potential users to plan targeted improvement actions, such as the development of biodiversity and the placement of seating to create a comfortable environment.
The total number of trees mapped in the considered area was 292 and, after data cleansing, about 90% of the cards reported good results. If the census had been done by professionals with professional equipment (e.g., a differential GPS sensing station) the error rate would have been negligible [23]. However, a participatory action could increase the awareness of citizens on the value of the green area and furthermore it is the most viable solution in private areas. We hypothesize that a possible solution for a more reliable participatory inventory is to increase the intelligence of the software tool. It should guide users as much as possible, e.g., by banning empty fields, reporting outliers, correcting GPS readings by visualizing positions on a map of the zone and reporting the presence of multiple cards with the same GPS values. In addition, the tool should encourage the collection of high-quality images that can later help refine the dataset.
In addition to the digital mapping of the trees (which is a prerequisite to hypothesize a redevelopment project) and a further verification of the criticalities detected by our explorative survey among all the stakeholders, including the representatives of the institutions involved (the main ones are the Hospital, the University and the Municipality of Verona), a quantitative analysis of the results is necessary, considering the different types of users. This will help to identify new needs that could be added at a later stage of the study. Furthermore, starting from the acquired data, computer graphics applications can be used to render different possible requalification hypothesis to be shown to the users for their further involvement in the decision process, using a very innovative visual choice experiment.

Author Contributions

Conceptualization, V.P., S.T. and D.Q.; methodology, F.M.; software, D.Q.; validation, S.A., M.B. and S.D.; formal analysis, L.D.B.; investigation, A.M.; resources, A.M., S.A., M.B. and S.D.; data curation, L.D.B.; writing—original draft preparation, S.A.; writing—review and editing, V.P., D.Q., S.T. and I.T.T.; visualization, D.Q.; supervision, V.P.; project administration, V.P.; funding acquisition, D.Q. and S.T. All authors have read and agreed to the published version of the manuscript.

Funding

This research received no external funding.

Institutional Review Board Statement

Not applicable.

Informed Consent Statement

Not applicable.

Data Availability Statement

The data presented in this study are openly available. The data can be accessed here: https://www.weplant.nino.cloud (accessed on 29 December 2022).

Acknowledgments

The authors would like to thank the students of the University of Verona who participated in the project: E. Miotto, E. Rambaldel, E. Feder, I. Cornicchia, O.V. Spaltro, S. Forcolin, S. Mazza and S.E. Goldoni.

Conflicts of Interest

The authors declare no conflict of interest.

References

  1. Tulchinsky, T.H.; Varavikova, E.A. A History of Public Health. In The New Public Health; Academic Press: San Diego, CA, USA, 2014; pp. 1–42. [Google Scholar]
  2. Dendle, P.; Touwaide, A. Health and Healing from the Medieval Garden; The Boydell Press: Woodbridge, UK, 2008. [Google Scholar]
  3. Council of Europe. European Landscape Convention. Available online: https://rm.coe.int/1680080621 (accessed on 17 February 2023).
  4. Gerlach-Springs, N.; Kaufman, R.; Warner, S. Restorative Gardens: The Healing Landscape; Yale University Press: New Haven, CT, USA, 2004. [Google Scholar]
  5. Ulrich, R.S. Human responses to vegetation and landscapes. Landsc. Urban Plan. 1986, 13, 29–44. [Google Scholar] [CrossRef]
  6. Stigsdotter, U.A.; Grahn, P. What makes a garden a healing garden. J. Ther. Hortic. 2002, 13, 60–69. [Google Scholar]
  7. Grahn, P.; Stigsdotter, U.A. Landscape planning and stress. Urban For. Urban Green. 2003, 2, 1–18. [Google Scholar] [CrossRef] [Green Version]
  8. Ottosson, J.; Grahn, P. A comparison of leisure time spent in a garden with leisure time spent indoors: On measures of resto-ration in residents in geriatric care. Landsc. Res. 2005, 30, 23–55. [Google Scholar] [CrossRef]
  9. Sherman, S.A.; Varni, J.W.; Ulrich, R.S.; Malcarne, V.L. Post-occupancy evaluation of healing gardens in a pediatric cancer center. Landsc. Urban Plan. 2005, 73, 167–183. [Google Scholar] [CrossRef]
  10. Frumkin, H. Urban sprawl and public health. Public Health Rep. 2002, 117, 201–217. [Google Scholar] [CrossRef] [PubMed]
  11. Alfonsi, E.; Capolongo, S.; Buffoli, M. Evidence Based Design and healthcare: An unconventional approach to hospital de-sign. Ann. Ig. 2014, 26, 137–143. [Google Scholar] [PubMed]
  12. Ulrich, R.S. View through a window may influence recovery from surgery. Science 1984, 224, 420–421. [Google Scholar] [CrossRef] [PubMed] [Green Version]
  13. Capolongo, S. The Nature of the Project: The Role of Healing Gardens; Tecnica Ospedaliera; Tecniche Nuove: Milan, Italy, 2012; Volume 1, pp. 32–35. [Google Scholar]
  14. Frumkin, H. Beyond toxicity: Human health and the natural environment. Am. J. Prev. Med. 2001, 20, 234–240. [Google Scholar] [CrossRef] [PubMed]
  15. Frumkin, H. Healthy Places: Exploring the Evidence. Am. J. Public Health 2003, 93, 1451–1456. [Google Scholar] [CrossRef] [PubMed]
  16. Frumkin, H. Health, equity, and the built environment. Environ. Health Perspect. 2005, 113, A290–A291. [Google Scholar] [CrossRef] [PubMed] [Green Version]
  17. Pristeri, G.; Peroni, F.; Pappalardo, S.E.; Codato, D.; Masi, A.; De Marchi, M. Whose Urban Green? Mapping and Classifying Public and Private Green Spaces in Padua for Spatial Planning Policies. ISPRS Int. J. Geo-Inf. 2021, 10, 538. [Google Scholar] [CrossRef]
  18. Johnson, E.A.; Mappin, M.J. Environmental Education and Advocacy: Changing Perspectives of Ecology and Education; Cambridge University Press: Cambridge, UK, 2005; pp. 292–316. [Google Scholar]
  19. Nitoslawski, S.; Wong-Stevens, K.; Steenberg, J.; Witherspoon, K.; Nesbitt, L.; Konijnendijk, C. The Digital Forest: Mapping a Decade of Knowledge on Technological Applications for Forest Ecosystems. Earth’s Future 2021, 9, e2021EF002123. [Google Scholar] [CrossRef]
  20. Senes, G.; Toccolini, A. Healing Gardens: Green areas for human well-being. In Let’s Green Up the City. Parks, Gardens and Allotments; Zerbi, M.C., Breda, M.A., Eds.; Giappichelli: Torino, Italy, 2013. (In Italian) [Google Scholar]
  21. Senes, G.; Moroni, C.; Poggio, F.; Uras, A. Embraces Garden, the Healing Garden of the Saint Carlo Borromeo Hospital in Milan (Italy); Lambertini, A., Ed.; Edifir: Florence, Italy, 2016. [Google Scholar]
  22. Dudkiewicz, M.; Durlak, W. Sonic Tomograph as a Tool Supporting the Sustainable Management of Historical Greenery of the UMCS Botanical Garden in Lublin. Sustainability 2021, 13, 9451. [Google Scholar] [CrossRef]
  23. Li, X.; Ratti, C. Mapping the spatial distribution of shade provision of street trees in Boston using Google Street View pano-ramas. Urban For. Urban Green. 2018, 31, 109–119. [Google Scholar] [CrossRef]
  24. Tempesta, T. Benefits and costs of urban parks: A review. Aestimum 2015, 67, 127–143. [Google Scholar] [CrossRef]
  25. Antonietti, M.; Bertolino, F.; Guerra, M.; Schenetti, M. Education and Nature. Fundamentals, Perspectives and Possibilities; Franco Angeli: Milan, Italy, 2022. (In Italian) [Google Scholar]
  26. Dover, J.W. Green Infrastructure: Incorporating Plants and Enhancing Biodiversity in Buildings and Urban Environments; Routledge: Oxford, UK, 2005. [Google Scholar]
  27. Lekaj, E.; Teqja, Z.; Xhoxhi, O.; Senes, G. Users Evaluation for Public Parks: Influences of Location, Season, Gender and Age; European Academic Research: Bucharest, Romania, 2019; pp. 603–624. [Google Scholar]
  28. Jiricka-Pürrer, A.; Tadini, V.; Salak, B.; Taczanowska, k.; Tucki, A.; Senes, G. Do protected areas contribute to healt and well-being? A cross-cultural comparison. Int. J. Environ. Res. Public Health 2019, 16, 1172. [Google Scholar] [CrossRef] [PubMed] [Green Version]
  29. Senes, G.; Fumagalli, N.; Crippa, R.; Bolchini, F. Nursing homes: Engaging patients and staff in healing garden design through focus group interviews. Neuropsychol. Trends 2012, 2012, 135–146. [Google Scholar] [CrossRef]
  30. Fumagalli, N.; Fermani, E.; Senes, G.; Boffi, M.; Pola, L.; Inghilleri, P. Sustainable Co-Design with Older People: The Case of a Public Restorative Garden in Milan (Italy). Sustainability 2020, 12, 3166. [Google Scholar] [CrossRef] [Green Version]
  31. Gehl, J. Cities for People; Island Press: Washington, WA, USA, 2010. [Google Scholar]
  32. Laurie, M. An Introduction to Landscape Architecture; Pearson College Div.: New York, NY, USA, 1986. [Google Scholar]
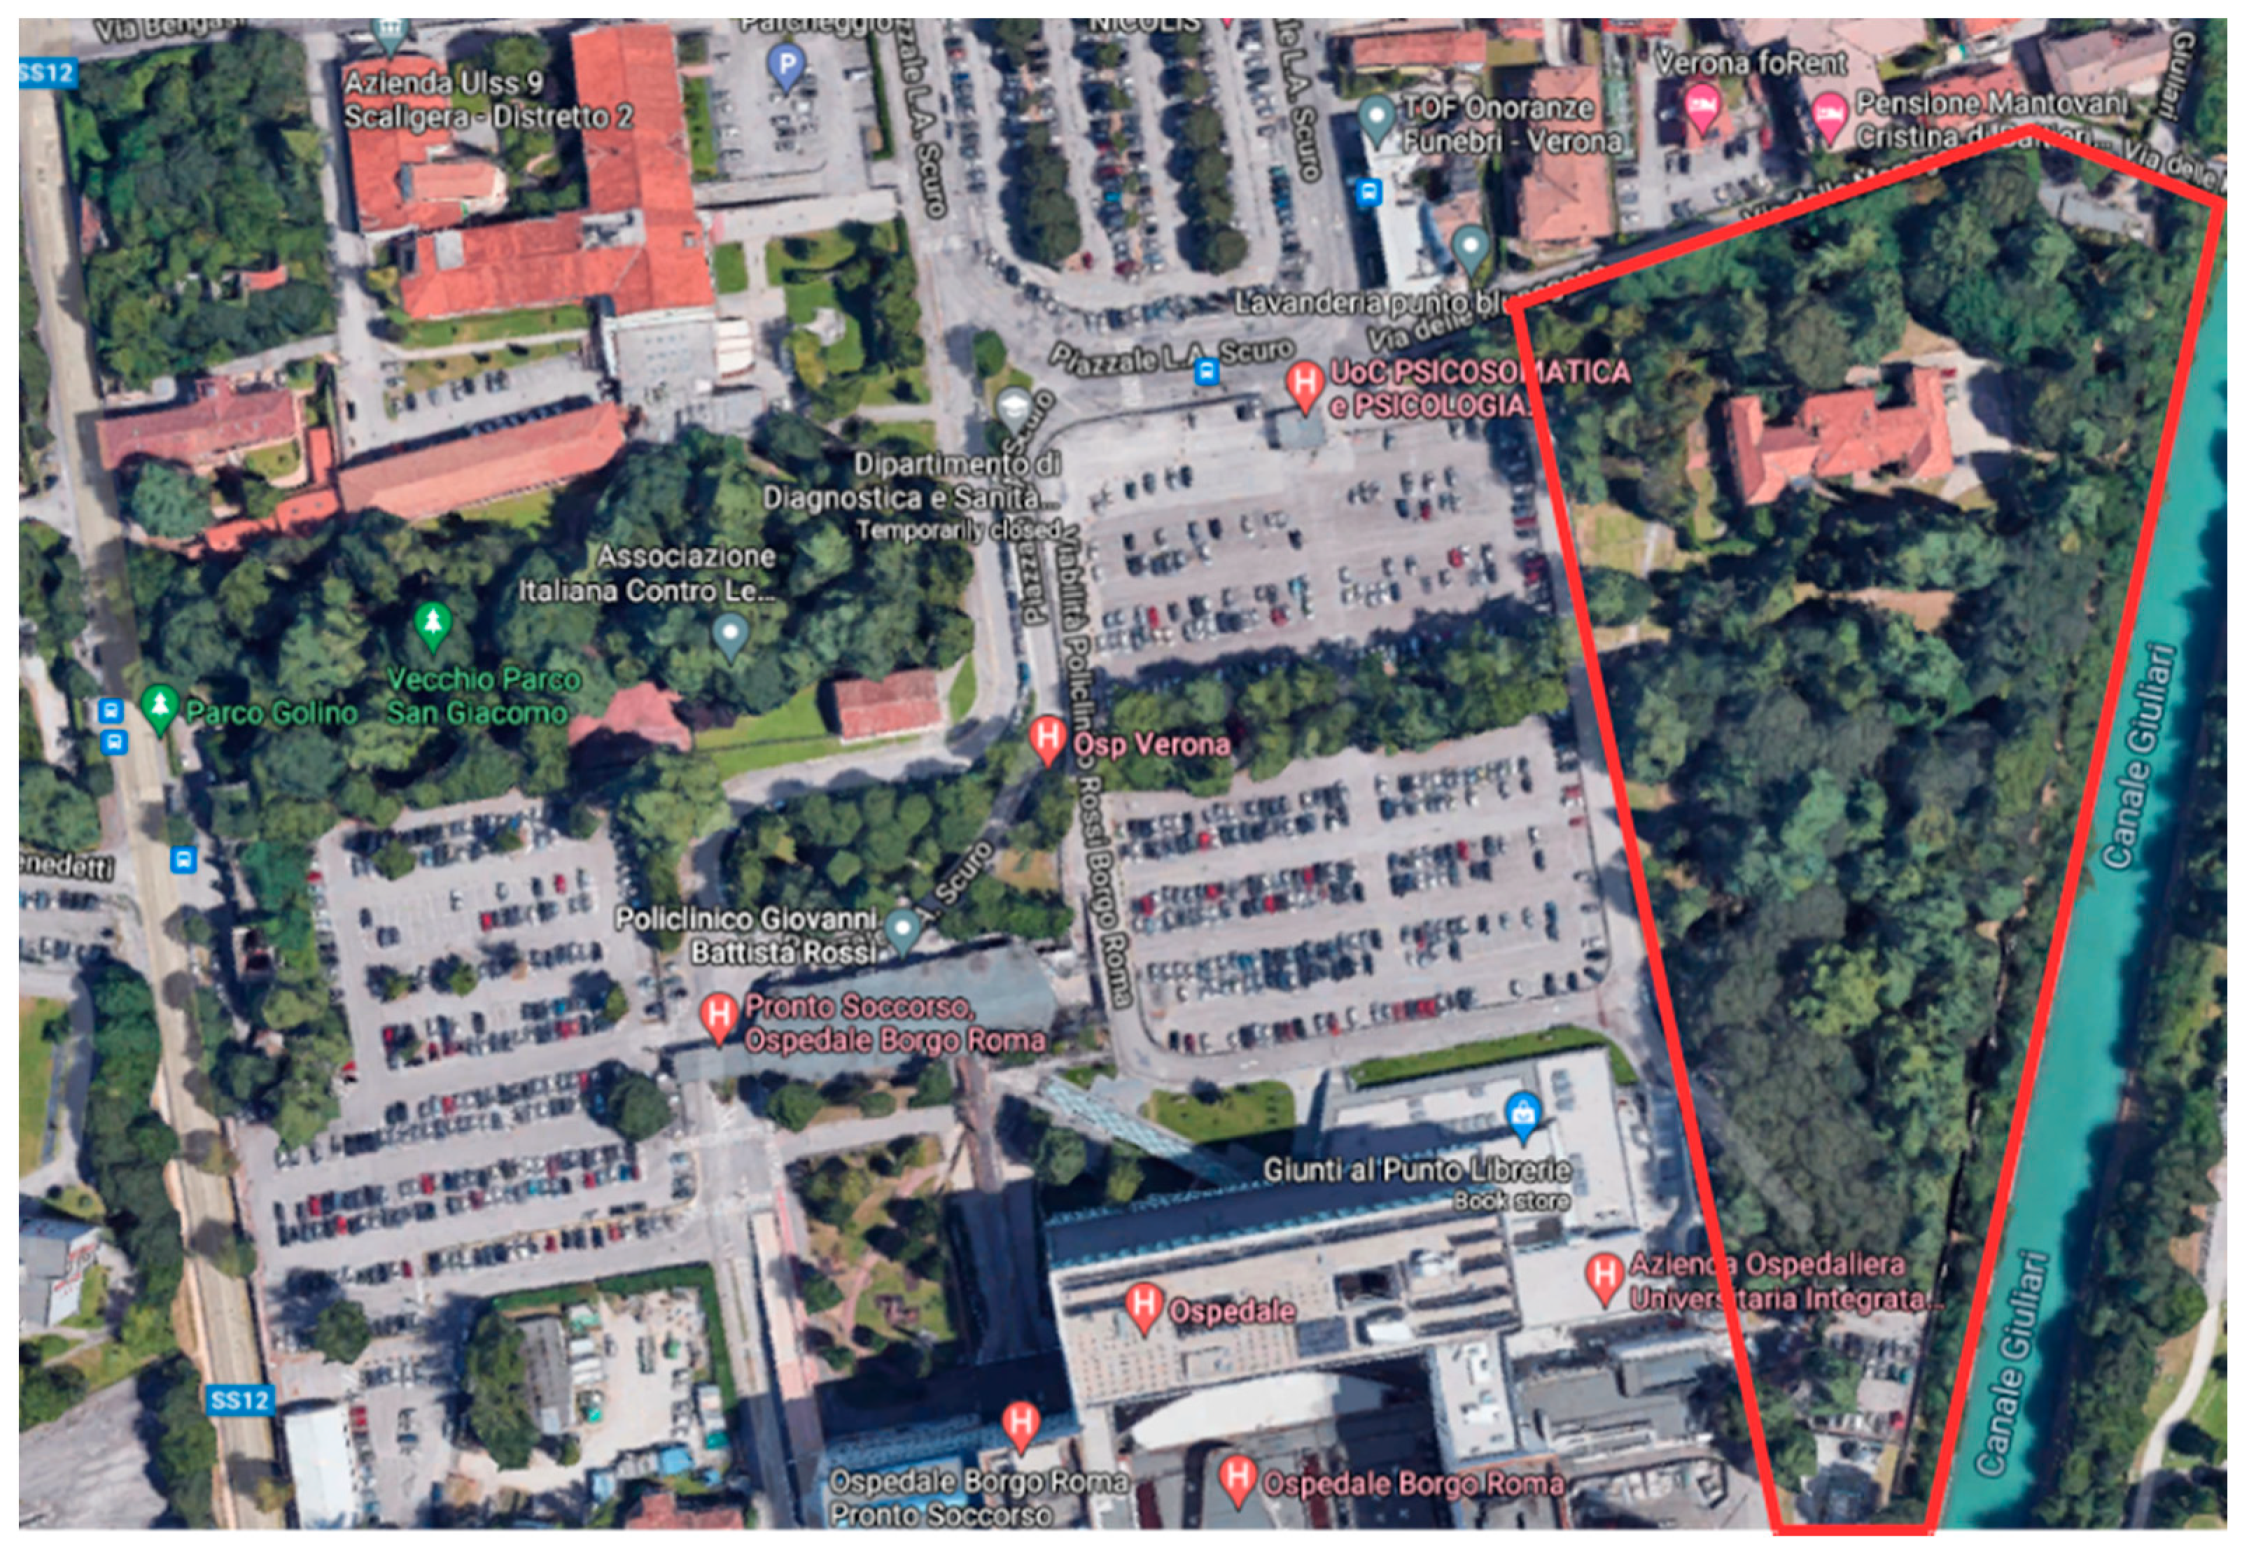
Figure 1. Map of the park (bounded by the red line) and the surrounding area (Google, CNES/Airbus, Maxar Technologies, 2023).
Sustainability 15 03905 g001
Figure 2. Images from the participatory digital mapping. (A): tree measurements. (B): tree card in the web. (C): plastic tag with QR code (D. Quaglia, 2021).
Sustainability 15 03905 g002
Figure 3. Results from the digital mapping: distribution of the different species in terms of total specimens counted for each species. Brown bars denote the deciduous species, green bars denote the evergreen species (L. De Benedetti, 2022).
Sustainability 15 03905 g003
Disclaimer/Publisher’s Note: The statements, opinions and data contained in all publications are solely those of the individual author(s) and contributor(s) and not of MDPI and/or the editor(s). MDPI and/or the editor(s) disclaim responsibility for any injury to people or property resulting from any ideas, methods, instructions or products referred to in the content.