Article

Investigating Extreme Snowfall Changes in China Based on an Ensemble of High-Resolution Regional Climate Models

1
School of Geography and Planning, Sun Yat-sen University, Guangzhou 510055, China
2
School of Civil and Architectural Engineering, Shandong University of Technology, Zibo 255049, China
3
School of Labor Economics, Capital University of Economics and Business, Beijing 100070, China
4
Faculty of Engineering and Applied Science, University of Regina, Regina, SK S4S0A2, Canada
*
Author to whom correspondence should be addressed.
Sustainability 2023, 15(5), 3878; https://doi.org/10.3390/su15053878
Submission received: 22 January 2023 / Revised: 13 February 2023 / Accepted: 14 February 2023 / Published: 21 February 2023
(This article belongs to the Special Issue Climate Change and Enviromental Disaster)

Abstract

:
Anthropogenically induced global warming intensifies the water cycle around the world. As a critical sector of the water cycle, snow depth and its related extremes greatly impact agriculture, animal husbandry, and food security, yet lack investigation. In this study, five high-resolution climate models are selected to simulate and project snow depth and its extremes over China. The simulation capabilities of models in reproducing the basic climate variables in winter are gauged in terms of spatial and temporal patterns over nine subregions. It is found that the driving global climate model (GCM) can contribute to similar patterns, while the different regional climate model (RCM) schemes lead to large variations in the snowfall accumulating on the land surface. The warming magnitude is larger under a higher representative concentration pathway (RCP) scenario (2.5 °C greater under RCP8.5 than RCP4.5). The distribution of ensemble mean winter precipitation changes is more fragmented because of the relatively low skill in reproducing water-related content in the climate system. The projected precipitation change is larger under RCP8.5 than under RCP4.5 due to the amplification of the hydrological cycle by temperature warming. The projected changes in the ensemble mean snow depth mainly occur over the Tibetan Plateau with a decreasing trend. Only several grids over the Himalayas Mountains and the upper stream of the Yarlung Zangbo River are projected with a slight increase in snow depth. Both the intensity and frequency of extreme snow events are projected to increase in Northeast China and Inner Mongolia, which are important agricultural and animal husbandry production areas in China. The reason behind this projection can be explained by the fact that the hydrological cycle intensified by temperature warming leads to excessive snowfall stacking up during winter. The changes in extreme snowfall events in the future will have a significant impact on China’s agricultural and animal husbandry production and threaten food security.

1. Introduction

Climate change is mainly manifested in drastic changes in climate variables such as temperature, precipitation, and snow. The water vapor cycle is susceptible to such changes due to its high sensitivity and complex feedback processes, resulting in stronger spatial and temporal heterogeneity for precipitation [1,2,3]. Global warming leads to the melting of ice and snow and the retreating of glaciers, which causes the meltwater to quickly replenish into lakes and rivers [4]. Most attention has been given to disasters such as floods and mudslides caused by abundant seasonal snow meltwater [5]. There is a decreasing trend found in average snowfall and snow cover in the Northern Hemisphere, which has also been observed for China in several studies [6,7,8,9]. However, the dynamics of snow depth and extreme snowy events’ response to mean global change might be different from that of average snowfall and snow cover [10,11,12]. Global warming intensifies the atmospheric water cycle and causes a substantial increase in extreme precipitation, including extreme snowfall in winter [13,14,15]. Snow depth is a practical indicator to represent the extent of extreme snowfall threatening construction safety, crop growing, and animal husbandry production [16,17,18,19]. It is rarely explored how temperature warming combined with increased extreme snowfall will contribute to the change in snow depth and its related extreme events.
Various studies have been carried out to simulate and project snow depth variations in response to climate change [20,21,22,23,24]. Snow depth observation data and a global climate model (GCM) were used to simulate the changes in the temporal and spatial distribution of snow depth in China from 2010 to 2050. The snow depth was found to be decreasing over the mountainous areas in the Qinghai–Tibet Plateau, the Loess Plateau, and most areas from the middle of the Yangtze River to the south of the Qinling Mountains were decreasing. However, the snow depth increased in the Tarim Basin, parts of the Inner Mongolia Plateau, and the southern coast of China [6]. GCMs were combined with ground station data from 1960 to 2018 in East Asia and surrounding areas to study the trend of future snowfall [20]. Results indicated that the snowfall in the study area would decrease by 8.9% in the 2050s. A GCM is suitable for analyzing climate research and analysis on a global scale for its coarse grid resolution (100 km–500 km). However, it cannot capture small- and medium-scale climatic processes, which are smaller than the grid size. When assessing future climate change impacts on a local scale, a downscaling technique is required to convert the climate information with coarse resolution into fine scale (such as 25 km × 25 km) resolution information. The dynamic downscaling method, the regional climate model (RCM) has been widely used to simulate small- and medium-scale climate processes and to obtain reliable information for local impact assessments [25]. The RegCM4.4 model was applied to conduct high-resolution numerical simulations of contemporary climate and extreme climate events over Northern Hemisphere [26]. The simulation results were validated against the observation data and indicated that the model could reproduce air temperature well, but poorly simulate the snowfall. RCMs with a resolution of 50 km × 50 km were used to conduct a numerical experiment for the changes in ice and snow disasters under RCP scenarios. Results show that the number of snowfall days would decrease, while extreme snow events, consecutive snowfall days, and maximum ground snow depth might increase in the future [26]. The trend of future snowfall and extreme snowfall events were studied over the Alps with several RCMs under RCPs [27,28,29,30]. They found that the number of snowfall days would be greatly reduced under RCP4.5, and the annual snowfall would first reach a maximum around 2040 and then gradually decrease under RCP8.5. The changing trend of extreme climate events was investigated for the Pyrenees [31]. Results show that the start date of snowfall in the study area tended to be delayed, and the end date tended to be earlier [32,33]. Studies had focused on investigating the extreme snow events, and found that extremes had increased in the future with uncertainties [34,35,36,37,38].
Previous studies have demonstrated that GCMs have coarse resolutions and poor simulations of extreme climate events [20,21,22,23,24]. Studies with RCMs mostly focus on the change in the mean snowfall. Few studies have been carried out for analysis of snow depth and its related extremes [39,40,41]. To fill this research gap, this study will use an ensemble of multiple RCMs to examine the change in snow depth and 50-year return period maximum snow depth under different climate scenarios. First, the models’ winter average temperature, daily precipitation, and snow depth will be validated against the historical observation data in China for the period from 1985 to 2004 to gauge the capabilities of the selected RCMs in reproducing historical climate. After the validation, the concerned climate variables will be projected and analyzed over nine subregions for the period from 2081 to 2100. The differences between the simulation results of the snow depth and extremes under RCP4.5 and RCP8.5 will be compared. Finally, the changes in extreme snow events represented by 50-year return period snow depths will be studied in terms of frequency and intensity.

2. Data and Methodology

With significant monsoon-affected and continental climate characteristics, China has a distinct zonal distribution of precipitation across its vast territory. It is necessary to investigate the changes in extreme snow events caused by regional/local climate features. Under the guidance of the National Climatic Regionalization (Trial Implementation) proposed by the Ministry of Housing and Urban Rural Development of the People’s Republic of China [42], China is delineated into nine climate divisions to better explore the regional climate impacts on extreme snow events based on the distinct temperature and precipitation variabilities (Figure 1). The nine regions include the cold and humid region 1, warm and arid region 2, cold and arid region 3, warm and semiarid region 4, cool and semihumid region 5, cool and humid region 6, warm and humid region 7, hot and humid region 8, and subtropical hot and humid region 9.
This study includes a baseline period from 1986 to 2005 and a future period from 2081 to 2100. Future climate scenarios used to drive the RCMs covering RCP4.5 and RCP8.5. RCP4.5 is a medium emission scenario with a total radiative forcing of 4.5 W/m2 at 2100. RCP8.5 is a comparatively high emission scenario, with the total radiative forcing stabilizing near 8.5 W/m2 at 2100. Climate change is calculated as the difference between the baseline period and the RCP simulations for 2081–2100. With these two RCP scenarios, the possible range of changes in snow depth and its related extremes responding to the increasing radiative forcing can be investigated [6,43]. Five RCMS (with a 0.5° × 0.5° resolution) from the coordinated regional climate downscaling experiment (CORDEX) are selected to comprise an ensemble and explore the underlying uncertainty in climate simulations and projections (Table 1) [44,45]. Each grid point for the frequency and intensity of 50-year return period snow depth in one subregion is added up and averaged to obtain the overall statistical changes in extreme snow events. The processed data are archived at Mendeley Data (https://doi:10.17632/cxv42gzhrc.1, accessed on 7 February 2023) for reviewing and investigating. Daily precipitation and air temperature from the APHRODITE (Asian Precipitation-Highly-Resolved Observational Data Integration Towards Evaluation) dataset (with a horizontal resolution of 0.25° × 0.25°) and snow depth from the ERA5 reanalysis dataset are used to validate the model results. Both APHRODITE and ERA datasets are based on interpolation from vast valid stations and cover more than 50 years [46]. They apply enhanced quality control algorithms to develop climatic products highly resolved in time and space.

3. Results

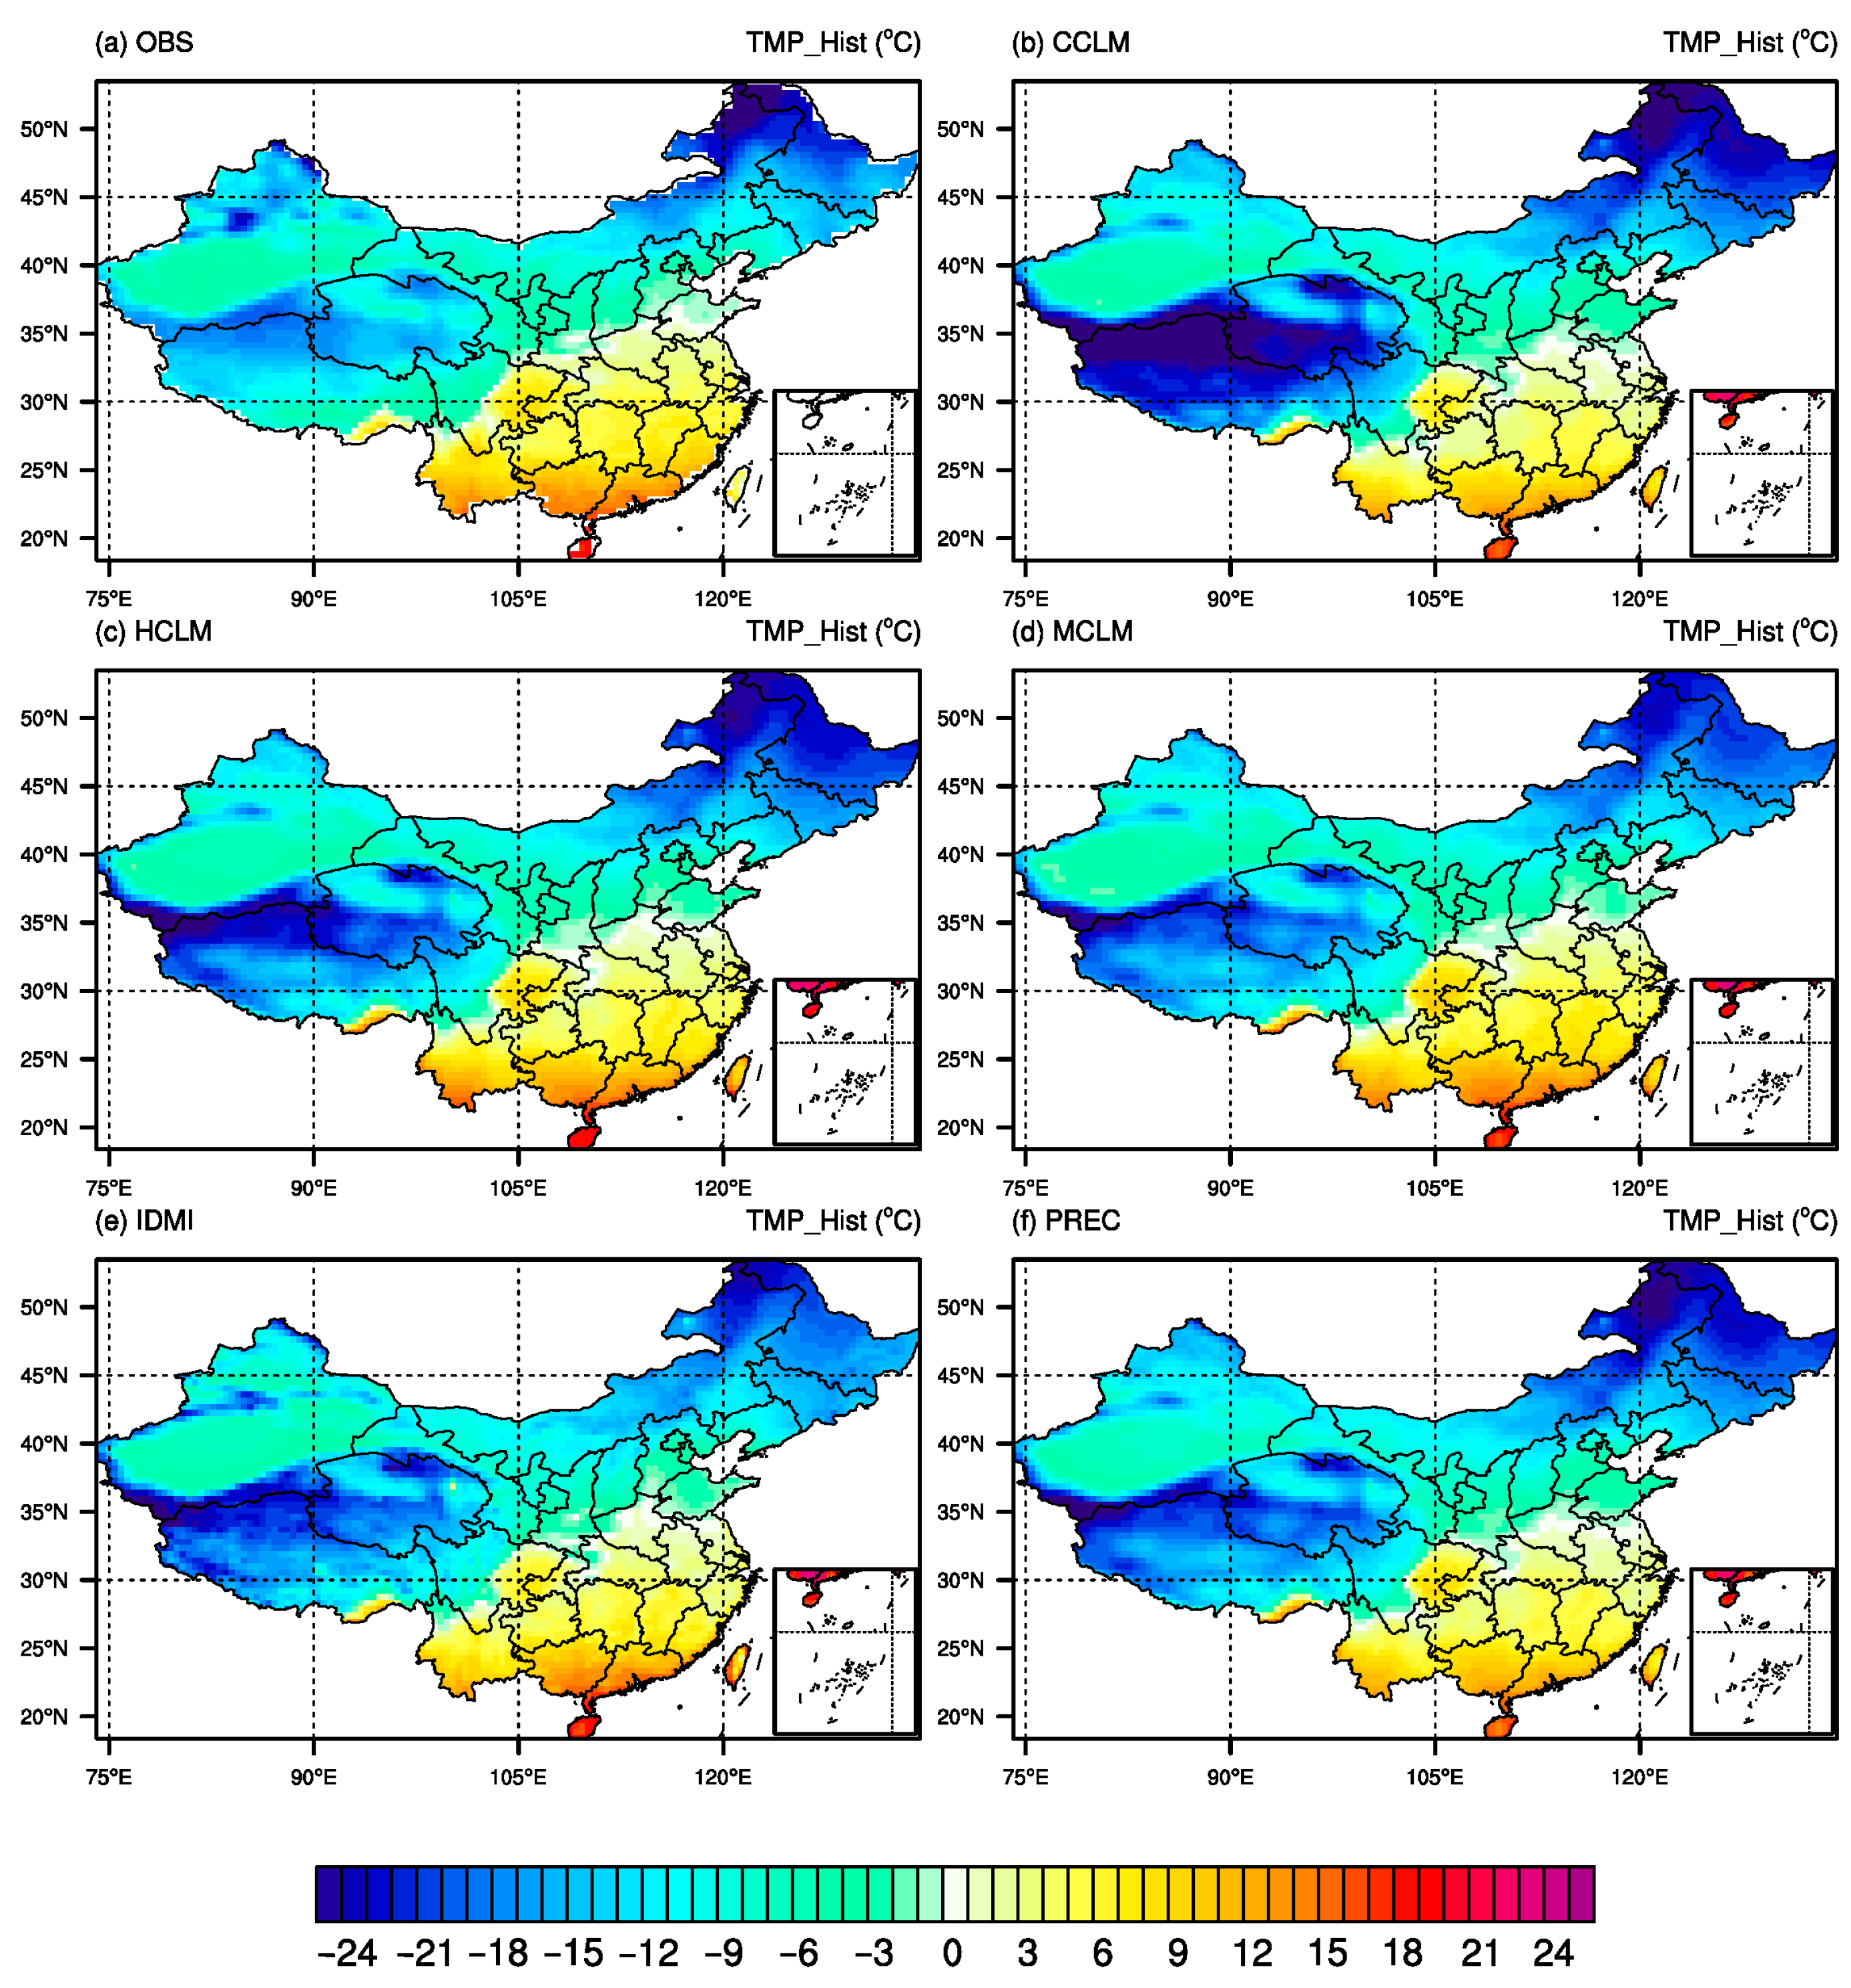
By comparing the observations with the five simulation results (Figure 2), it is found that all the observed and simulated temperatures show a trend of gradually decreasing from south to north. The lowest daily mean temperature occurred in the Northeast Daxing’an Mountains in region 1, and the highest temperature occurred in Hainan Island, the southern part of region 9. The simulated minimum temperature range over region 3 is lower than the observed one, particularly over the Kunlun Mountains. For the remaining regions, the simulation results generally match the observations, subject to some geographical differences. Among the five model results, CCLM simulates the lowest temperature over region 3 and about 10 °C lower than the observation, while the IDMI and MCLM models give the most similar temperature distributions to the observations across the country. The HCLM and PREC models’ performances are in between, with a slight underestimation of temperature. Both the HCLM and PREC models’ driving GCM is HadGEM2-ES, which leads to nearly identical reproduction of temperature over the historical period. The CCLM, HCLM, and MCLM models use the same RCM scheme, CLMcom-CCLM5-0-2, while different driving GCMs (CNRM-CERFACS-CNRM-CM5, HadGEM2-ES, and MPI-M-MPI-ESM-LR accordingly), which results in the distinct performances for temperature simulations. Therefore, the skill of driving GCM in the reproduction of historical temperature is a determinant factor for successfully carrying out liable dynamical downscaling.
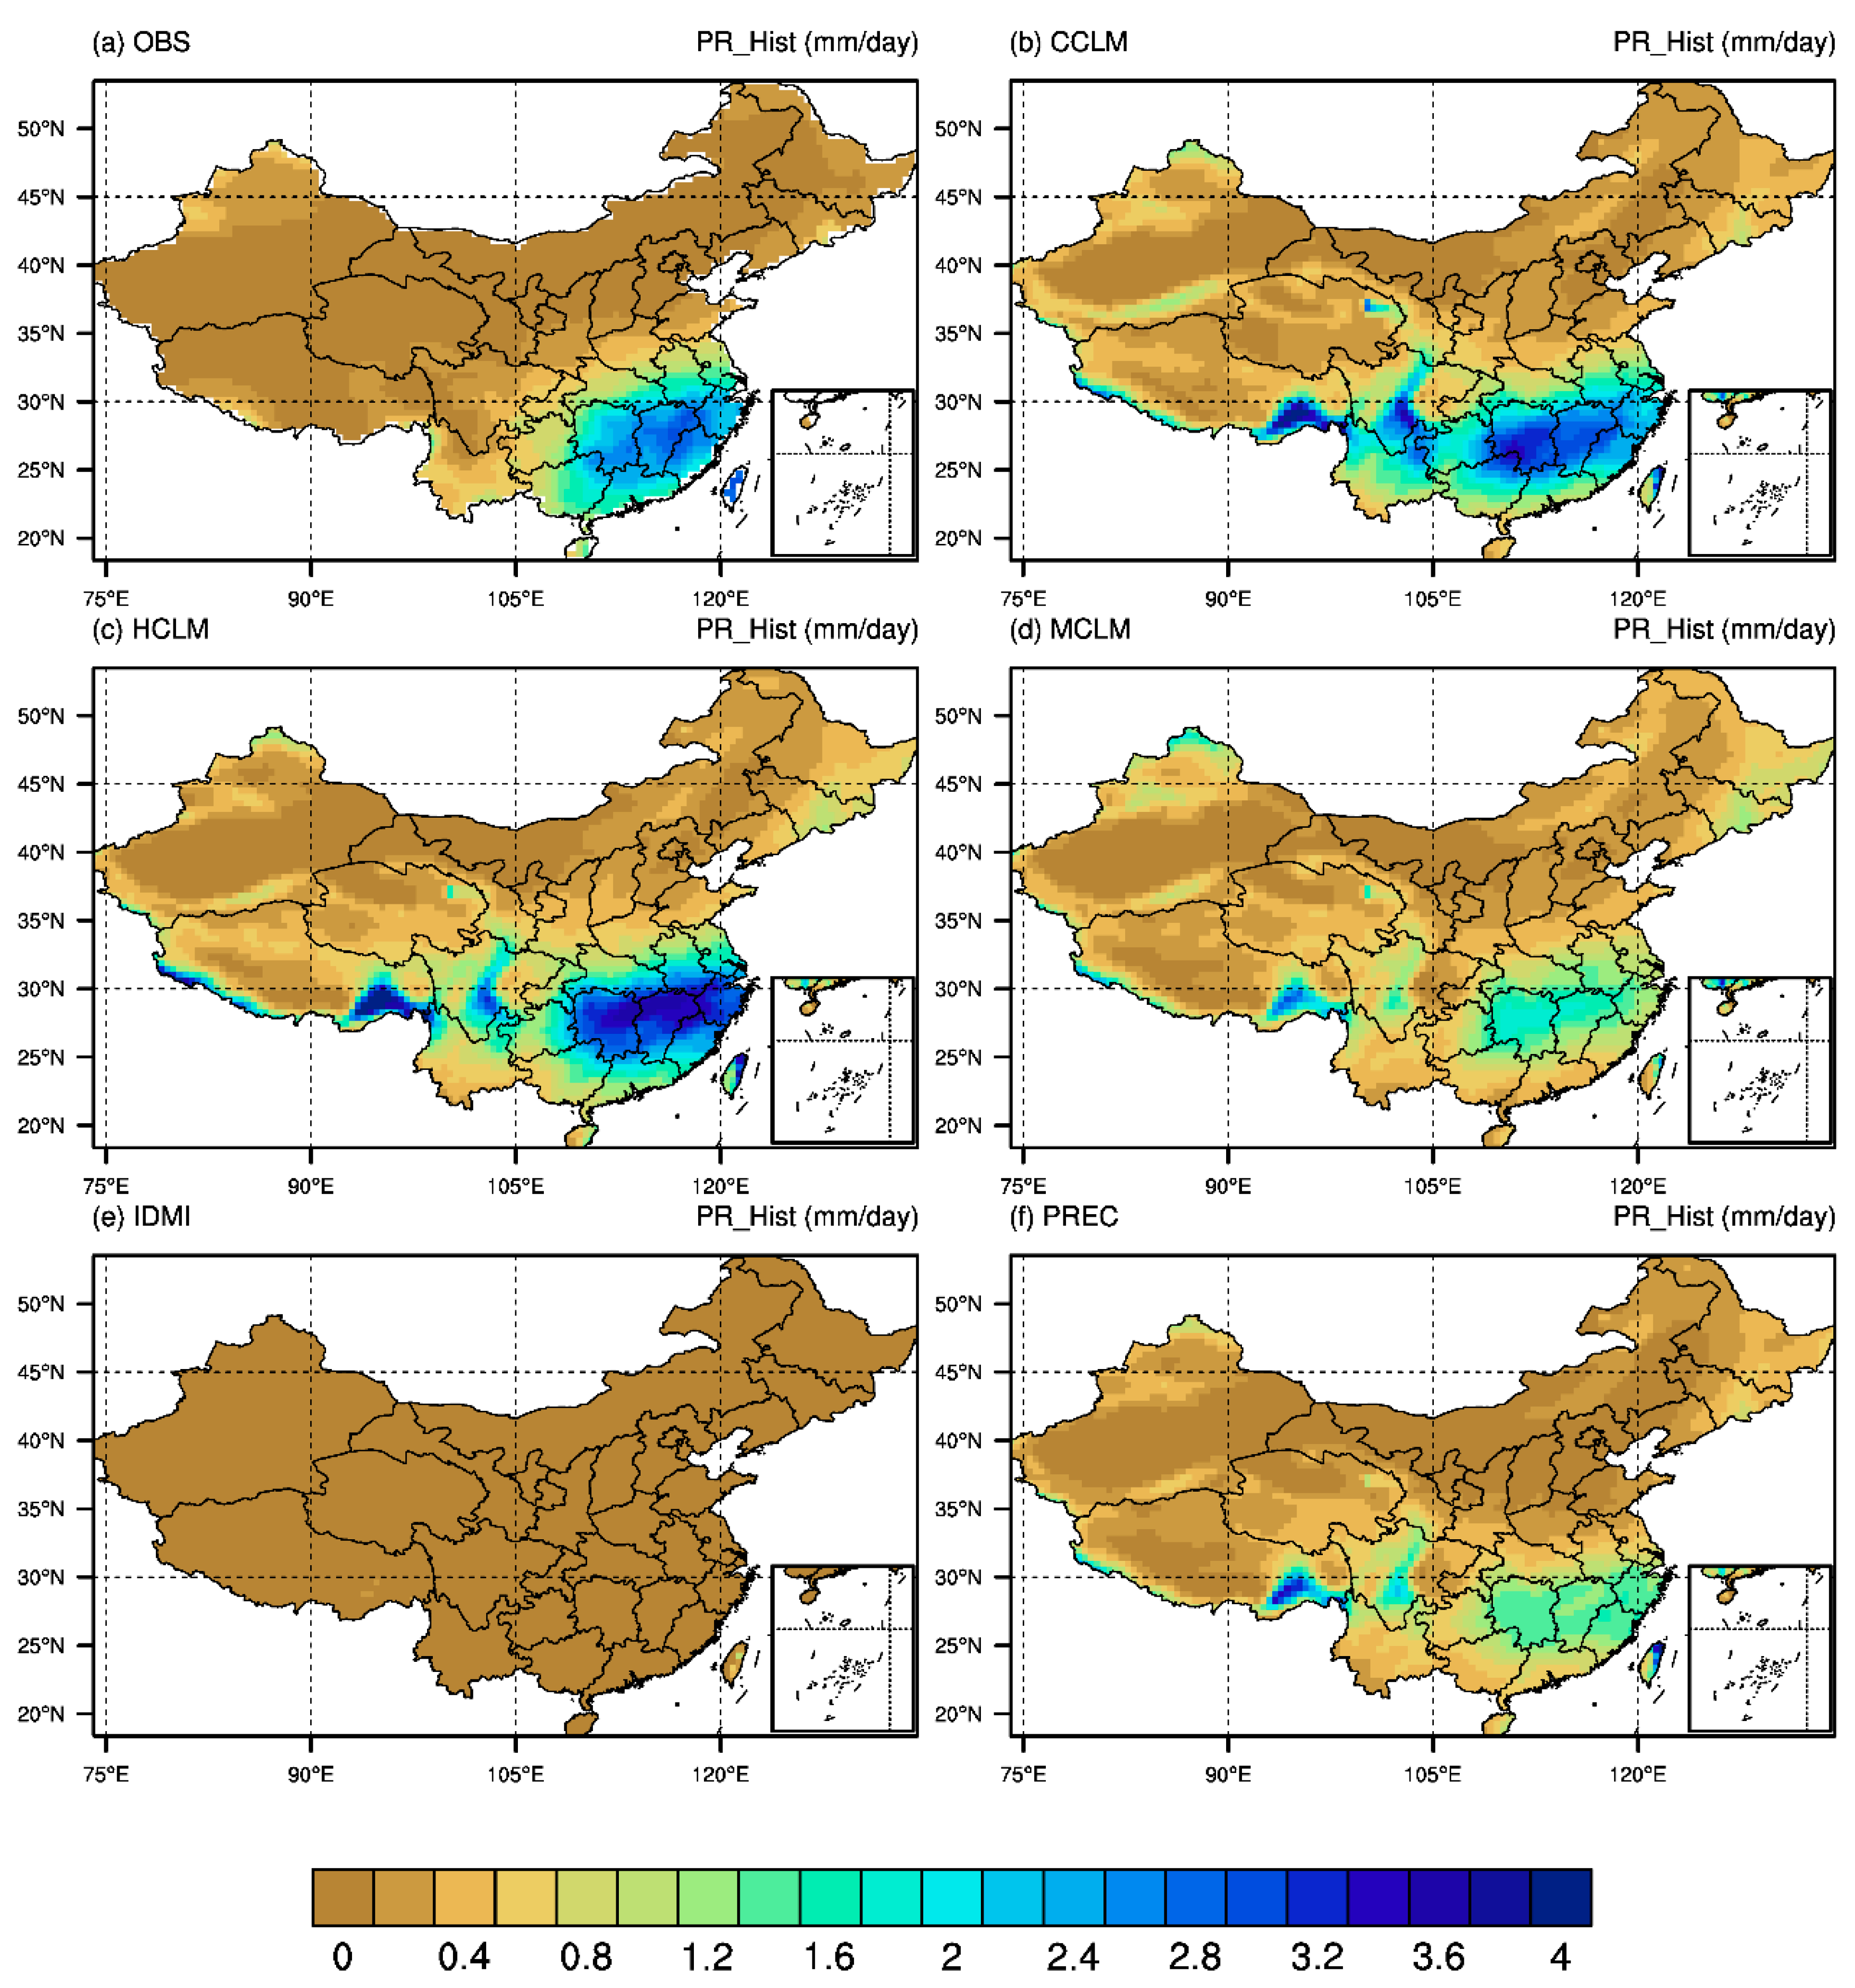
In Figure 3, the observed and simulated daily mean precipitations show a dramatic difference in spatial distribution for winter. The observed highest winter precipitation up to 3.4 mm/day is found over Jiangxi, Taiwan, and Fujian Provinces in region 9 over the baseline period. Among five model results, the IDMI model simulates the most unrealistic results by largely underestimating the winter precipitation. The remaining four models show similar spatial patterns of winter precipitation over regions 1, 2, 4, 6, and 7 for precipitation deficiency and regions 8 and 9 for precipitation abundance compared to the observation. This pattern is caused by the monsoon-dominated climate over the main continent of China, which brings humidity to South China in winter. In contrast to the observed patterns, four RCMs overestimate the winter precipitation over the Yarlung Zangbo River in the southeast of region 3 and over the Sichuan Basin over region 5. HCLM simulates the highest precipitation (about 0.6 mm/day higher than the observation) over regions 8 and 9. The CCLM model exhibits the second highest, with 0.2 mm/day greater than the observed values, while the MCLM and PREC models simulate the precipitation around 1.2 mm/day lower than the observation. In contrast to temperature reproduction, RCMs, rather than their driving GCM, determine the precipitation simulation. Both coarse-resolution and high-resolution models can give reliable results for radiative forcing and temperature simulations, which are less uncertain processes than precipitation [47]. Finer grids are sufficient—but not essential—conditions for better simulating precipitation, for its complex process involves high uncertainty resulting from parameterizations of clouds and convection.
In Figure 4, the observed and simulated daily mean snow depths demonstrate a pattern of concentrating high values over areas above snow lines of mountains and plateaus. The observed high winter snow depth of up to 0.5 m is found over the Altai Mountains and Mount Tianshan in region 2 and southeast of the Tibetan Plateau and the Himalayas Mountains in region 3 over the historical period. Among the five model results, the CCLM model simulates the most unrealistic results by largely overestimating snow depth in region 3. The remaining four models show similar spatial patterns of snow depth against the observation, except for overestimations over the Kunlun Mountains in region 3 and the Khingan Mountains in regions 1 and 6. The skill of the PREC model in reproducing historical snow depth is the highest among all models, for its results match best with the observation. The MCLM and IDMI models simulate snow depth higher than the observation, especially for the Kunlun Mountains in region 3 and the Khingan Mountains over regions 1 and 6. There is no spatial correlation found between winter precipitation and snow depth for both model simulations and the observation. The HCLM and PREC models generate similar spatial patterns of snow depth, but with different magnitudes. The shared driving GCM could contribute to similar patterns, while the different RCM schemes lead to large variations in the water content accumulating on the land surface. Further, the same RCM scheme shared by the CCLM, HCLM, and MCLM models could also lead to large variations in magnitudes of snow depths. The skill of RCM in the reproduction of snow depth is affected by both its driving GCM and RCM model scheme.
Taylor diagrams for temporal and spatial patterns of air temperature, precipitation, and snow depth derived from five models and the observation dataset are shown in Figure 5. Both spatial and temporal correlation coefficients of the five models against the observation are all between 0.6 and 0.99 for air temperature. Comparing the simulation results of the temperature spatial and temporal distributions through the models, it is found that the simulation results of IDMI and MCLM show the highest performance of reproduction for all subregions, which is further approved by the findings in Figure 2. The spatial and temporal diagrams of winter precipitation show that all models can reasonably capture patterns’ standard deviations and correlation coefficients for all subregions, except for regions 3, 4, and 5, where excessive winter precipitation is simulated. Among the five models, the root mean square error of the CCLM model is the largest for precipitation, which means that the model has the lowest skill in winter precipitation reproduction. In contradiction to temperature and precipitation diagrams, results of snow depth indicate that all models have relatively low skill in water content-related simulations in terms of spatial and temporal distributions. Both standard deviations and correlation coefficients of the five models are distributed between their lower limits to upper limits. For instance, the standard deviation ranges from 0.2 to 6.0, and correlation coefficients range from 0.1 to 0.9 for most regions. There are some results for regions 6, 7, 8, and 9 that have reasonable standard deviations and high correlation coefficients because of deficiencies in precipitation and snow depth for both the observation and simulations. On the whole, the root mean square error of the IDMI simulation result is the largest among all models in terms of time and space.
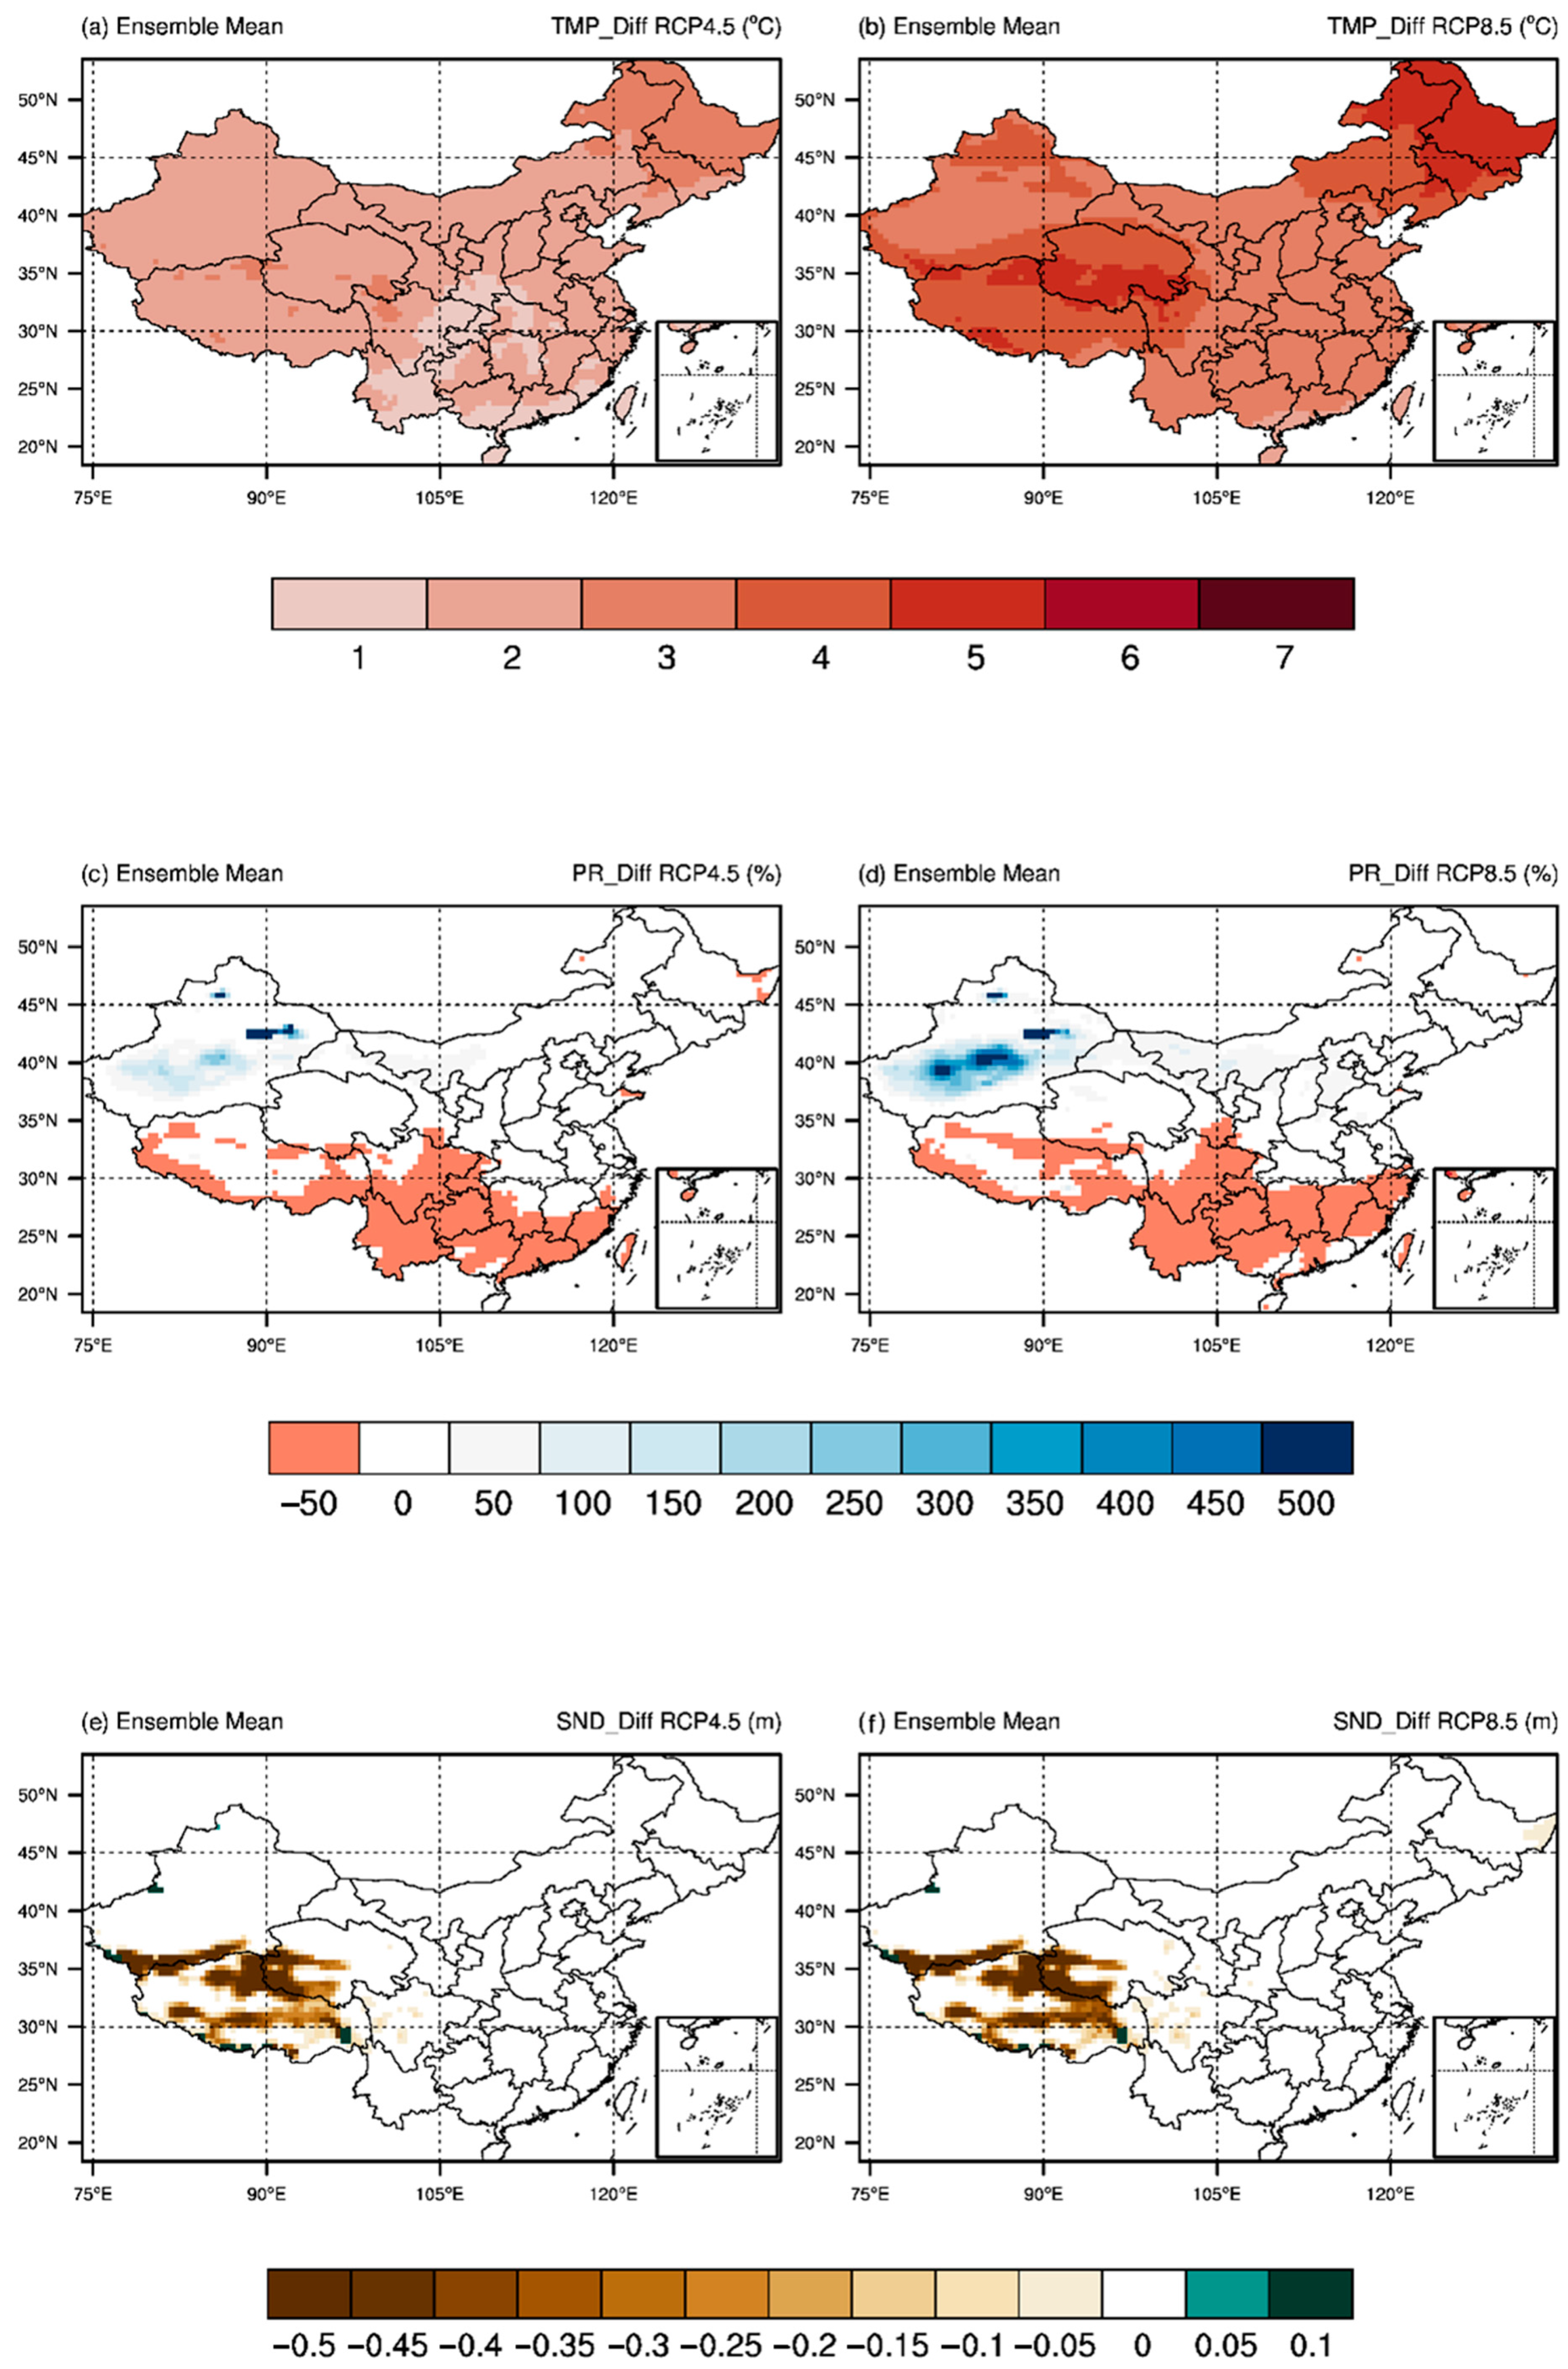
Figure 6 shows the ensemble mean projection of China’s temperature, precipitation, and snow depth changes by five models under RCP4.5 and RCP8.5 for the period from 2081 to 2100 relative to the baseline period. The distribution of changes in temperature is the largest over the high-altitude and high-latitude areas in west and northeast China under both RCPs. This can be explained by the polar amplification effect, where the snow and ice melted over these areas could trigger positive feedback on the climate system [48]. The warming magnitude is larger under a higher emission scenario (up to 2.5 °C greater under RCP8.5 than RCP4.5 over regions 1, 3, and 6). Overall, the temperature of the whole country is projected to increase by 2.3 °C under RCP4.5 and 5.2 °C under RCP8.5. The distribution of ensemble mean winter precipitation changes is more fragmented because of the relatively low skill in reproducing water-related content in the climate system. The projected precipitation change is larger under RCP8.5 than under RCP4.5 due to the amplification of the hydrological cycle by temperature warming. The maximum decrease is about 50%, while the maximum increase can be up to 450% relative to the baseline period. The projected changes in the ensemble mean snow depth mainly occur over region 3 with a decreasing trend. The maximum snow depth reduction is projected over the Kunlun Mountains and the eastern part of the Qinghai–Tibet Plateau under RCP4.5 to RCP8.5 scenarios. The differences in projected snow depth changes between the two RCPs, however, are not noticeable, which can be explained by the fact that the relatively small degree of warming under RCP4.5 could lead to the most snow coverage melting over region 3. The projected snow depth changes range from −0.5 m to 0.1 m. Only several grids over the Himalayas Mountains and the upper stream of the Yarlung Zangbo River are projected with a slight increase in snow depth. This could be the result of model errors, because the winter precipitation is projected to decrease over these grids.
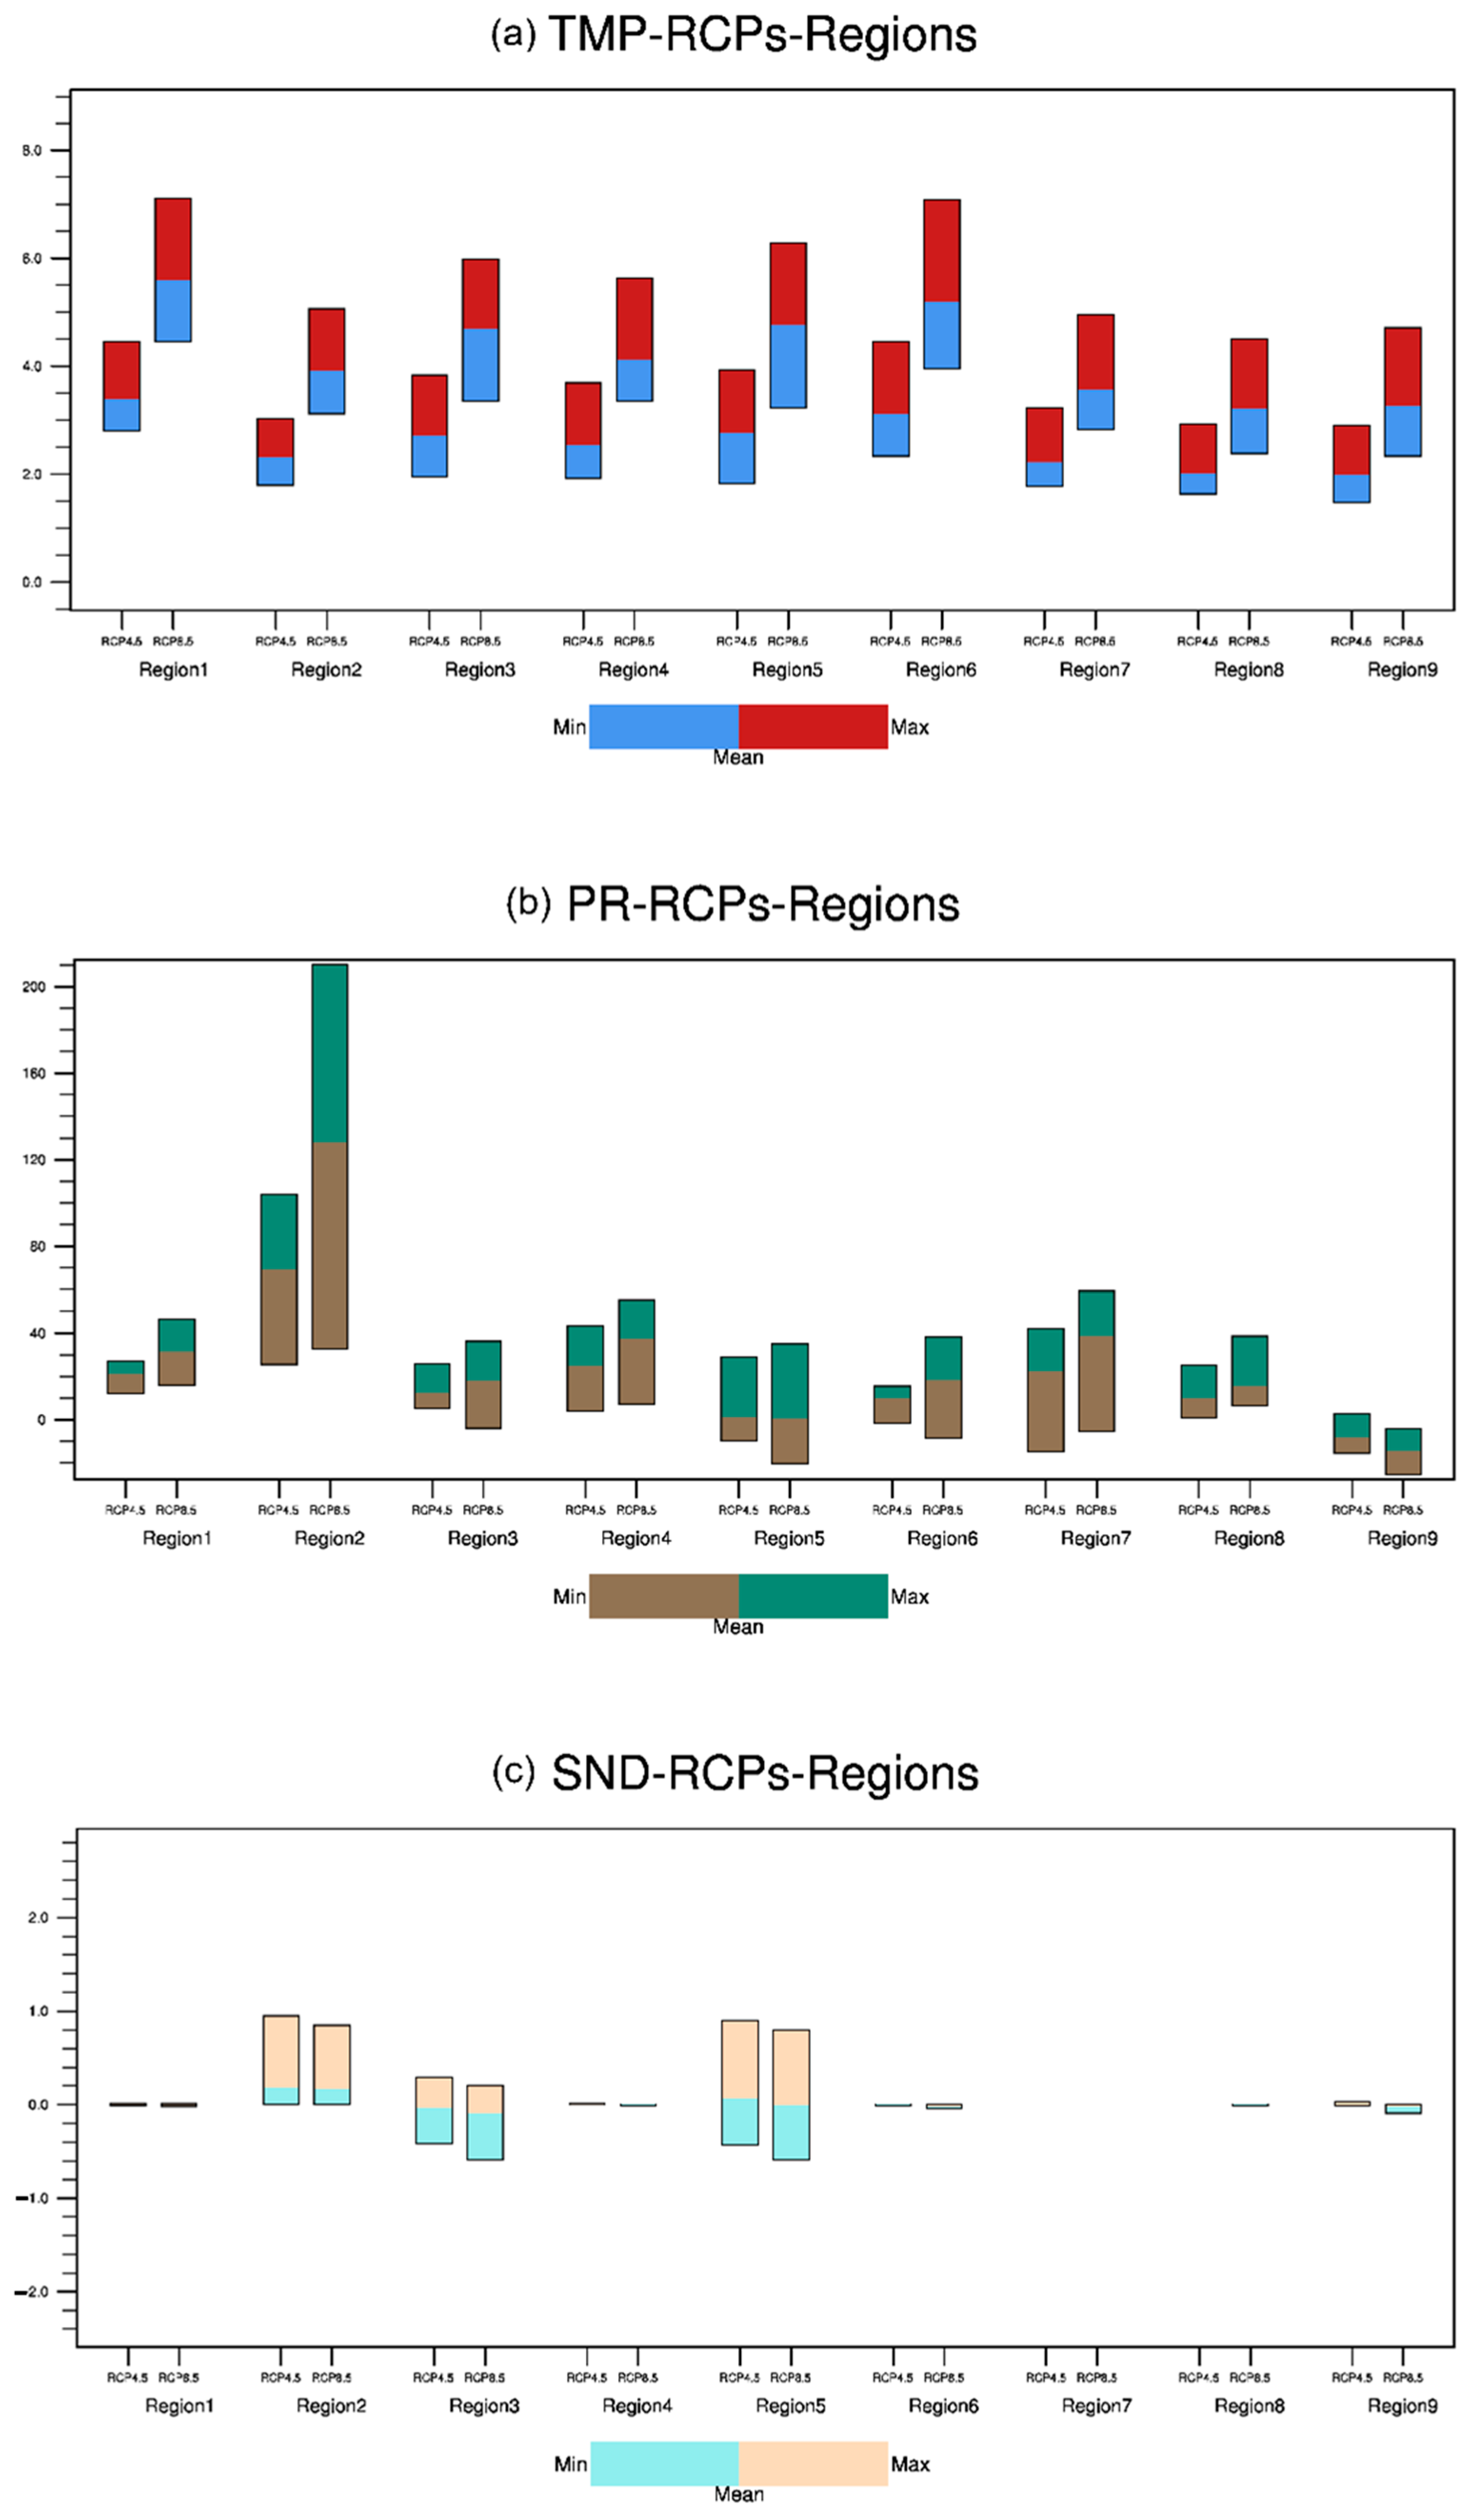
Figure 7 shows the ranges of projections for temperature warming, precipitation changes, and snow depth changes from the model ensemble under two RCP scenarios over the nine subregions. For each region, values for all grids are averaged to the whole area, and the minimum and maximum values projected by models are derived to explore the uncertainty residing in the model projections. The distribution of changes in temperature is relatively larger over regions 1, 3, 4, 5, and 6, which are either the high-altitude or the high-latitude areas under both RCPs. The snow and ice melting over these areas decreases the surface albedo and causes more solar energy absorbed over the regions. The range of temperature warming is from about 2.2 °C to 4.1 °C under RCP4.5 and from 3.4 °C to 5.6 °C under RCP8.5. The ranges of winter precipitation changes are more diverse than ranges of temperature warming because of the high complexity of precipitation simulation. Except over region 9, the ranges of projected precipitation change are larger under RCP8.5 than under RCP4.5 because of the amplification of the hydrological cycle by temperature warming. The ranges of regions 1, 2, and 9 are narrower than those for the remaining six regions under both RCPs, which means that model uncertainty for the three regions is smaller. The maximum decrease is about 20% over region 9 under RCP8.5, while the maximum increase can be up to 210% over region 2 under RCP8.5. Results indicate that the snow depth changes in regions 1, 4, 6, 7, 8, and 9 are relatively smaller than other regions and are smallest in region 7 under both RCPs. The projected largest range of changes in snow depth is found in region 5, with the second largest in region 2 and the third largest in region 3. The ranging magnitude is greater under RCP8.5 than under RCP4.5 for regions 3 and 5. However, the ranging magnitude is smaller under RCP8.5 than under RCP4.5 for region 2, which could be related to modeling errors. The Qinghai–Tibet Plateau is more sensitive to climate warming because of the positive feedback process of ice-snow melting over high-altitude areas.
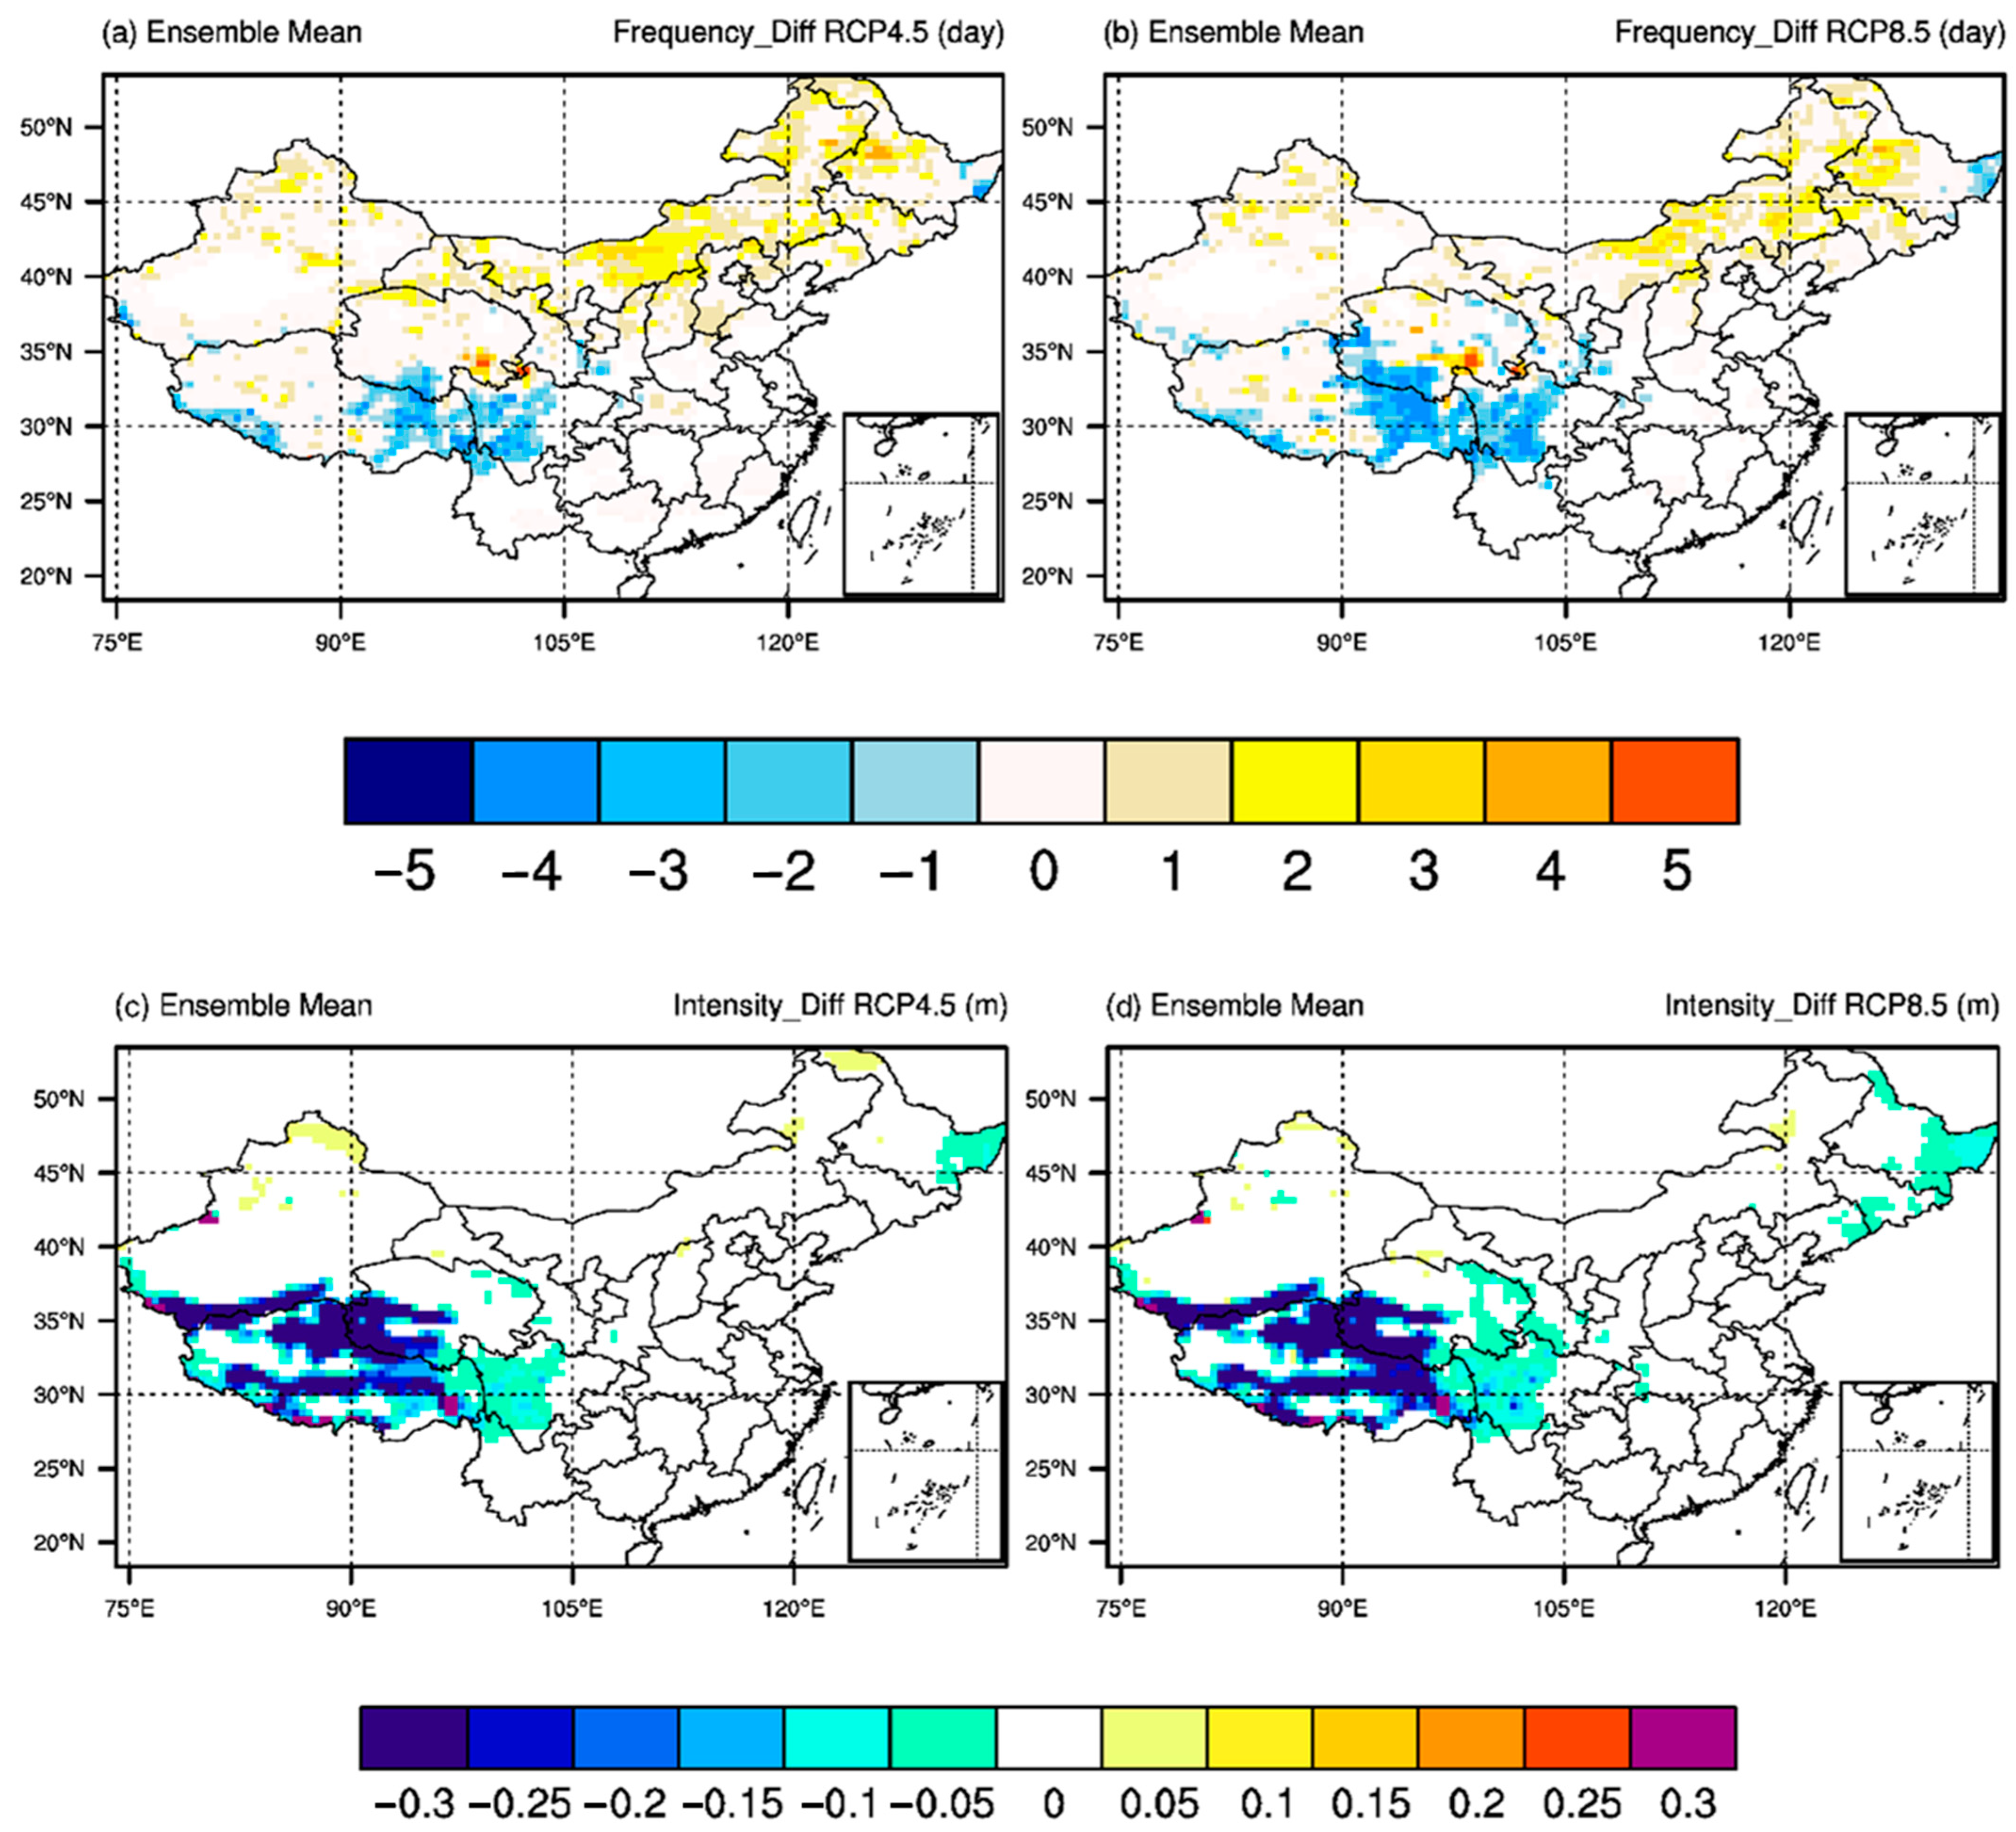
Projected changes in extreme snow events (50-year return period of maximum snow depth) are evaluated in terms of frequency and intensity changes under two RCPs for 2081–2100 relative to the baseline period. As shown in Figure 8, reductions in extreme snow events (up to 4 days per year) will occur in the eastern and northern parts of the Qinghai–Tibet Plateau in region 3 and northeastern parts of region 6. The difference between projected frequency changes in extreme snowfall events in China under RCP8.5 and RCP4.5 is that the reductions expand to larger areas with greater magnitudes. Fragmented increases in a frequency ranging from 1 day to 5 days per year are found over northern parts of the Qinghai–Tibet Plateau, the middle of the Northeast Plain, Inner Mongolia, the Greater Khingan Mountains, and the Tarim Basin, which are an important base for China’s agriculture and animal husbandry. Fragmented increases in frequency are expected to diminish to some extent when the radiative forcing goes up from RCP4.5 to RCP8.5. Under the RCP8.5 scenario, the areas with the frequency increase will shrink to the Greater Khingan Mountains, the eastern Inner Mongolia Plateau, the eastern Kunlun Mountains, and the Tarim Basin. As for changes in the intensities of extreme snow events, the ensemble of multiple models projects that there is a divergent trend over the north and west parts of China under both RCPs. A strongly decreasing trend (up to 0.3 m) of extreme snow intensity is found over the northeast of region 6 and most parts of regions 3 and 5. It should be noted that the slight increases in the extreme snow event over mountain areas in regions 2 and 6 could lead to the next spring’s floods caused by the snow melting. Therefore, the snow-melt-related flood origin in the mountains can put the farms and ranches downstream at great risk. Downstream of the Greater Khingan Mountains, Tianshan Mountains, and Altai Mountains is the main crop-planting, cotton-growing, and livestock-raising area, which is of great importance to the food safety of China.
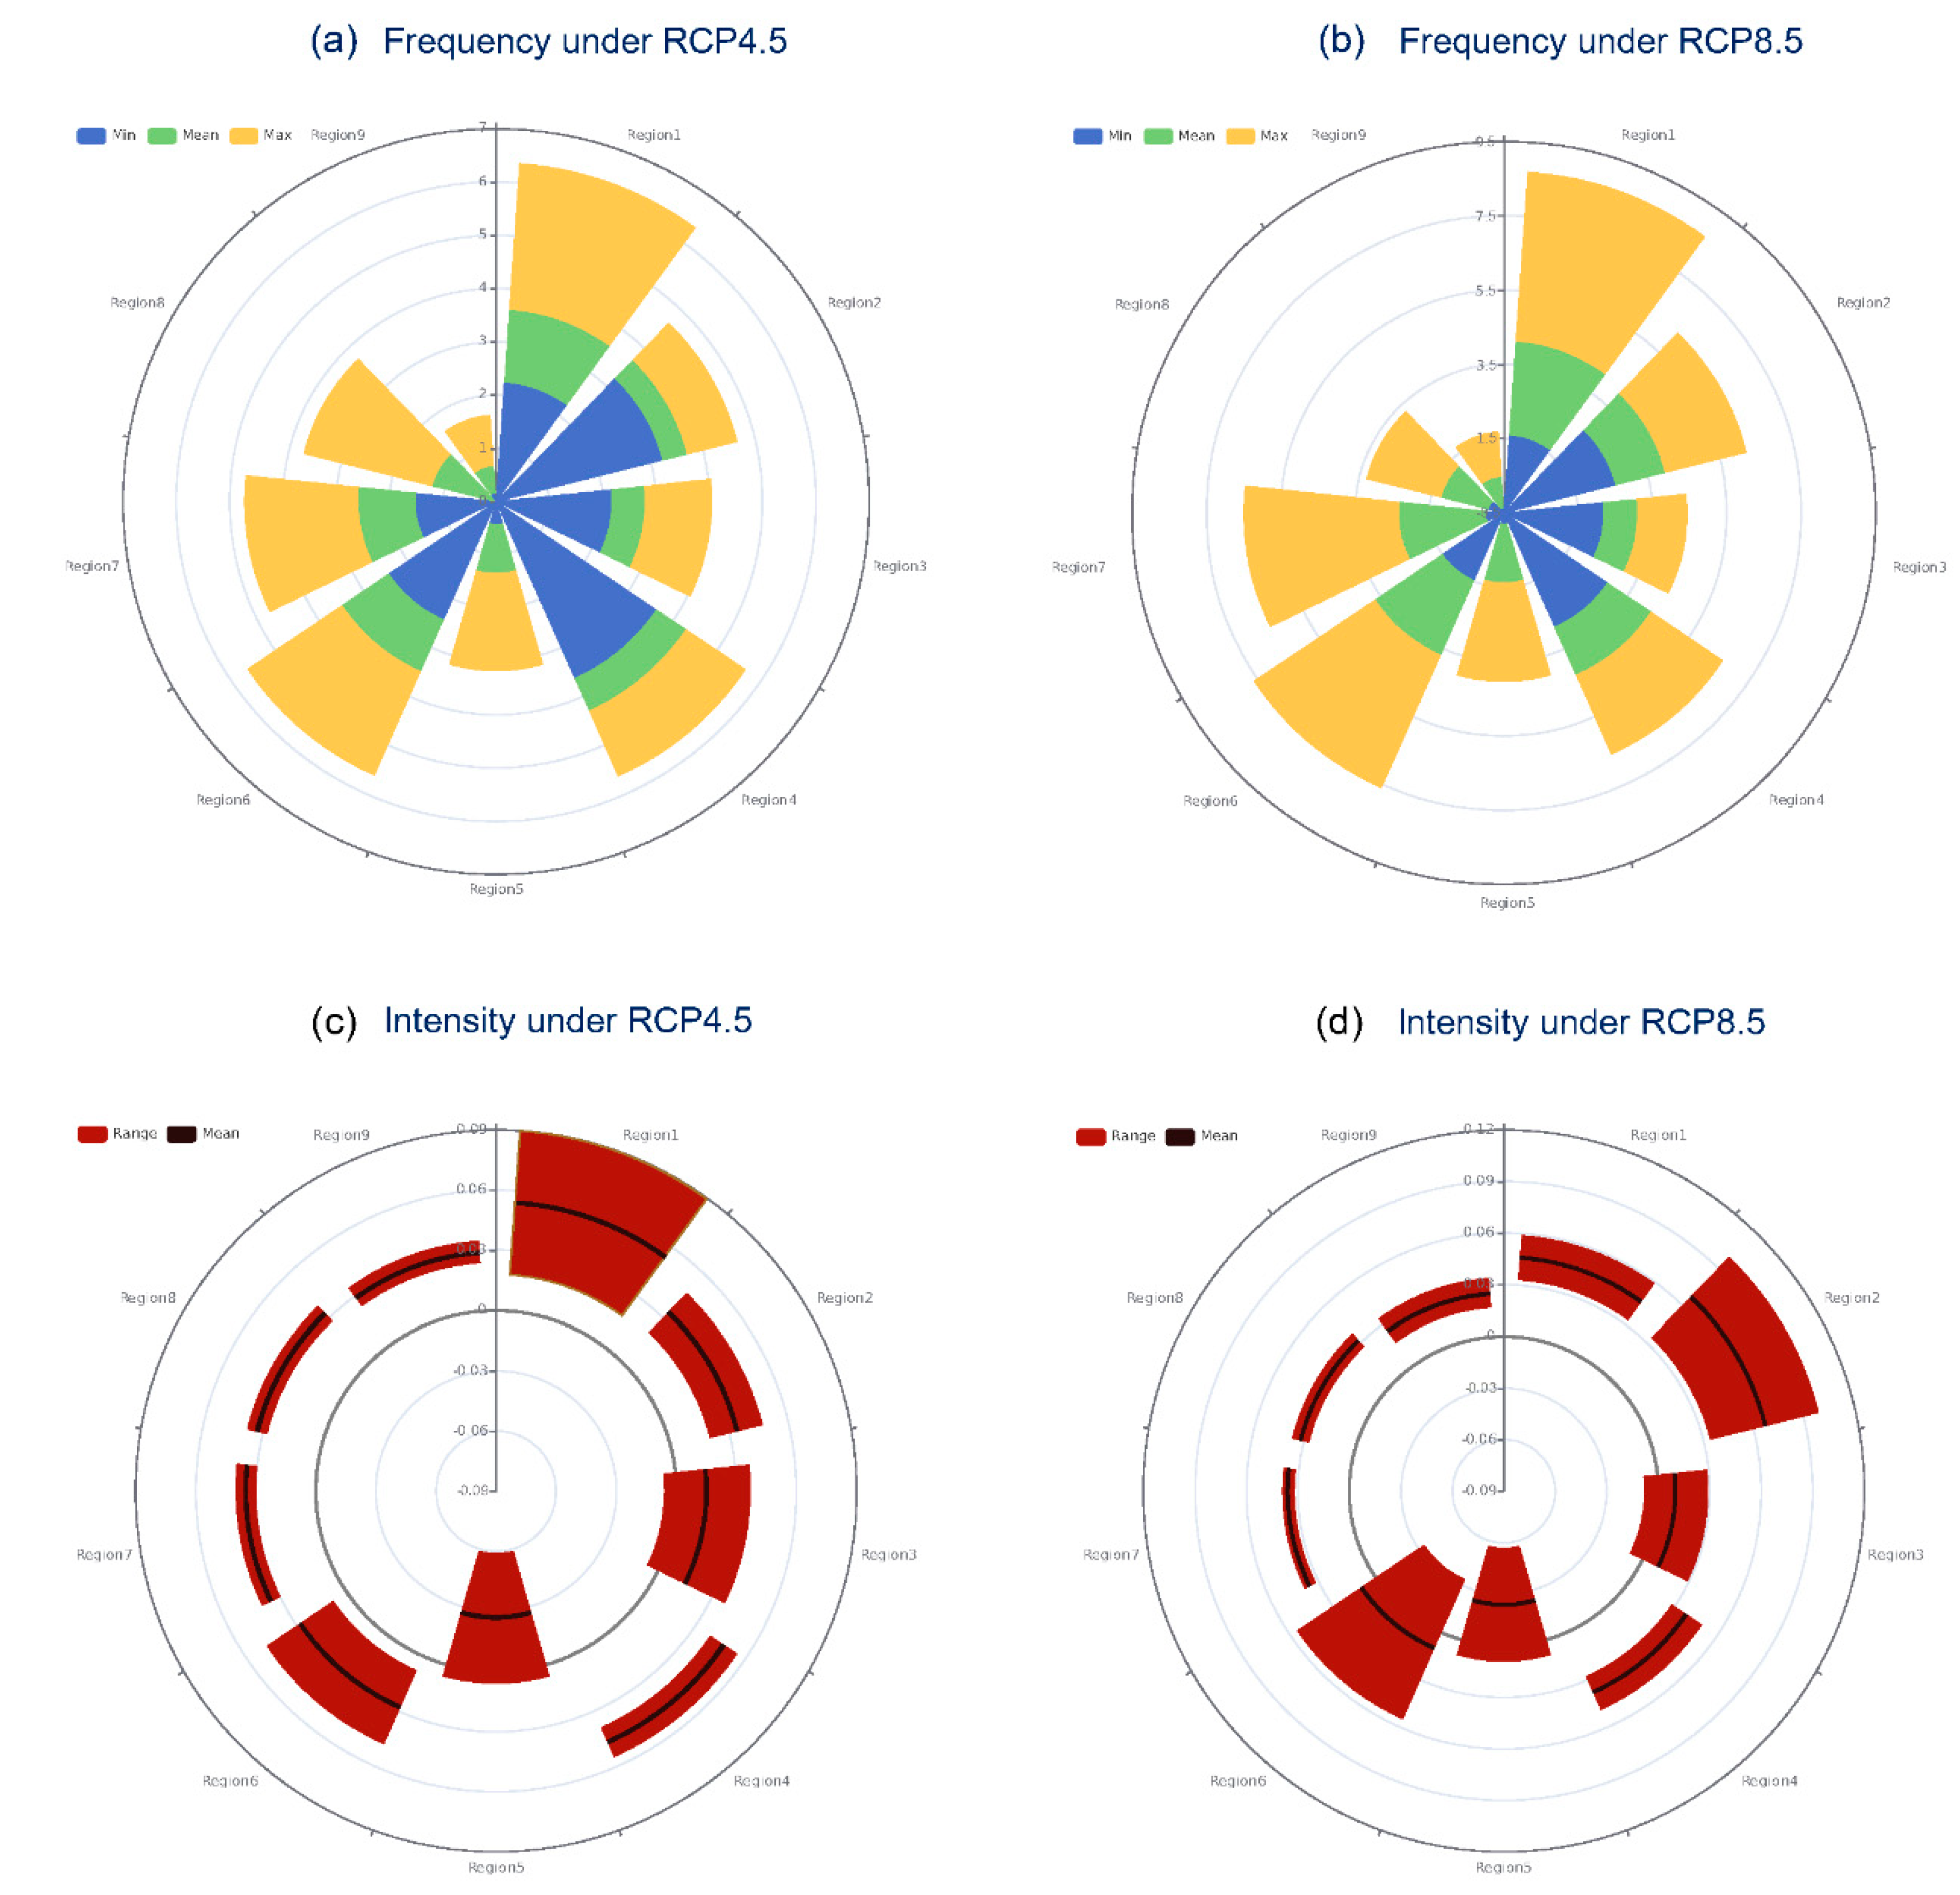
As shown in Figure 9, the frequency of extreme snow events is increasing in regions 1, 4, and 6 relative to the baseline period under RCP4.5 and RCP8.5. The increasing frequency ranges from 2.2 to 6.3 days for region 1, from 3.4 to 5.7 days for region 4, and 1.5 to 5.7 days for region 6 under RCP4.5. Under the RCP8.5 scenario, the range of changes in frequency is expanding over northeastern regions such as from 1.5 to 8.0 days for region 1, and from 1.5 to 7.5 days for region 6. However, the change in frequency is shrinking, and ranges from 2.0 to 6.1 days for region 4. The regions with more intensified snow events are regions 1, 2, 4, and 6 under both RCPs. Regions 3 and 5 have ensemble projections of change in intensity ranging from negative values to positive values. The largest changes in the intensity of extreme snow event range from 0.02 m to 0.09 m for region 1 under RCP4.5, and from 0.03 m to 0.10 m for region 2 under RCP8.5. Based on the ensemble projection results, both the intensity and frequency of extreme snow events are increasing in regions 1, 4, and 6, which are important agricultural and animal husbandry production areas in China. The reason behind this projection can be explained by the fact that the hydrological cycle intensified by temperature warming leads to excessive snowfall stacking up during winter. The changes in extreme snowfall events in the future will have a significant impact on China’s agricultural and animal husbandry production and threaten food security.

4. Discussions

Both extremes of daily liquid and solid precipitation are found to increase in intensity under climate change from observations and simulations [10,47]. Our findings are consistent with them in terms of the winter precipitation and snowfall. Extremes of seasonal mean snow depth have been studied previously [49], but daily snow extremes are found to respond differently. Extreme snowfall events would be expected to decrease in a warmer atmosphere. However, previous studies have already differed in their results as to whether extreme snowfall events are associated with anomalously cold or warm atmospheric situations [50,51]. Our results indicate that extreme snowfall events are expected to persist to some extent under climate warming. Based on ensemble simulations, it is found that snow extremes respond weaker to climate warming than mean snow depth does over most subregions in China. The simulated changes in extreme snow impact snow depth accumulated on surface and its related hazards. Multiday accumulated snow depth over 30 cm is considered sufficient to trigger avalanches in mountainous regions, whereas an accumulation of 60 cm snow depth can lead to potential damages on infrastructures, agriculture, and ecological systems [32]. Based on our findings, variations in extreme snowfall under climate change will lead to increased damaging snowstorms, which cause economic and environmental losses over China in the future.

5. Conclusions

This study uses an ensemble of high-resolution RCMs to investigate climate change impacts on snow depth and its related extremes. The simulation capabilities of different models in reproducing the basic climate variables over China in winter are gauged in terms of spatial and temporal patterns. The distribution characteristics of winter temperature, precipitation, and snow depth are then projected for 2081–2100 under RCP4.5 and RCP8.5. In particular, changes in the 50-year return period maximum snow depth are analyzed for 2081–2100 relative to 1985–2004. Results indicate that most models’ simulated spatial and temporal patterns are consistent with the observation in terms of the mean temperature, precipitation, and snow depth for the historical period. The IDMI and MCLM models show the highest performance of reproduction in temperature for all subregions. The remaining four models show similar spatial patterns of snow depth against the observation, except for overestimations over the Kunlun Mountains in region 3 and the Khingan Mountains in regions 1 and 6. We highlight that the shared driving GCM can contribute to similar patterns of snow depth, while the different RCM schemes lead to large variations in the snowfall accumulating on the land surface. Further, the same RCM scheme shared by the CCLM, HCLM, and MCLM models could also lead to large variations in magnitudes of snow depths. Compared to temperature and precipitation, the skill of RCM in the reproduction of snow depth is affected by both its driving GCM and RCM model scheme.
The projected changes in temperature are the largest over the high-altitude and high-latitude areas in west and northeast China under both RCPs. This can be explained by the polar amplification effect that the snow and ice melted over these areas could trigger positive feedback on the climate system. The warming magnitude is larger under a higher emission scenario (~2.5 °C greater under RCP8.5 than RCP4.5). The distribution of ensemble mean winter precipitation changes is more fragmented because of the relatively low skill in reproducing water-related content in the climate system. The projected precipitation change is larger under RCP8.5 than under RCP4.5 due to the amplification of the hydrological cycle by temperature warming. The projected snow depth changes range from −0.5 m to 0.1 m from 2081 to 2100 relative to the historical period. The difference between projected frequency changes in extreme snowfall events in China under RCP8.5 and RCP4.5 is that the reductions expand to larger areas with greater magnitudes. Both the intensity and frequency of extreme snow events are increasing in regions 1, 4, and 6, which are important agricultural and animal husbandry production areas in China. The reason behind this projection can be explained by the fact that the hydrological cycle intensified by temperature warming leads to excessive snowfall stacking up during winter. Variations in extreme snowfall under climate change could lead to increased damaging snow depths, which lead to potential damages on infrastructure, agriculture, and ecological systems in China.

Author Contributions

Conceptualization, J.Z.; Methodology, J.Z.; Validation, X.W.; Investigation, J.Z., X.W. and C.D.; Resources, B.G. and X.Z.; Data curation, B.G.; Writing—original draft, J.Z.; Writing—review & editing, X.Z. and C.D. All authors have read and agreed to the published version of the manuscript.

Funding

This study was supported by the Guangzhou Basic and Applied Basic Research Foundation (Grant No. 202201011403), the Fundamental Research Funds for the Central Universities-Sun Yat-Sen University (Grant No. 22qntd2001), and the Hong Kong Research Grants Council Early Career Scheme (Grant No. PP5Z).

Institutional Review Board Statement

Not applicable.

Informed Consent Statement

Not applicable.

Data Availability Statement

Data used in this paper are freely available at Mendeley Data (https://doi:10.17632/cxv42gzhrc.1, accessed on 7 February 2023).

Acknowledgments

We acknowledge and thank the climate modeling groups in the coordinated regional climate downscaling experiment for generating their model outputs and making them available.

Conflicts of Interest

The authors declare no conflict of interest.

References

  1. Jennings, K.S.; Molotch, N.P. Snowfall Fraction, Cold Content, and Energy Balance Changes Drive Differential Response to Simulated Warming in an Alpine and Subalpine Snowpack. Front. Earth Sci. 2020, 8, 186. [Google Scholar] [CrossRef]
  2. Beniston, M.; Keller, F.; Koffi, B.; Goyette, S. Estimates of snow accumulation and volume in the Swiss Alps under changing climatic conditions. Theor. Appl. Climatol. 2003, 76, 125–140. [Google Scholar] [CrossRef] [Green Version]
  3. Jennings, K.S.; Molotch, N.P. The sensitivity of modeled snow accumulation and melt to precipitation phase methods across a climatic gradient. Hydrol. Earth Syst. Sci. 2019, 23, 3765–3786. [Google Scholar] [CrossRef] [Green Version]
  4. Davenport, F.V.; Herrera-Estrada, J.E.; Burke, M.; Diffenbaugh, N.S. Flood Size Increases Nonlinearly Across the Western United States in Response to Lower Snow-Precipitation Ratios. Water Resour. Res. 2020, 56, e2019WR025571. [Google Scholar] [CrossRef] [Green Version]
  5. Tuel, A.; El Moçayd, N.; Hasnaoui, M.D.; Eltahir, E.A.B. Future projections of High Atlas snowpack and runoff under climate change. Hydrol. Earth Syst. Sci. 2022, 26, 571–588. [Google Scholar] [CrossRef]
  6. Ji, Z.; Kang, S. Projection of snow cover changes over China under RCP scenarios. Clim. Dyn. 2013, 41, 589–600. [Google Scholar] [CrossRef]
  7. Marty, C.; Blanchet, J. Long-term changes in annual maximum snow depth and snowfall in Switzerland based on extreme value statistics. Clim. Chang. 2012, 111, 705–721. [Google Scholar] [CrossRef] [Green Version]
  8. Krasting, J.P.; Broccoli, A.; Dixon, K.; Lanzante, J. Future Changes in Northern Hemisphere Snowfall. J. Clim. 2013, 26, 7813–7828. [Google Scholar] [CrossRef] [Green Version]
  9. Wu, X.; Che, T.; Li, X.; Wang, N.; Yang, X. Slower Snowmelt in Spring Along with Climate Warming Across the Northern Hemisphere. Geophys. Res. Lett. 2018, 45, 12331–12339. [Google Scholar] [CrossRef]
  10. Gorman, P.A.O. Contrasting responses of mean and extreme snowfall to climate change. Nature 2014, 512, 416–420. [Google Scholar] [CrossRef] [Green Version]
  11. López-Moreno, J.I.; Goyette, S.; Vicente-Serrano, S.M.; Beniston, M. Effects of climate change on the intensity and frequency of heavy snowfall events in the Pyrenees. Clim. Chang. 2011, 105, 489–508. [Google Scholar] [CrossRef]
  12. Wang, H.; Yu, E.; Yang, S. An exceptionally heavy snowfall in Northeast China large scale An exceptionally heavy snowfall in Northeast China: Large-scale circulation anomalies and hindcast of the NCAR WRF model. Meteorol. Atmos. Phys. 2011, 113, 11–25. [Google Scholar] [CrossRef] [Green Version]
  13. Lute, A.C.; Abatzoglou, J.T.; Hegewisch, K.C. Projected changes in snowfall extremes and interannual variability of snowfall in the western United States. Water Resour. Res. 2014, 51, 960–972. [Google Scholar] [CrossRef]
  14. Ghafarian, P.; Delju, A.H.; Tajbakhsh, S.; Penchah, M.M. Simulation of the role of Caspian Sea surface temperature and air temperature on precipitation intensity in lake-effect snow. J. Atmos. Sol. Terr. Phys. 2021, 225, 105777. [Google Scholar] [CrossRef]
  15. Liu, Y.; Guo, B.; Lu, M.; Zang, W.; Yu, T.; Chen, D. Quantitative distinction of the relative actions of climate change and human activities on vegetation evolution in the Yellow River Basin of China during 1981–2019. J. Arid. Land 2023, 15, 91–108. [Google Scholar] [CrossRef]
  16. Wilby, R.L. A Review of Climate Change impacts on the built environment. Built Environ. 2007, 33, 31–45. [Google Scholar] [CrossRef] [Green Version]
  17. Sturm, M.; Taras, B.; Liston, G.E.; Derksen, C.; Jonas, T.; Lea, J. Estimating Snow Water Equivalent Using Snow Depth Data and Climate Classes. J. Hydrometeorol. 2010, 11, 1380–1394. [Google Scholar] [CrossRef]
  18. CAN/CSA-S502-14; Managing Changing Snow Load Risks for Buildings in Canada’s North. CSA Group: Toronto, ON, Canada, 2014.
  19. Guo, B.; Yang, F.; Fan, Y.; Zang, W. The dominant driving factors of rocky desertification and their variations in typical mountainous karst areas of southwest China in the context of global change. Catena 2023, 220, 106674. [Google Scholar] [CrossRef]
  20. Liu, Y. An analysis of the changing characteristics of snowfall in the East Asia based on CMIP5. J. Glaciol. Geocryol. 2014, 6, 1345–1352. [Google Scholar]
  21. Gleason, K.E.; McConnell, J.R.; Arienzo, M.M.; Chellman, N.; Calvin, W.M. Four-fold increase in solar forcing on snow in western U.S. burned forests since 1999. Nat. Commun. 2019, 10, 2026. [Google Scholar] [CrossRef] [Green Version]
  22. Steger, C.; Kotlarski, S.; Jonas, T.; Schär, C. Alpine snow cover in a changing climate: A regional climate model perspective. Clim. Dyn. 2013, 41, 735–754. [Google Scholar] [CrossRef] [Green Version]
  23. De Vries, H.; Lenderink, G.; van Meijgaard, E. Future snowfall in western and central Europe projectedwith a high-resolution regional climate model ensemble. Geophys. Res. Lett. 2014, 41, 4294–4299. [Google Scholar] [CrossRef]
  24. Van Pelt, W.J.J.; Kohler, J.; Liston, G.E.; Hagen, J.O.; Luks, B.; Reijmer, C.H.; Pohjola, V.A. Multidecadal climate and seasonal snow conditions in Svalbard. J. Geophys. Res. Earth Surf. 2016, 121, 2100–2117. [Google Scholar] [CrossRef] [Green Version]
  25. Frei, P.; Kotlarski, S.; Liniger, M.A.; Schär, C. Future snowfall in the Alps: Projections based on the EURO-CORDEX regional climate models. Cryosphere 2018, 12, 1–24. [Google Scholar] [CrossRef] [Green Version]
  26. Krinner, G.; Derksen, C.; Essery, R.; Flanner, M.; Hagemann, S.; Clark, M.; Hall, A.; Rott, H.; Brutel-Vuilmet, C.; Kim, H.; et al. ESM-SnowMIP: Assessing snow models and quantifying snow-related climate feedbacks. Geosci. Model Dev. 2018, 11, 5027–5049. [Google Scholar] [CrossRef] [Green Version]
  27. Le Roux, E.; Evin, G.; Eckert, N.; Blanchet, J.; Morin, S. Elevation-dependent trends in extreme snowfall in the French Alps from 1959 to 2019. Cryosphere 2021, 15, 4335–4356. [Google Scholar] [CrossRef]
  28. Tuel, A.; Chehbouni, A.; Eltahir, E.A.B. Dynamics of seasonal snowpack over the High Atlas. J. Hydrol. 2021, 595, 125657. [Google Scholar] [CrossRef]
  29. Marty, C.; Schlögl, S.; Bavay, M.; Lehning, M. How much can we save? Impact of different emission scenarios on future snow cover in the Alps. Cryosphere 2017, 11, 517–529. [Google Scholar] [CrossRef] [Green Version]
  30. Le Roux, E.; Evin, G.; Eckert, N.; Blanchet, J.; Morin, S. Non-stationary extreme value analysis of ground snow loads in the French Alps: A comparison with building standards. Nat. Hazards Earth Syst. Sci. 2020, 20, 2961–2977. [Google Scholar] [CrossRef]
  31. Bonsoms, J.; Gonzalez, S.; Prohom, M.; Esteban, P.; Salvador-Franch, F.; López-Moreno, J.I.; Oliva, M. Spatio-temporal patterns of snow in the Catalan Pyrenees (NE Iberia). Int. J. Climatol. 2021, 41, 5676–5697. [Google Scholar] [CrossRef]
  32. López-Moreno, J.I.; Soubeyroux, J.M.; Gascoin, S.; Alonso-Gonzalez, E.; Durán-Gómez, N.; Lafaysse, M.; Vernay, M.; Carmagnola, C.; Morin, S. Long-term trends (1958–2017) in snow cover duration and depth in the Pyrenees. Int. J. Climatol. 2020, 40, 6122–6136. [Google Scholar] [CrossRef]
  33. Buisan, S.T.; López-Moreno, J.; Saz, M.; Kochendorfer, J. Impact of weather type variability on winter precipitation, temperature and annual snowpack in the Spanish Pyrenees. Clim. Res. 2016, 69, 79–92. [Google Scholar] [CrossRef]
  34. Faranda, D. An attempt to explain recent changes in European snowfall extremes. Weather Clim. Dyn. 2020, 1, 445–458. [Google Scholar] [CrossRef]
  35. Günther, D.; Marke, T.; Essery, R.; Strasser, U. Uncertainties in Snowpack Simulations—Assessing the Impact of Model Structure, Parameter Choice, and Forcing Data Error on Point-Scale Energy Balance Snow Model Performance. Water Resour. Res. 2019, 55, 2779–2800. [Google Scholar] [CrossRef] [Green Version]
  36. Yılmaz, Y.A.; Aalstad, K.; Sen, O.L. Multiple Remotely Sensed Lines of Evidence for a Depleting Seasonal Snowpack in the Near East. Remote Sens. 2019, 11, 483. [Google Scholar] [CrossRef] [Green Version]
  37. Suzuki, K.; Zupanski, M. Uncertainty in solid precipitation and snow depth prediction for Siberia using the Noah and Noah-MP land surface models. Front. Earth Sci. 2018, 12, 672–682. [Google Scholar] [CrossRef]
  38. Musselman, K.N.; Clark, M.P.; Liu, C.; Ikeda, K.; Rasmussen, R. Slower snowmelt in a warmer world. Nat. Clim. Chang. 2017, 7, 214–219. [Google Scholar] [CrossRef]
  39. Alonso-González, E.; Gutmann, E.; Aalstad, K.; Fayad, A.; Bouchet, M.; Gascoin, S. Snowpack dynamics in the Lebanese mountains from quasi-dynamically downscaled ERA5 reanalysis updated by assimilating remotely sensed fractional snow-covered area. Hydrol. Earth Syst. Sci. 2021, 25, 4455–4471. [Google Scholar] [CrossRef]
  40. Alonso-González, E.; Gutmann, E.; Aalstad, K.; Fayad, A.; Bouchet, M.; Gascoin, S. Impact of North Atlantic Oscillation on the Snowpack in Iberian Peninsula Mountains. Water 2020, 12, 105. [Google Scholar] [CrossRef]
  41. Alonso-González, E.; López-Moreno, J.I.; Navarro-Serrano, F.M.; Revuelto, J. Snow climatology for the mountains in the Iberian Peninsula using satellite imagery and simulations with dynamically downscaled reanalysis data. Int. J. Climatol. 2020, 40, 477–491. [Google Scholar] [CrossRef]
  42. Zhang, B.; Wang, S.; Zhu, J. A weighted ensemble of regional climate projections for exploring the spatiotemporal evolution of multidimensional drought risks in a changing climate. Clim. Dyn. 2022, 58, 49–68. [Google Scholar] [CrossRef]
  43. Deser, C.; Phillips, A.; Bourdette, V.; Teng, H. Uncertainty in climate change projections: The role of internal variability. Clim. Dyn. 2012, 38, 527–546. [Google Scholar] [CrossRef] [Green Version]
  44. Giorgi, F. Introduction to the special issue: The phase I CORDEX RegCM4 hyper-matrix (CREMA) experiment. Clim. Chang. 2014, 125, 1–5. [Google Scholar] [CrossRef] [Green Version]
  45. Giorgi, F. Changes in extremes and hydroclimatic regimes in the CREMA ensemble projections. Clim. Chang. 2014, 125, 39–51. [Google Scholar] [CrossRef]
  46. Yatagai, A.; Maeda, M.; Khadgarai, S.; Masuda, M.; Xie, P. End of the Day (EOD) Judgment for Daily Rain-Gauge Data. Atmosphere 2020, 11, 772. [Google Scholar] [CrossRef]
  47. Min, S.; Zhang, X.; Zwiers, F.W.; Hegerl, G.C. Human contribution to more-intense precipitation extremes. Nature 2011, 470, 378–381. [Google Scholar] [CrossRef]
  48. Ma, Q.; Keyimu, M.; Li, X.; Wu, S.; Zeng, F.; Lin, L. Climate and elevation control snow depth and snow phenology on the Tibetan Plateau. J. Hydrol. 2023, 617, 128938. [Google Scholar] [CrossRef]
  49. Diffenbaugh, N.S.; Scherer, M.; Ashfaq, M. Response of snow-dependent hydrologic extremes to continued global warming. Nat. Clim. Chang. 2013, 3, 379–384. [Google Scholar] [CrossRef] [Green Version]
  50. Kunkel, K.E.; Karl, T.R.; Brooks, H.; Kossin, J.; Lawrimore, J.H.; Arndt, D.; Bosart, L.F.; Changnon, D.; Cutter, S.; Doesken, N.J.; et al. Monitoring and Understanding Trends in Extreme Storms: State of Knowledge. Bull. Am. Meteorol. Soc. 2013, 94, 499–514. [Google Scholar] [CrossRef]
  51. Kodra, E.; Steinhaeuser, K.; Ganguly, A.R. Persisting cold extremes under 21st-century warming scenarios. Geophys. Res. Lett. 2011, 38. [Google Scholar] [CrossRef] [Green Version]
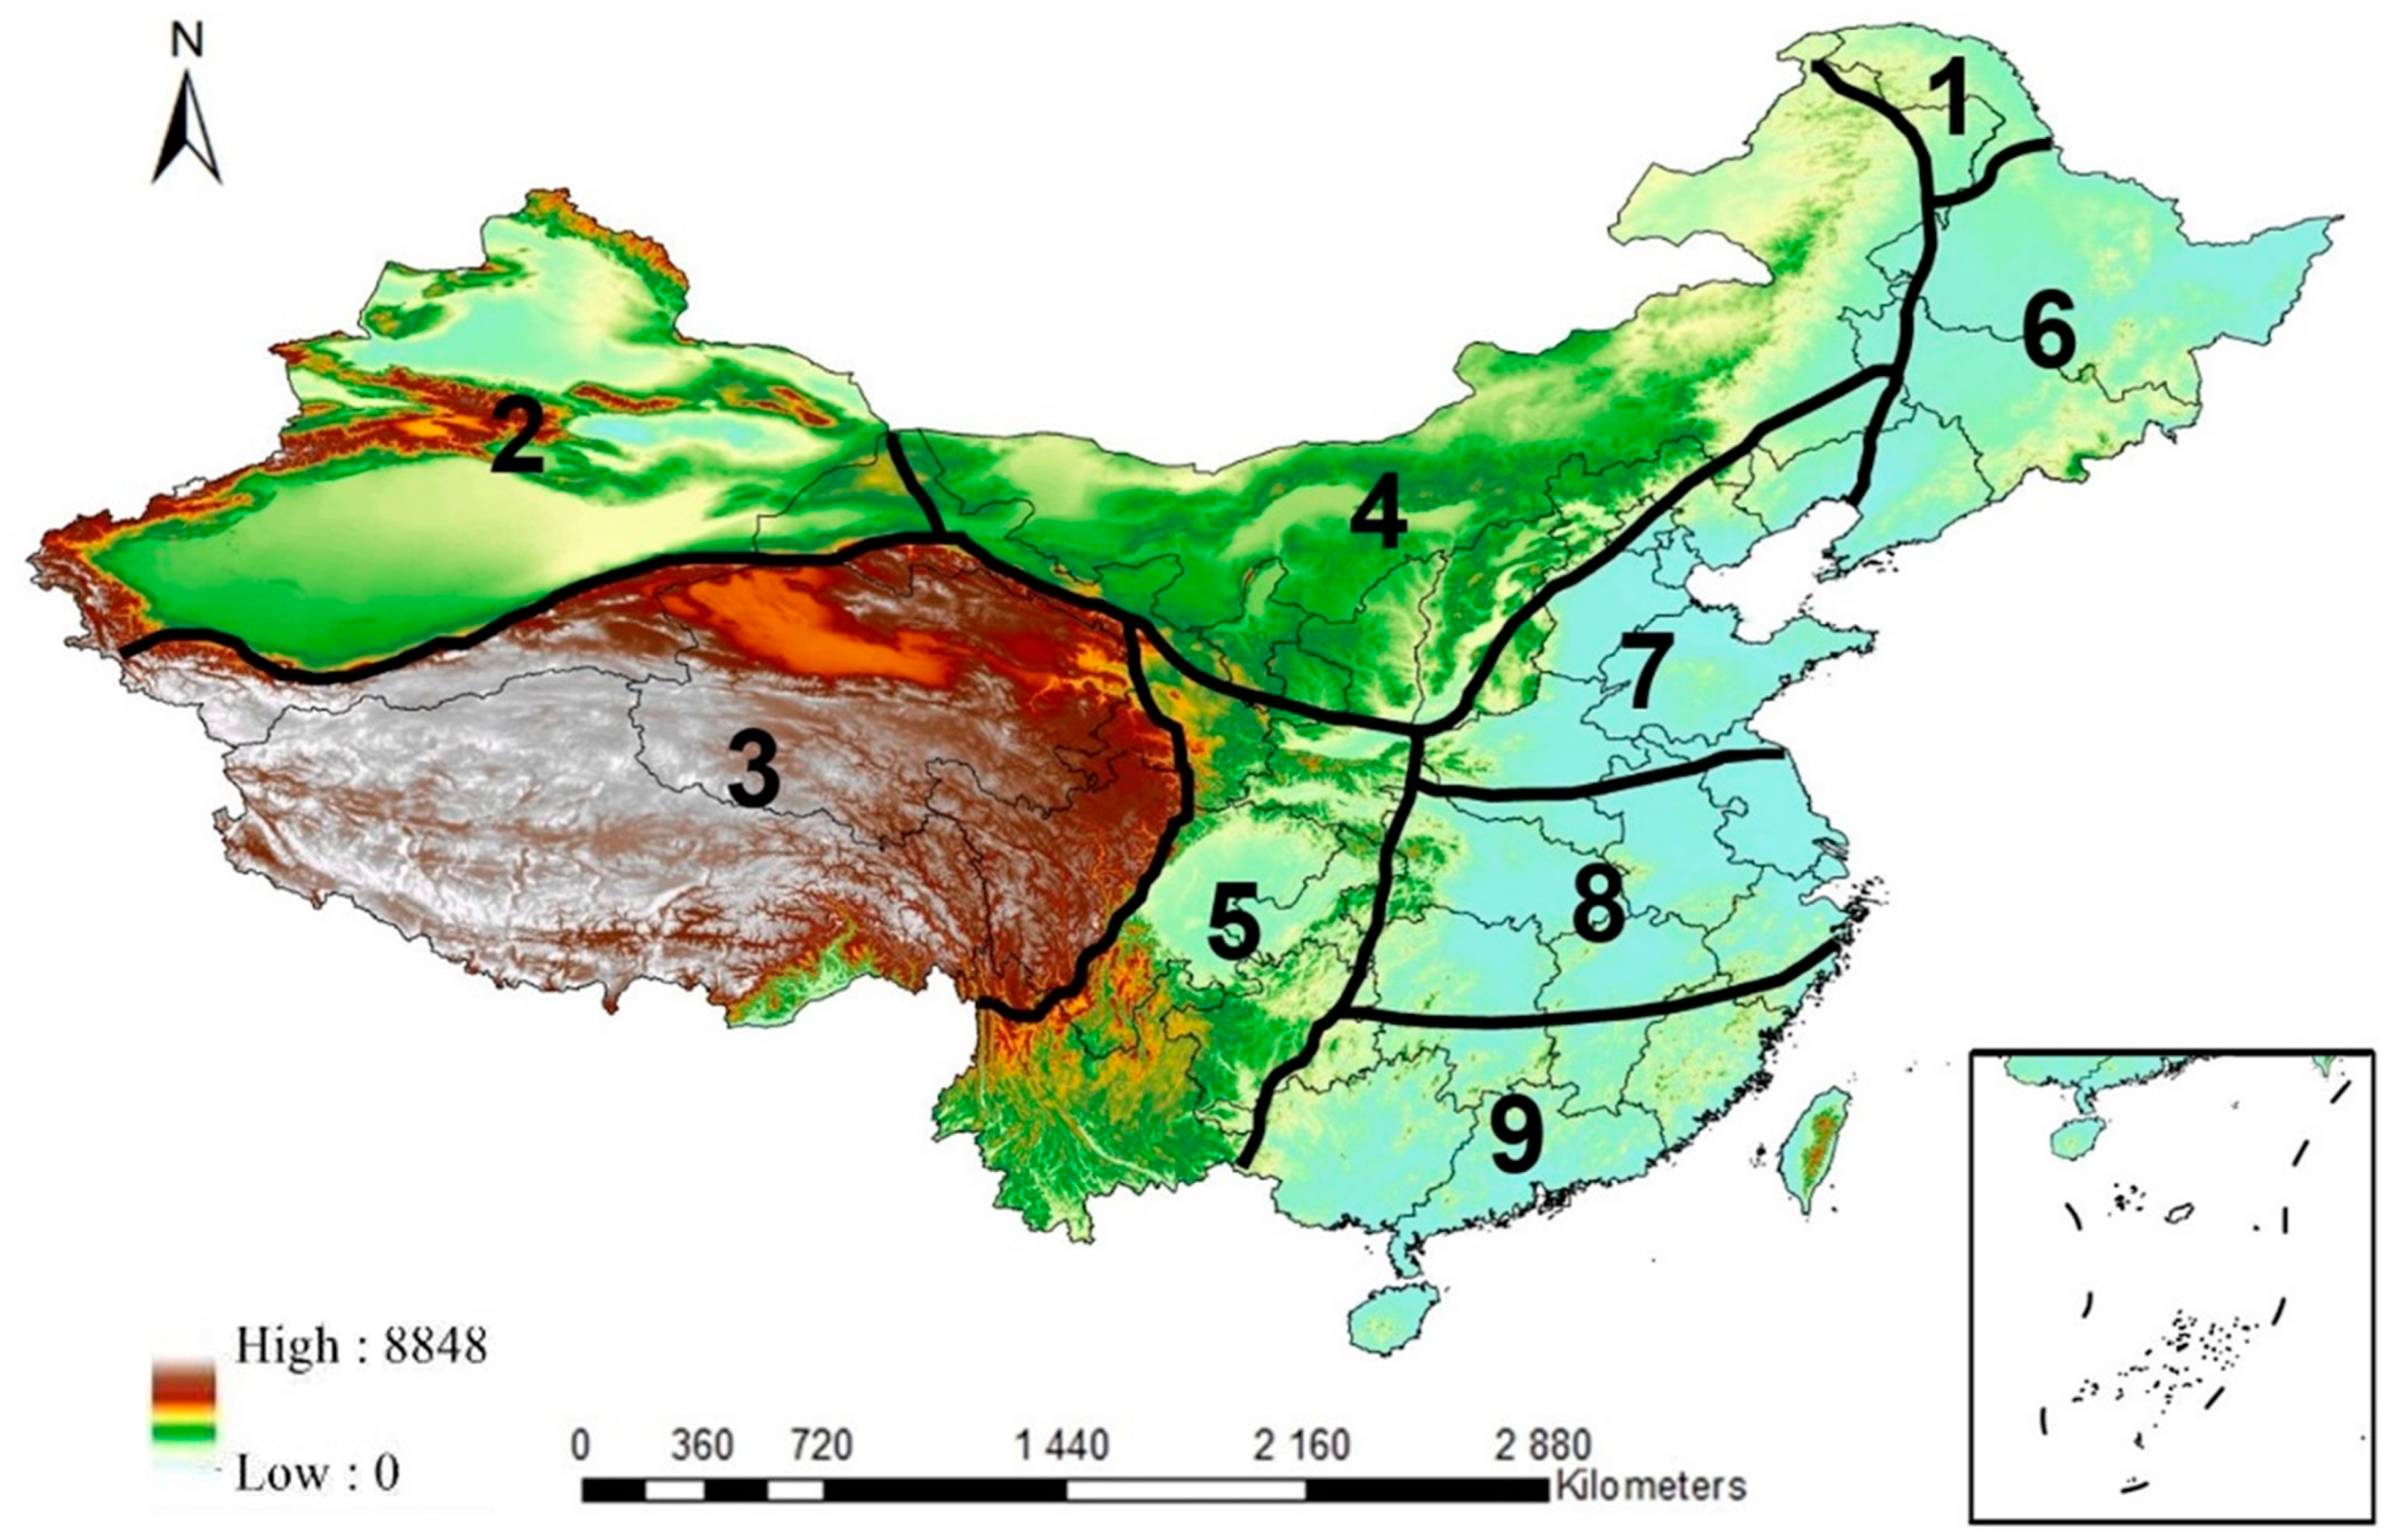
Figure 1. Nine subregions are delineated based on temperature and humidity differences.
Sustainability 15 03878 g001
Figure 2. Averaged 2 m air temperature (Dec–Jan–Feb) simulated by five models validating against observational data for the reference period (TMP_Hist, unit: °C).
Sustainability 15 03878 g002
Figure 3. Averaged winter precipitation (PR_Hist, unit: mm/day) simulated by five models validating against observational data for the reference period.
Sustainability 15 03878 g003
Figure 4. Averaged winter snow depth (SND_Hist, unit: m) simulated by five models validating against observational data for the reference period.
Sustainability 15 03878 g004
Figure 5. Taylor diagrams for comparing five models and observational data in terms of spatial and temporal patterns of winter air temperature, precipitation, and snow depth.
Sustainability 15 03878 g005
Figure 6. Projections of ensemble mean air temperature warming (TMP_diff, unit: °C), winter precipitation changes (PR_diff, unit: mm/day), and snow depth changes (SND_diff, unit: m) under RCP4.5 and RCP8.5.
Sustainability 15 03878 g006
Figure 7. Ensemble ranges of air temperature warming, precipitation changes, and snow depth change for 9 subregions under two RCPs.
Sustainability 15 03878 g007
Figure 8. Projections of ensemble mean extreme snow (50-year return period) frequency and intensity changes under RCP4.5 and RCP8.5.
Sustainability 15 03878 g008
Figure 9. Ensemble ranges of extreme snow frequency and intensity changes for 9 subregions under two RCPs.
Sustainability 15 03878 g009
Table 1. Details of the RCMs used to simulate and project concerning climate variables.
RCMsResolutionsInstitutesDriving GCMs Abbreviations
CLMcom-CCLM5-0-20.5° × 0.5°The Climate Limited-area Modeling CommunityCNRM-CERFACS-CNRM-CM5CCLM
0.5° × 0.5°HadGEM2-ESHCLM
0.5° × 0.5°MPI-M-MPI-ESM-LRMCLM
DMI-HIRHAM50.5° × 0.5°Danish Meteorological InstituteICHEC-EC-EARTHIDMI
PRECIS0.5° × 0.5°Met Office Hadley CentreHadGEM2-ESPREC
Disclaimer/Publisher’s Note: The statements, opinions and data contained in all publications are solely those of the individual author(s) and contributor(s) and not of MDPI and/or the editor(s). MDPI and/or the editor(s) disclaim responsibility for any injury to people or property resulting from any ideas, methods, instructions or products referred to in the content.