

Method for Unloading Zonation Based on Strain per Unit Crack: Case Study of a Large-Scale Rocky Slope on the Qinghai–Tibet Plateau


Abstract
1. Introduction
2. Study Area
2.1. Geological Setting
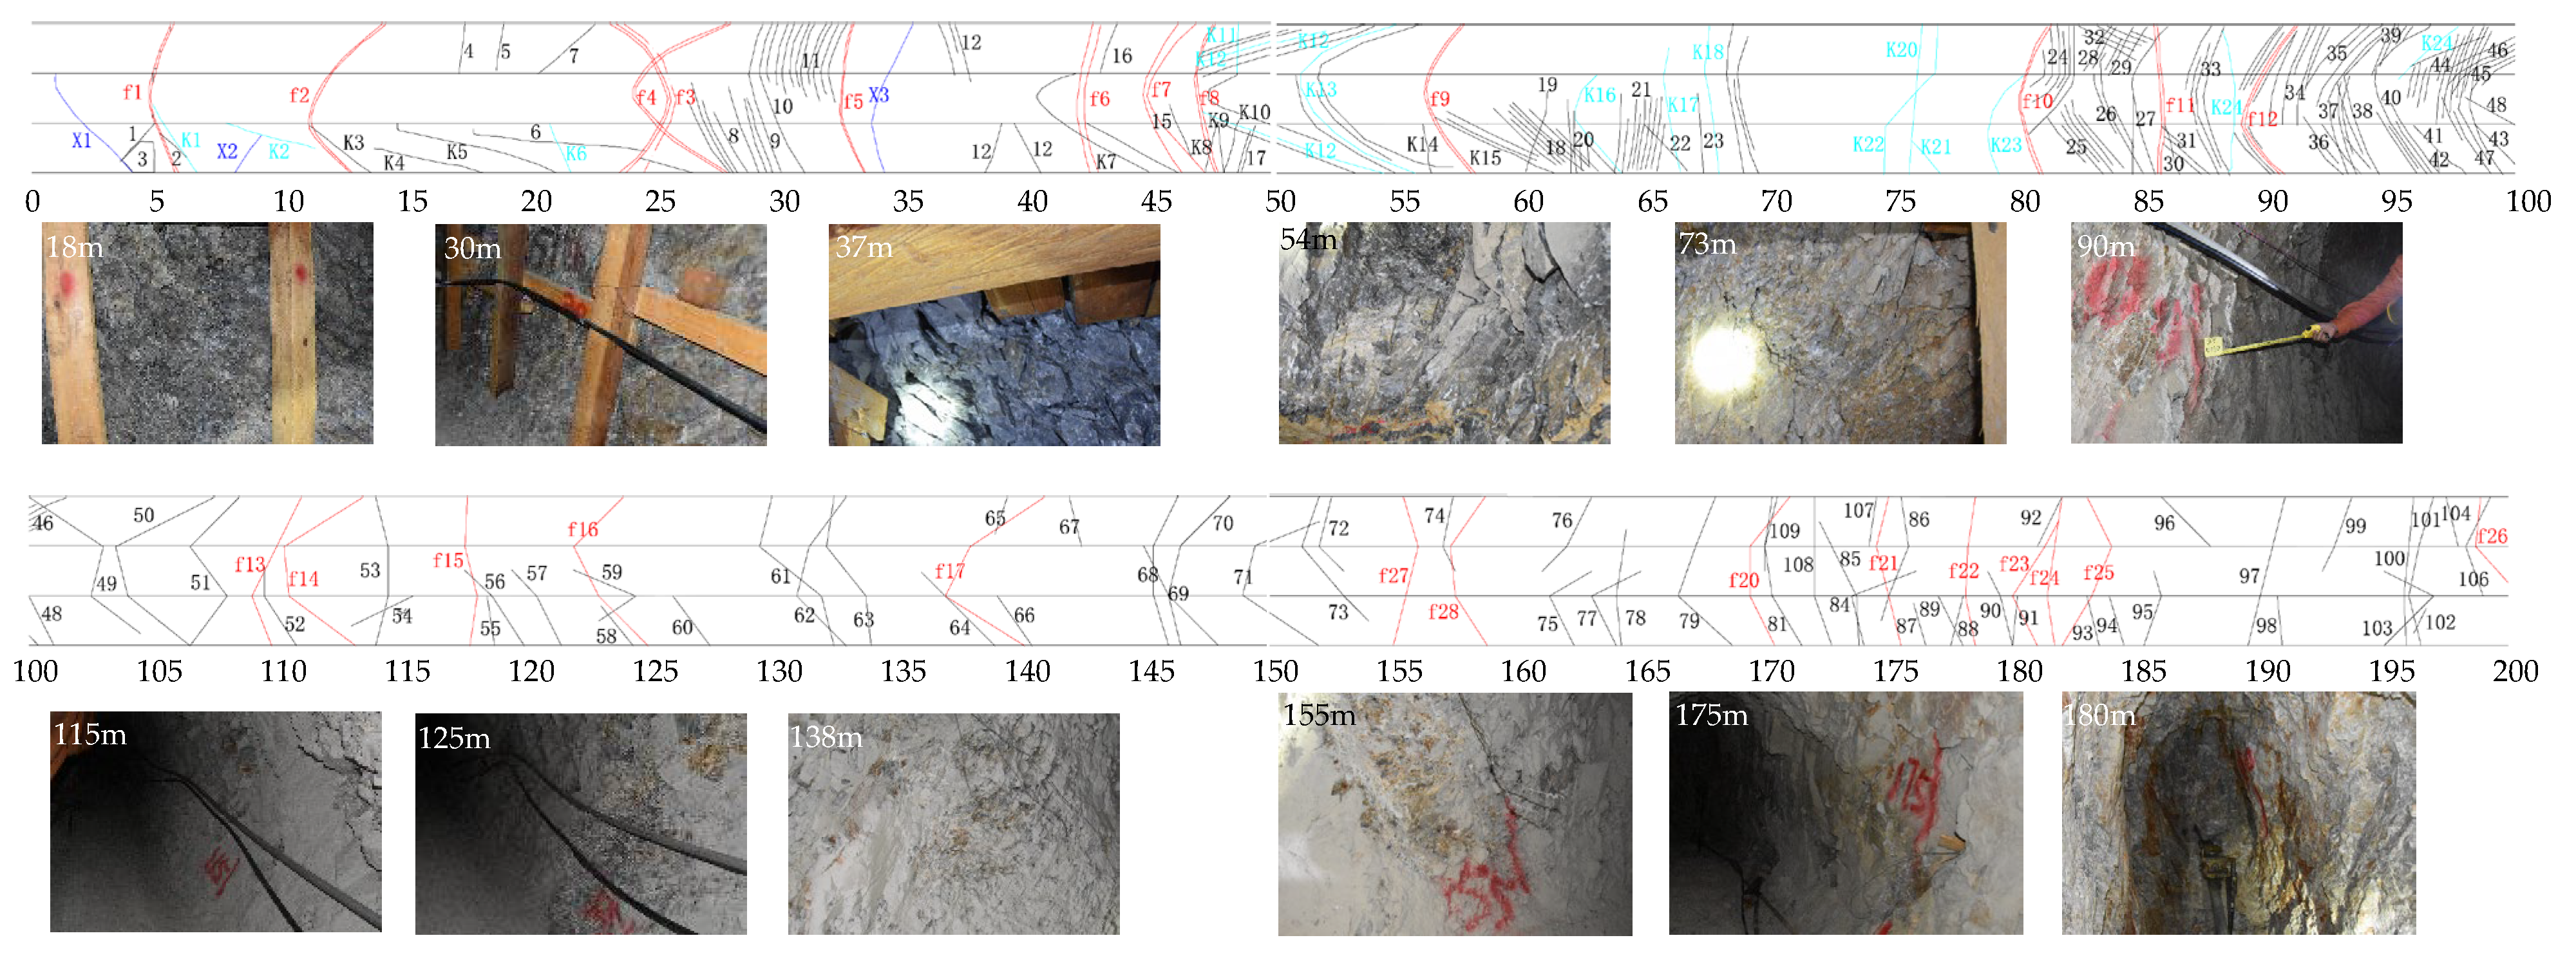
2.2. Field Investigation
3. Methods
4. Results and Comparison
5. Verification
6. Discussion and Perspective
6.1. Unloading Zonation Method
6.2. Unloading and Slope Evolution
7. Conclusions
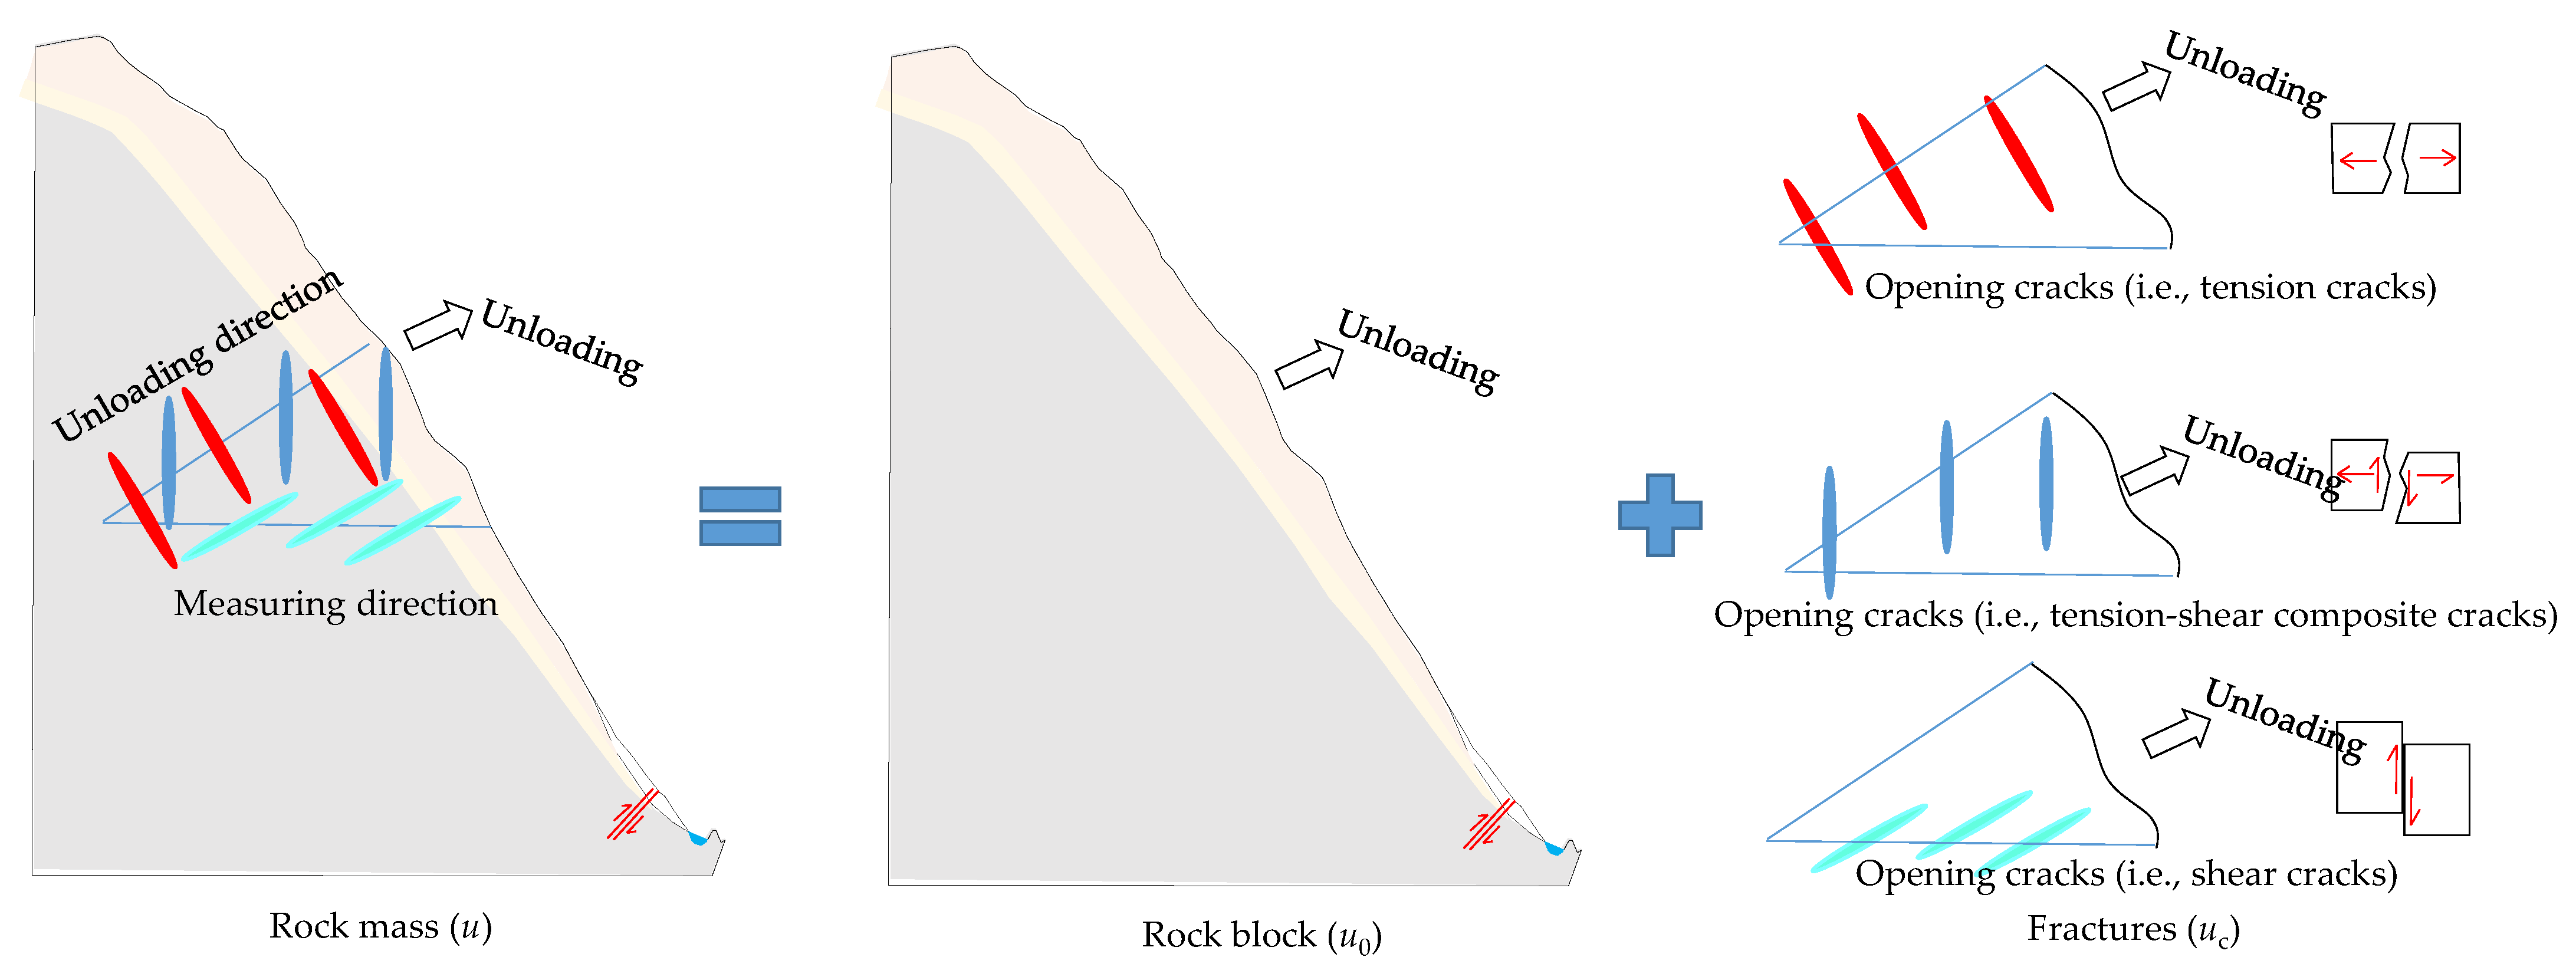
- Considering that unloading is the process of energy release, elastic deformation and strain failure are the essences of the unloading process of the rock mass and rebound loosening of existing cracks; shear dislocation of existing cracks and new cracks of rock mass are the physical phenomena of unloading. A method of dividing the unloading zone, SPUC, is proposed based on statistical rock mass mechanics and damage mechanics.
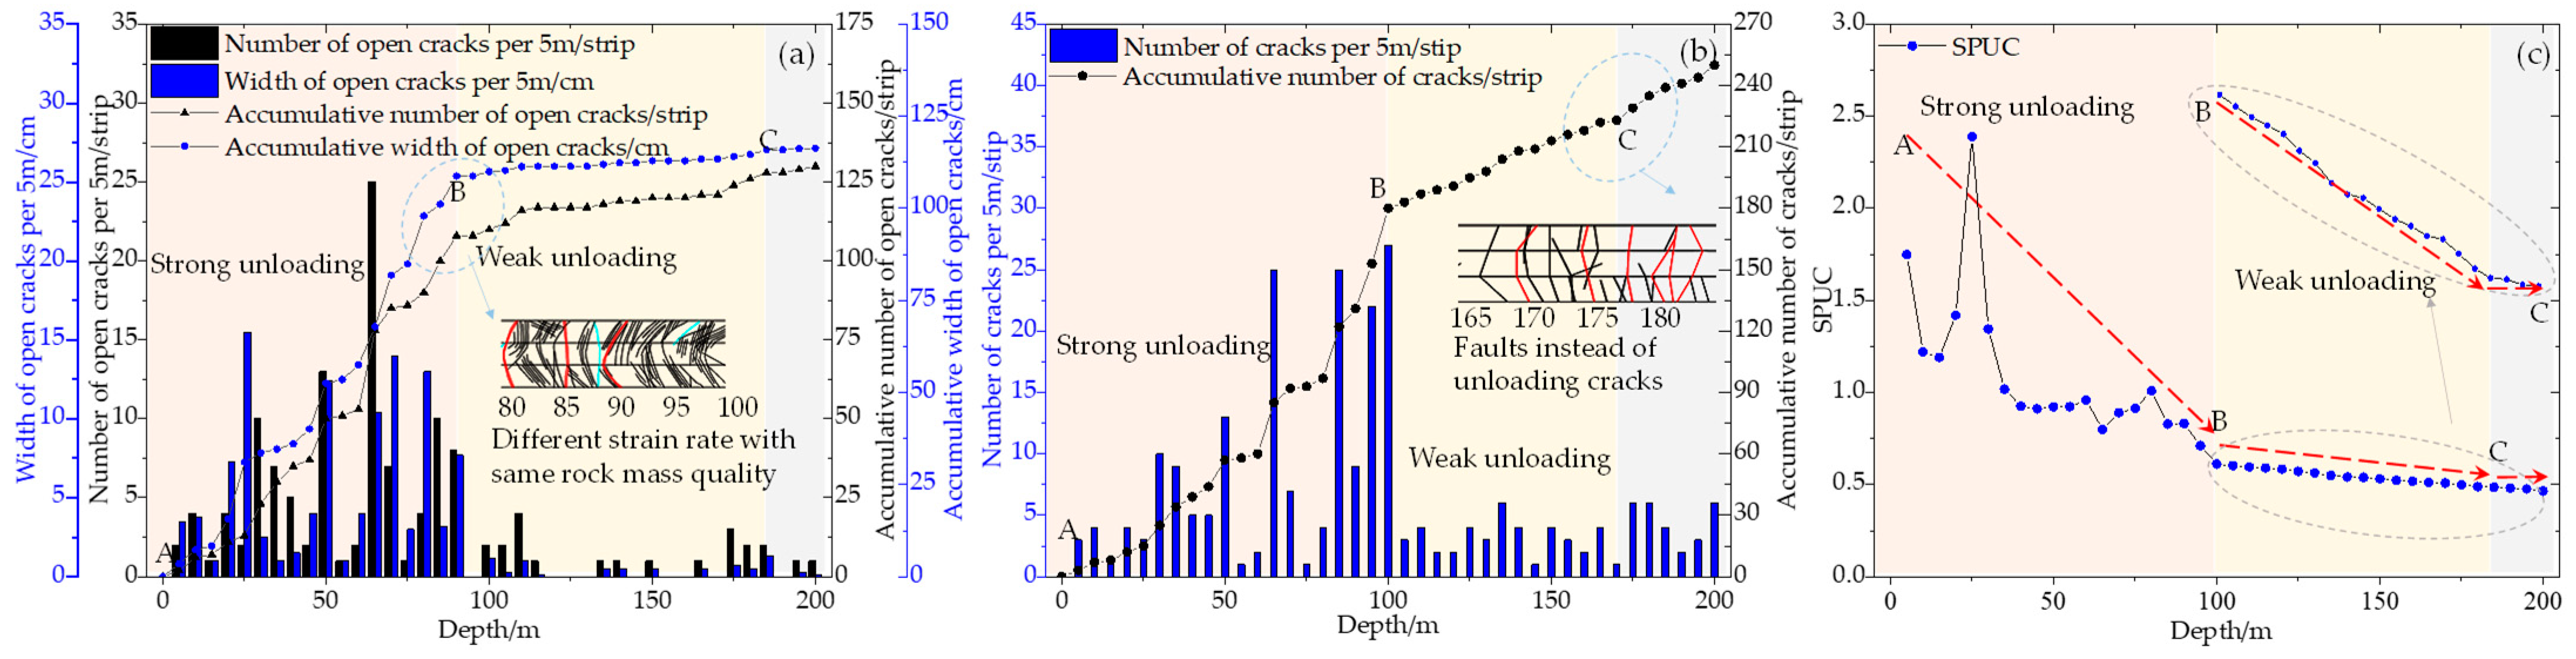
- The Δh–SPUC curve regularly varies and can be divided into three parts according to the slopes of the curve. The slope unloading zone can be divided into strong and weak unloading zones. The extent of the strong and weak unloading zones can be determined by the two inflexions of the curve.
- The unloading zonation method of SPUC is applied to a controlled slope of a railway, and a series of conventional unloading zone division methods are used for verification. The results show that the method is feasible and accurate, its physical meaning is clear, and it can compensate for the defect of using any single method.
Author Contributions
Funding
Institutional Review Board Statement
Informed Consent Statement
Data Availability Statement
Acknowledgments
Conflicts of Interest
References
- Ding, L.; Qasim, M.; Jadoon, I.A.; Khan, M.A.; Xu, Q.; Cai, F.; Wang, H.; Baral, U.; Yue, Y. The India–Asia collision in north Pakistan: Insight from the U–Pb detrital zircon provenance of Cenozoic foreland basin. Earth Planet. Sci. Lett. 2016, 455, 49–61. [Google Scholar] [CrossRef]
- Ding, L.; Spicer, R.A.; Yang, J.; Xu, Q.; Cai, F.; Li, S.; Lai, Q.; Wang, H.; Spicer, T.E.V.; Yue, Y.; et al. Quantifying the rise of the Himalaya orogen and implications for the South Asian monsoon. Geology 2017, 45, 215–218. [Google Scholar] [CrossRef]
- Jiang, T.; Shen, Z.; Yang, M. A new model approach to predict the unloading rock slope displacement behavior based on monitoring data. Struct. Eng. Mech. 2018, 67, 105–113. [Google Scholar] [CrossRef]
- Ullah, J.; Luo, M.; Ashraf, U.; Pan, H.; Anees, A.; Li, D.; Ali, M.; Ali, J. Evaluation of the geothermal parameters to decipher the thermal structure of the upper crust of the Longmenshan fault zone derived from borehole data. Geothermics 2022, 98, 102268. [Google Scholar] [CrossRef]
- Huang, R. Geodynamical process and stability control of high rock slope development. Chin. J. Rock Mech. Eng. 2008, 27, 1525–1544. [Google Scholar]
- Tang, L.-Q.; Tang, K.; Nie, D.-X.; Wang, J.-J.; Liu, D.-Y. High slope stability of diversion power system intake of Jinchuan hydropower station. J. Mt. Sci. Engl. 2013, 10, 1109–1117. [Google Scholar] [CrossRef]
- Chen, G.; Chen, T.; Chen, Y.; Huang, R.; Liu, M. A new method of predicting the prestress variations in anchored cables with excavation unloading destruction. Eng. Geol. 2018, 241, 109–120. [Google Scholar] [CrossRef]
- Wu, L.; Deng, H.; Huang, R.; Zhang, L.; Guo, X.; Zhou, Y. Evolution of Lakes Created by Landslide Dams and The Role of Dam Erosion: A Case Study of the Jiajun Landslide on the Dadu River, China. Quat. Int. 2019, 503, 41–50. [Google Scholar] [CrossRef]
- Tu, G.; Deng, H.; Shang, Q.; Zhang, Y.; Luo, X. Effect of unloading in two directions on the formation of a deep-seated flexural toppling failure. Int. J. Rock Mech. Min. Sci. 2021, 142, 104790. [Google Scholar] [CrossRef]
- Si, X.; Li, X.; Gong, F.; Huang, L.; Liu, X. Experimental investigation of failure process and characteristics in circular tunnels under different stress states and internal unloading conditions. Int. J. Rock Mech. Min. Sci. 2022, 154, 105116. [Google Scholar] [CrossRef]
- Chen, H.; Tang, H.; He, X.; Zhao, X. Study on Failure Mechanism of Gongjiafang Bank Slope in Wu Gorge of the Three Gorges, the Yangtze River, China. Front. Struct. Civ. Eng. 2013, 368–370 Pt 1–3, 1794–1799. [Google Scholar] [CrossRef]
- Wu, L.; Shao, G.; Huang, R.; He, Q. Overhanging Rock: Theoretical, Physical and Numerical Modeling. Rock Mech. Rock Eng. 2018, 51, 3585–3597. [Google Scholar] [CrossRef]
- Wu, Y.; Lan, H. Landslide Analyst—A landslide propagation model considering block size heterogeneity. Landslides 2019, 16, 1107–1120. [Google Scholar] [CrossRef]
- Qi, S.; Wu, F.; Yan, F.; Lan, H. Mechanism of deep cracks in the left bank slope of Jinping first stage hydropower station. Eng. Geol. 2004, 73, 129–144. [Google Scholar] [CrossRef]
- Zhu, L.; Cui, S.H.; Pei, X.J. Investigation of the characteristics and long-runout movement mechanisms of the Luanshibao landslide on the eastern margin of the Qinghai-Tibet Plateau. Soil Dyn. Earthq. Eng. 2022, 153, 107094. [Google Scholar] [CrossRef]
- Shang, Y.; Yang, Z.; Li, L.; Liu, D.; Liao, Q.; Wang, Y. A super-large landslide in Tibet in 2000: Background, occurrence, disaster, and origin. Geomorphology 2003, 54, 225. [Google Scholar] [CrossRef]
- Zheng, D.; Huang, R. Quantitative study on the classification of unloading zones of high slopes. In Landslides and Engineered Slopes. From the Past to the Future, Two Volumes+ CD-ROM; CRC Press: Boca Raton, FL, USA, 2008; pp. 1073–1076. [Google Scholar] [CrossRef]
- Tu, G.X.; Deng, H. Unloading depth of rock masses and its relations with river downcutting in deep valleys in Southwest China. Eng. Geol. 2021, 288, 106161. [Google Scholar] [CrossRef]
- GB 50487-2008; Code for Engineering Geological Investigation of Water Resources and Hydropower. Ministry of Water Conservancy and Hydropower Planning and Design Institute: Beijing, China, 2008.
- Shen, J.; Zhang, J.L.; Xu, J.; Liao, R.; Chen, C. Testing of slope stress zones and its application to unloading zonation. Chin. J. Geotech. Eng. 2007, 29, 1423–1427. [Google Scholar]
- Li, R.; Liu, T. Research of Bank Slope Stress Field and Quantitative Indicators of Unloading Zones Classification. J. North China Univ. Water Resour. Hydropower 2014, 2, 76–80. [Google Scholar]
- Yang, H.; Zeng, Y.; Lan, Y.; Zhou, X. Analysis of the excavation damaged zone around a tunnel accounting for geostress and unloading. Int. J. Rock Mech. Min. Sci. 2014, 69, 59–66. [Google Scholar] [CrossRef]
- Deere, D. Technical Description of Rock Cores for Engineering Purposes. Rock Mech. Eng. Geol. 1963, 1, 18–22. [Google Scholar]
- Deere, D. Geological Considerations. In Rock Mechanics in Engineering Practice; Stagg, K.G., Zienkiewica, O.C., Eds.; Wiley: London, UK, 1968; pp. 1–20. [Google Scholar]
- Merritt, A. Engineering Classification for In-Situ Rock; University of Illinois at Urbana: Champaign, IL, USA, 1968. [Google Scholar]
- Wu, F.; Liu, J.; Liu, T.; Zhuang, H.; Yan, C. A method for assessment of excavation damaged zone (EDZ) of a rock mass and its application to a dam foundation case. Eng. Geol. 2009, 104, 254–262. [Google Scholar] [CrossRef]
- Perras, M.; Diederichs, M.S. Predicting excavation damage zone depths in brittle rocks. J. Rock Mech. Geotech. 2016, 8, 60–74. [Google Scholar] [CrossRef]
- Zhao, W.-H.; Frost, J.D.; Huang, R.-Q.; Yan, M.; Jin, L.-D. Distribution and quantitative zonation of unloading cracks at a proposed large hydropower station dam Site. J. Mt. Sci. Engl. 2017, 14, 2106–2121. [Google Scholar] [CrossRef]
- Andreev, V.; Lavrova, L. Experience in studying technogenic unloading in construction pits. Hydrotech. Constr. 1984, 18, 70–74. [Google Scholar] [CrossRef]
- Bao, H.; Wu, F.; Xi, P.; Xu, J.; Liang, N.; Yan, C.; Xu, W.; Qi, Q. A new method for assessing slope unloading zones based on unloading strain. Environ. Earth Sci. 2020, 79, 350. [Google Scholar] [CrossRef]
- Li, W.; Tong, K.; Dong, Z. Examining method of unloading zone and study of unload behavior for high slope. J. Rock Mech. Eng. 2001, A1, 1669–1673. [Google Scholar]
- Li, C.J.; Li, X.B.; Liang, L.S. Dynamic response of existing tunnel under cylindrical unloading wave. Int. J. Rock Mech. Min. Sci. 2020, 131, 104342. [Google Scholar] [CrossRef]
- Lesparre, N.; Gibert, D.; Nicollin, F.; Nussbaum, C.; Adler, A. Monitoring the excavation damaged zone by three-dimensional reconstruction of electrical resistivity. Geophys. J. Int. 2013, 195, 972–984. [Google Scholar] [CrossRef]
- Neuzil, C. Groundwater Flow in Low-Permeability Environments. Water Resour. Res. 1986, 22, 1163–1195. [Google Scholar] [CrossRef]
- Louis, C. Determination of in situ hydraulic parameters in jointed rock. In Proceedings of the Second Congress on Rock Mechanics, Belgrade, Serbia, 21–26 September 1970; Volume 1, pp. 40–45. [Google Scholar]
- Sun, Y.; Huang, R. Research on quantification index of rock mass in riverside unloading zone classification. Chin. J. Rock Mech. Eng. 2012, 31 (Suppl. 2), 3942–3949. [Google Scholar]
- Cho, W.J.; Kim, J.-S.; Lee, C.; Choi, H.-J. Gas permeability in the excavation damaged zone at KURT. Eng. Geol. 2013, 164, 222–229. [Google Scholar] [CrossRef]
- Sorokin, A.A. Experience in using air testing for studying jointing of rocks. Hydrotech. Constr. 1983, 17, 264–274. [Google Scholar] [CrossRef]
- Liu, H.; Li, T.; Shen, J.; Wang, L. The application of RaA testing technique on researching deep fracture belts in a rock slope. Chin. J. Geol. Hazards Prev. 2004, 15, 107–111. [Google Scholar]
- Wang, X. Radon Anomaly Analysis of Engineering Slopes. Adv. Mater. Res. 2011, 261–263, 1161–1166. [Google Scholar] [CrossRef]
- Zhang, S.; Shi, Z.; Wang, G.; Yan, R.; Zhang, Z. Groundwater radon precursor anomalies identification by decision tree method. Appl. Geochem. 2020, 121, 104696. [Google Scholar] [CrossRef]
- Jiang, H. The Rock Mass Structure Features and Its Control Seepage Mechanism of Longkaikou Hydroelectric Power Station Dam Base on Jinsha River; Chengdu University of Technology: Chengdu, China, 2006. [Google Scholar]
- Qi, S.W.; Wu, F.Q.; Zhuang, H.Z.; Liu, T.; Yan, C.G.; Chai, J.F. Characteristics of unloading fissures in dam’s base of Xiaowan hydropower station. J. Rock Mech. Eng. 2008, A1, 2907–2912. [Google Scholar]
- Guo, J. Quantification Study on Weathering and Unloading Zones of Rock Mass in Yangfanggou Hydropower Station on Yalong River; Chengdu University of Technology: Chengdu, China, 2010. [Google Scholar]
- Pang, B.; Zheng, D. Fuzzy comprehensive evaluation-based quantified study on classification of unloading zones of Emeishan basalt. Water Resour. Hydropower Eng. 2016, 5, 157–161. [Google Scholar] [CrossRef]
- Qian, K. The character of weathering, classification of unloading zones and engineering geological for the basalt. Sichuan Water Power 1992, 3, 33–37. [Google Scholar]
- Lu, H. Engineering geological exploration of high arch dam. Hydropower Technol. Yunnan 1995, 4, 4–15. [Google Scholar]
- Ju, G. Engineering Geology Study Onweathered & Unloaded Granite Rockmass in Incisedvalley of Yellow River Laxiwa Hydroelectric Station; Chengdu University of Technology: Chengdu, China, 2002. [Google Scholar]
- Chen, Q.; Nie, D.X.; Pan, S.Y.; He, Z.C.; Xie, K. A study of coefficient of permeability as a quantitative classification index for unloaded zones of rockmass. Hydrogeol. Eng. Geol. 2011, 38, 48–53. [Google Scholar] [CrossRef]
- Twidale, C. On the origin of sheet jointing. Rock Mech. Rock Eng. 1973, 5, 163–187. [Google Scholar] [CrossRef]
- Jarman, D. Large rock slope failures in the Highlands of Scotland: Characterisation, causes and spatial distribution. Eng. Geol. 2006, 83, 161–182. [Google Scholar] [CrossRef]
- Hencher, S.; Knipe, R. Development of rock joints with time and consequences for engineering. In Proceedings of the 11th Congress of the International Society for Rock Mechanics, Lisbon, Portugal, 9–13 July 2007; Volume 1, pp. 223–226. [Google Scholar]
- Wakasa, S.; Matsuzaki, H.; Tanaka, Y.; Matsukura, Y. Estimation of episodic exfoliation rates of rock sheets on a granite dome in Korea from cosmogenic nuclide analysis. Earth Surf. Process. Landf. 2006, 31, 1246–1256. [Google Scholar] [CrossRef]
- Guo, C.B.; Wu, R.A.; Jiang, L.W.; Zhong, N.; Wang, Y.; Dong, W.; Zhang, Y.S.; Yang, Z.H.; Meng, W.; Li, X.; et al. Typical Geohazards and Engineering Geological Problems Along the Ya’an-Linzhi Section of the Sichuan-Tibet Railway, China. Geoscience 2021, 35, 1–17. [Google Scholar] [CrossRef]
- Wu, F.; Wang, S.; Song, S.; Lv, J. Statistical Principles in Mechanics of Rock Masses. Chin. Sci. Bull. 1994, 6, 493–503. [Google Scholar]
- Wu, F.; Wang, S. A stress-strain relation for jointed rock masses. Int. J. Rock Mech. Min. Sci. 2001, 38, 591–598. [Google Scholar] [CrossRef]
- Sun, X.; Chen, G.; Huang, M.; Zhang, S.; Yang, J.; Ma, J. Method for analyzing the evolution characteristics of in-situ stress field considering rheology and degradation: A deeply incised valley in Qinghai-Tibet Plateau, case study. Eng. Geol. 2023, 315, 107029. [Google Scholar] [CrossRef]
- Hua, X.; Liu, T.; Liu, J. A New Coefficient and Method to Appraise Tunnel Rock Mass Integrity. J. Railw. Eng. Soc. 2017, 34, 43–46+86. [Google Scholar]
- Huang, R.; Lin, F.; Chen, D.J.; Wang, D.H. Formation mechanism of unloading fracture zone of high slopes and its engineering behaviors. J. Eng. Geol. 2001, 9, 227–232. [Google Scholar]


| Hydropower Station | Lithology | Unloading Zonation Index |
|---|---|---|
| Xiaowan | Granite | Longitudinal wave velocity, fracture opening width |
| Longkaikou | Basalt | Longitudinal wave velocity |
| Xiluodu | Basalt | Longitudinal wave velocity, rock mass integrity coefficient |
| Baihetan | Basalt | Fracture opening width, fracture spacing, longitudinal wave velocity, number of fracture openings, unit gap width, and unit number of fractures |
| Jinping | Marble, sandstone, slate | Fracture opening width, fracture spacing, longitudinal wave velocity |
| Xiangjiaba | Sandstone | Number of fractures, fracture opening width |
| Pubugou | Basalt, granite | Longitudinal wave velocity |
| Yangfanggou | Granodiorite | Fracture rate, fracture opening width |
| Guandi | Dolomite, sandstone, shale | Longitudinal wave velocity |
| Dagangshan | Granite, diorite | Fracture opening width, types of rock mass structures, longitudinal wave velocity |
| Hydropower Station | Lithology | Main Characteristics of Strong Unloading Zones | Range/m | |
|---|---|---|---|---|
| Crack Width/cm | Elastic Wave Velocity/(m·s−1) | |||
| Wudongde | Marble | 1.0–5.0 | 3400–3600 | 0–18 |
| Tacheng | Phyllite | 0.5–2.0 | 2800–3500 | 0–36 |
| Three Gorges Permanent Shiplock | Granite | 0.5–1.0 | 3300–3600 | 0–8 |
| Jinping I | Hypometamorphic rock | 3.0–7.0 | ≤3800 | 5–20 |
| Xiaowan | Metamorphic rock | >2.0 | ≤3000 | 7–34 |
| Xiluodu | Basalt | >2.0 | ≤3000 | 5–15 |
| Baihetan | Basalt | 2.0–15.0 | 2100–3400 | 0–54 |
| Guandi | Basalt | 1.0–10.0 | ≤2000 | 7–53 |
| Strata | Main Lithology | Thickness/m | Cardinal Features | |
|---|---|---|---|---|
| Stratified Structure | Hardness | |||
| S3y | Crystalline limestone and argillaceous dolomite | 20–100 | Thick | Hard |
| D1g | Dolomite and dolomitic limestone | >50 | Thick | Hard |
| D2q | Crystalline limestone | >50 | Thick | Hard |
| Q4dl+el | Crushed stone and Silty clay | 5–10 | / | / |
| Q4col+dl | Crushed stone | 10–30 | / | / |
| Depth/m | Number of Cracks per 5 m | Width of Open Cracks per 5 m/cm | Depth/m | Number of Cracks per 5 m | Width of Open Cracks per 5 m/cm |
|---|---|---|---|---|---|
| 0–5 | 3 | 3.5 | 100–105 | 3 | 0.3 |
| 5–10 | 4 | 3.8 | 105–110 | 4 | 1.0 |
| 10–15 | 1 | 1.0 | 110–115 | 2 | 0.1 |
| 15–20 | 4 | 7.3 | 115–120 | 2 | 0.0 |
| 20–25 | 3 | 15.5 | 120–125 | 4 | 0.0 |
| 25–30 | 10 | 2.5 | 125–130 | 3 | 0.0 |
| 30–35 | 9 | 1.0 | 130–135 | 6 | 0.5 |
| 35–40 | 5 | 1.5 | 135–140 | 4 | 0.5 |
| 40–45 | 5 | 4.0 | 140–145 | 1 | 0.0 |
| 45–50 | 13 | 12.4 | 145–150 | 4 | 0.5 |
| 50–55 | 1 | 1.0 | 150–155 | 3 | 0.0 |
| 55–60 | 2 | 4.0 | 155–160 | 2 | 0.0 |
| 60–65 | 25 | 10.4 | 160–165 | 4 | 0.5 |
| 65–70 | 7 | 14.0 | 165–170 | 1 | 0.0 |
| 70–75 | 1 | 3.0 | 170–175 | 6 | 0.7 |
| 75–80 | 4 | 13.0 | 175–180 | 6 | 0.5 |
| 80–85 | 25 | 3.2 | 180–185 | 4 | 1.3 |
| 85–90 | 9 | 7.7 | 185–190 | 2 | 0.0 |
| 90–95 | 22 | 0.0 | 190–195 | 3 | 0.3 |
| 95–100 | 27 | 1.2 | 195–200 | 6 | 0.1 |
| Type | ρ/(kg·m−3) | E/GPa | μ | GM/GPa | ηM/GPa·d | GK/GPa | ηK/GPa·d |
|---|---|---|---|---|---|---|---|
| Rock mass | 2650 | 14 | 0.25 | 5.6 | 11.2 | 3.36 | 56 |
| Fault | 2200 | 4 | 0.35 | 1.48 | 2.96 | 1.18 | 14.8 |
| Type | c0/MPa | cr/MPa | φ0/(°) | φr/(°) | σt0/MPa | ||
| Rock mass | 1.5 | 0.3 | 55.0 | 30 | 1.2 | 0.02 | 0.001 |
| Fault | 0.1 | 0.1 | 30 | 30 | 0.0 | 0.02 | 0.001 |
| Unloading Zones | Main Geological Characteristics |
|---|---|
| Strong | 1. The unloading cracks are densely developed and generally open. 2. The openings are generally a few centimeters to tens of centimeters. 3. Some have obvious loosening or displacement. |
| Weak | 1. The unloading cracks are sparsely developed. 2. The openings are generally a few millimeters to a few centimeters. 3. Most of the unloading fractures open along the original structural plane, and the rock mass is partially relaxed. |
| Division Method | Strong Unloading Zones/m (Differences/%) | Weak Unloading Zones/m (Differences/%) |
|---|---|---|
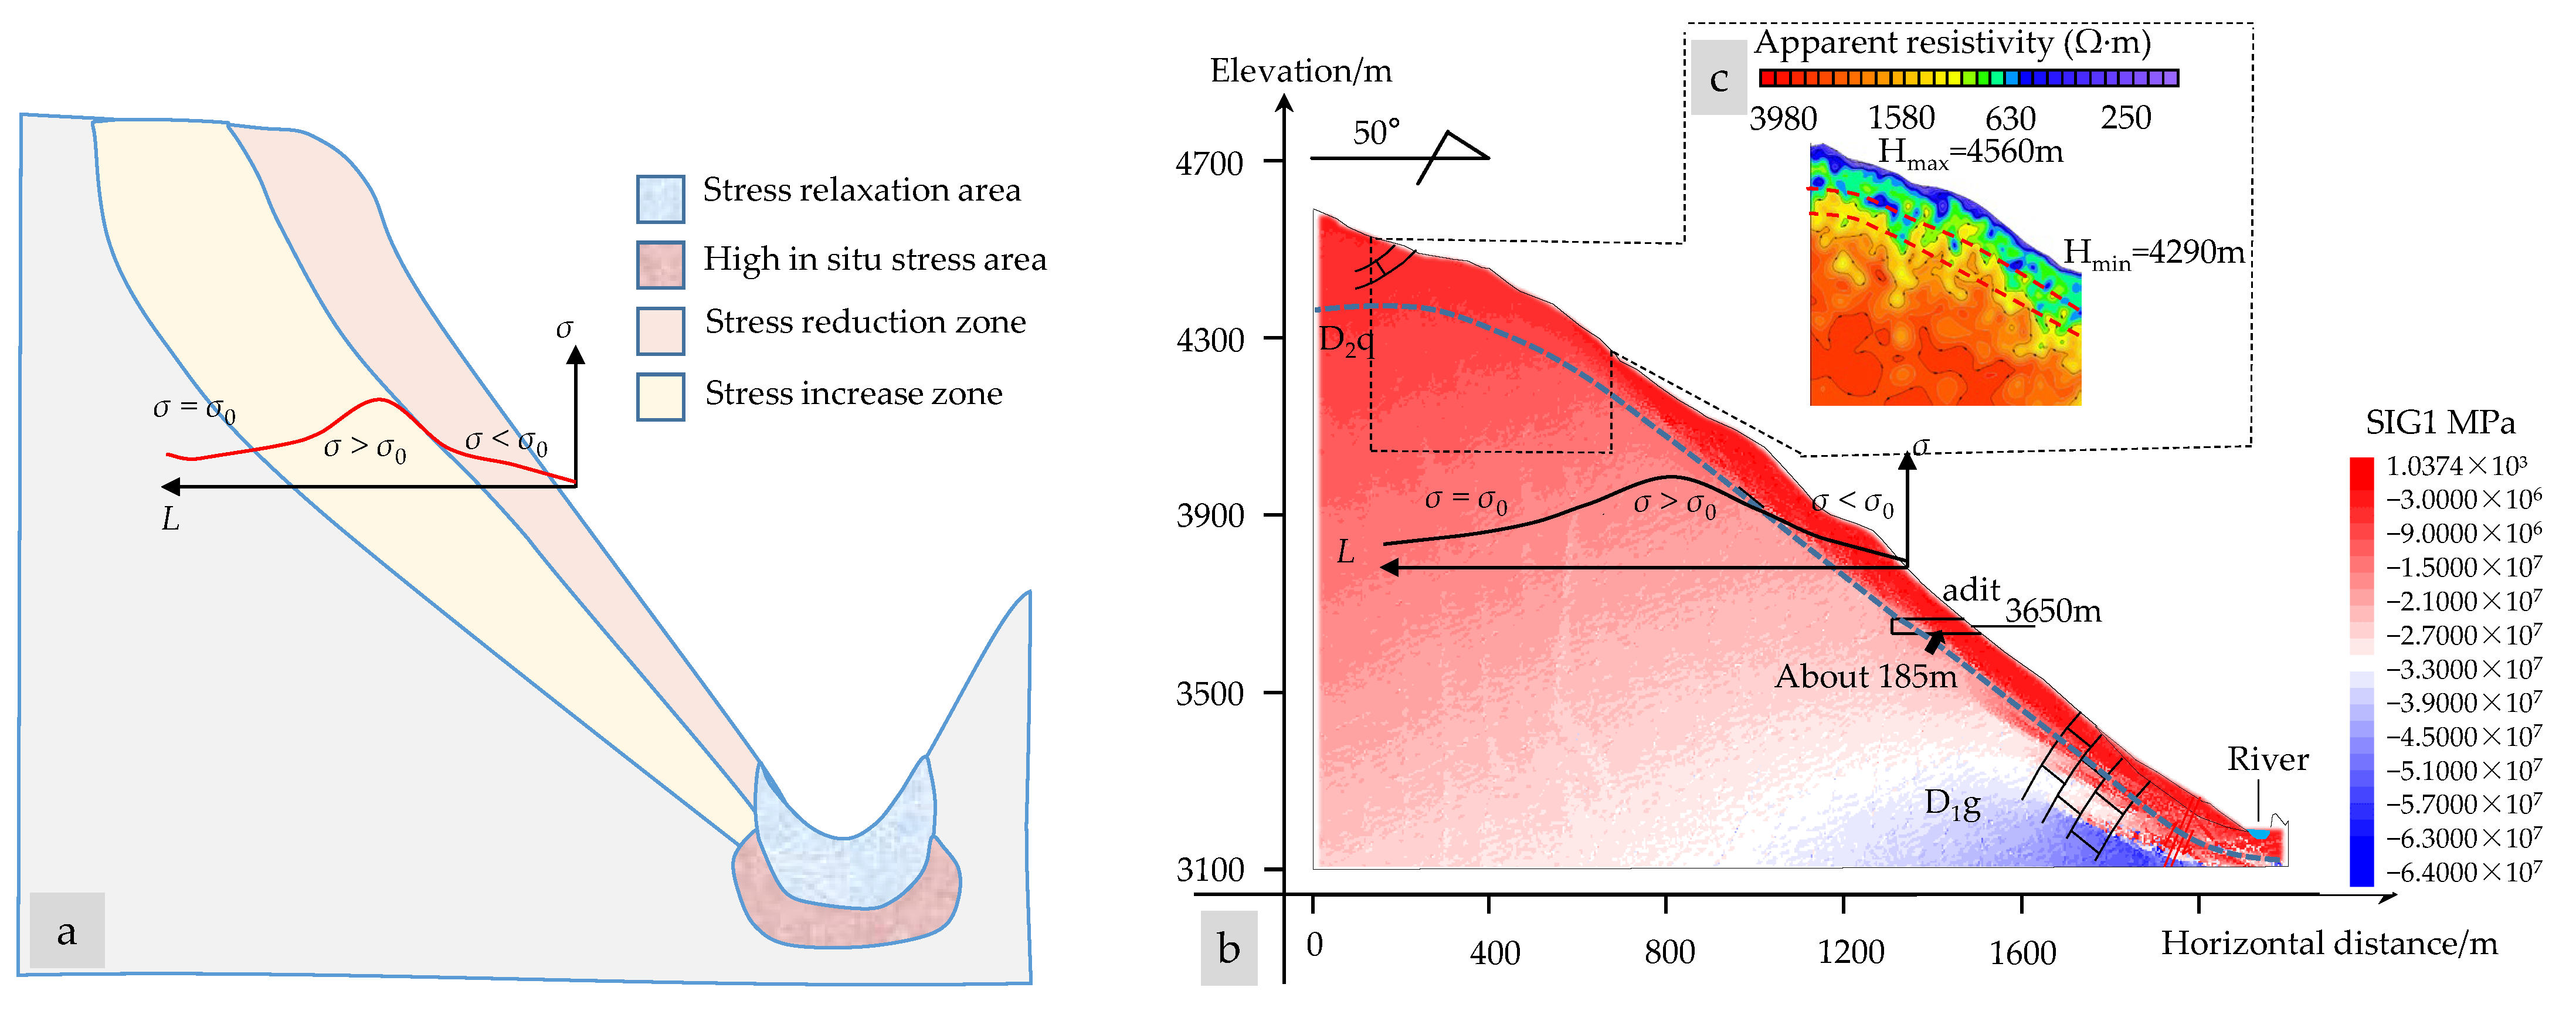
| In situ stress | /(/) | 185 (0) |
| Resistivity (top of slope) | 200 (/) | 250 (/) |
| GB50487-2008 | 100 (0) | 185(0) |
| Strain rate | 90 (10) | 185 (0) |
| Crack rate | 100 (0) | 170 (8) |
| SPUC | 100 (0) | 185 (0) |
Disclaimer/Publisher’s Note: The statements, opinions and data contained in all publications are solely those of the individual author(s) and contributor(s) and not of MDPI and/or the editor(s). MDPI and/or the editor(s) disclaim responsibility for any injury to people or property resulting from any ideas, methods, instructions or products referred to in the content. |
© 2023 by the authors. Licensee MDPI, Basel, Switzerland. This article is an open access article distributed under the terms and conditions of the Creative Commons Attribution (CC BY) license (https://creativecommons.org/licenses/by/4.0/).
Share and Cite
Xu, Z.; Chen, G.; Sun, X.; Yang, X.; Lin, Z. Method for Unloading Zonation Based on Strain per Unit Crack: Case Study of a Large-Scale Rocky Slope on the Qinghai–Tibet Plateau. Sustainability 2023, 15, 3861. https://doi.org/10.3390/su15043861
Xu Z, Chen G, Sun X, Yang X, Lin Z. Method for Unloading Zonation Based on Strain per Unit Crack: Case Study of a Large-Scale Rocky Slope on the Qinghai–Tibet Plateau. Sustainability. 2023; 15(4):3861. https://doi.org/10.3390/su15043861
Chicago/Turabian StyleXu, Zhengxuan, Guoqing Chen, Xiang Sun, Xin Yang, and Zhiheng Lin. 2023. "Method for Unloading Zonation Based on Strain per Unit Crack: Case Study of a Large-Scale Rocky Slope on the Qinghai–Tibet Plateau" Sustainability 15, no. 4: 3861. https://doi.org/10.3390/su15043861
APA StyleXu, Z., Chen, G., Sun, X., Yang, X., & Lin, Z. (2023). Method for Unloading Zonation Based on Strain per Unit Crack: Case Study of a Large-Scale Rocky Slope on the Qinghai–Tibet Plateau. Sustainability, 15(4), 3861. https://doi.org/10.3390/su15043861