Abstract
Investigations on rock dynamics have been comprehensively focused on when the dynamic impact is perpendicular to the trend of the flaws, while understanding the dynamic mechanical properties and failure characteristics of rock with pre-flaws parallel to the loading direction remains unrevealed. In this study, impact tests are performed to experimentally study the dynamic mechanical properties, failure characteristics, and energy evolution of pre-flawed sandstone using the split Hopkinson pressure bar (SHPB) apparatus, in which the pre-flaws are parallel to the loading direction. The results show that for specimens, the dynamic loading rate and the number of flaws greatly influence the dynamic strength, peak strain, energy absorption rate, and failure behaviors. The dynamic strength increases exponentially with an increase in loading rate and decreases with an increase in flaw numbers. The fractal dimension of triple-flawed specimens is the largest at the same loading rate range. The failure modes of different pre-flawed specimens show a transition from tensile failure to tensile-shear failure with the increase of dynamic loading rate.
1. Introduction
During long-term geological evolution, rock mass forms into heterogeneous material with defects such as faults, fractures, and joint sets distributed internally in various distribution patterns. In mining and tunneling constructions, blasting or mechanical excavation are normally used for rock breaking [1,2], which makes the adjacent rock mass subjected to dynamic impact with high loading rates. Rock mass containing discontinuous structural planes will be instantaneously fractured and broken under the dynamic compression impact, which will eventually result in geological disasters such as rock burst and landslide [3,4,5]. Therefore, investigations on the mechanical properties and failure characteristics of rock masses containing discontinuous structural planes subjected to dynamic impact is of great significance to the optimization of rock mining and geological disaster prevention.
There are a large number of methods to measure the strength of rocks, such as non-destructive acoustic emission technology [6,7,8] at the microscopic scale and true triaxial systems [9] and dynamic loading systems [10] at the macroscopic scale. In this experiment, the dynamic mechanical properties of rock are studied by the split Hopkinson pressure bar (SHPB) system. When dynamic stress waves propagate in rock discontinuities [11], the transmission and reflection effects of propagation attenuation are displayed in the same way that acoustic waves propagate in sandwich composite shell systems [12,13]. The available literature mainly investigates the effects of flaw configuration and loading conditions [14,15] on the mechanical properties and energy dissipation of flawed rocks or rock-like materials [16,17,18,19,20]. The researchers found that when the dynamic impact was perpendicular to the trend of the cracks, the geometries of the pre-flawed samples have indirect effects on the dynamic strength and the energy density of the samples but direct effects on the energy absorption and crack propagation. Moreover, rock masses show a significant strain rate dependency on the mechanical and cracking behaviors [21]. The increase in loading rate or strain rate significantly improved the dynamic strength [22,23] and breakage degree [24,25,26]. In the case of dynamic loading conditions, Shu et al. [27] and Peng et al. [28] used the quantitative method to analyze the dynamic stress variation law of the flawed rocks with intact and different configuration rocks; they found that the dynamic strength was sensitive to the loading rate, but the influence of different crack dip angles on the dynamic strength was limited. Moreover, the energy consumption density of granite and sandstone was negatively correlated with their fractal dimension under dynamic uniaxial compressive tests [29].
Aside from mechanical properties, the crack propagation path and failure pattern were also concerned. When the stress was perpendicular to the trend of fractured rock, scholars have reported various models for crack initiation and propagation at the flaw tips [30,31]. Nemat-Nasser and Horii [32] conducted uniaxial compression test and theorical derivation to explore the non-plane crack propagation law of the pre-cracked samples, Li et al. [33] investigated the failure modes of two parallel cracks under the uniaxial compression test. The authors found that the macroscopic crack of the sample is more likely to be generated by a tensile process because the crack exhibits torsion elongation with the increase of axial pressure, and the main fracture modes are the tension mode wing crack, the shear mode wing crack, and reversed wing crack. Moreover, the failure mode can be classified into four categories: mixed damage, shear failure, step damage, and complete damage [34]. Additionally, Zou and Wong [35] used the SHPB apparatus on prismatic marble specimens containing a single pre-existing flaw with different inclination angles. The results show that no matter what the flaw inclination angle is, all the flawed specimens show an “X” shape failure. Yan et al. [36] investigated the effects of preexisting multiple parallel cracks on fracture behavior using a SHPB system. It is reported that the X-shaped shear failure mode is the final failure mode of all specimens. Chen et al. [37] reported that the sliding surfaces with tensile cracks in multistage landslide have a great influence on the stability of the slope. He proposed the discontinuous dynamic strength reduction method to search the multistage sliding surfaces, and the failure modes are fully considered shear failure and tensile failure. All the above results investigated the attenuation of stress waves between discontinuities, and the effects on the dynamic mechanical response, energy evolution, and failure behaviors of pre-flawed rocks.
The dynamic impact perpendicular to the trend of the cracks has been comprehensively investigated (Figure 1a,b). However, few studies have been conducted on the conditions when dynamic stresses are parallel to the trend of the cracks. Wu et al. [38] examined the effect of axial surface cracks on rock dynamic mechanical properties and failure modes, and found that dynamic compressive strength, deformation modulus, and peak strain of specimens increase initially and then decrease with the increase of crack number and crack depth. The fragmentation degree of the samples with double cracks was greater than that of the samples with other cracks. Therefore, the axial surface crack parallel to the loading direction is of significant importance for mechanical properties and failure modes. It is important to study the dynamic mechanical properties and failure modes of rock under the condition that the trend of pre-flawed samples is parallel to the impact loading direction.
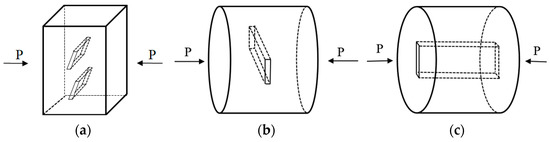
Figure 1.
Schematics of specimens with different flaw configurations: (a) the dynamic loading direction is perpendicular to the flaw direction and intersects with the flaw inclination; (b) the dynamic loading direction is perpendicular to the flaw direction and inclination; (c) the dynamic loading direction is parallel to the flaw trend and perpendicular to the flaw inclination.
In this study, the dynamic compressive tests were conducted on SHPB system to investigate the effects of the flaw geometries on the dynamic mechanical properties, energy evolution, and the failure behaviors of red sandstone specimens under the condition when the trends of pre-flaws are parallel to the impact loading direction, as shown in Figure 1c.
2. Experimental Methodology
2.1. Rock Specimens
Red sandstone was acquired from Yibin, Sichuan province of China. To ensure the consistency of specimens, all the specimens were machined from a homogeneous intact sandstone block. Table 1 illustrates the physical and mechanical properties of red sandstone. Following the method suggested by the International Society for Rock Mechanics (ISRM) [39], the rock samples were made into columnar specimens with a diameter (d) of 50 mm and a slenderness ratio of 1, and both ends of the specimens were grinded and polished to unevenness and non-perpendicularity to less than 0.02 mm. The pre-flaws were manufactured by wire sawing technology, and the trend of the pre-flaws was parallel to the loading direction. In this study, the flaw length (l), depth, and width were fixed at 15 mm, 50 mm, 0.3–0.4 mm, respectively. To investigate the effect of pre-flaw on the dynamic mechanical properties and energy evolution of the rock samples subjected to various loading rates, two flaw parameters, i.e., flaw number and flaw configuration, were taken into consideration. The schematic of the intact and pre-flawed specimens is shown in Figure 2. The specimen number describes the type of rock (intact, single, double, triple), the angle between the flaws (α = 60° or 120°), and the gas pressures. During the preliminary tests, it was found that no obvious damage occurred in the red sandstone specimens until the gas pressure increased 0.40 MPa, whereas the specimens were crushed into powder when the gas pressure was adjusted to 0.60 MPa. Thereby, the pressure of the gas chamber is set to 0.40 MPa, 0.45 MPa, 0.50 MPa, and 0.55 MPa. For instance, S-1 refers to a single-flaw sandstone specimen subjected to 0.40 MPa gas pressure; T-60-4 refers to a triple-flaw sandstone specimen with α = 60° subjected to 0.55 MPa gas pressure.

Table 1.
Physical and mechanical properties of red sandstone.
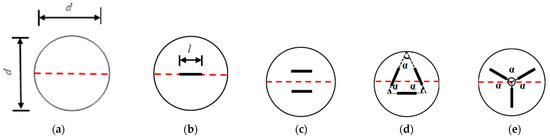
Figure 2.
Specimens with different flaws: (a) an intact specimen; (b) a single-flawed specimen; (c) a specimen with double flaws; (d) a specimen with triple flaws and the angle between the flaws are α = 60°; (e) a specimen with triple flaws and the angle between the flaws are α = 120°.
2.2. Testing Apparatus
The dynamic loading tests were performed by a modified SHPB system in set-up housed at the Central South University, China. The system mainly consists of an air gun, a cone-shaped striker, an incident bar (2.0 m in length), a transmitted bar (1.5 m in length), an absorbing bar (0.8 m in length), an energy absorption device, a data acquisition device and strain gauges, as shown in Figure 3 [15,40]. The striker and all bars were made of high strength 40 Cr alloy steel, and the diameter, P-wave velocity, elastic modulus, yield strength, and density were 50 mm, 5410 m/s, 230 GPa, 800 MPa, and 7697 kg/m3, respectively.
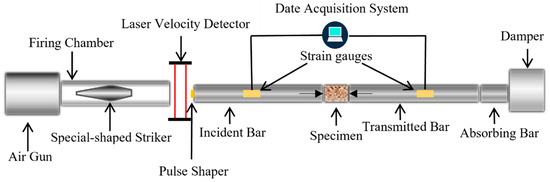
Figure 3.
Schematic of a modified SHPB technique.
During testing, a pulse shaper was placed between the striker and incident bar to obtain a smooth waveform and reduce the amplitude of the oscillation waveform; the specimen is sandwiched between the incident and transmitted bars. To reduce the inertia effect caused by radial impact, we coat the contact surface between the specimen and the bar in petroleum jelly for lubrication. The three waves are measured by two pairs of strain gauges glued on the incident and transmitted bars, respectively, and recorded by a digital oscilloscope. In accordance with 1D stress wave theory, the dynamic stress , strain rate , and axial strain can be calculated by following expressions [10,41]:
where , , and are the incident stress, reflected stress, and transmitted stress at time t, respectively. , , and are the cross-sectional area, P-wave velocity, and Young’s modulus of the elastic bar, respectively. and are the cross-sectional area and length of the specimen, respectively.
2.3. Verifying the Stress Equilibrium State
The elastic strain pulses in Figure 4a are expressed as incident, reflected, and transmitted wave signals, respectively. It can be seen that there is a reflection platform in the test waveform, so the specimen deformation process is considered to occur at a constant strain rate. From Figure 4b, it can be seen that the dynamic stress is balanced on both ends of the specimen during the loading process. In this study, all test results were strictly verified for stress balance, and the waveform curves that did not meet the stress balance conditions were eliminated.
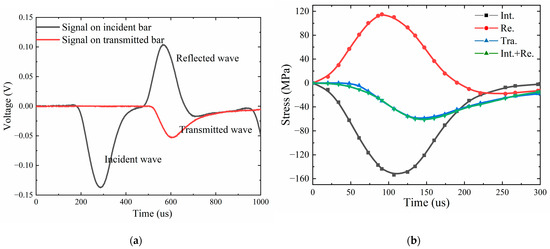
Figure 4.
(a) Electrical signals captured from the strain gauges (specimen T-120-2); (b) dynamic stress equilibrium in specimen T-120-2.
2.4. Determination of Loading Rate
In dynamic tests, the strength of brittle materials is directly related to the loading rate [42]. Figure 5 describes a typical dynamic compression loading time–stress diagram, in which there is a region where the stress increases almost linearly with the increase of time, and the slope of this region can be defined as the loading rate [39]. In a rock dynamic test using SHPB, the pressure of the gas chamber when the striker bar is released is typically regulated to generate various loading rates; in this test, the relationship between the loading rate and the gas pressures of intact and pre-flawed samples is shown in Table 2.
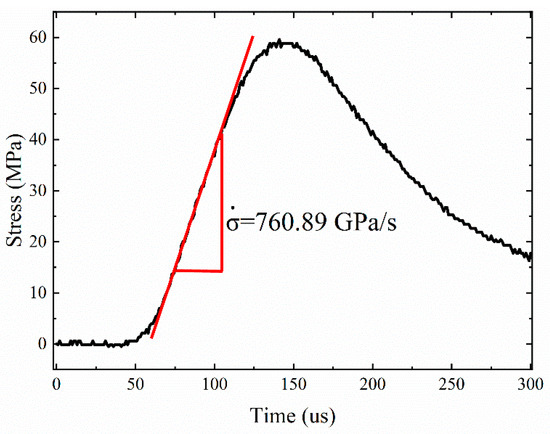
Figure 5.
Determination the loading rate of T-120-2.
Table 2.
The relationships between pressure of gas chamber and loading rate.
3. Experimental Results and Analysis
3.1. Dynamic Stress–Strain Curves
The stress–strain curves of intact and flawed specimens under different loading rates are plotted in Figure 6. The dynamic impact damage process of pre-flawed rock samples can be divided into four stages: (1) compaction stage: in this stage, the initial cracks in the sandstone specimen are compressed, and the stress–strain behavior is nonlinear (in the initial stage of the whole impact, the compaction stage is very obvious, which may be related to the thick coating of petroleum jelly on both end of the specimen) [38]; (2) the elastic stage: in this stage, the stress linearly increases with the strain, and no cracks are initiated in the sandstone specimen; (3) the yield stage: in this stage, new cracks initiate from the pre-flawed surface and propagate along the loading direction, resulting in a reduced elastic modulus of the specimen; (4) the post-peak failure stage: in this stage, new cracks continuously propagate and coalesce with one another, leading the gradual loss of the bearing capacity and the failure of the specimen. However, the strain of some samples shows a trend of rebound, indicating that the specimens remain unbroken or slightly split and still have the bearing capacity.

Figure 6.
Stress–strain curves under different loading rate: (a) = 807.41 ± 82.41 GPa/s; (b) = 864.46 ± 114.49 GPa/s; (c) = 1054.41 ± 245.82 GPa/s; (d) = 1283.85 ± 153.74 GPa/s.
3.2. Influence of Pre-Flaws on the Dynamic Mechanical Properties
3.2.1. Dynamic Strength
Table 3 shows the dynamic strength and strain of the intact and pre-flawed samples. Figure 7a illustrates the dynamic strength of the relationship between intact and each pre-flawed samples subjected to different loading rates. The numbers on the solid lines with different colors represent the percentage of strength reduction of each pre-flawed sample compared with the intact sample under the same loading rate range. The dynamic strength decreases as the flawed number increases. Pre-flaws with a trend parallel to the loading direction prominently weaken the dynamic strength. In addition, the strength of triple-flawed specimen with α= 60° is 3.21% lower on average than the specimens with α= 120°. Therefore, this indicates that the flaw number and flaw configuration have significant deterioration effects on dynamic strength.
Table 3.
Geometrical dimensions and mechanical parameters of the specimens satisfy stress equilibrium at different loading rates.
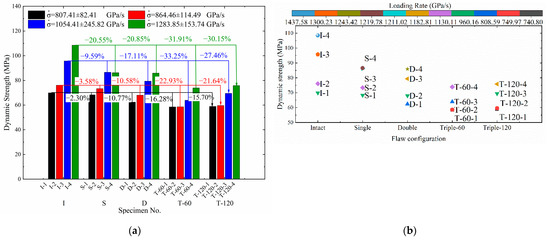

Figure 7.
(a) The dynamic strength relationship between each flawed sample and the intact sample subject to different loading rates (note: the number represents the percentage of strength reduction of different pre−flawed samples compared with the intact sample under the same loading rate range); (b) the trend of dynamic strength with different flaws subjected to various loading rate; (c) the fitting curves of the relationship between dynamic stress and loading rate of intact and pre−flawed specimens under varies loading rate.
The dynamic strength increases with the increase in loading rate, as shown in Figure 7b. All specimens show obvious rate-dependence. The relationship between dynamic strength () and loading rate () is quantitatively expressed as Equations (4)–(8) [43]. The R2 values are 0.99, 0.99, 0.97, 0.96, and 0.98, respectively. In addition, the fitting curves are plotted in Figure 7c; the intact specimens exhibit greater loading rate-dependance than the pre-flawed specimens.
3.2.2. Deformation Characteristic
The peak strain is defined as the strain at the peak stress. The relationship between flaw number and peak strain is shown in Figure 8. Within the same loading rate range, the peak strain of the flawed specimens is generally larger than that of the intact specimens, it increases with the increase of the flaw number, and the peak strain of triple-flawed specimens with α = 60° is close to the specimens with α = 120°. This is because dynamic strain represents deformation capacity; with the increase in the number of flaws, the dynamic strength gradually decreases, the damage degree of the specimen is greater, the deformation capacity is greater, and the dynamic strain value increases. It indicates that dynamic deformation is significantly influenced by flaw number and that the influence of flaw configuration is limited. This is consistent with the conclusion when the trend of the pre-flaws is perpendicular to the loading direction [15]. Meanwhile, the peak strain increases with an increase in loading rate.
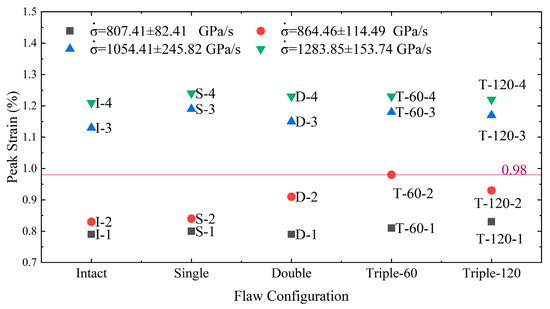
Figure 8.
The relationship between the peak strain and flaw number.
3.3. Energy Evolution
In the SHPB test, the energy of incident stress (), reflected (), transmitted (), and absorbed () stress and the absorbed density () in the rock failure process can be calculated [44,45]:
where is the volume of specimen.
The energy parameters of intact and pre-flawed specimens under different loading rates are listed in Table 4, where A, R, and T are the ratio of the absorbed energy, reflected energy, and transmitted energy to the incident energy, respectively. Figure 9 presents a linear relationship between the absorbed density and incident energy. Within the same loading rate range, the absorbed density of pre-flawed specimens increases with the increase of flaw numbers. The absorbed density of pre-flawed specimens increases with an increase in loading rates. According to the analysis of the failure process and the final rock fragments, when the absorbed density is greater than 0.538 J/cm3, a macroscopic observable crack emerged, which is similar to the research conclusions of Yu. et al. [46].
Table 4.
Energy properties of various specimens.

Figure 9.
Absorbed density with changes in the incident energy.
Figure 10a–c further describes the trend of the energy absorbed, reflected, and transmitted by the specimen with the flaw numbers.
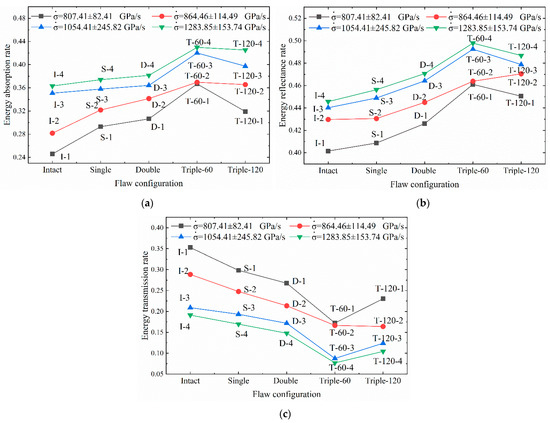
Figure 10.
(a) Trend diagram of energy absorption rate with the intact and pre-flawed specimens; (b) trend diagram of energy reflectance rate with the intact and pre-flawed specimens; (c) trend diagram of energy transmittance rate with the intact and pre-flawed specimens.
Under the same loading rate range, the energy absorption rate increases with the increase of the flaws number. It is contrary to the variation of the dynamic strength. Moreover, the configurations have a great influence on it. For instance, the energy reflectance of the triple-flawed specimens with α = 60° is larger than the specimens with α = 120°. Under the different loading rate ranges, the higher of the loading rate, the higher of the energy absorption rate.
Under the different loading rate ranges, the energy reflectance showed a growing trend with the increase in loading rate. In addition, under the same loading rate range, the energy reflectance showed an increasing trend with the increase of the number of pre-flaws. It is the same as the variation of the energy absorption rate. This is because, at the same loading rate, the lower the wave impedance of the specimen was, the greater the reflection coefficient of the stress wave entering the rock specimen from the elastic bar, and the reflection phenomenon was stronger. Moreover, the configurations have a great influence on it. For instance, the energy reflectance of the triple-flawed specimens with α = 60° is larger than the specimens with α = 120°.
Under different loading rate ranges, the higher the loading rate, the lower the transmission energy. Within the same loading rate range, the energy transmittance decreases as the number of flaws increase. It is opposite to the variation of the energy absorption.
3.4. Fracture Behaviors
3.4.1. Failure Modes
Table 5 displays the typical failure modes of intact and pre-flawed rock specimens at the same loading condition. The failure mode is influenced by the number of pre-flaws; as the number increases from one to three, the failure mode transforms from tensile failure to shear-tensile failure. The failure morphology is determined by the configuration of pre-flaws; as the angle turns from 60° to 120°, the failure morphology transforms from radial to circumferential spilt. Moreover, as the loading rate increases, the breakage degree increases, and the failure modes of the intact specimen transform from tensile failure to shear failure, while the failure modes of the flawed specimens are more complex, changing from tensile failure to shear-tensile failure.
Table 5.
Typical failure model of intact and flawed red sandstone specimens under dynamic impact.
Under lower dynamic loading rates ( = 724.88~960.16 GPa/s) for (1) single-flawed specimens, the tensile cracks along the edge of pre-flaw extend to the end of specimens; with the propagation of stress wave, the cracks further grow and quickly extend through the entire specimen, and present tensile failure; (2) double-flawed specimens, the new crack occurs at the flaw tips with the propagation of stress wave, forming the main shear plane, whose failure mode is a shear failure; (3) triple-flawed specimens with α = 60°, the main crack is formed along one of the pre-flaws, and the fracture is connected, showing the tensile failure; (4) triple-flawed specimens with α = 120°, the rock bridges between the three cracks are narrow, and the cracks are connected, showing tensile shear failure. Moreover, comparing T-60-2 and T-120-2, the spalling debris of T-60-2 is larger, and the degree of breakage is smaller, which is contrary to the law of strength. This is because the absorption density of the specimens with α = 120° is higher than that of the specimens with α = 60°.
At the high dynamic loading rate range ( = 960.16~1437.58 GPa/s), for the single-flaw specimens and triple-flaw with α = 120° specimens, the main cracks along the pre-flaw towards the boundary of the specimens and connected longitudinally. Finally, the inclined shear fracture plane and the shear-tensile failure are formed. For the double-flaw and triple-flaw with α = 60° specimens, the flaws have greater failure guidance ability, a greater breakage degree, and smaller fragments.
3.4.2. Fractal Dimension
The fractal dimension directly reflects the degree of breakage of the specimen, the sieves with mesh sizes of 0.16, 0.315, 0.63, 1.25, 2.5, 5.0, 10.0, 20, 30, and 40 mm are adopted. The recovered fragments are quantitatively weighted at least three times, and the difference between the two weighing results should be guaranteed less than 0.1 g.
The fractal dimensions (D) and the average size of fragments (Mmfs) are calculated according to Equations (14)–(16) [29]:
where MR stands for the accumulated mass of rock fragments size smaller than R, Rmax represents the maximum size of the fragments, α represents the slope of the fitting line in the coordinate system of lg(R/Rmax)~lg(MR/M), rm represents the mean fragment size situated between two successive mesh, and Mm stands for the mass fraction associated with the mean fragment size rm.
Figure 11 shows the lg(R/Rmax)~lg(MR/M) curves of sandstone fragmentation distribution. It can be seen that the fit line of the impact data scatter points of each group have a good correlation. Notably, five unbroken or slightly split specimens (No. I-1, No. S-1, No. D-1, No. T-60-1, and No. T-120-1) are excluded from the analysis. To further investigate the fragment characteristics, the fragment mass fractions and the corresponding mean fragment sizes are analyzed, as shown in Figure 12. It can be seen that under different loading rates, the fractal dimension shows an increasing variation trend with the increasing loading rate, and the mean fragmentation is contrasted to the fractal dimension.
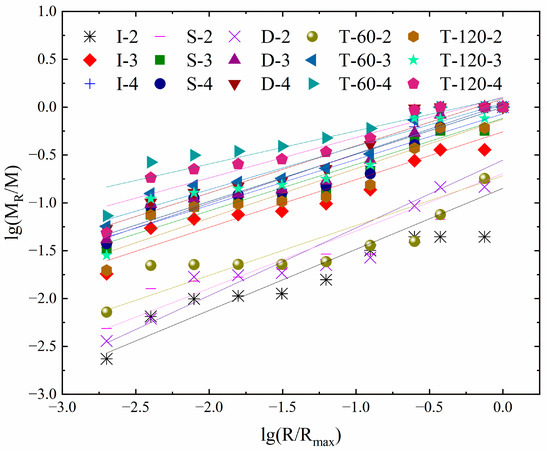
Figure 11.
Fitting curves of lg(R/Rmax) and lg (MR/M).
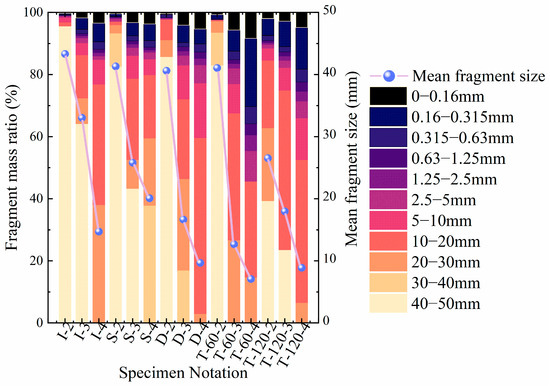
Figure 12.
Fragment characteristics of the intact and flawed sandstone: fragment mass ratio and mean fragment size.
Figure 13 shows the relationship between the fractal dimension and loading rate of intact and flawed specimens. Subject to different loading rate ranges, the lowest fractal dimension is 2.29, which is a double-flawed specimen. The largest fractal dimension is 2.66, which is a triple-flawed specimen. This is because the failure mode of the double-flawed specimen is a shear failure; the initial cracks from the pre-flaw tips extend longitudinally, forming the main shear plane with large fragments; however, the tensile failure, the failure mode of other pre-flawed specimens, is formed by the cracks extending laterally, broken into small fragments. Therefore, the fracture degree of triple-flawed specimens with α = 60° is the largest, and the fractal dimension of the specimen increases with an increase in dynamic loading rate significantly, which is consistent with the variation of the dynamic strength. It can be seen that the increase in loading rate has a great influence on the fracture degree of the specimens, especially on triple-flawed specimens with α = 60°.
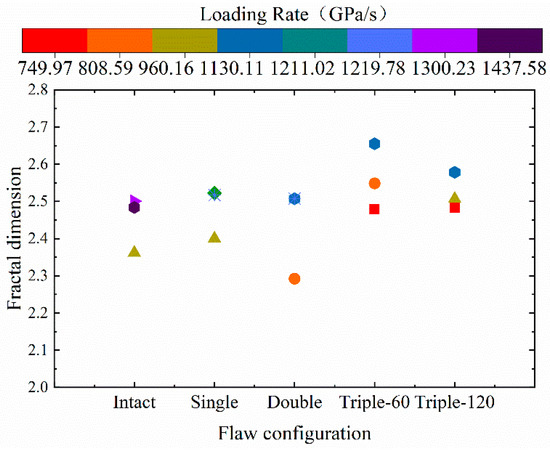
Figure 13.
Fractal dimension of sandstone specimen with different flaws subjected to varied loading rate.
4. Discussion
There may be a relationship between mechanical properties, energy consumption, and degree of breakage under the condition that the trend of pre-flaw is parallel to the impact loading direction. Understanding the potential relationship between these factors is critical for selecting appropriate mining methods and protective measures in engineering practice.
When a rock sample is dynamically impacted, it is assumed that all the absorbed energy is used to break the rock. Figure 14 shows a negative dependence between absorbed density and mean fragmentation [29], it can be expressed by:

Figure 14.
Relationship between mean size and absorbed density.
With the degree of rock fragmentation intensified, the mean fragmentation size decreases; thus, fractal dimension increases. Therefore, a positive dependence exists between absorbed density and fractal dimension, denoted by c+ (WV, D). With the increase in loading rate, the fractal dimension increases, but the transmission energy decreases. Therefore, a negative dependence exists between the fractal dimension and transmission energy, denoted by c- (WT, D).
Under the same loading rate range, there is a positive dependence between dynamic strength and transmission energy c+(WT). Theoretically, there is a negative dependence between dynamic strength and fractal dimension, denoted by c- (, D). It means that the larger the fractal dimension, the lower the intensity. As shown in Figure 13, within the same loading rate range, the fractal dimension of triple-flawed specimens is greater than that of double-flawed, single-flawed, and intact specimens, but the dynamic strength of triple-flawed specimens is the lowest, so satisfying the above inference. In summary, under the same dynamic loading rate range, the specimens with pre-flaws have a lower dynamic strength, a higher energy absorption density, and a larger fractal dimension.
However, the mechanical excavation performance in hard rock is poor because of the mechanical wear failure and the limited mechanical stability. Therefore, lower rock strength is required when tunneling with a machine. In this study, flaw number and configuration have a significant influence on rock strength. When the trend of a triple-flaw with α = 60° is parallel to the impact loading direction, the strength of the rock is efficiently reduced, and it is more conducive to tunneling. In future work, the SHPB apparatus may be used to test more flawed specimens with different configurations and depths to explore the effects of pre-flaws on dynamic rock response.
5. Conclusions
Under the circumstances when the trend of pre-flaws is parallel to the loading direction, impact tests are performed to experimentally study the dynamic mechanical properties, failure characteristics, and energy evolution of pre-flawed sandstone using the SHPB apparatus. The conclusions are summarized as follows:
- (1)
- When the dynamic impact propagates along the pre-flaw trend, the dynamic stress–strain curve of pre-flawed red sandstone can be divided into four stages. In addition, the effects of the flaw number on the mechanical properties are greater than the effects of the flaw configuration. Under the same loading rate, the dynamic strength decreases with the increase in flaws. Furthermore, as the loading rate increases, so do the dynamic strength and peak strain. For the same number of flaws, the dynamic strength of triple-flawed specimens with α = 60° is 3.21% lower than that of specimens with α = 120°;
- (2)
- The failure of the pre-flawed specimens mainly absorbs energy from outside. In addition, the energy evolution is affected by the number and configuration of the flaws. The energy absorbed density, energy absorption rate, and energy reflectance rate increase with the flaw number, but the energy transmitted rate decreases with it. The energy absorption capacity of the triple-flawed specimen with α = 60° is higher than that of the specimen with α = 120°. Moreover, as the loading rate increases, the energy absorption capacity increases but the energy transfer capacity decreases;
- (3)
- The number of pre-flaws affects the failure mode of the specimens. As the number of flaws increases from one to three, the failure mode of the rock transforms from tensile to shear-tensile. Flaw configuration has limited effect on failure mode but has a great influence on failure morphology. The failure plane is mainly divided into radial and circumferential, and both are parallel to or intersect with the pre-flaws. Generally speaking, when the loading rate increases, the failure mode transforms from tensile failure to shear failure or mixed failure, regardless of the difference in the number and configuration of flaws;
- (4)
- Both greater dynamic loading rate and more numbers of pre-flaws lead to larger fractal dimensions, but flaw configuration has only a minor effect on fractal dimension. With the increase in loading rate, the fractal dimension of different pre-flawed specimens gradually increases from 2.29 to 2.66. Overall, the largest fractal dimension is the triple-flawed specimen, and the pre-flaws of specimens can obviously improve the rock fragmentation efficiency.
Author Contributions
Conceptualization, Y.Z.; Data curation, Z.L. and Y.Z.; Formal analysis, Z.L., Y.Z. and D.L.; Investigation, Q.S. and P.W.; Methodology, Q.S. and P.W.; Writing—original draft, Z.L., Y.Z. and D.L. All authors have read and agreed to the published version of the manuscript.
Funding
This research was funded by the Natural Science Foundation of Chongqing, (cstc2020jcyjmsxmX0558, and cstc2020jcyjmsxmX0567), the Open Fund of Chongqing Key Laboratory of Energy Engineering Mechanics & Disaster Prevention and Reduction (Grant No. EEMDPM2021206), the Innovation Program for Graduate Students of Chongqing University of Science and Technology (No. YKJCX2120660, YKJCX2120661), and the Science and Technology Research Program of Chongqing Municipal Education Commission (no. KJZD-K202101505).
Institutional Review Board Statement
Not applicable.
Informed Consent Statement
Not applicable.
Data Availability Statement
The data used to support the findings of this study are available from the corresponding author upon request.
Conflicts of Interest
The authors declare no conflict of interest.
References
- Wei, M.; Dai, F.; Liu, Y. Influences of Loading Method and Notch Type on Rock Fracture Toughness Measurements: From the Perspectives of T-Stress and Fracture Process Zone. Rock Mech. Rock Eng. 2021, 54, 4965–4986. [Google Scholar] [CrossRef]
- Song, Y.; Ma, H.; Yang, J. Dynamic Mechanical Behaviors and Failure Mechanism of Lignite under SHPB Compression Test. Sustainability 2022, 14, 10528. [Google Scholar] [CrossRef]
- Liu, C.Y.; Yang, J.X.; Yu, B. Rock-breaking mechanism and experimental analysis of confined blasting of borehole surrounding rock. Int. J. Min. Sci. Techno. 2017, 27, 795–801. [Google Scholar] [CrossRef]
- Chen, G.Q.; Li, T.B.; Zhang, G.F. Temperature effect of rock burst for hard rock in deep-buried tunnel. Nat. Hazards 2014, 72, 915–926. [Google Scholar] [CrossRef]
- Chen, G.Q.; Tang, P.; Huang, R.Q. Critical tension crack depth in rockslides that conform to the three-section mechanism. Landslides 2021, 18, 79–88. [Google Scholar] [CrossRef]
- Khoshouei, M.; Bagherpour, R.; Jalalian, M.H. Investigating the acoustic signs of different rock types based on the values of acoustic signal RMS. Rud.-Geološkonaftni Zb. 2020, 35, 29–38. [Google Scholar] [CrossRef]
- Yari, M.; Bagherpour, R.; Khoshouei, M. Developing a novel model for predicting geomechanical features of carbonate rocks based on acoustic frequency processing during drilling. Bull. Eng. Geol. Environ. 2019, 78, 1747–1759. [Google Scholar] [CrossRef]
- Khoshouei, M.; Bagherpour, R. Application of Acoustic Emission (AE) in mining and earth sciences: A review. Rud.-Geološkonaftni Zb. 2019, 34, 19–31. [Google Scholar] [CrossRef]
- Cheon, D.S.; Jeon, S.; Park, C. An experimental study on the brittle failure under true triaxial conditions. Tunn. Undergr. Space Technol. 2006, 21, 448–449. [Google Scholar] [CrossRef]
- Han, Z.Y.; Xie, S.J.; Li, D.Y. Dynamic mechanical behavior of rocks containing double elliptical inclusions at various inclination angles. Theor. Appl. Frac. Mec. 2022, 121, 103544. [Google Scholar] [CrossRef]
- Liu, X.H.; Dai, F.; Zhang, R. Static and dynamic uniaxial compression tests on coal rock considering the bedding directivity. Environ. Earth Sci. 2015, 73, 5933–5949. [Google Scholar] [CrossRef]
- Zarastvand, M.R.; Asadijafari, M.H.; Talebitooti, R. Acoustic wave transmission characteristics of stiffened composite shell systems with double curvature. Compos. Struct. 2022, 292, 115688. [Google Scholar] [CrossRef]
- Hasan, S.; Mohamadreza, Z.; Roohollah, T. Acoustic insulation characteristics of sandwich composite shell systems with double curvature: The effect of nature of viscoelastic core. J. Vib. Control 2022, 1–15. [Google Scholar] [CrossRef]
- Liu, Y.; Dai, F. A review of experimental and theoretical research on the deformation and failure behavior of rocks subjected to cyclic loading. J. Rock Mech. Geotech. Eng. 2021, 13, 1203–1230. [Google Scholar] [CrossRef]
- Li, D.Y.; Han, Z.Y.; Sun, X.L. Dynamic Mechanical Properties and Fracturing Behavior of Marble Specimens Containing Single and Double Flaws in SHPB Tests. Rock Mech. Rock Eng. 2019, 52, 1623–1643. [Google Scholar] [CrossRef]
- Wong, R.H.C.; Chau, K.T. Crack coalescence in a rock-like material containing two cracks. Int. J. Rock Mech. Min. Sci. 1998, 35, 147–164. [Google Scholar] [CrossRef]
- Zou, C.J.; Wong, L.N.Y.; Loo, J.J. Different mechanical and cracking behaviors of single-flawed brittle gypsum specimens under dynamic and quasi-static loadings. Eng. Geol. 2016, 201, 71–84. [Google Scholar] [CrossRef]
- Li, Y.; Cai, W.B.; Li, X.J. Experimental and DEM Analysis on Secondary Crack Types of Rock-Like Material Containing Multiple Flaws under Uniaxial Compression. Appl. Sci. 2019, 9, 1749. [Google Scholar] [CrossRef]
- Peng, F.; Dai, F.; Liu, Y. Effects of strain rate on the mechanical and fracturing behaviors of rock-like specimens containing two unparallel fissures under uniaxial compression. Soil Dyn. Earthq. Eng. 2018, 110, 195–211. [Google Scholar] [CrossRef]
- Cai, W.B.; Li, Y.; Wang, K. Crack propagation mechanism of rock-like specimens containing non-parallel flaws subjected to internal hydraulic pressure and shear loading. Theor. Appl. Frac. Mec. 2022, 119, 103350. [Google Scholar] [CrossRef]
- Zhou, X.P.; Gu, S.Y. Dynamic mechanical properties and cracking behaviours of persistent fractured granite under impact loading with various loading rates. Theor. Appl. Frac. Mec. 2022, 118, 103281. [Google Scholar] [CrossRef]
- Cai, X.; Zhou, Z.L.; Zang, H.Z. Water saturation effects on dynamic behavior and microstructure damage of sandstone: Phenomena and mechanisms. Eng. Geol. 2020, 276, 105760. [Google Scholar] [CrossRef]
- Zhou, Z.L.; Cai, X.; Zhao, Y. Strength characteristics of dry and saturated rock at different strain rates. Trans. Nonferrous Met. Soc. China 2016, 26, 1919–1925. [Google Scholar] [CrossRef]
- Zhang, X.H.; Chiu, Y.W.; Hao, H. Dynamic compressive properties of Kalgoorlie basalt rock. Int. J. Rock Mech. Min. Sci. 2020, 135, 104512. [Google Scholar] [CrossRef]
- Xia, K.W.; Yao, W. Dynamic rock tests using split Hopkinson (Kolsky) bar system-A review. J. Rock Mech. Geotech. Eng. 2015, 7, 27–59. [Google Scholar] [CrossRef]
- Dai, F.; Sheng, H.; Xia, K. Some Fundamental Issues in Dynamic Compression and Tension Tests of Rocks Using Split Hopkinson Pressure Bar. Rock Mech. Rock Eng. 2010, 43, 657–666. [Google Scholar] [CrossRef]
- Shu, P.Y.; Li, H.H.; Wang, T.T. Dynamic strength of rock with single planar joint under various loading rates at various angles of loads applied. J. Rock Mech. Geotech. Eng. 2018, 10, 545–554. [Google Scholar] [CrossRef]
- Peng, F.; Dai, F.; Shuai, K.W. Dynamic mechanical behaviors of pre-fractured sandstone with noncoplanar and unparallel flaws. Mech. Mater. 2022, 166, 104219. [Google Scholar] [CrossRef]
- Deng, Y.; Chen, M.; Jin, Y. Theoretical analysis and experimental research on the energy dissipation of rock crushing based on fractal theory. J. Nat. Gas Sci. Eng. 2016, 33, 231–239. [Google Scholar] [CrossRef]
- Wang, Y.Y.; Deng, H.C.; Deng, Y. Study on crack dynamic evolution and damage-fracture mechanism of rock with pre-existing cracks based on acoustic emission location. J. Petrol Sci. Eng. 2021, 201, 108420. [Google Scholar] [CrossRef]
- Lockner, D. The role of acoustic emission in the study of rock fracture. Int. J. Rock Mech. Min. Sci. Geomech. Abstr. 1993, 30, 883–899. [Google Scholar] [CrossRef]
- Nemat-Nasser, S.; Horii, H. Compression-Induced Nonplanar Crack Extension with Application to Splitting, Exfoliation, and Rockburst. Int. J. Rock Mech. Min. Sci. Geomech. Abstr. 1982, 87, 6805–6821. [Google Scholar] [CrossRef]
- Li, Y.P.; Wang, Y.H.; Chen, L.Z. Experimental research on pre-cracked marble under compression. Int. J. Solid Struct. 2005, 42, 2505–2516. [Google Scholar] [CrossRef]
- Cao, R.H.; Cao, P.; Lin, H. Mechanical Behavior of Brittle Rock-Like Specimens with Pre-existing Fissures Under Uniaxial Loading: Experimental Studies and Particle Mechanics Approach. Rock Mech. Rock Eng. 2016, 49, 763–783. [Google Scholar] [CrossRef]
- Zou, C.J.; Wong, L.N.Y. Experimental studies on cracking processes and failure in marble under dynamic loading. Eng. Geol. 2014, 173, 19–31. [Google Scholar] [CrossRef]
- Yan, Z.L.; Dai, F.; Liu, Y. Experimental investigations of the dynamic mechanical properties and fracturing behavior of cracked rocks under dynamic loading. Bull. Eng. Geol. Environ. 2020, 79, 5535–5552. [Google Scholar] [CrossRef]
- Chen, G.Q.; Li, H.; Wei, T. Searching for multistage sliding surfaces based on the discontinuous dynamic strength reduction method. Eng. Geol. 2021, 286, 106086. [Google Scholar] [CrossRef]
- Wu, H.; Zhao, G.Y.; Zhang, W.Z. Dynamic mechanical characteristics and failure modes of sandstone with artificial surface cracks. J. Cent. South Univ. 2019, 50, 350–359. [Google Scholar]
- Zhou, Y.X.; Xia, K.; Li, X.B. Suggested methods for determining the dynamic strength parameters and mode-I fracture toughness of rock materials. Int. J. Rock Mech. Min. Sci. 2011, 49, 105–112. [Google Scholar] [CrossRef]
- Li, X.B.; Lok, T.S.; Zhao, J. Dynamic Characteristics of Granite Subjected to Intermediate Loading Rate. Rock Mech. Rock Eng. 2005, 38, 21–39. [Google Scholar] [CrossRef]
- Li, D.Y.; Cheng, T.J.; Zhou, T. Experimental study of the dynamic strength and fracturing characteristics of marble specimens with a single hole under impact loading. Chin. J. Rock Mech. Eng. 2015, 34, 249–260. [Google Scholar] [CrossRef]
- Yao, W.; Xu, Y.; Wang, W. Dependence of Dynamic Tensile Strength of Longyou Sandstone on Heat-Treatment Temperature and Loading Rate. Rock Mech. Rock Eng. 2016, 49, 3899–3915. [Google Scholar] [CrossRef]
- Zhou, Z.L.; Cai, X.; Zhou, J. Mechanical properties of saturated sandstone under different loading rates. Chin. J. Rock Mech. Eng. 2018, 37, 4069–4075. [Google Scholar] [CrossRef]
- Zhou, Z.L.; Cai, X.; Ma, D. Water saturation effects on dynamic fracture behavior of sandstone. Int. J. Rock Mech. Min. Sci. 2019, 114, 46–61. [Google Scholar] [CrossRef]
- Lundberg, B. A split Hopkinson bar study of energy absorption in dynamic rock fragmentation. Int. J. Rock Mech. Min. Sci. Geomech. Abstr. 1976, 13, 187–197. [Google Scholar] [CrossRef]
- Yu, Y.Q.; Zhang, W.L.; Fan, L.D. Strain rate effect and energy dissipation characteristics of sandstone in coal measures under impact loading. J. China Coal Soc. 2021, 46, 2281–2293. [Google Scholar] [CrossRef]


Disclaimer/Publisher’s Note: The statements, opinions and data contained in all publications are solely those of the individual author(s) and contributor(s) and not of MDPI and/or the editor(s). MDPI and/or the editor(s) disclaim responsibility for any injury to people or property resulting from any ideas, methods, instructions or products referred to in the content. |
© 2023 by the authors. Licensee MDPI, Basel, Switzerland. This article is an open access article distributed under the terms and conditions of the Creative Commons Attribution (CC BY) license (https://creativecommons.org/licenses/by/4.0/).