Article

State Monitoring and Fault Diagnosis of HVDC System via KNN Algorithm with Knowledge Graph: A Practical China Power Grid Case

1
EHV Power Transmission Company of China Southern Power Grid Co., Ltd., Guangzhou 510000, China
2
Maintenance and Test Center of CSG EHV Power Transmission Company of China Southern Power Grid Co., Ltd., Guangzhou 510000, China
3
EHV Power Transmission Company of China Southern Power Grid Co., Ltd., Dali Bureau, Dali 671000, China
*
Author to whom correspondence should be addressed.
Sustainability 2023, 15(4), 3717; https://doi.org/10.3390/su15043717
Submission received: 4 January 2023 / Revised: 12 February 2023 / Accepted: 13 February 2023 / Published: 17 February 2023
(This article belongs to the Topic Smart Energy)

Abstract

:
Based on the four sets of faults data measured in the practical LCC-HVDC transmission project of China Southern Power Grid Tianshengqiao (Guangxi Province, China)–Guangzhou (Guangdong Province, China) HVDC transmission project, a fault diagnosis method based on the K-nearest neighbor (KNN) algorithm is proposed for an HVDC system. This method can effectively and accurately identify four different fault types, aiming to contribute to construction of a future HVDC system knowledge graph (KG). First, function and significance of fault diagnosis for KG are introduced, along with four specific fault scenarios. Then, the fault data are normalized, classified into a training set and a test set, and labeled. Based on this, the KNN fault diagnosis model is established and Euclidean distance (ED) is selected as the metric function of the KNN algorithm. Finally, the training data are conveyed to the model for training and testing, upon which the diagnosis result obtained by the KNN algorithm with a knowledge graph is compared with that of the support vector machine (SVM) algorithm and Bayesian classifier (BC). The simulation results show that the KNN algorithm can achieve the highest diagnosis accuracy, with more than 83.3% diagnostic accuracy under multiple test sets among all three diagnosis methods.

1. Introduction

With continuous progress in science, technology, and increasing power demand, a traditional power system can no longer meet power demands in modern society. To deal with these challenges, China has put forward development targets of carbon peaking and carbon neutralization [1,2,3] for environmental protection and energy conservation. Under the current development structure of the power industry, the overall scale of power systems is inevitably expanding with an increase in power demand [4,5], which provides greater challenges to power transmission in terms of transmission power and transmission distance [6]. For power transmission, alternating current (AC) transmission technology has many limitations [7]; e.g., long-distance power transmission tends to lead to large power losses. Therefore, the traditional AC transmission technology struggles to meet transmission demands of future power systems. To remedy the shortcomings of AC transmission technology, direct current (DC) transmission technology, especially high-voltage direct current (HVDC) technology, has achieved breakthrough development and wide application as an efficient and reliable transmission technology in recent years [8,9]. In general, HVDC technology has prominent advantages of large power transmission capacity, simple power regulation, convenient grid interconnection, long power transmission distance, narrow transmission line corridor, etc. Moreover, due to China’s vast territory and uneven energy distribution (mainly distributed in the west), use of an HVDC transmission system can effectively solve the problem of uneven distribution of resources [10,11]. In addition, the power production mode in the west is mostly based on clean energy such that the economically developed eastern region can also protect the environment and reduce carbon emissions by using an HVDC transmission system to transmit electricity to the west. In general, an HVDC system is mainly used for long-distance and high-power transmission thanks to its high efficiency and low costs [12]. However, as a highly complex system, different failures tend to occur during operation [13]. When a fault occurs, it is necessary to judge and diagnose the failure in time to avoid worse situations that could lead to shutdown of the whole system. If power system shutdown happens [14], it will cause huge economic losses to the whole system and affect the power supply for users, reducing the operation stability of the parallel power grid [15] and having a huge impact on the economy, security, and stability of the entire power system, which is far more serious. Therefore, research on fault diagnosis for HVDC systems has significant practical significance and engineering value [16].
With continuous development of smart grid technology, the internal equipment of a power system experiences continuous intelligent and digital transformation. Several intelligent terminals and massive data provide even more challenges to an HVDC system. Regarding a system’s failures, it is very difficult to diagnose and cope with a fault in real time [17]. In this context, an HVDC system knowledge graph (KG) [18] has been developed and applied that can realize data collection, data processing, problem analysis, application services, and data analysis for the entire HVDC system, upon which fault analysis and diagnosis can be realized as some of its most important applications. KG technology will play an increasingly important role in future HVDC system operation since fault diagnosis based on the fault information investigated in this paper can provide core technical support for establishment and improvement of a KG in an HVDC system. In general, fault diagnosis of an HVDC is not only conducive to processing fault information and solving fault problems but can also make a significant contribution to the intelligence and information construction of the entire HVDC system.
At present, the fault diagnosis methods for an HVDC system mainly include analytical-model-based, expert system (ES)-based [19], neural-network-based [20], and support vector machine (SVM)-based methods [21]. Among them, the method based on an analytical model is suitable for establishing a mathematical system model in real time, but its limitation is that the highly complex characteristics of the HVDC system make input of the analytical model highly complex and changeable, which finally influences the output characteristics of the model. The ES-based diagnosis method utilizes the expert system to apply professional knowledge and solve professional practical problems to diagnose a fault but with shortcomings of difficulty in obtaining internal knowledge and low intelligence level. The neural-network-based method has excellent nonlinear mapping ability and high robustness, while its calculation is more complex and the construction process requires higher equipment requirements. The SVM-based method is suitable for solving small-sample problems and has good robustness but is not suitable for multi-classification problems. Thus far, a variety of research on HVDC fault diagnosis has been proposed; for instance, in [22], aiming to improve the nonlinearity and high controllability of an HVDC system, S changes are made to DC voltage waveform to achieve fault feature extraction, and then SVM is used to establish a fault diagnosis model for fault diagnosis. A study in the literature [23] applies convolutional neural networks (CNN) to diagnose faults in an HVDC transmission system. By constructing a network structure of fault diagnosis, the network hierarchy is used to optimize the training parameters and fault estimation is carried out with the aim of realizing minimum cross-entropy. The literature [24] aims at commutation failure fault of an HVDC system, in which the current signals on the inverter side under different fault conditions are collected and then sample entropy is applied to extract characteristics as the input of the Elman network to diagnose a line short circuit fault and system commutation failure fault. Further, ref. [25] adopts the cosine of the included angle between normal features and fault features to select wavelet bases to extract converter fault features in HVDC systems, and then bird swarm algorithm (BSA) is utilized to optimize AdaBoost-SVM for fault diagnosis. Simulation results show that this method is more robust and accurate than conventional SVM methods. In [26], the parallel CNN-LSTM deep learning model optimized by sparrow search algorithm (SSA) was established, which can considerably enhance fault diagnosis accuracy. Although the aforementioned methods more or less have their own advantages, their limitations are also distinctive, such as complex diagnosis models, high modeling costs, and slow diagnosis speed.
For the fault diagnosis problem of an HVDC system, because the probability of HVDC system failure is not high and the fault dataset is small, the K-nearest neighbor (KNN) algorithm is very suitable for solving such small data sample problems. More importantly, the KNN algorithm is faster and more accurate than the current commonly used algorithm based on a simpler fault diagnosis model. Moreover, at present, there are few cases of fault diagnosis for an actual HVDC system based on the fault data monitored from an actual HVDC system; thus, this paper can provide great relevance and engineering value for future applications in real HVDC system fault engineering.
In this paper, a fault diagnosis model of an HVDC transmission system based on the KNN algorithm [27] is proposed that has advantages of high diagnostic speed and accuracy under small-sample data. By establishing a KNN fault diagnosis model and normalizing the fault data, the input model is used for fault diagnosis and then compared with the results obtained by Bayesian classifier (BC) [28] and SVM. The simulation results show that the method proposed in this paper has higher diagnostic accuracy and speed with a simple diagnosis model. Accurate and rapid fault diagnosis of HVDC system faults is conducive to subsequent intelligent construction and update of an HVDC system, which can also make a significant contribution to construction of core modules of an HVDC system KG.

2. HVDC System Knowledge Graph

With the increasing demand for electricity and the expanding scale of power systems, intelligent upgrading and digital transformation of equipment in power systems are also accelerating. As an emerging power system technology in recent years, HVDC technology has brought huge challenges to production personnel, with many intelligent terminals and massive data, resulting in huge bottleneck constraints in DC operation and maintenance of an HVDC system. Moreover, regarding massive data, lack of repository and carrier will lead to lack of datasets and intelligent means in fault analysis and diagnosis. By establishing KG, a very large base of intelligence and knowledge sources can be provided for fault diagnosis of HVDC systems, which can effectively improve efficiency of fault diagnosis [29].
Construction of an HVDC system KG mainly includes six steps, as shown in Figure 1, which mainly include knowledge acquisition, knowledge analysis, knowledge base establishment, graph construction, knowledge service, and knowledge application [30].

2.1. Knowledge Acquisition

In an HVDC system, the knowledge sources are extremely complex. Some data are the operation and maintenance data of the HVDC system, as well as some engineering data or technical breakthrough data. Due to the diversity of knowledge source paths, it is necessary to classify various knowledge sources in the process of building the graph. In addition, there are multiple data transfer methods. In an HVDC system, some data are in text format, such as various technical research materials, while some data are in Excel format, such as temperature and humidity of some equipment, and some data are in some picture types, such as the fault waveform obtained from the fault recorder. Due to the variety of ways in which data can be carried, it is necessary to create corresponding knowledge bases for storage, which can increase the efficiency of the whole KG.

2.2. Knowledge Analysis

The process of knowledge analysis mainly includes document analysis of various types of knowledge based on the diversity of knowledge-bearing methods, followed by understanding their content and extracting information. This allows the most useful information to be extracted, reduces the volume of data to a certain extent, and then performs a structural analysis. It concentrates mainly on unifying analysis of data in different formats into chapter titles, paragraphs, tables, atlases, and other physical objects and hierarchical relationships, and, finally, cleaning up the data, which can effectively clean up some of the miscellaneous information in the data source and improve the efficiency of the overall database [31].

2.3. Knowledge Base Establishment

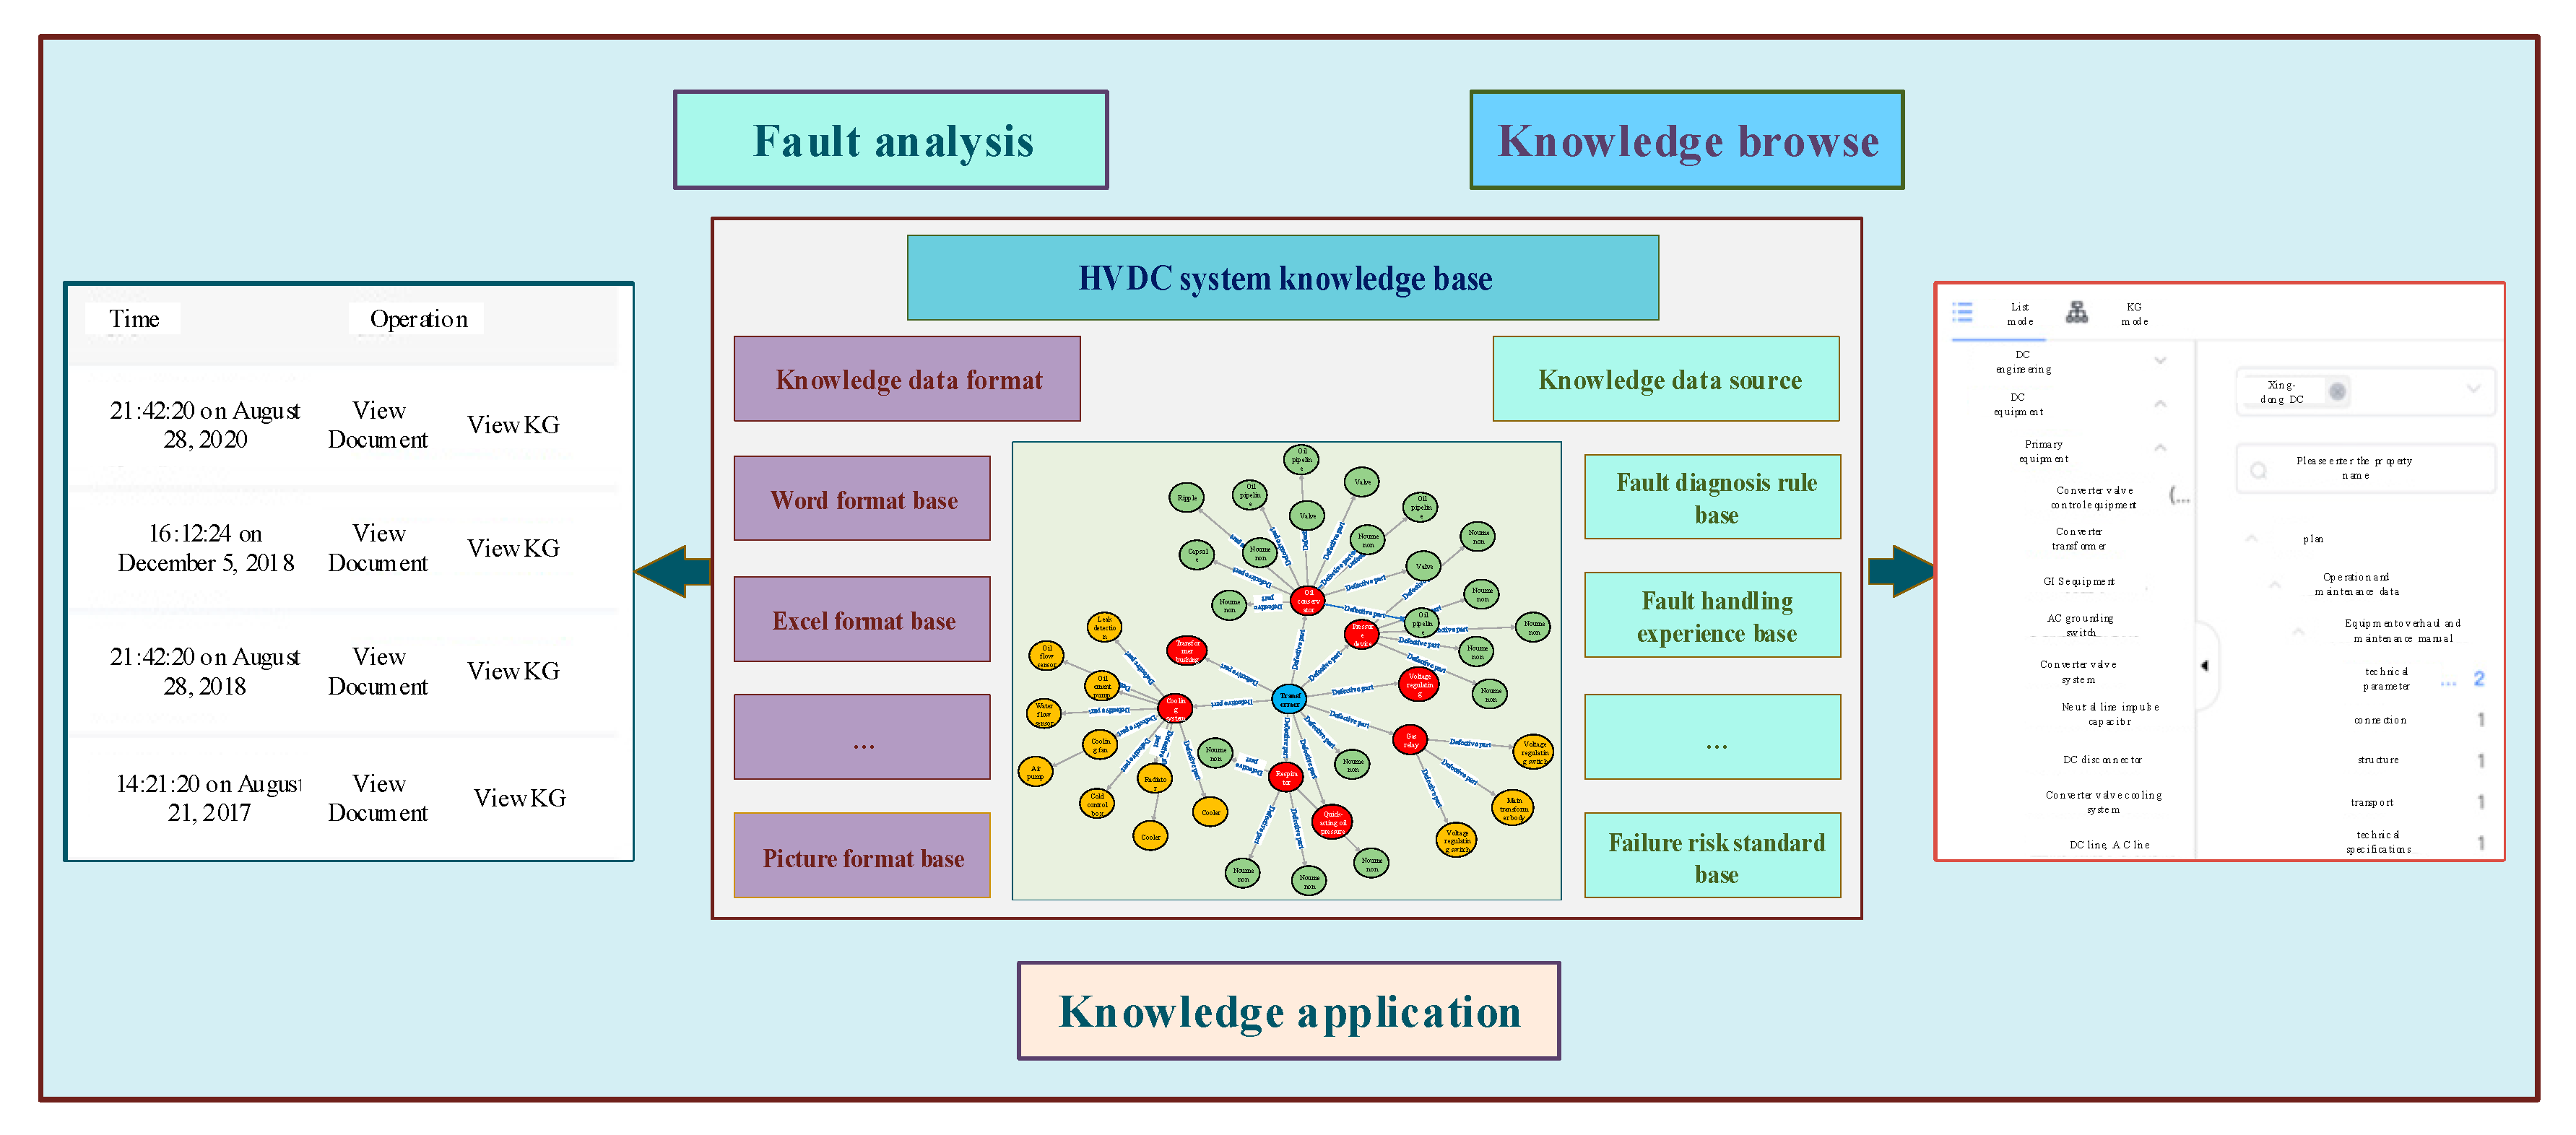
The knowledge base is the core of KG, and corresponding types of databases need to be established for various types of data, which can be roughly divided into two categories according to the types of knowledge data. The first type is the source of knowledge data, which, in the general HVDC system, mainly includes some power industry standards and specifications, operation and maintenance strategies, DC encyclopedia, and some fault data. From this perspective, a special knowledge base can be established. The second is the format of knowledge data. At present, the main formats of knowledge data are Word, Excel, txt, and picture. The corresponding knowledge base is established according to the classification principle of the same data format type, which can greatly improve efficiency of calling the knowledge base when browsing and retrieving knowledge in the later stage. Classification of the knowledge base is shown in Figure 2.

2.4. Graph Construction

For all kinds of knowledge data obtained above, it is necessary to establish the relationship among them, which is the premise for later application of KG to analyze and solve problems. The second is to integrate knowledge, whose purpose is mainly to integrate entities from different databases, which can unify entity expression and clarify relationship direction. Then, the corresponding data association and expansion, as well as data discovery and update, can serve for the subsequent data update of the whole KG and the whole knowledge system at night and finally data training and adaptation.

2.5. Knowledge Service

The process of knowledge service focuses on searching, aggregating, analyzing, computing, and visualizing knowledge on the basis of established knowledge bases and the atlas established. The traditional fault processing information retrieval method can only be completed by keyword decomposition and matching and cannot deeply understand and process the information of the problem. However, establishment of the knowledge atlas can express fault knowledge in the form of a graph, accurately express the relationship between knowledge, graph specific concepts and entities, and further process and use knowledge through knowledge aggregation, knowledge analysis, and calculation. Visualization can greatly improve utilization of the entire KG, making it more popular and understandable in the use process.

2.6. Knowledge Application

Knowledge application is the purpose of KG construction. This process mainly includes knowledge browsing, operation and maintenance strategy management of HVDC system, accident and event analysis management, repair and maintenance management, etc. Through application of knowledge, accidents can be quickly and accurately located. With the combination of monitored fault data and KG, causes of faults can be quickly found and the faults can be solved, which can significantly improve the management, operation, maintenance level, and efficiency of an VDC system. Application of knowledge is shown in Figure 3.
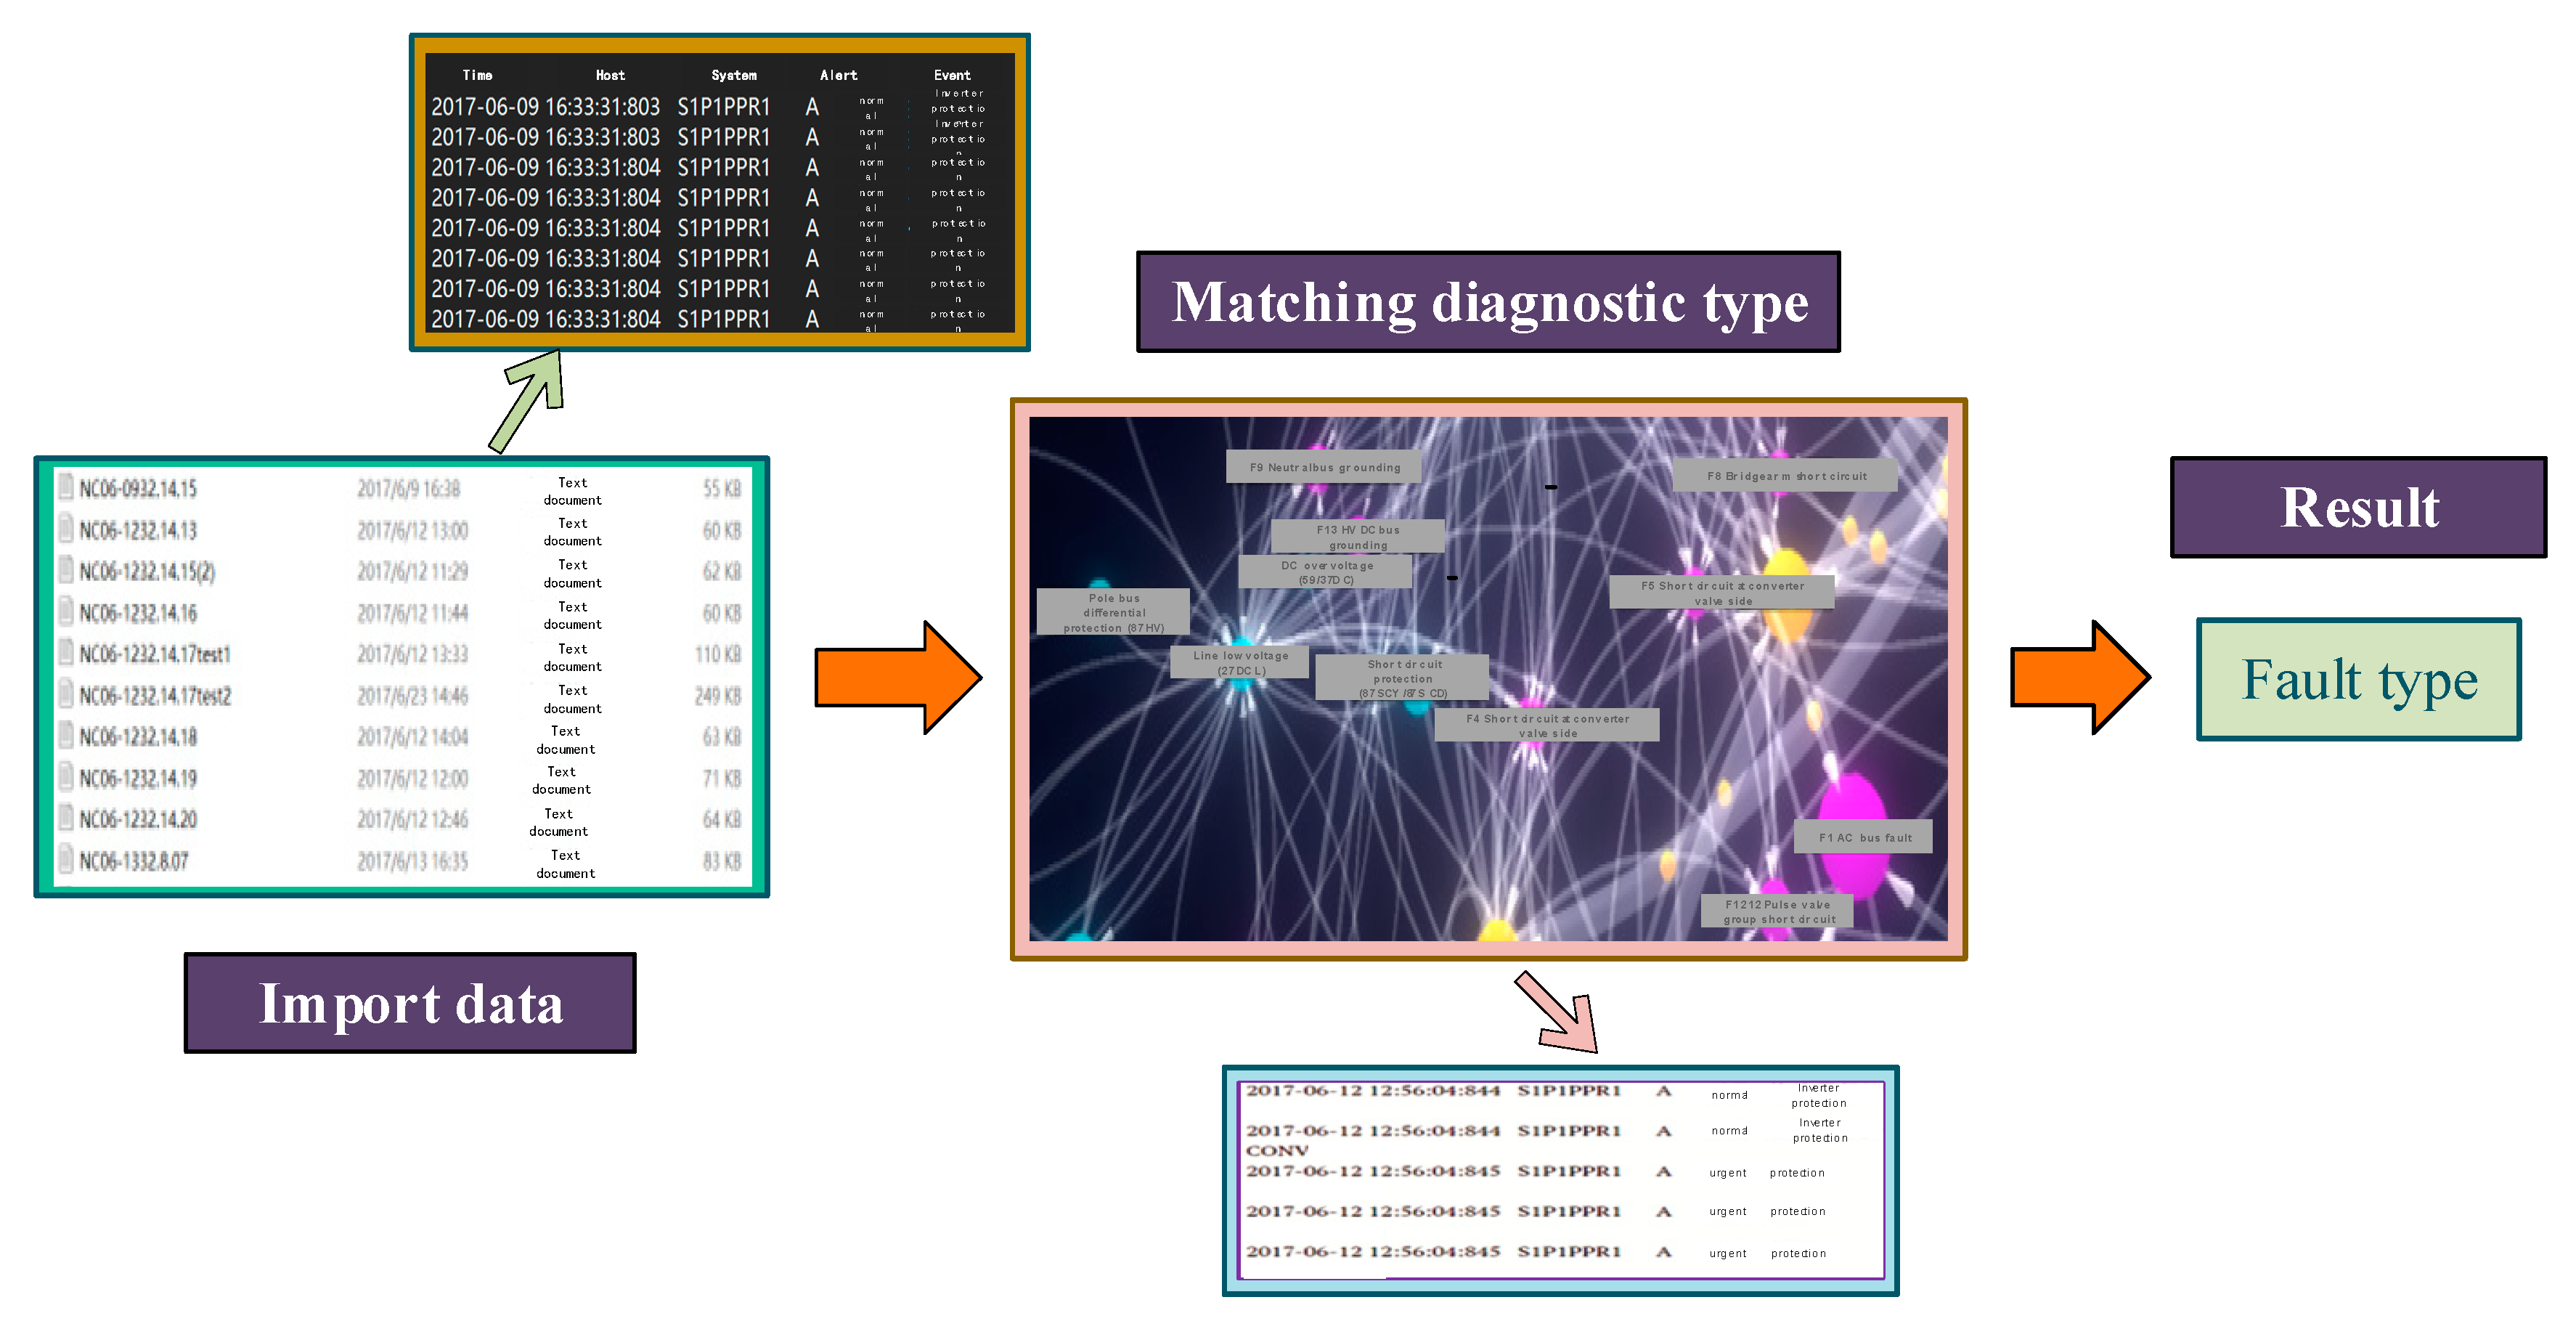
Construction of an HVDC system KG plays a great role in promoting development of the whole power system, and its relationship with the fault diagnosis in this paper is that fault diagnosis is one of the core purposes of establishment of KG, while the practical application of the combination of fault diagnosis and KG is shown in Figure 4. By diagnosing various types of faults and building them within KG [32], faults can be quickly and accurately analyzed when similar faults occur in the future, which greatly improves the intelligence of power system operation management.

3. Fault Classification

An HVDC system is mainly composed of converter station, transmission line, and grounding system. Among them, the converter station is the core of HVDC system, and its internal structure is complex. As more and more HVDC projects are put into operation, their fault risks are gradually increasing. HVDC transmission systems have various fault types, such as DC fault, converter fault, converter commutation failure, etc. This paper mainly applies the KNN algorithm in machine learning to fault diagnosis research for four types of common faults in a power station in Southwest Power Grid, and the four types of faults are introduced in detail below.

3.1. AC Fault

AC faults mainly include converter transformer faults, three-phase faults, and asymmetric faults of AC system [33]. Faults in an AC system will disrupt voltage and frequency balance of a power system and may also lead to subsequent commutation faults in the entire HVDC system converter station and shorten the life of the converter valve [34]. Research on AC fault diagnosis is helpful to realize fault ride-through and reduce commutation failure of HVDC systems. The type of HVDC studied in this paper is LCC-HVDC.

3.2. DC Fault

DC faults are characterized by a wide impact range and high fault currents. At present, it is one of the important factors limiting development of HVDC systems [35]. Among them, the DC transmission line has the highest probability of short circuit to ground fault, which is caused by ground flash discharges, while ground flash on DC transmission lines is mainly due to damage to insulation between the line and the ground and is commonly caused by the phenomenon of lightning strikes. In addition, DC lines also have faults, such as line breaking and high resistance grounding between DC lines and AC lines. In particular, a line-breaking fault is a permanent fault that causes serious damage to the whole system [36].

3.3. Converter Valve Fault

Converter valve faults are mainly caused by equipment faults and operational faults. Equipment failure mainly includes valve control equipment failure and valve body equipment faults. The valve control equipment is one of the cores of the HVDC hierarchical control and is mainly used to convert the control pulse generator of the polar control system into electrical control pulses to generate optical trigger pulses, thus realizing rectification function. Faults in the valve control equipment are mainly caused by component faults and communication interface faults [37]. The valve body is mainly composed of series-connected thyristor levels, optical fiber circuit, and cooling water circuit. The valve body is mainly composed of a series-connected thyristor levels, a fiber-optic circuit, and a cooling water circuit. As the core equipment of the converter station, it is in long-term high-pressure operation. Valve body failures are mainly caused by component failures, leaks, or serious faults caused by valve tower discharge. In case of a fault, the entire DC part needs to be powered off, which is quite harmful. The faults in operation mainly include the valve not opening and the valve opening by mistake. Failure to open the valve is mainly caused by failure or interference in the trigger control circuit of the converter and failure to send a normal trigger pulse. Valve false opening fault is mainly caused by an abnormal trigger pulse generated by interference of the trigger control circuit or an abnormal trigger pulse caused by excessive voltage rise rate of the converter valve [38].

3.4. Commutation Failure

In the presence of reverse voltage, if the commutation process is not completed or the blocking capability is not restored, the valve to be commutated reverses its phase to the valve initially expected to be disconnected when the voltage on the valve side becomes positive. This is a commutation failure [39]; commutation failure of the HVDC system is mainly caused by AC voltage drop, DC current increase, AC system asymmetry fault, etc. In general, when a commutation failure occurs, effects occur such as power frequency component in the current is greater than the setting value, and the fundamental component is detected in the DC system. Occurrence of commutation faults may result in a drop in DC voltage and a short increase in DC current. Severe continuous commutation faults may even lead to derating of the DC system, resulting in serious situations, such as blocked valves or extreme blockages, which can seriously damage system operation [40].

4. Principle of KNN Algorithm

KNN algorithm is one of the most common methods in data mining classification technology. In the KNN algorithm, K sample types are selected by matching the similarity between the known data and the current data to be classified. If K samples are consistent, it can be determined that the samples to be classified belong to this category. There are three main factors influencing KNN classification algorithm: training dataset, the distance between data to be classified and known category data, and K value [41]. The schematic diagram of KNN algorithm is shown in Figure 5.
Common distance measurement functions include: Mahalanobis distance [42], Chebyshev distance, Euclidean distance (ED) [43,44], and Manhattan distance [45], as follows.
(1).
Mahalanobis distance
d = i = 1 N ( x i y i ) 2 S i 2
(2).
Chebyshev distance
d = max ( | x 1 y 1 | , | x 2 y 2 | , , | x i y i | , | x N y N | )
(3).
ED
d = i = 1 N | x i y i |
(4).
Manhattan distance
d = i = 1 N ( x i y i ) 2
where d is the distance between samples; N is the number of samples; S i is the standard deviation of the sample data in the i-th dimension; x and y represent the coordinate position of the sample.
In the classification process, select K samples that are most similar to the test samples in the training set, calculate the weight of each category in the latest K samples, and classify the samples to the category with the highest weight by comparing the weights. Among them, the weight calculation method in KNN algorithm is as follows and the implementation process of KNN algorithm is shown in Table 1.
w ( x i , y i ) = 1 d ( x i , y i )
The reason why KNN algorithm is selected in this paper is that it shows high speed when applied to small-sample problems, and the research object of this paper is based on fault data obtained from actual HVDC system operation. Probability of HVDC system failure is low and system power supply reliability is very high, at about 99.7116% [46]; hence, the amount of data is small and application of KNN algorithm is very suitable.

5. Fault Diagnosis Model

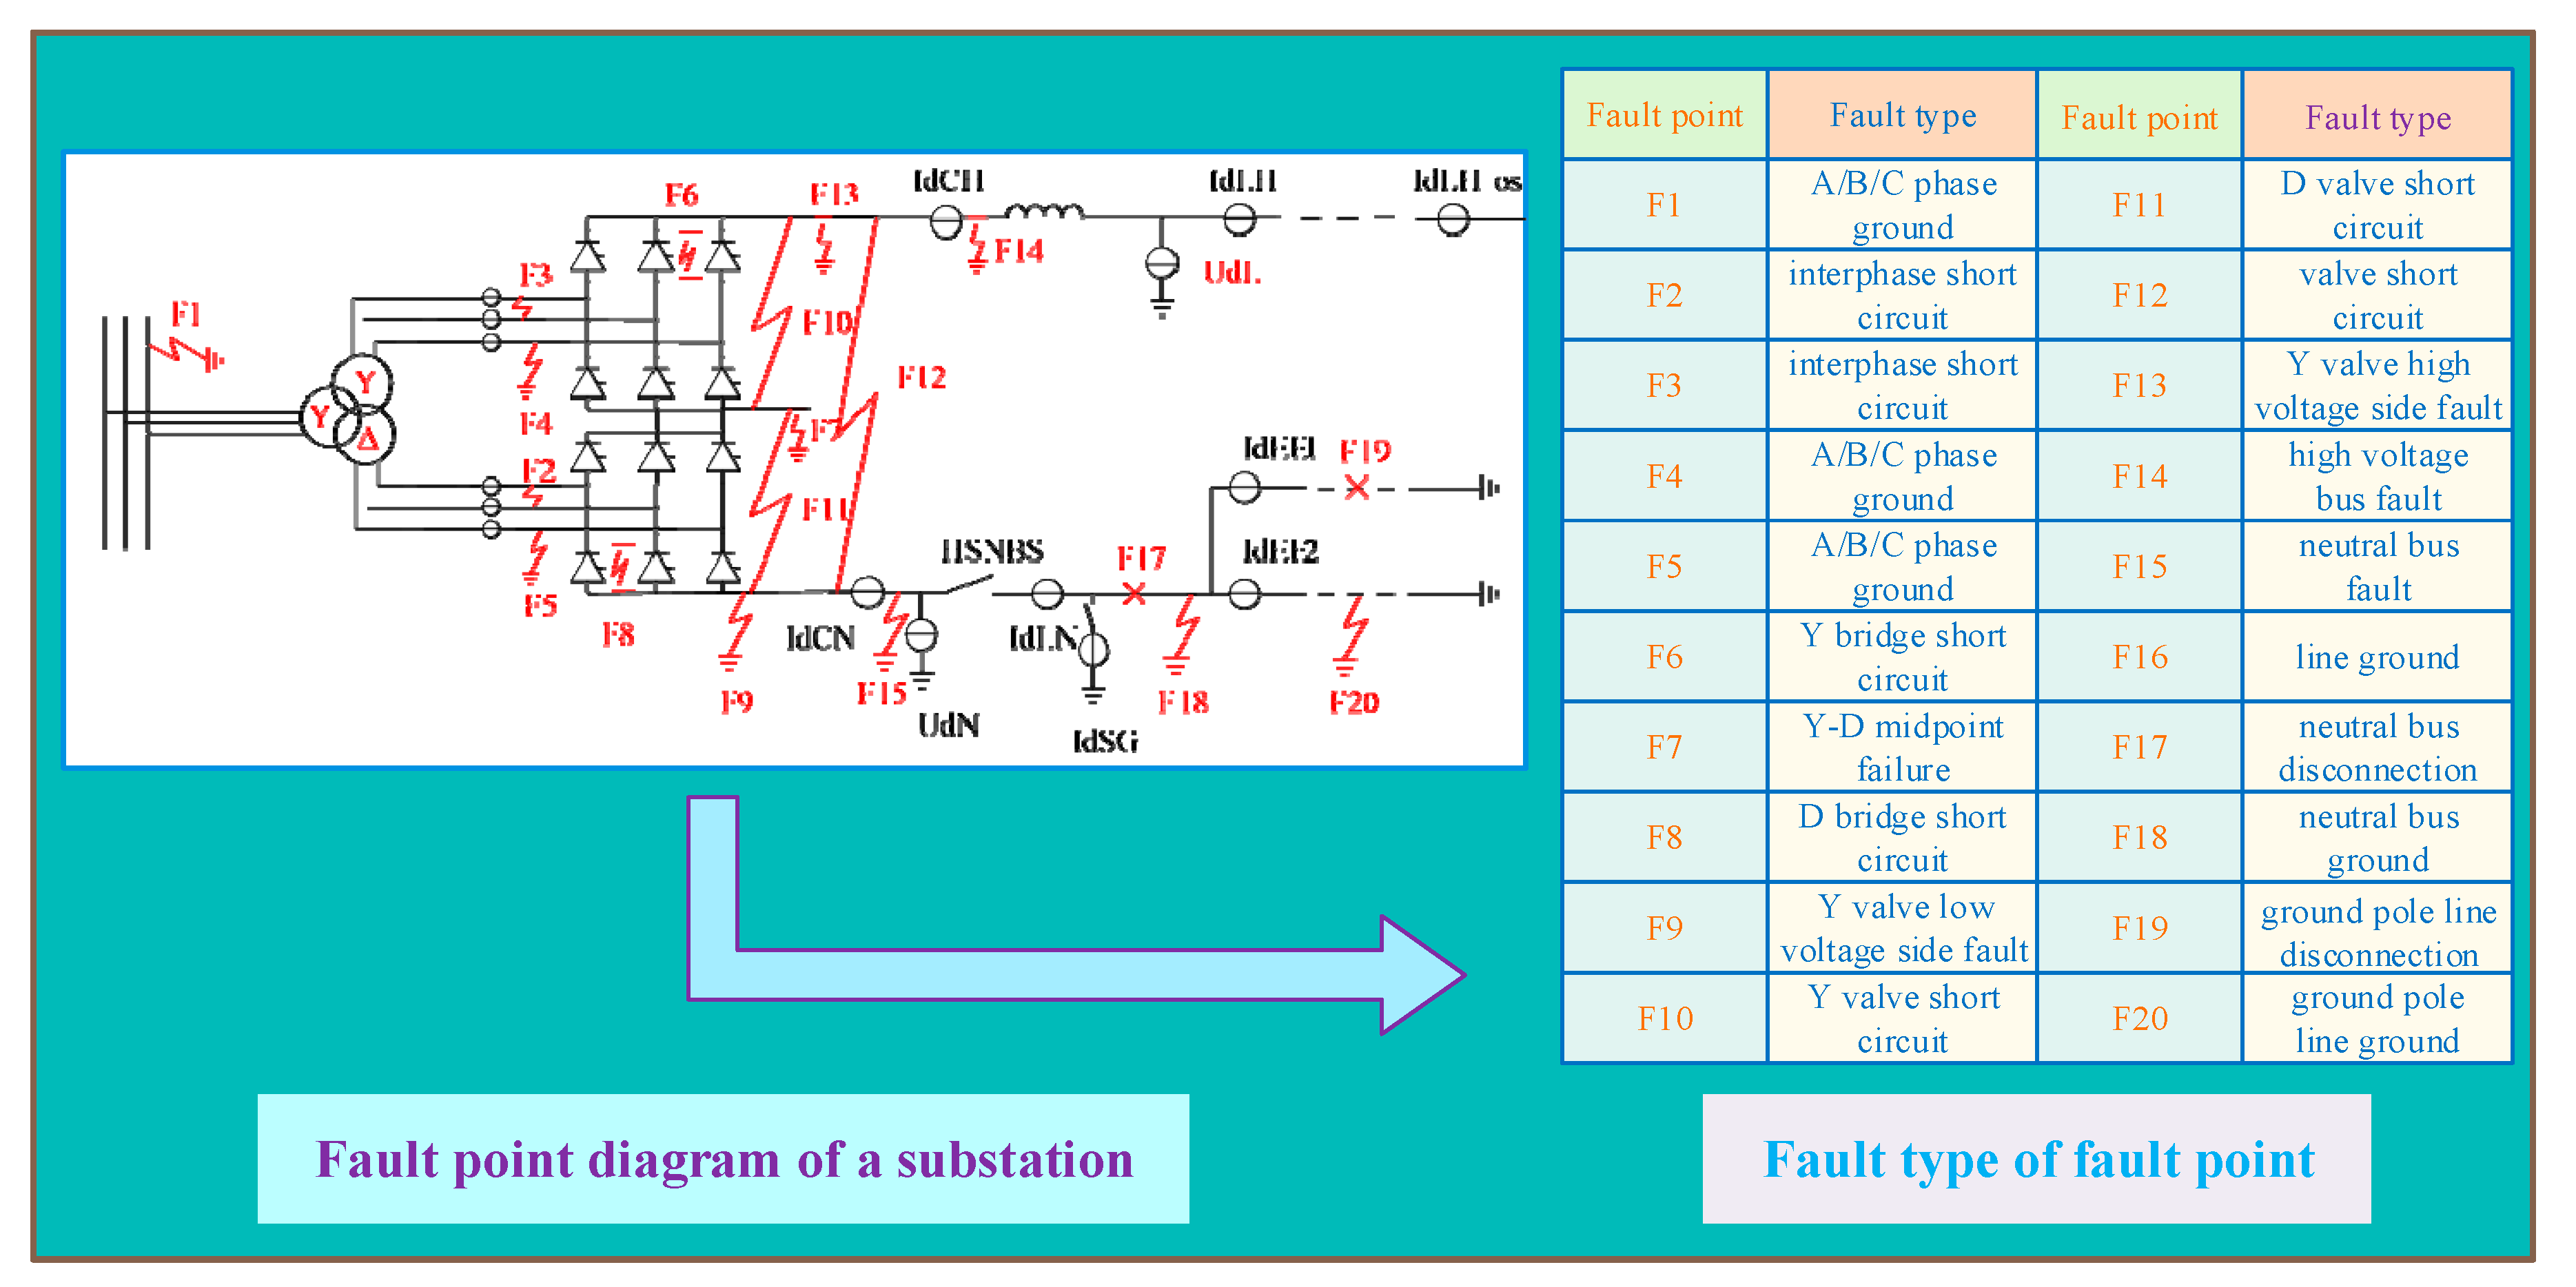
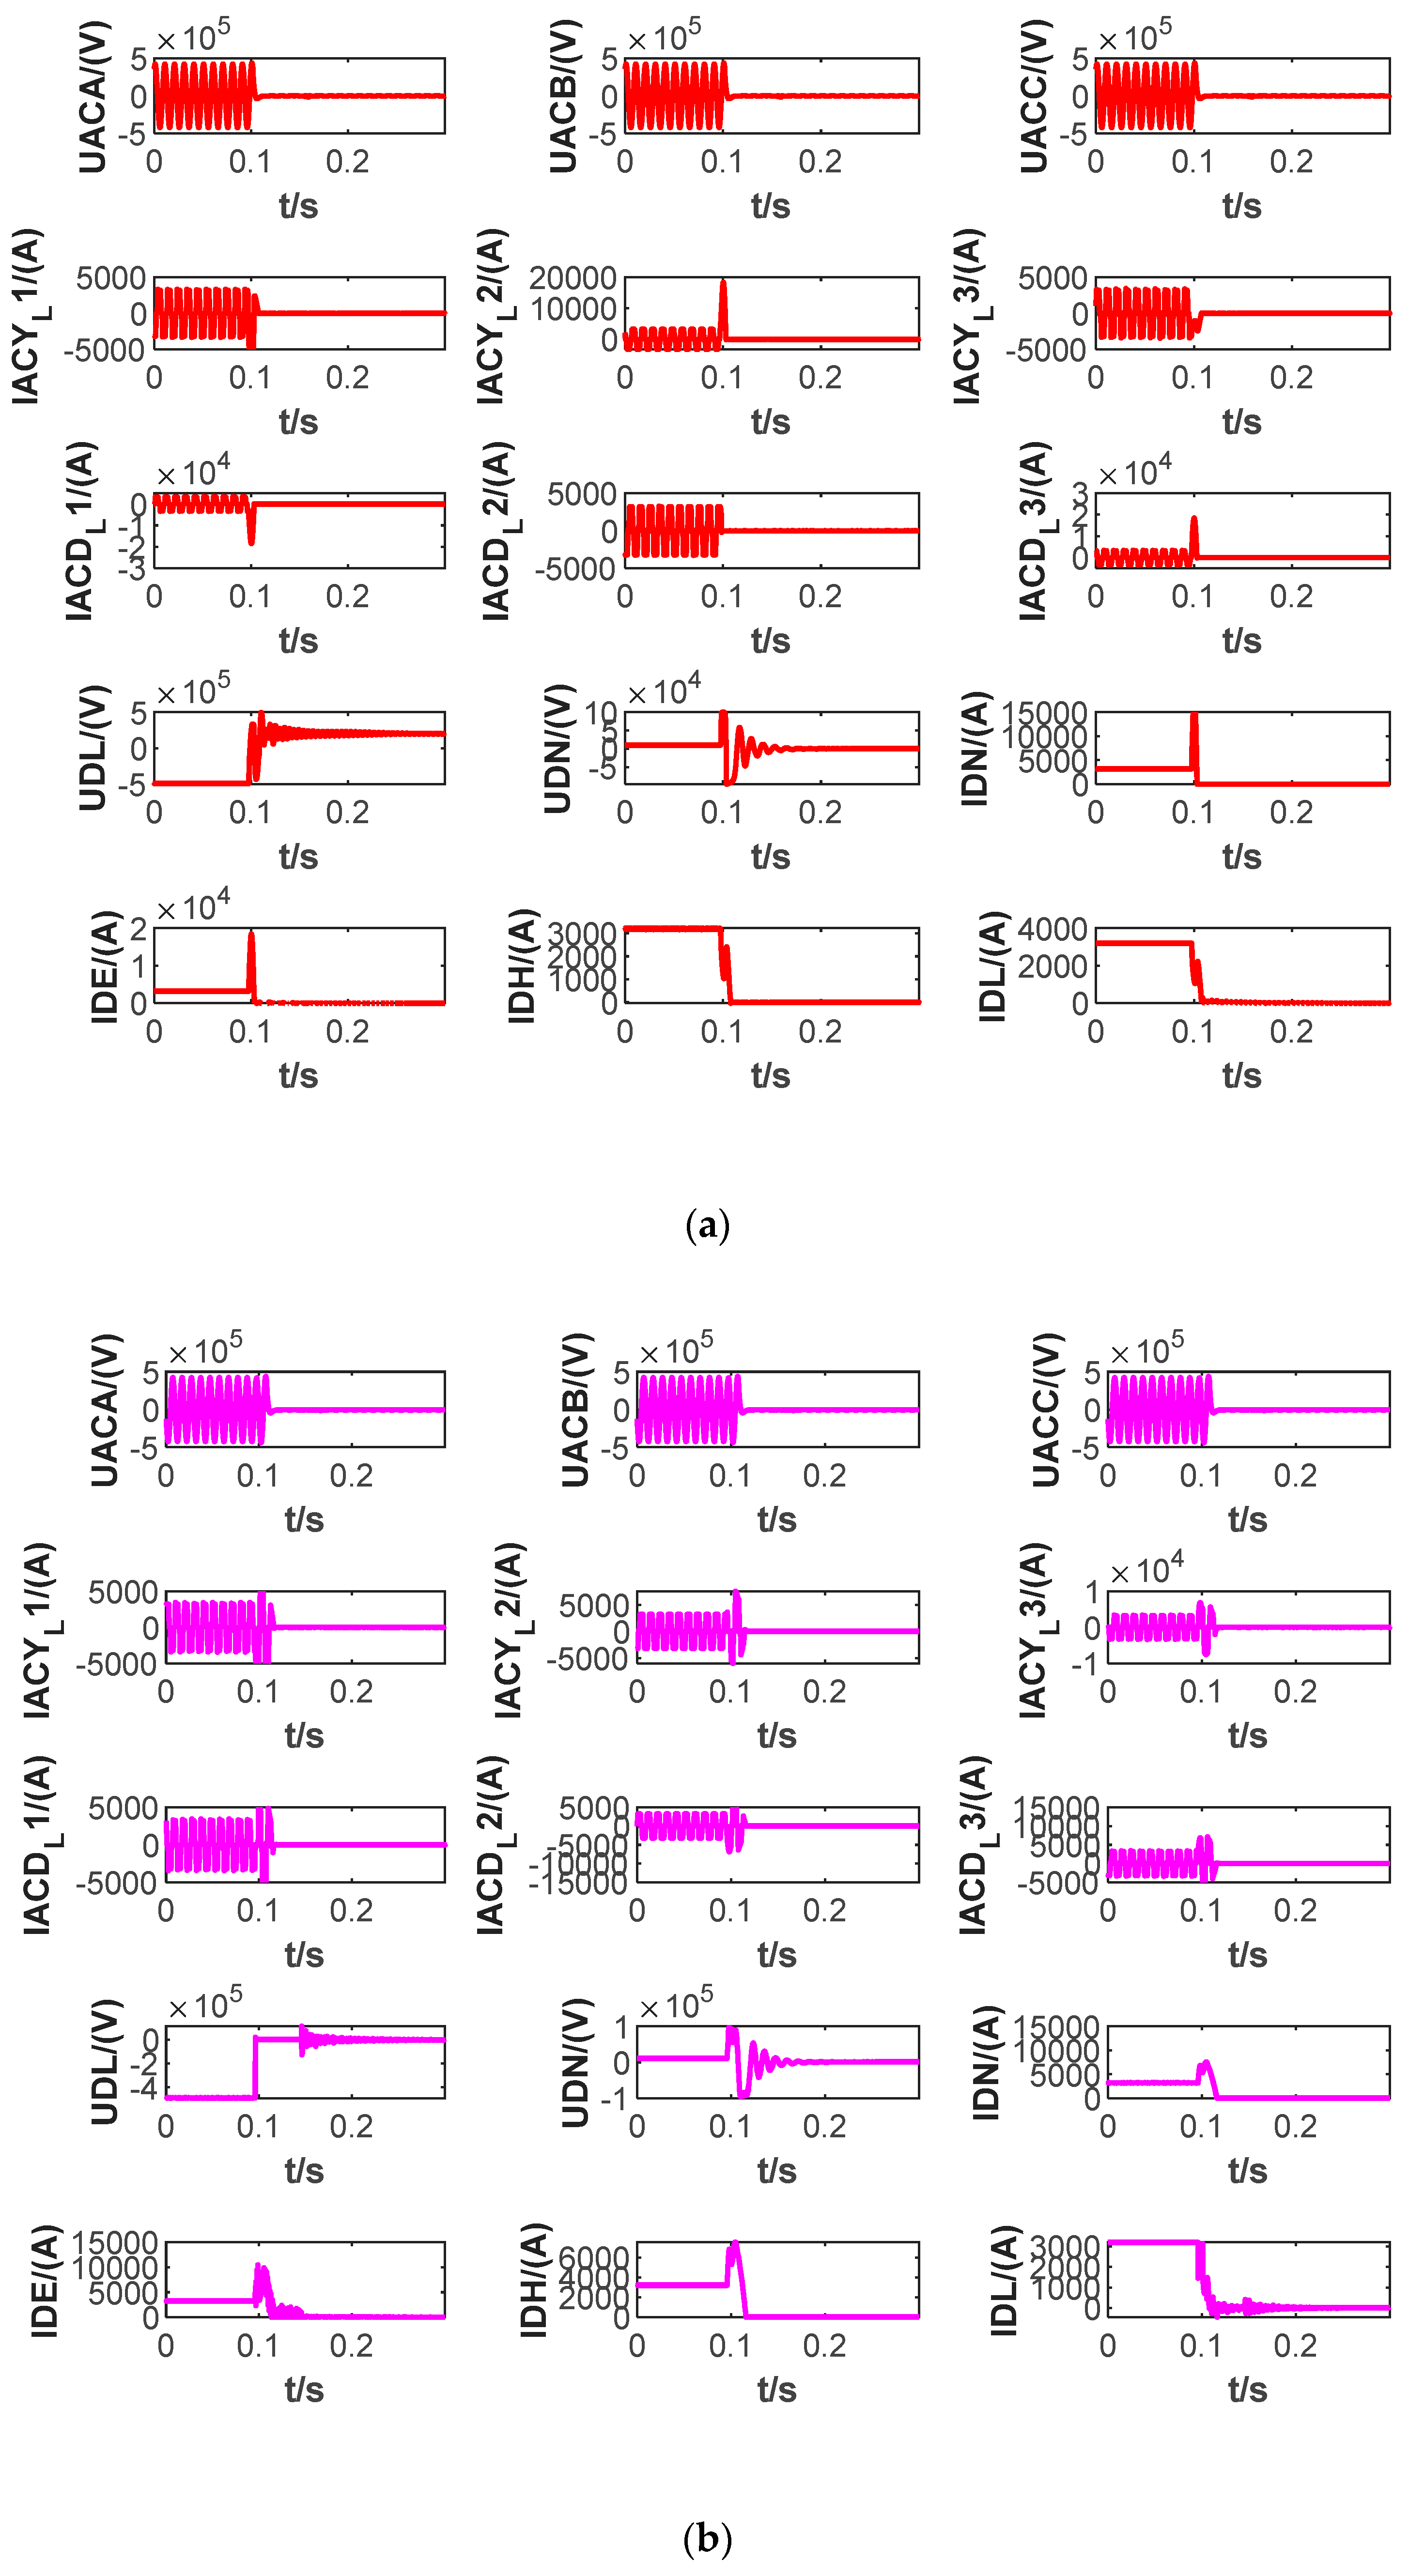
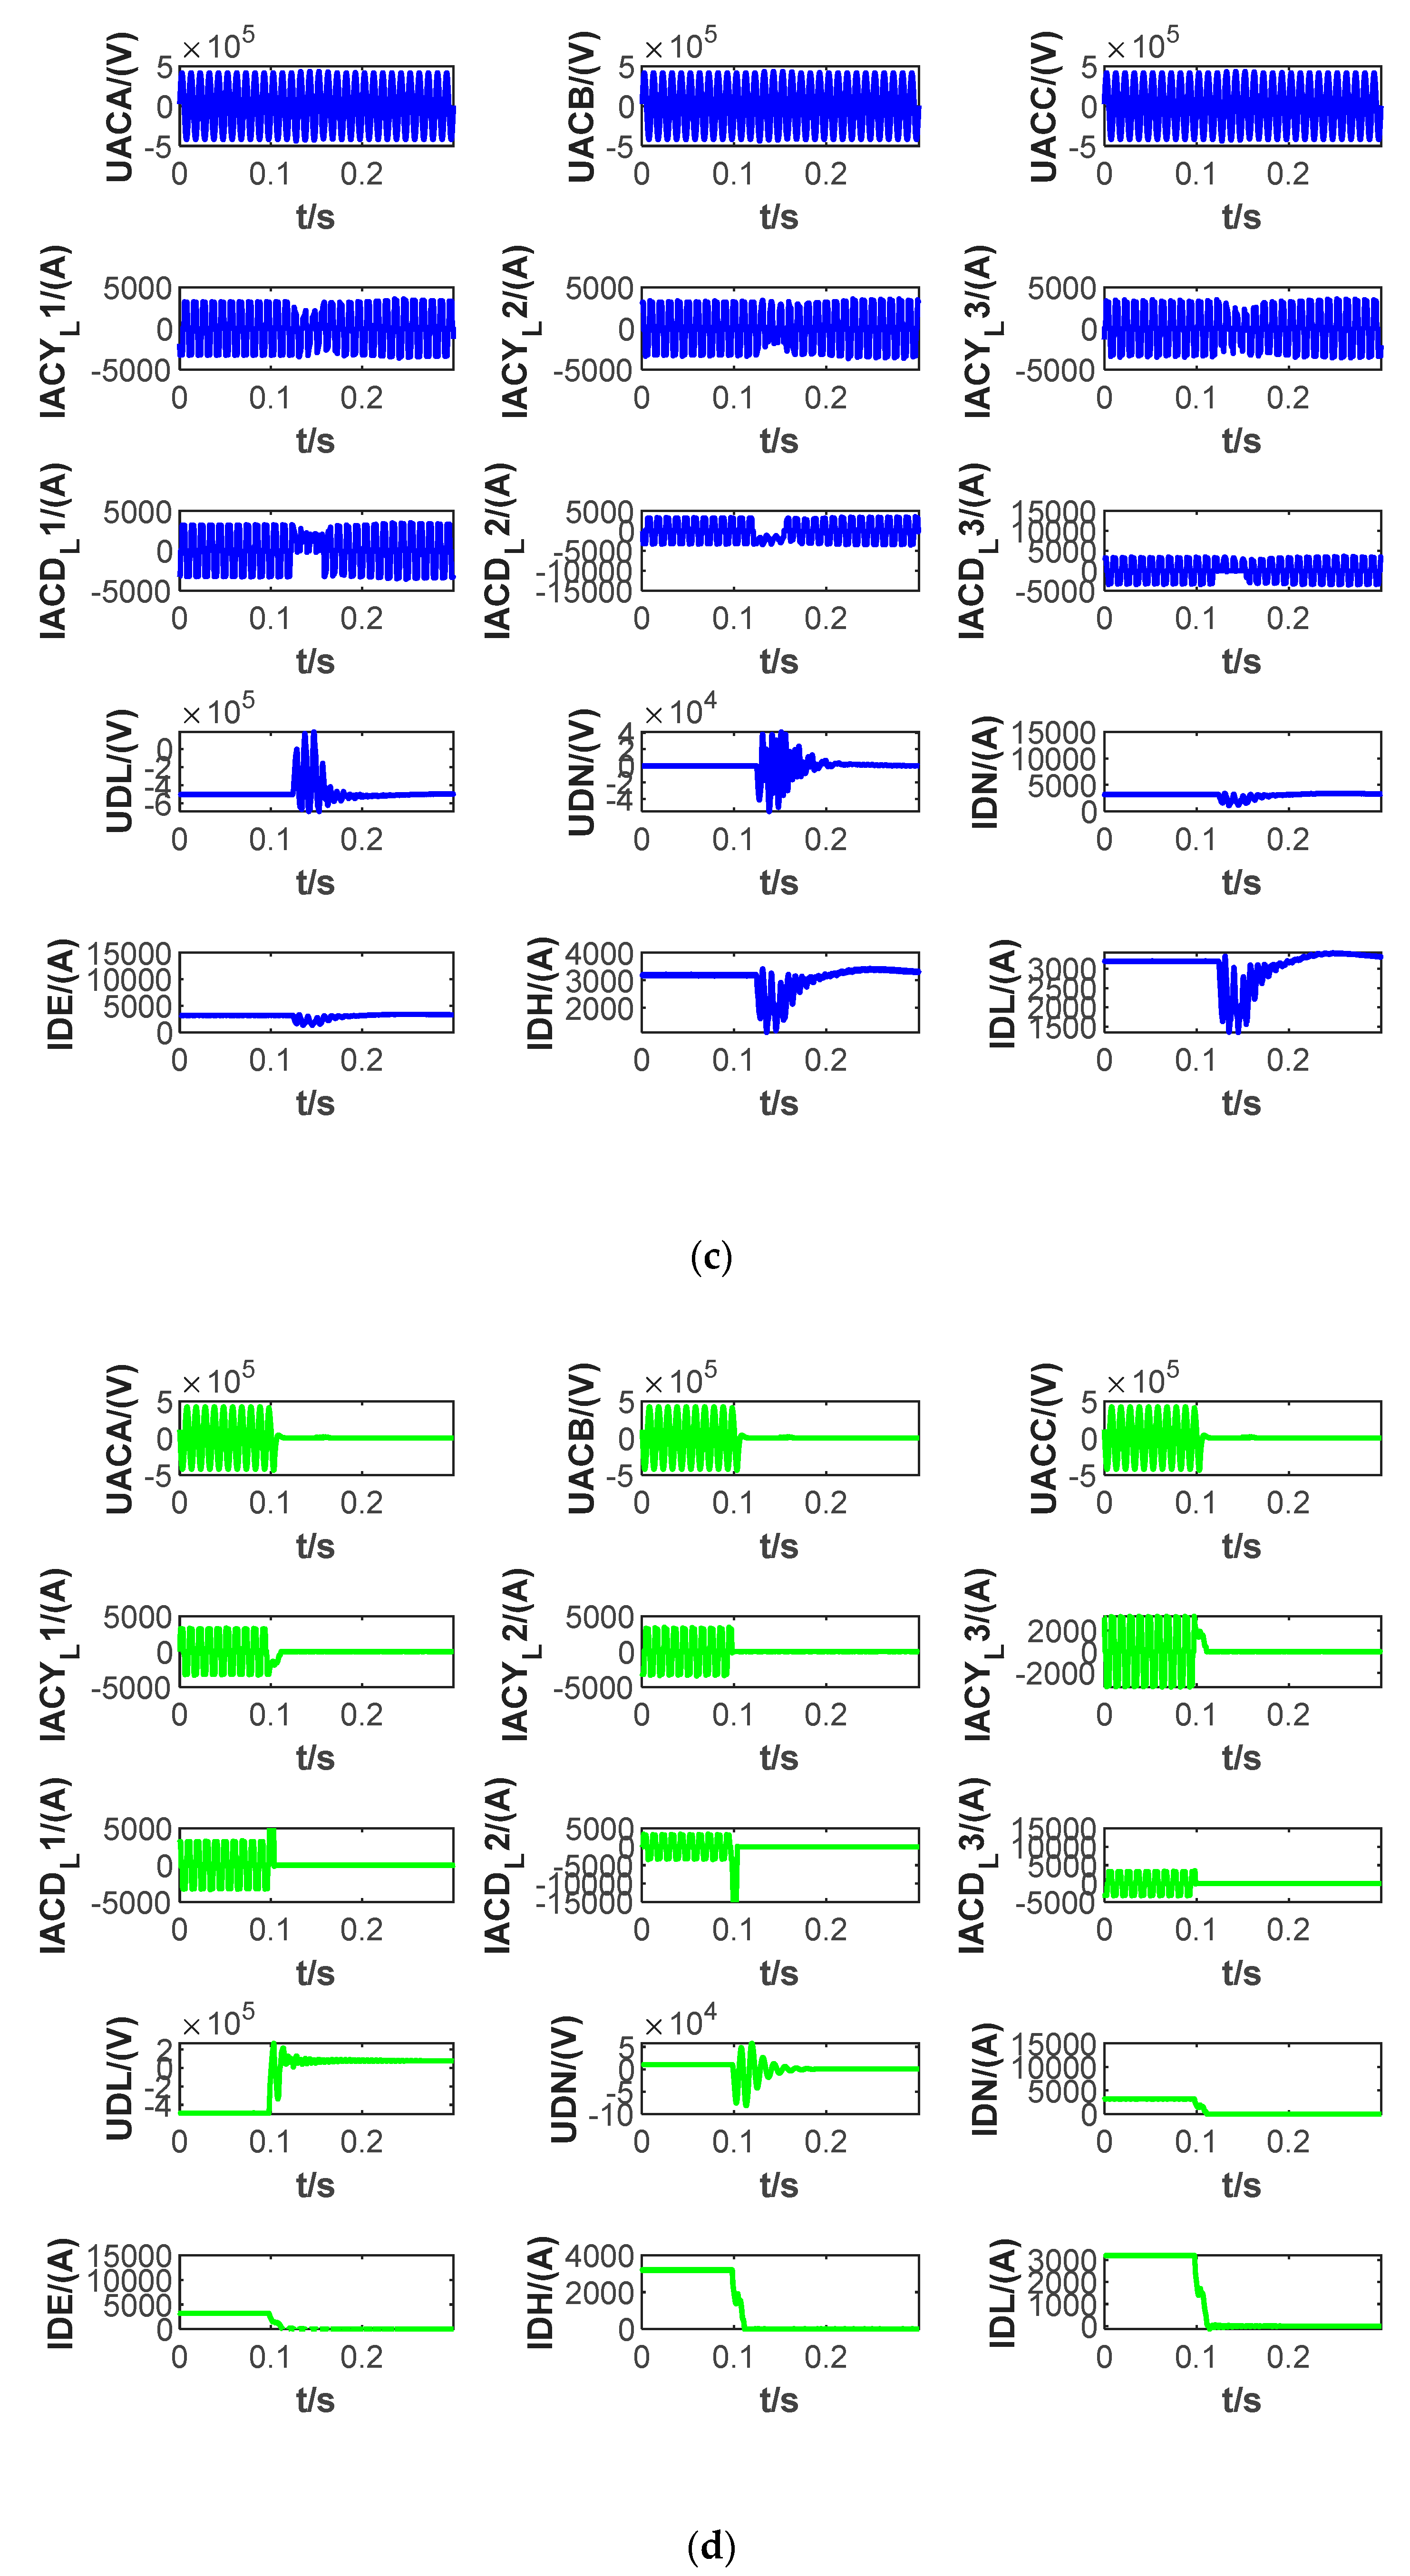
In this section, based on the measured fault data of HVDC transmission system of China Southern Power Grid, the actual HVDC system is named Tianshengqiao (Guangxi Province, China)–Guangzhou (Guangdong Province, China) Transmission Project, the voltage level of the project is ±500 kV, with a total length of 960 km and a rated power of 1800 MW, and the actual circuit diagram of the HVDC project is shown in Figure 6. The project has been in operation since 2001, and the data in this paper are from the fault data monitored by the project in the past three years. The KNN algorithm is used to realize fault diagnosis function for fault data, and the common fault points and fault types in an HVDC system are shown in Figure 7. In the actual fault dataset, the total extraction time of fault oscillograph data is 0.3 s. In the extraction of the recording data, 15 representative signal channels are sorted out. The waveforms of fifteen channels of four types of faults in an HVDC transmission system are shown in Figure 8.
AC fault, DC fault, and commutation failure fault occur in about 0.1 s, while commutation valve fault occurs in about 0.15 s. The meaning of each signal channel in Figure 8 is shown in Table 2. Among them, each signal shows the physical quantities at different positions in the HVDC system, which are affected during system operation and will dramatically change under failures.
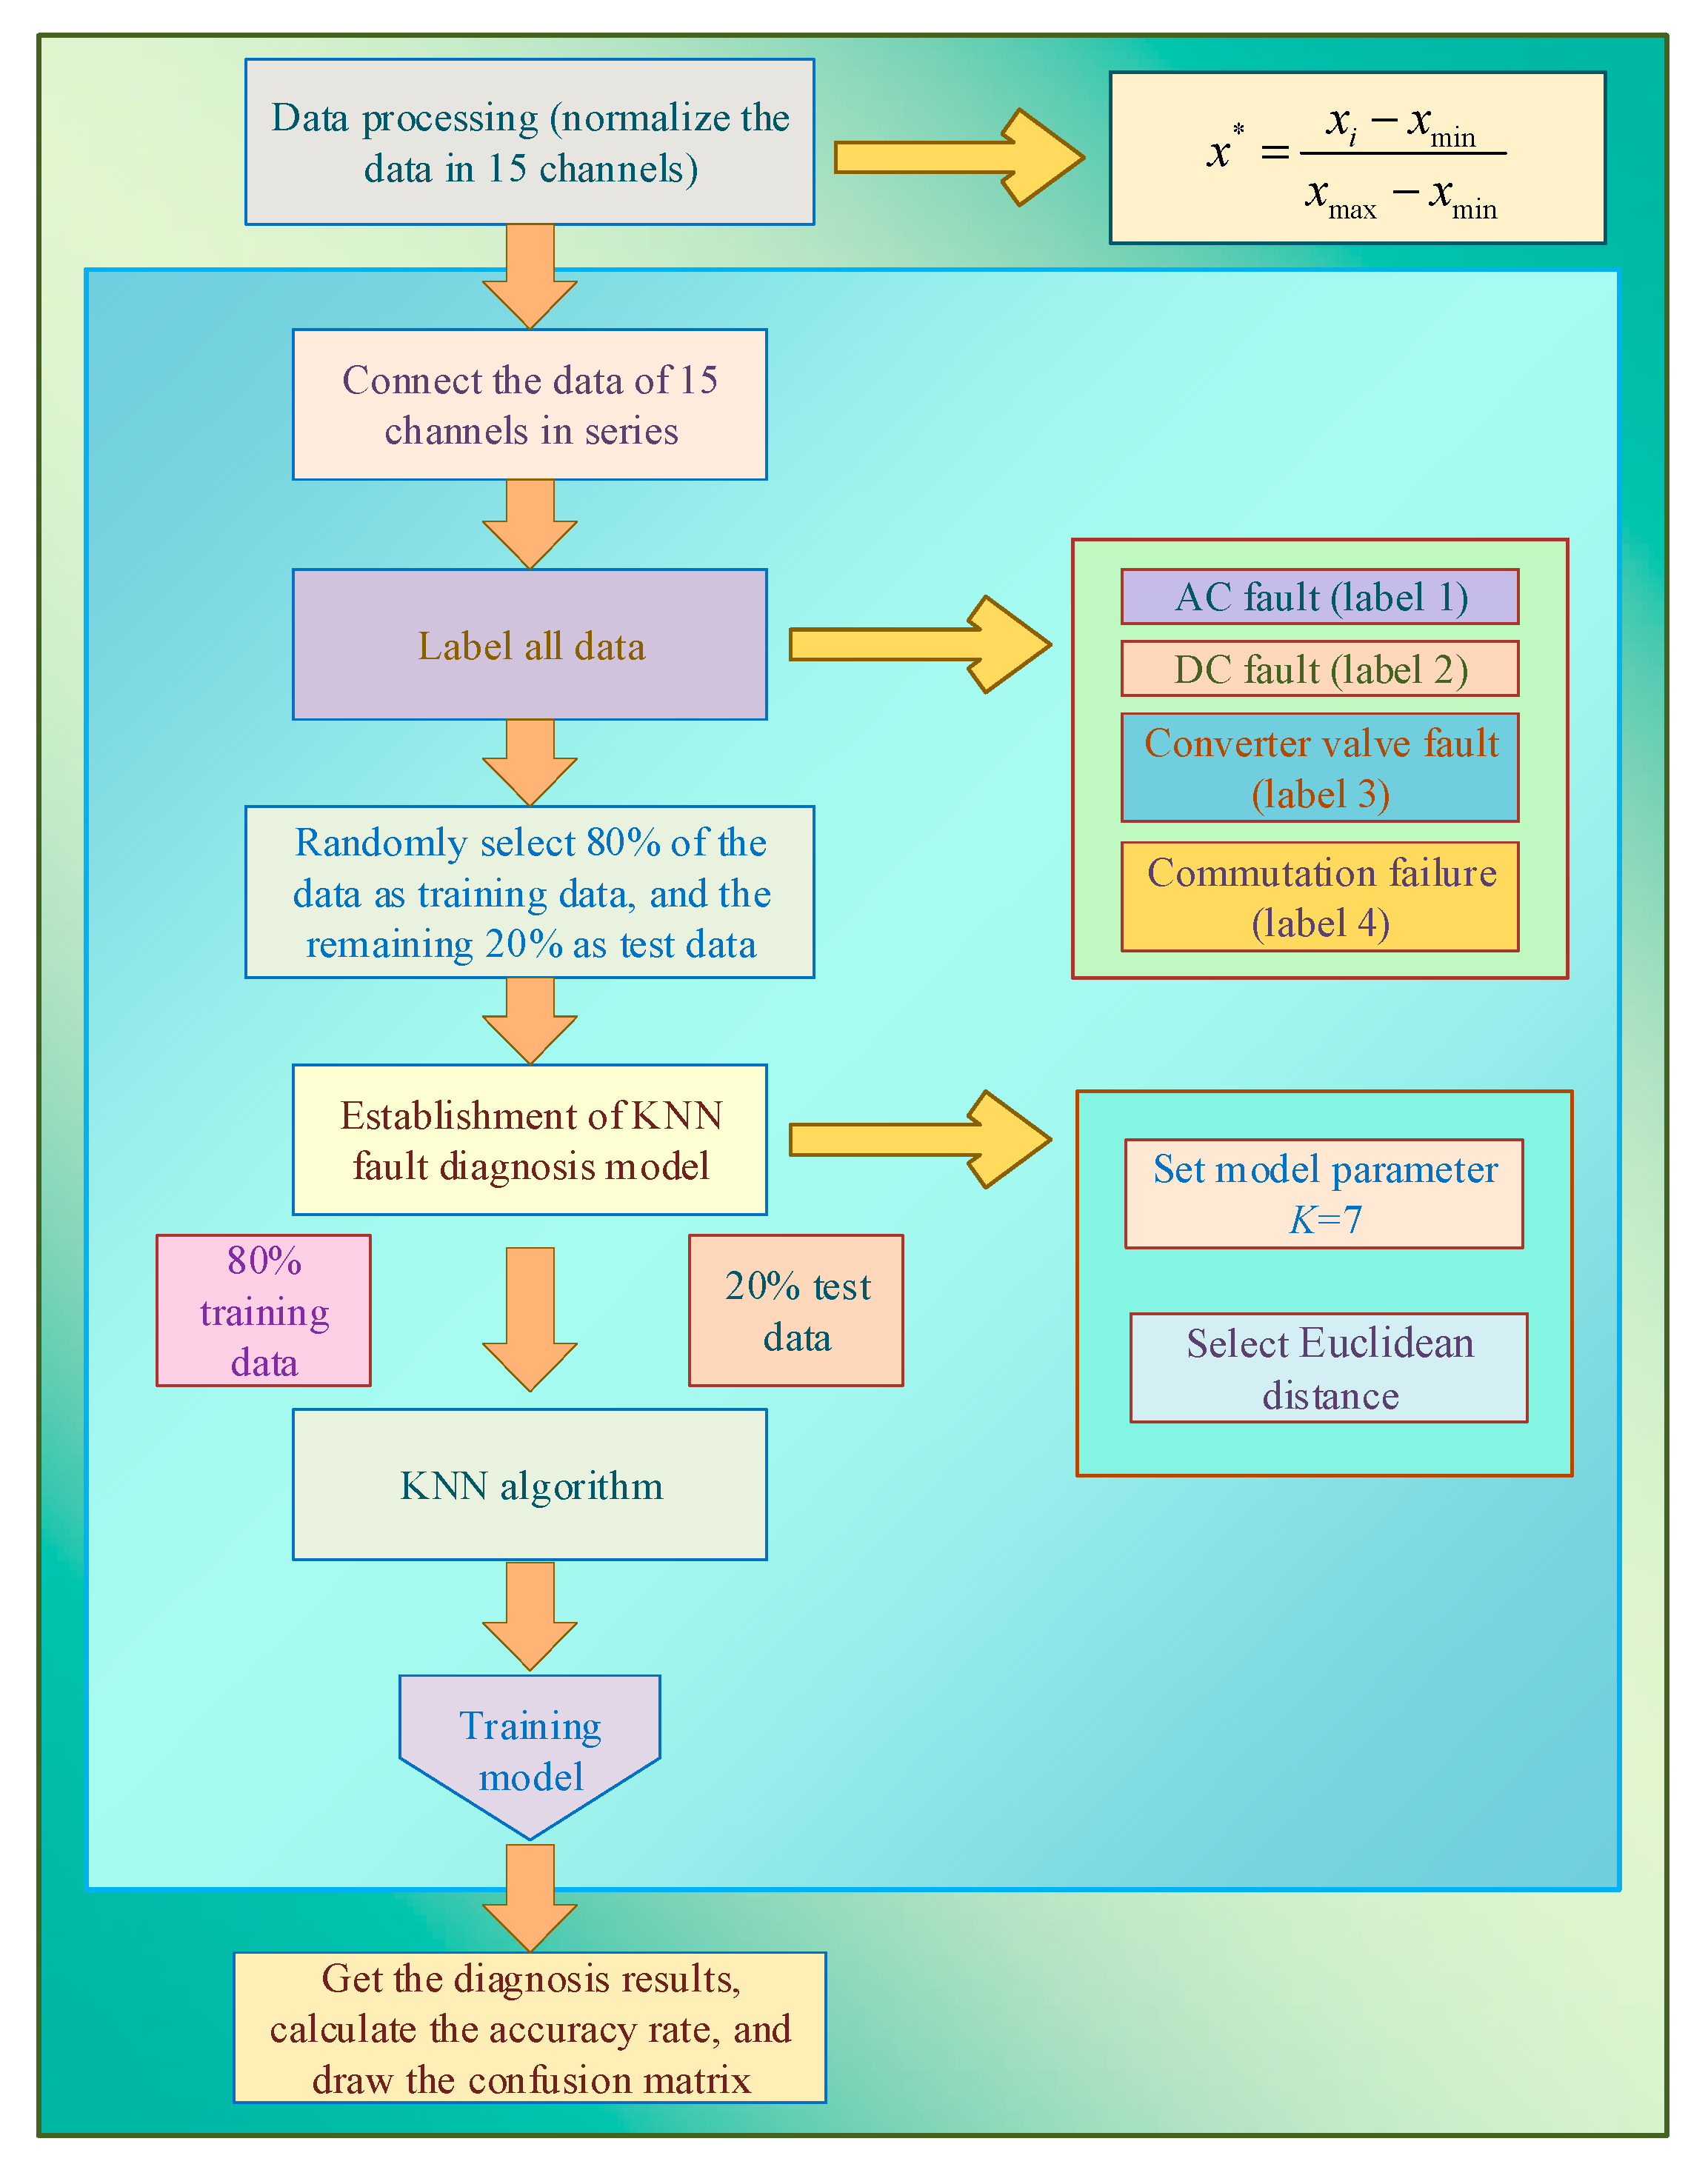
After collecting the fault data, the KNN algorithm is combined to implement fault diagnosis (Figure 9); the specific implementation steps are as follows [47].
(1)
Data processing, normalize the data of 15 channels in each type of fault data as follows:
x * = x i x min x max x min
(2)
The data of 15 channels of each sample are connected in series head to tail and stacked according to the number of samples of fault type to form all fault datasets;
(3)
Label the fault data;
(4)
Data classification: randomly divide 80% of all fault data into training sets and the remaining 20% into test sets;
(5)
Establish KNN fault diagnosis model, set the appropriate KNN algorithm parameter K value, and select the appropriate distance function;
(6)
80% of data are substituted into the fault diagnosis model for fault diagnosis training, and the remaining 20% of data are substituted into the trained model for verification;
(7)
Obtain the test data label and compare the diagnosed label with the real label of the test data, and then calculate the fault diagnosis accuracy rate and draw a visual confusion matrix diagram. The accuracy rate formula is as follows.
p = N label ture N label all

6. Case Study

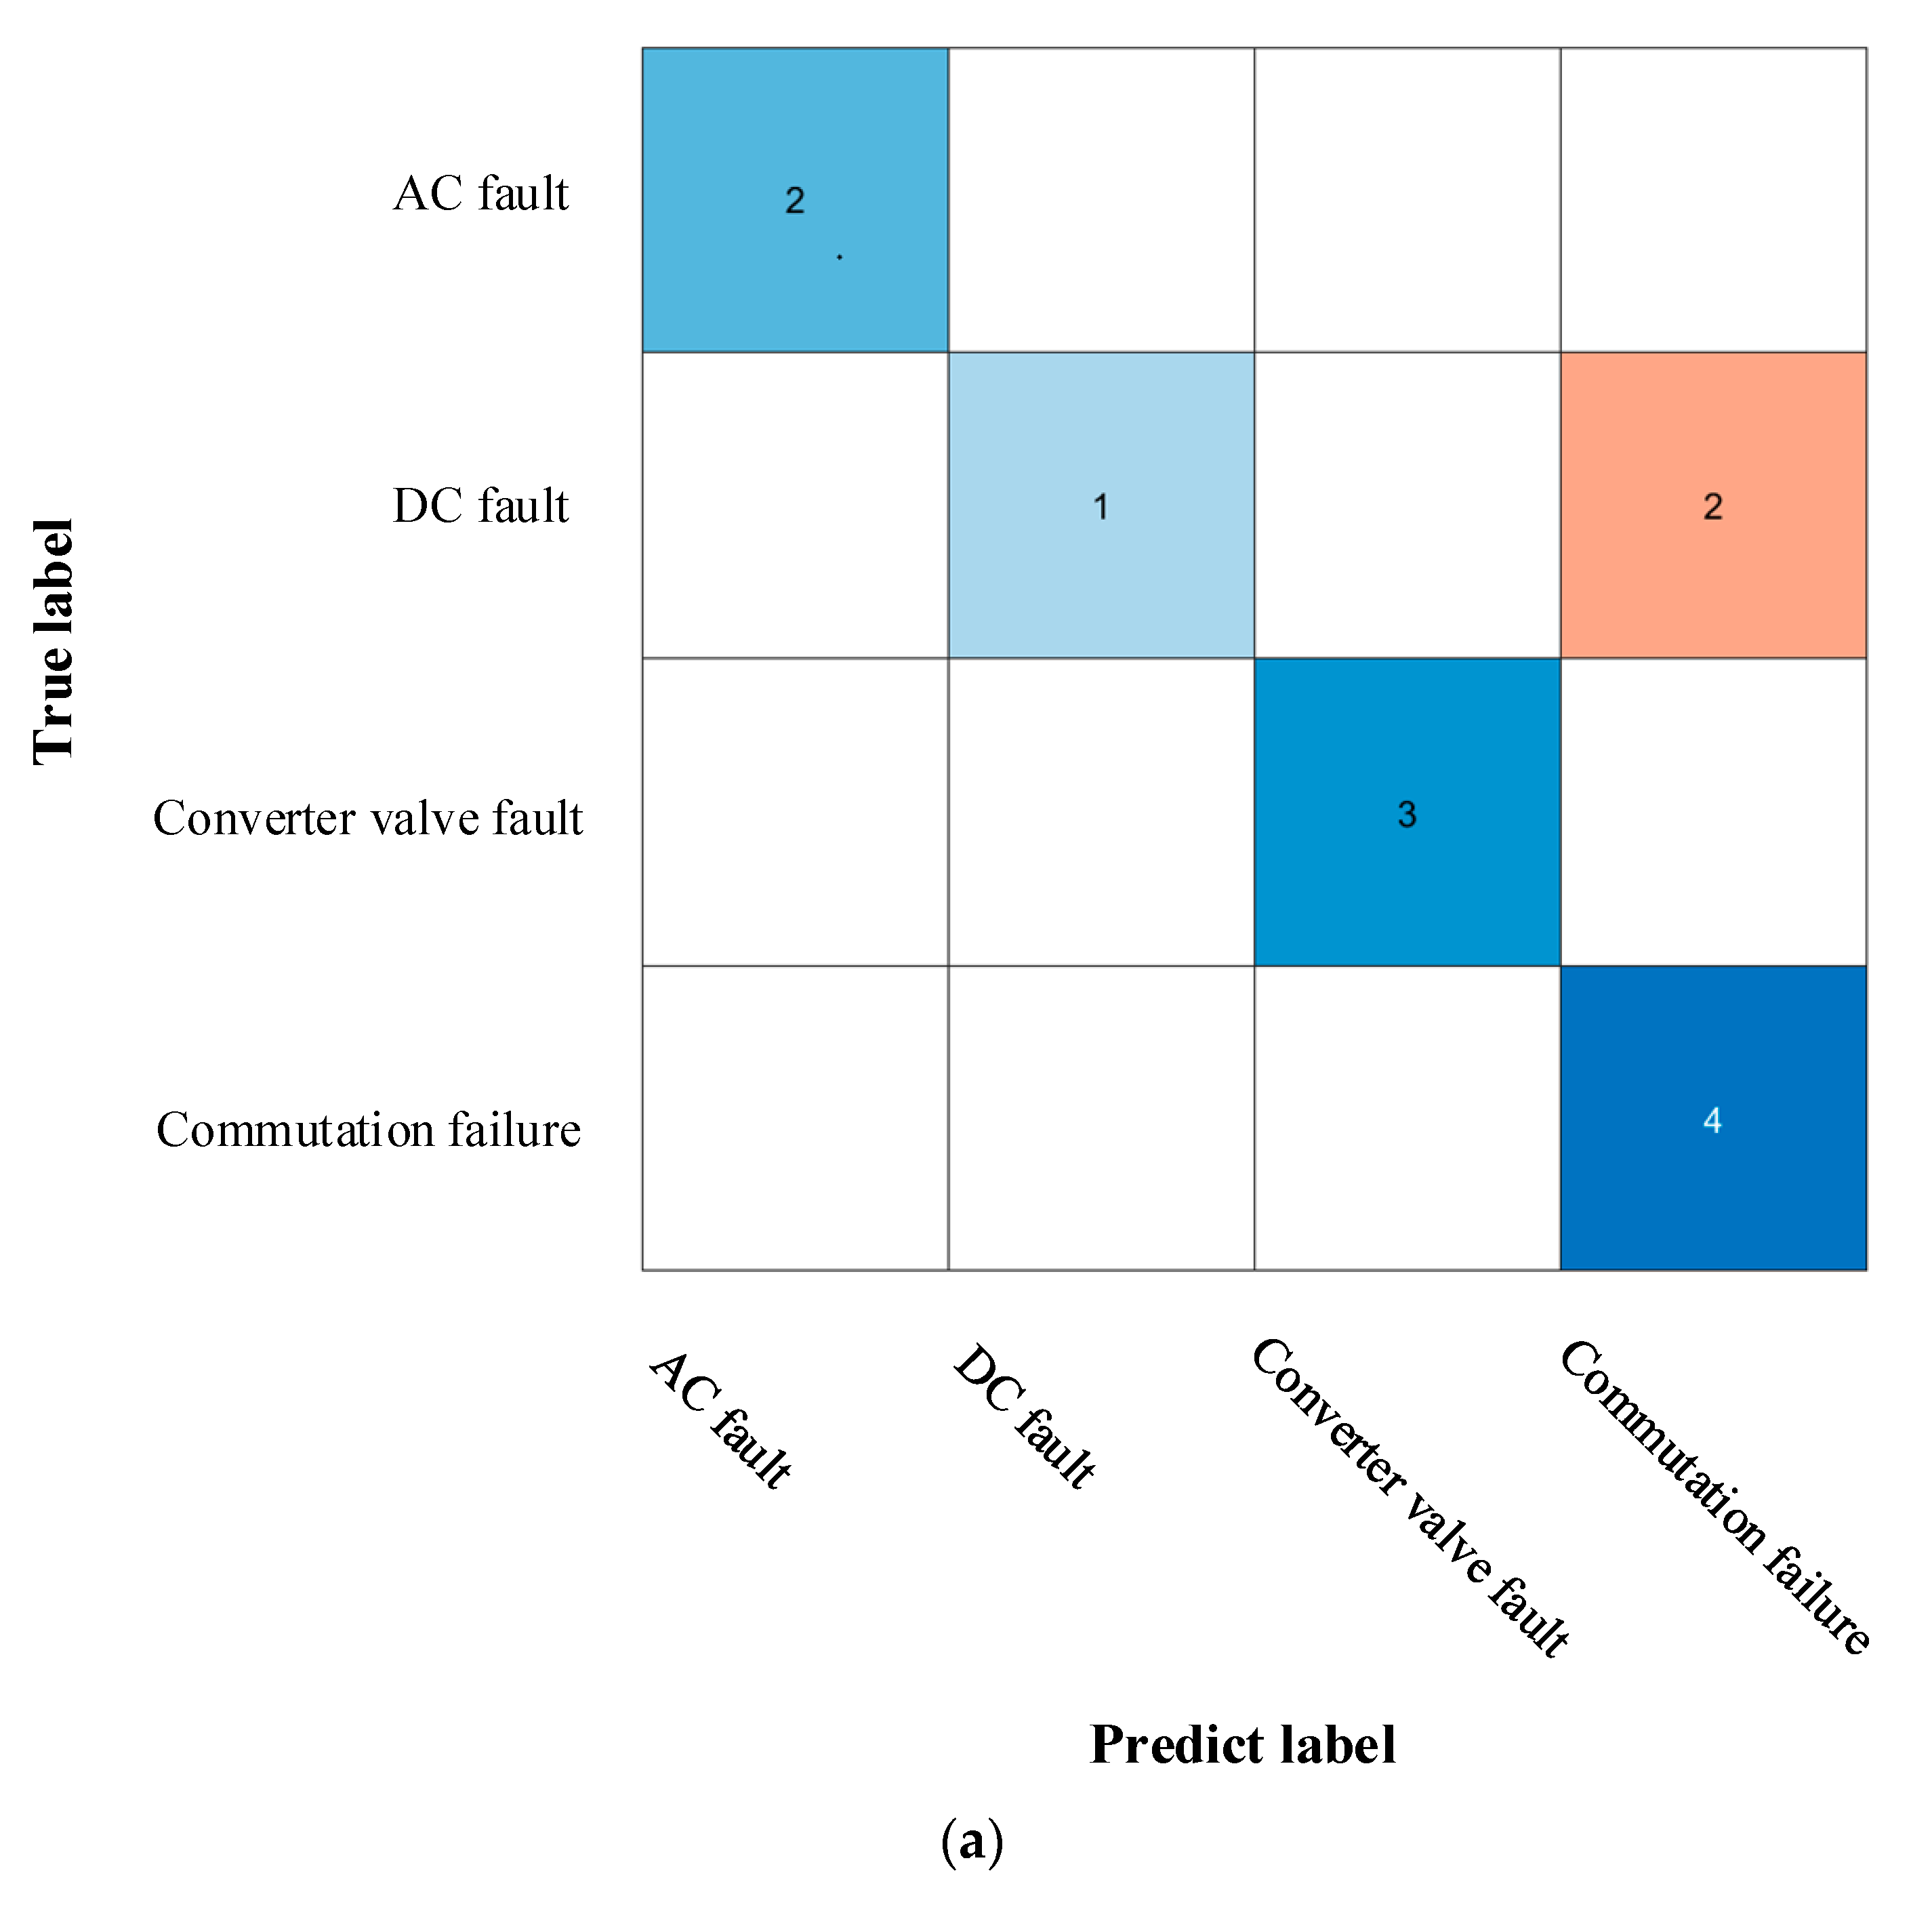
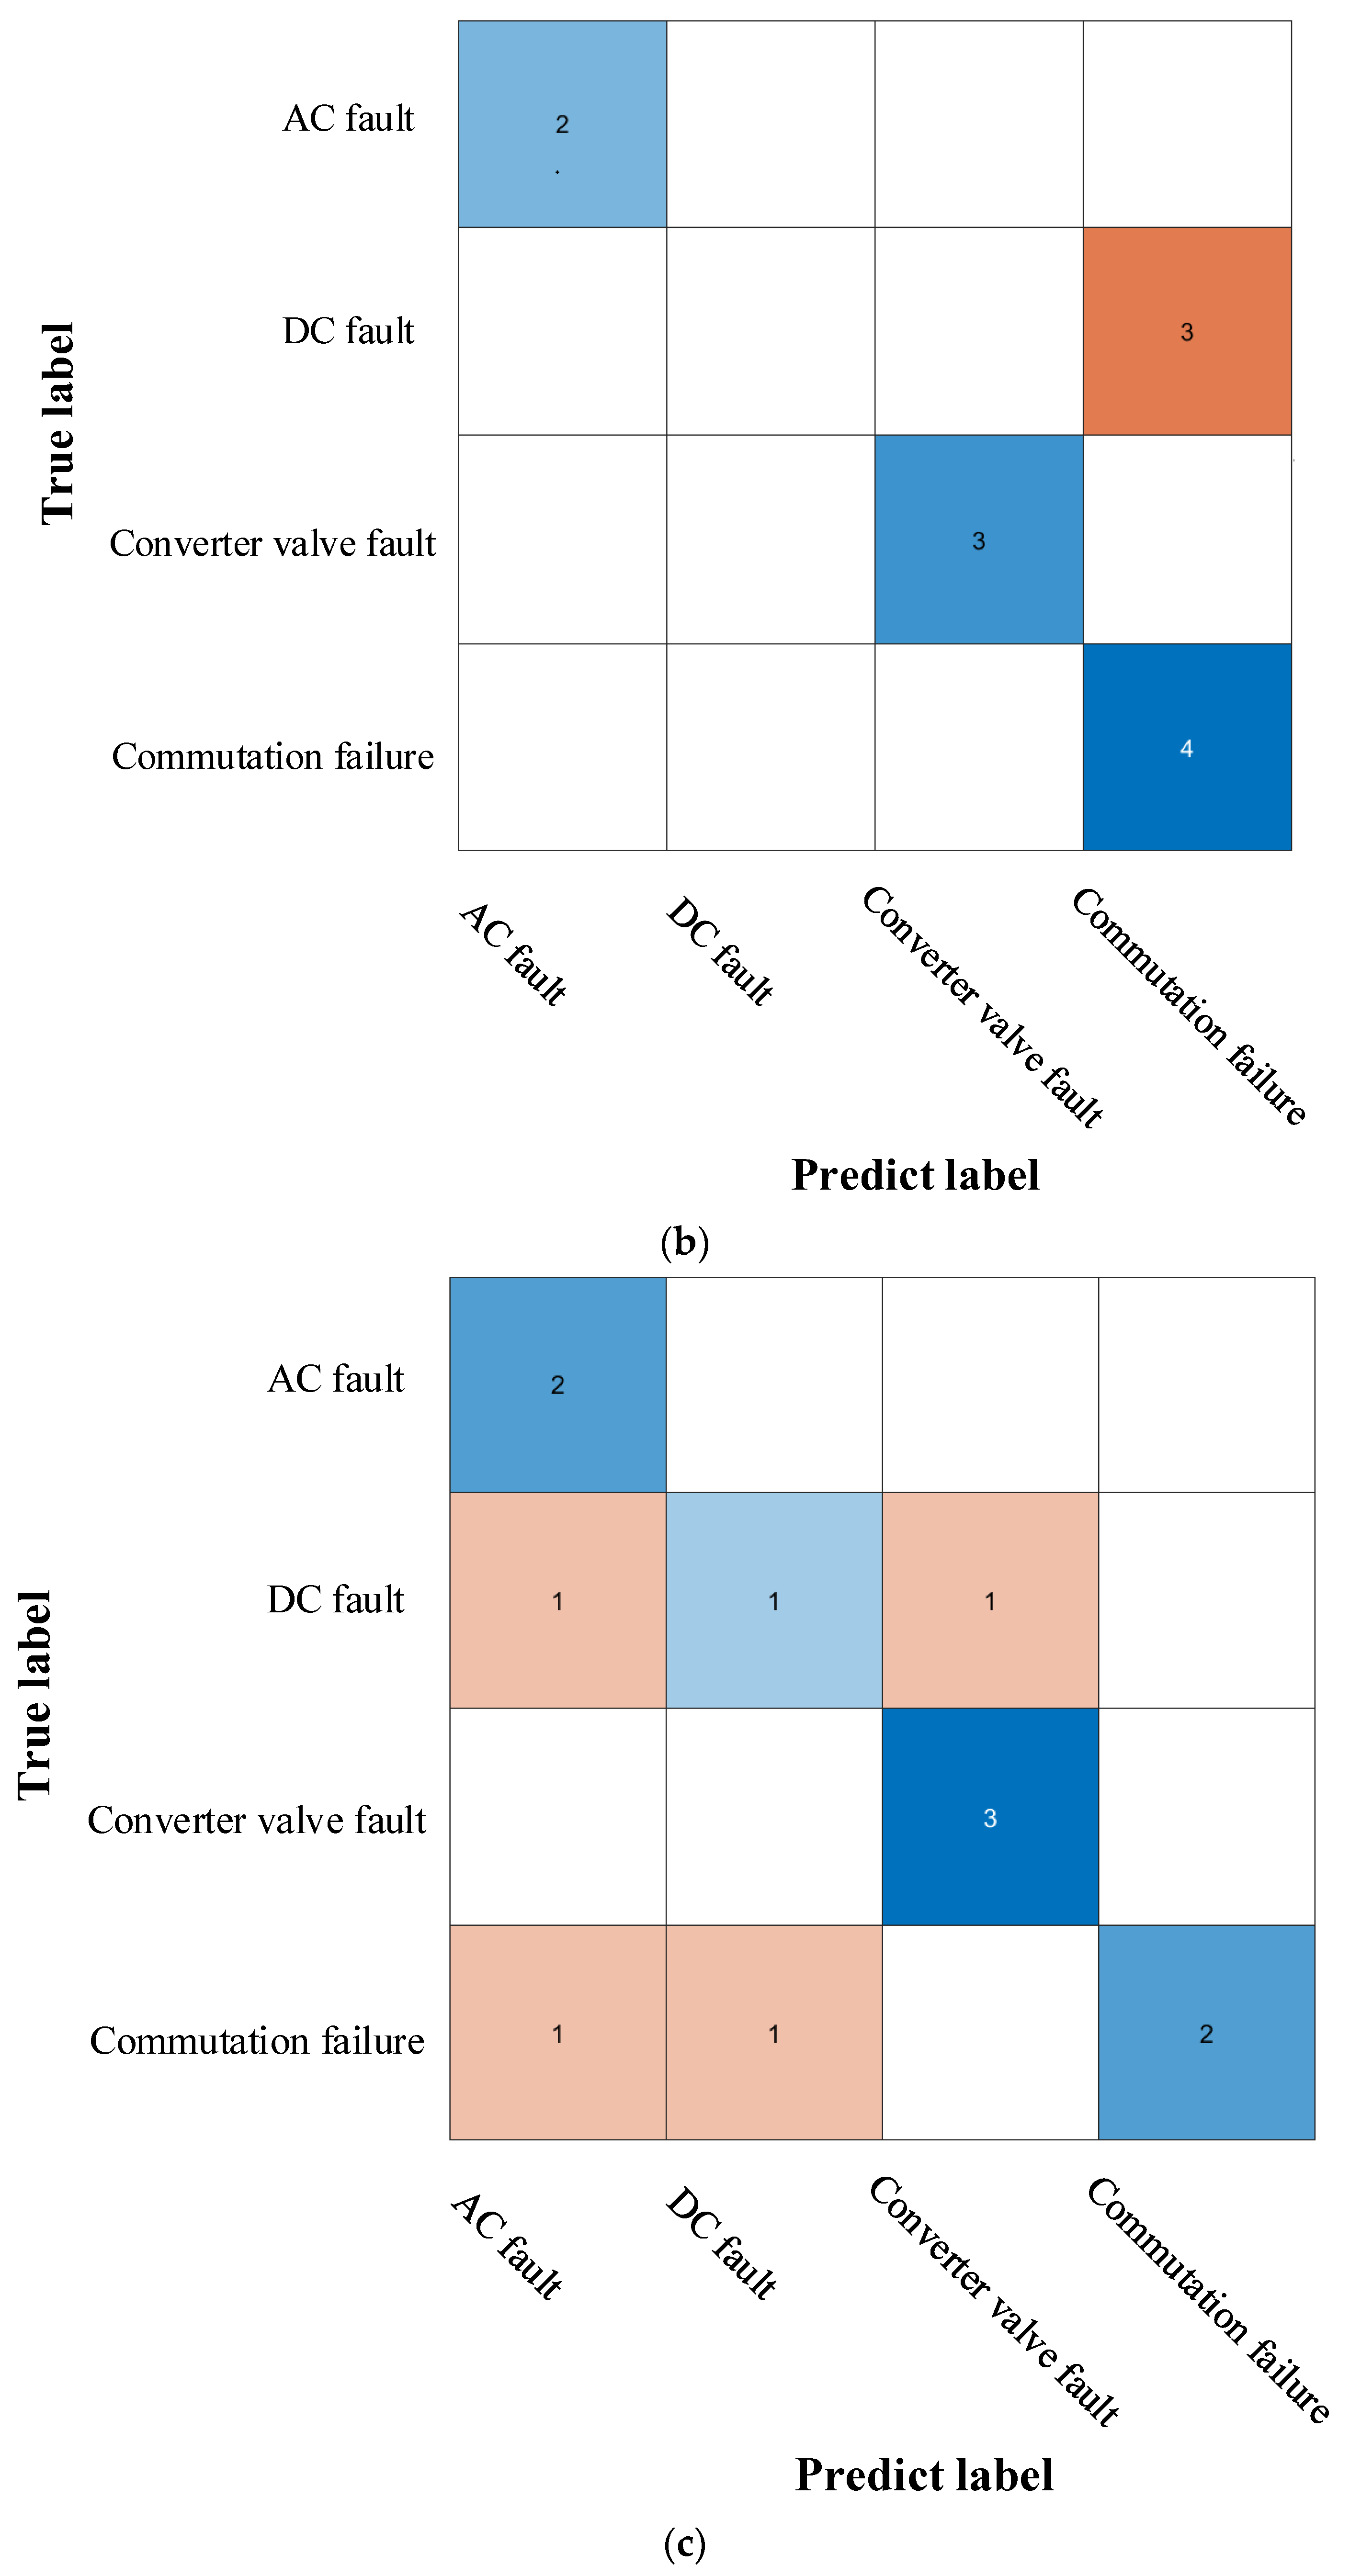
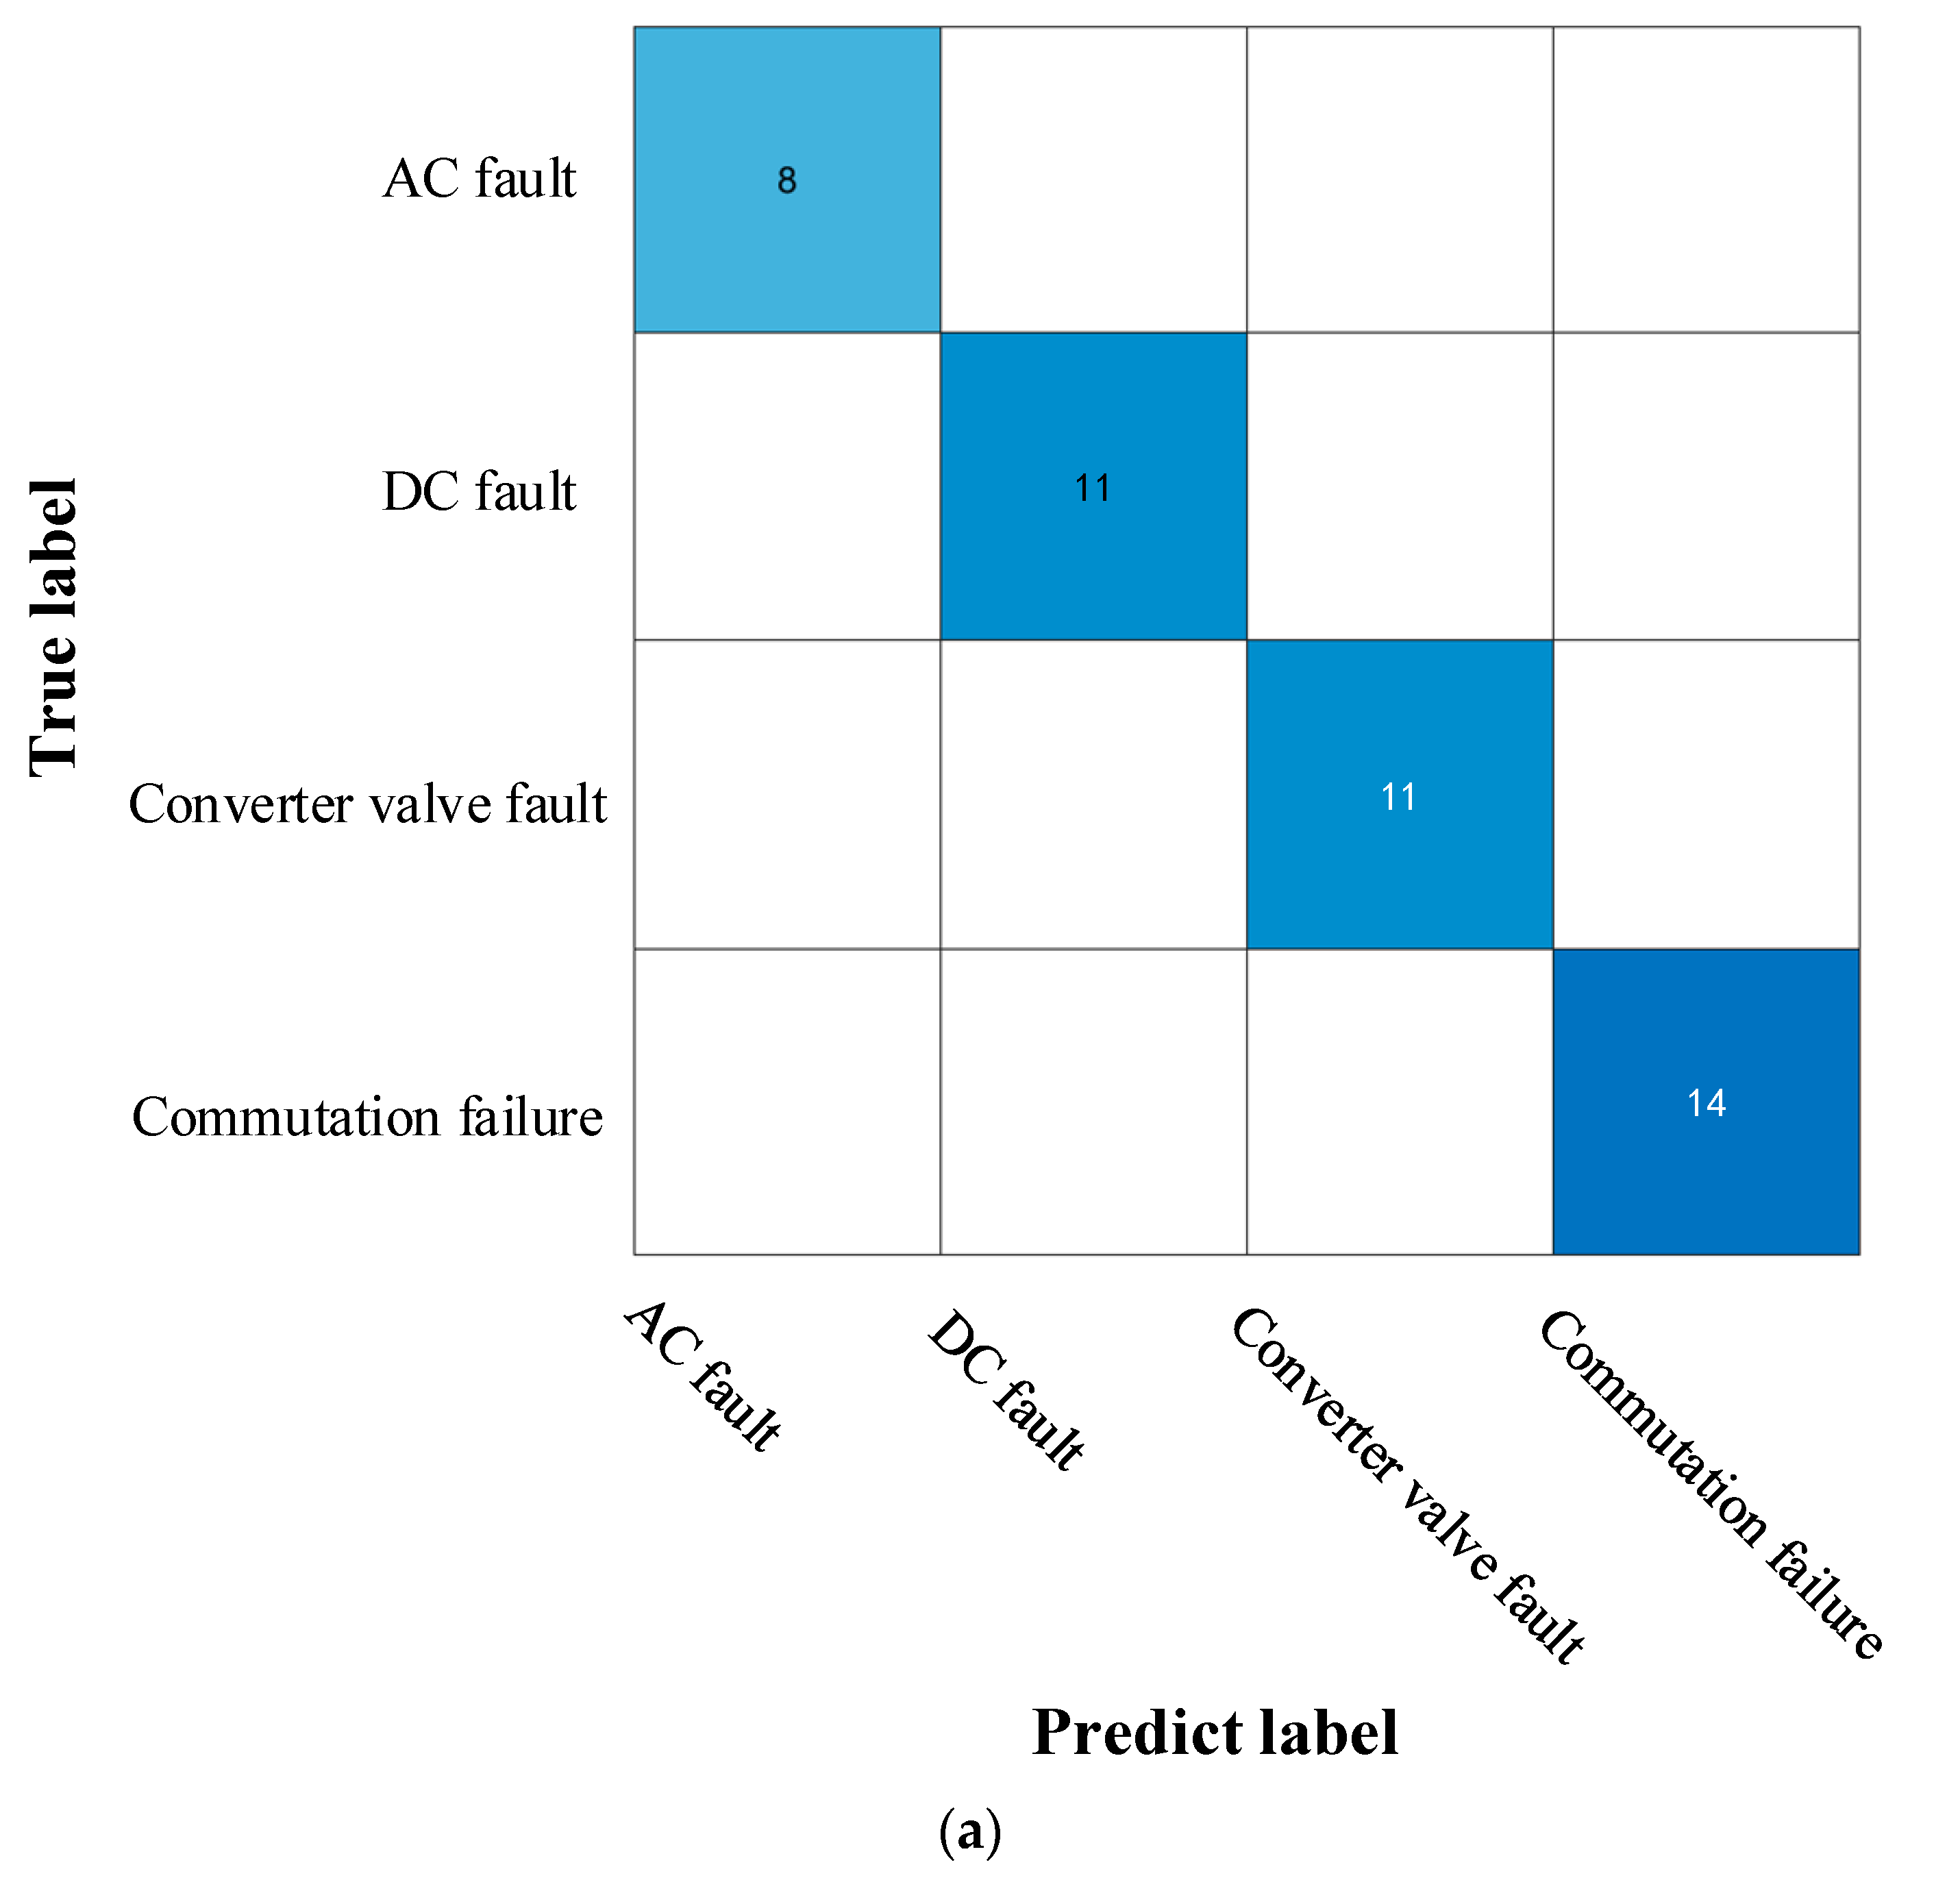
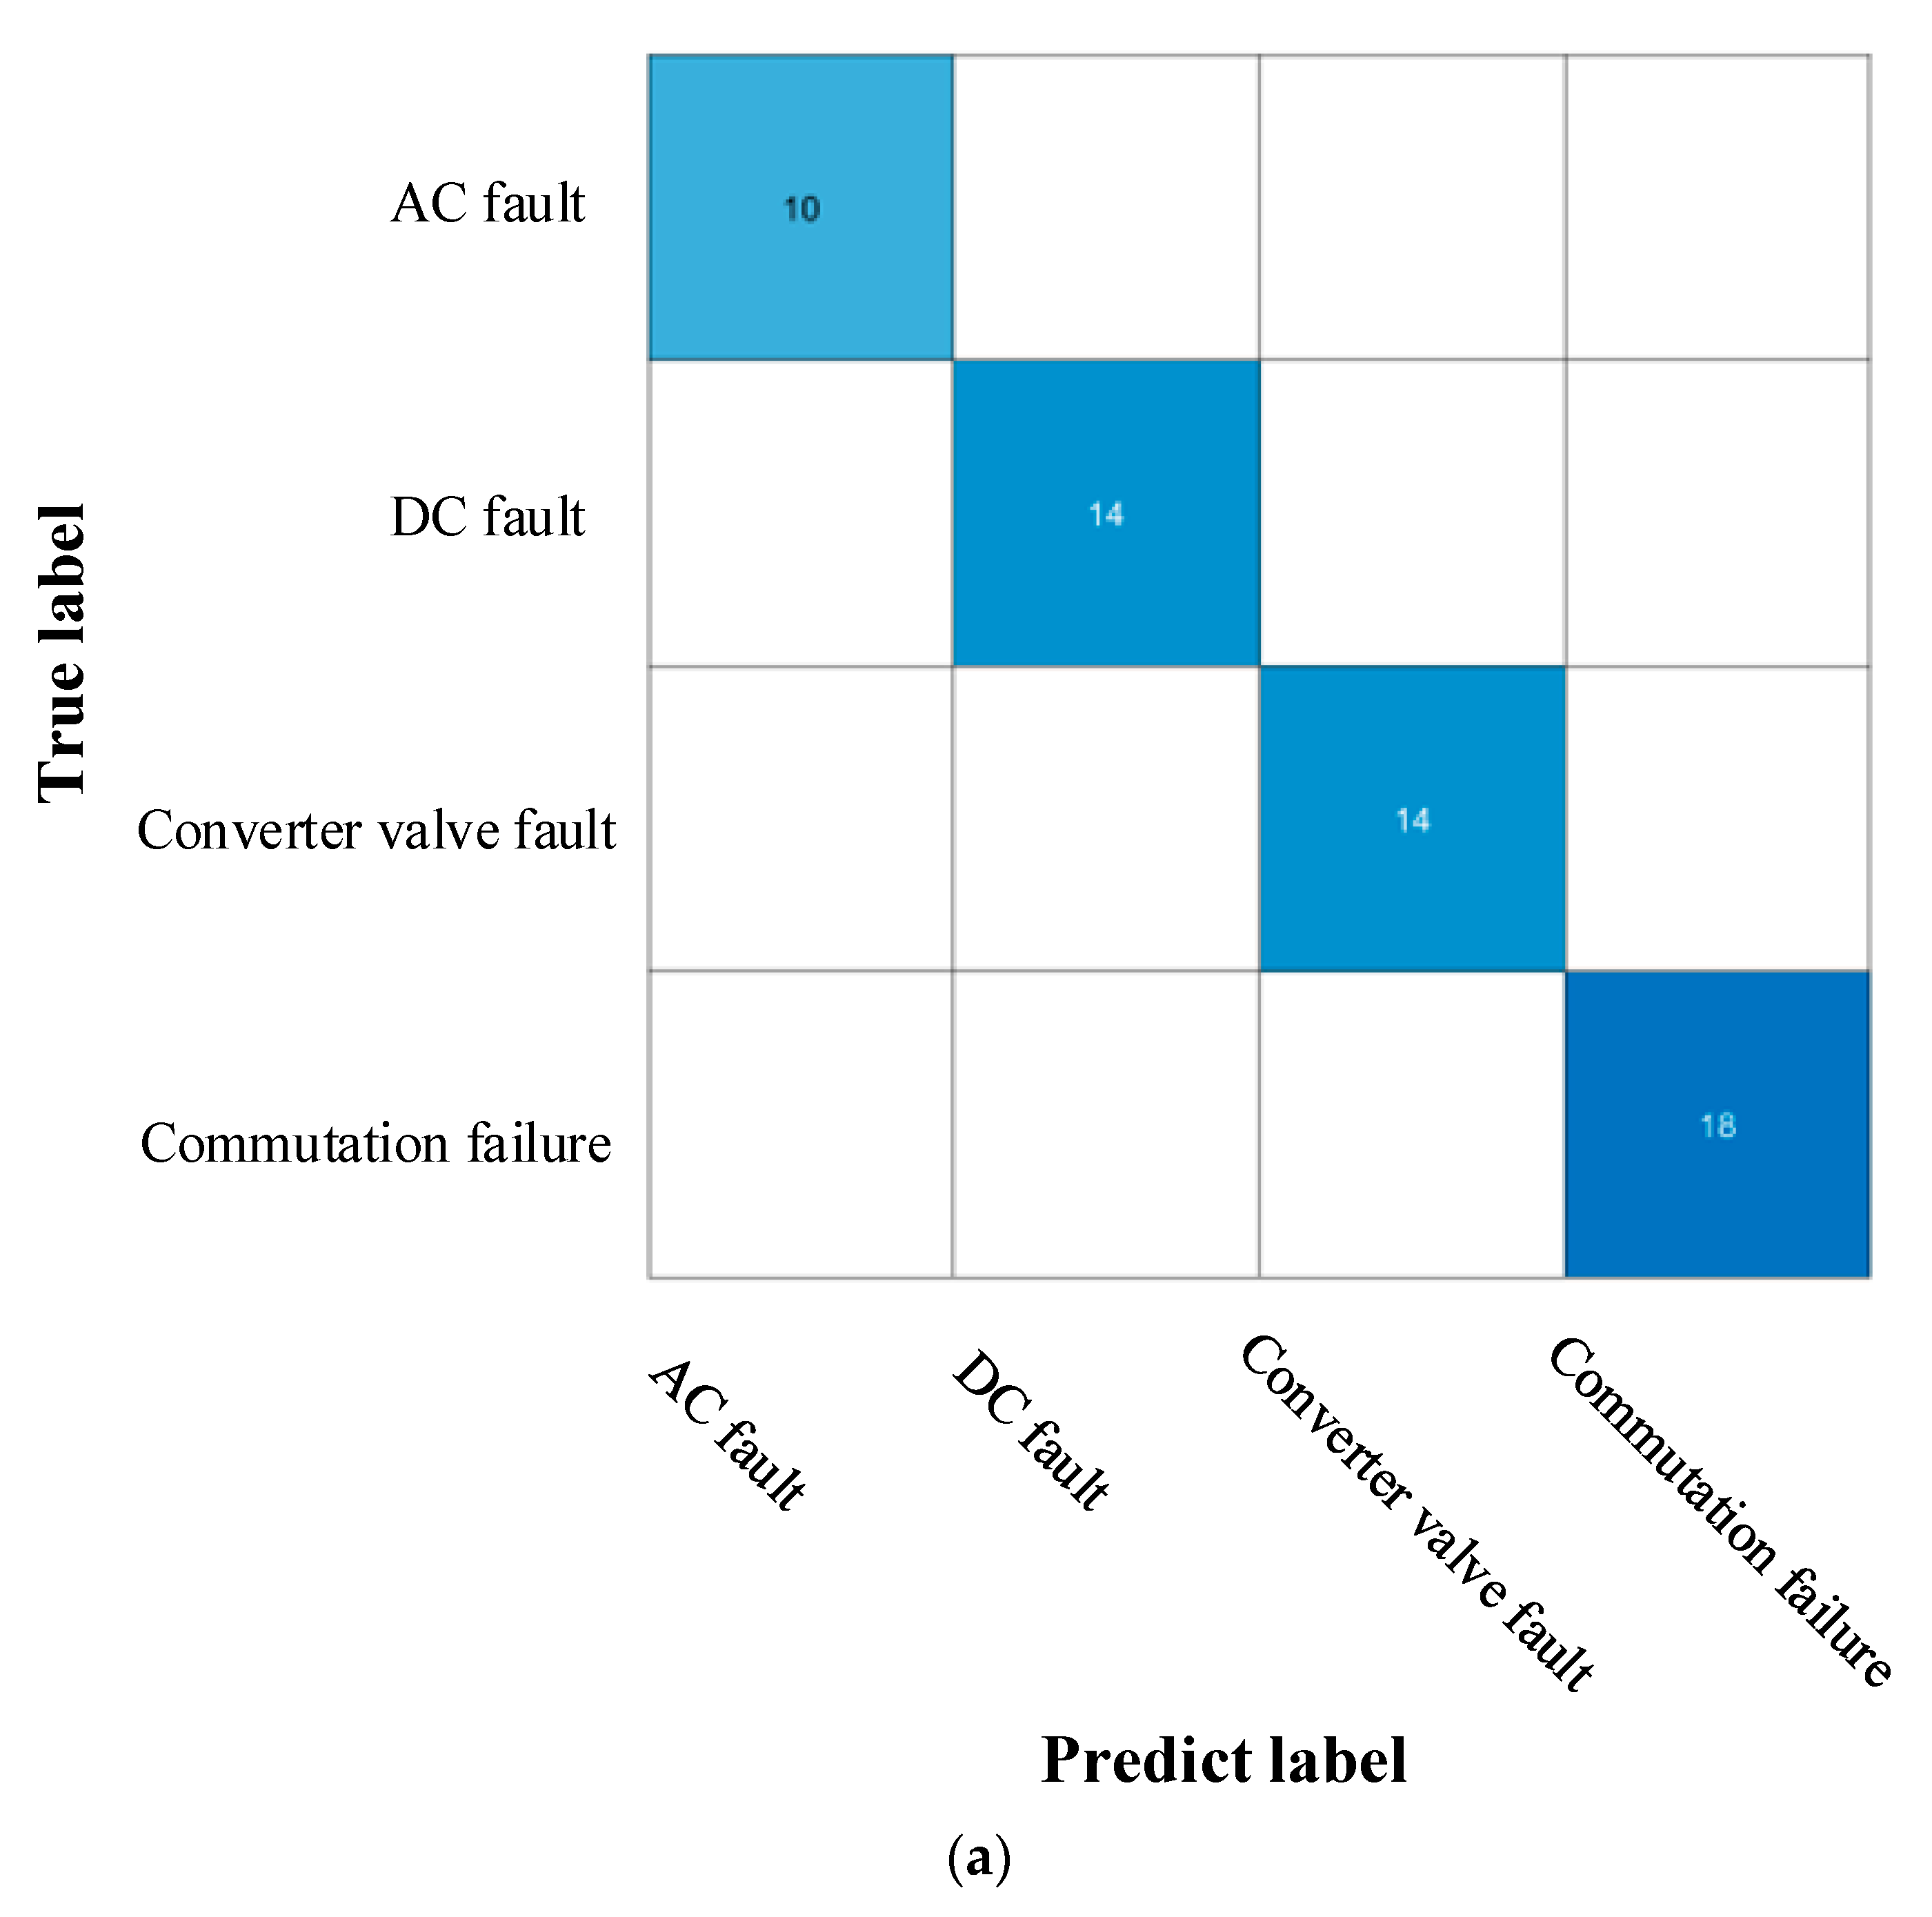
First, training samples of the fault data are conveyed into the model, followed by test samples. In order to reflect the scientific nature of fault diagnosis, test data are divided into three groups to verify the model. The first group of test data are divided into 20% Y1 (n1 = 2, n2 = 3, n3 = 3, n4 = 4) of all fault datasets. The second group of test data are the training data themselves Y2 (n1 = 8, n2 = 11, n3 = 11, n4 = 14). After training the model, the training data are substituted into the model for verification. The third group of test data are all fault data Y3 (n1 = 10, n2 = 14, n3 = 14, n4 = 18).
In order to reflect the diagnostic accuracy and effectiveness of the KNN algorithm in small-sample fault diagnosis [48,49], BC and SVM algorithm are used for comparison, and fault diagnosis accuracy of the three methods is compared under the same training set and test set. The parameter settings of the three methods are shown in Table 3. Finally, to improve the fault diagnosis accuracy of the three methods for the test set, this paper uses the confusion matrix to visually express fault diagnosis accuracy.
After the three methods trained their respective fault diagnosis models, the confusion matrix of fault diagnosis results of Y1 test set is shown in Figure 10. The KNN algorithm has the highest classification accuracy among the three methods, with a classification accuracy of 83.3%. The diagnosis accuracy of the other two algorithms is lower than 80%; the KNN has two samples of diagnostic errors, the SVM algorithm has three samples of diagnostic errors, the BC algorithm has four samples of diagnostic errors, and the DC fault diagnosis accuracy of the three algorithms is relatively low.
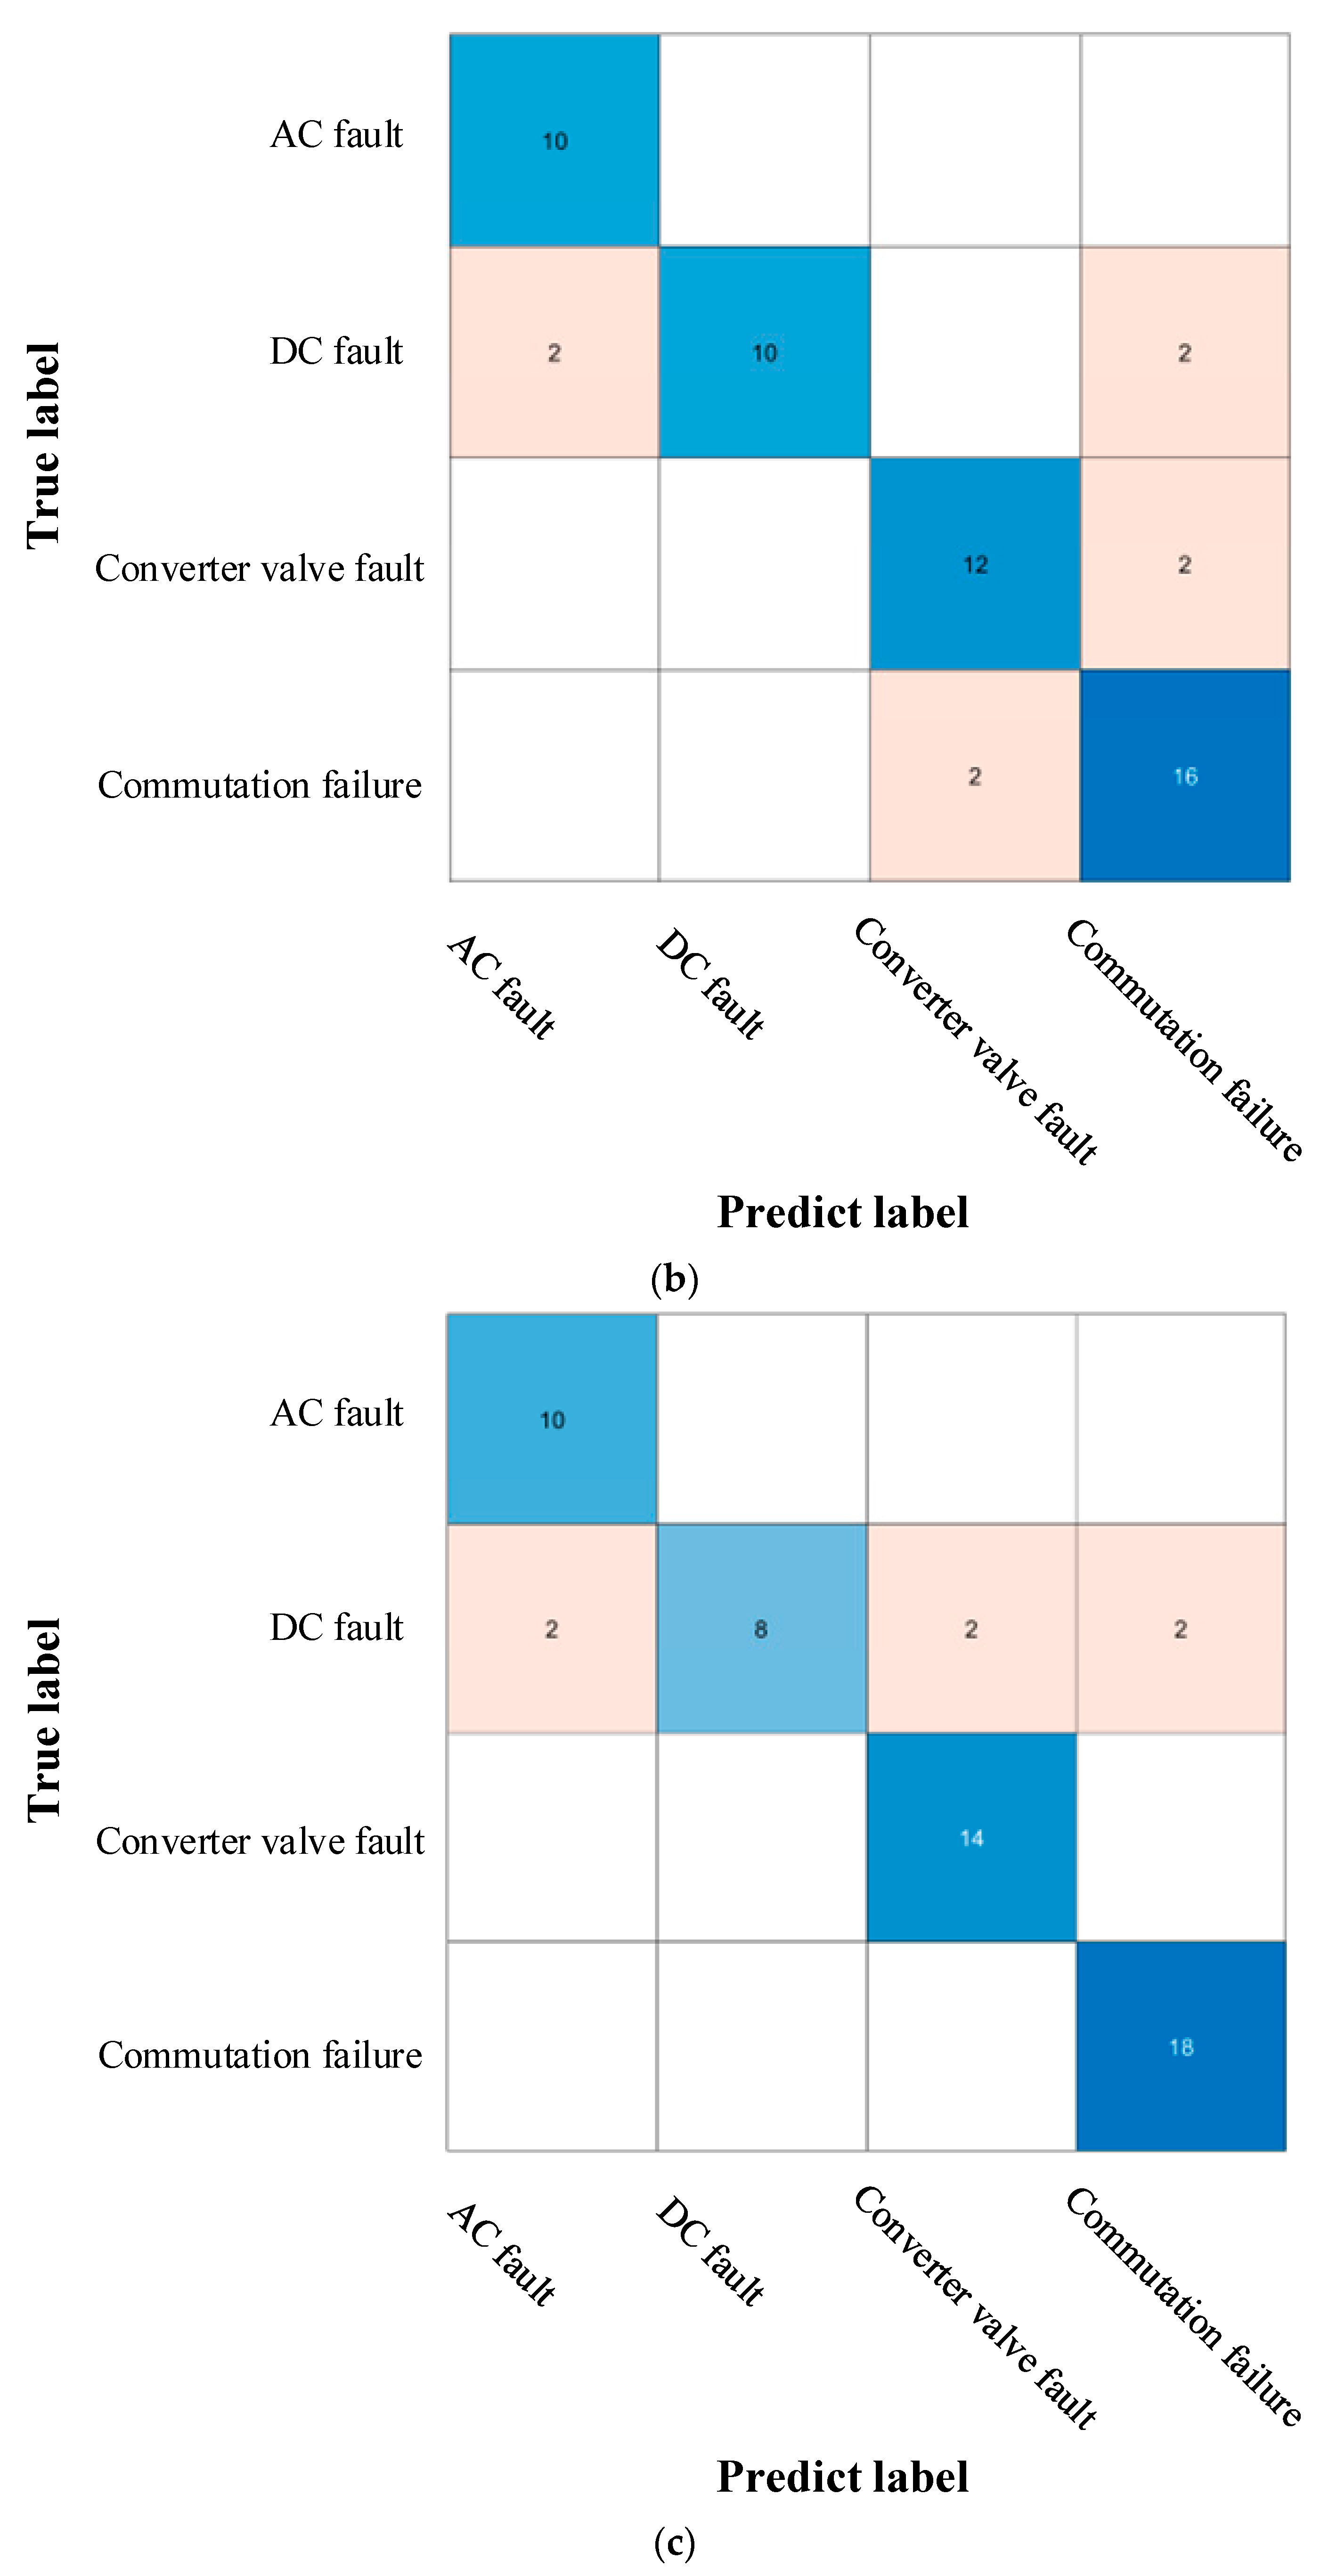
Further, the confusion matrix of fault diagnosis results for the Y2 test set is shown in Figure 11. The fault diagnosis accuracy of the KNN algorithm is 100%, and both the naive BC and SVM algorithms generate diagnostic errors; the fault diagnosis accuracy of SVM is 88.6%, and that of the BC algorithm is 75%. The diagnostic accuracy of the SVM algorithm is higher than that of the BC algorithm, and these two algorithms generate this error for DC fault.
Finally, the results of the three algorithms under the Y3 test set are shown in Figure 12. It is obvious that the diagnosis results accuracy of the naive BC and SVM algorithms is not as high as that of the KNN algorithm; the fault accuracy rate of the KNN algorithm is 100%. Although the accuracy rate of the BC and SVM algorithms is lower than that of the KNN algorithm, the accuracy rate of these two algorithms is also higher than 80%. Moreover, from the final results of the three sets of test sets, it can be seen that, among the kinds of faults, DC faults readily cause classification errors.
All in all, according to the confusion matrix, the accuracy rate of three groups of fault diagnosis experiments is obtained, as shown in Table 4. It is obvious that, among the three groups of data, the accuracy rate of fault diagnosis of the KNN algorithm is the highest, which can reach 100% at the highest, and the overall accuracy rate is more than 80%, which fully reflects that the KNN algorithm is suitable for data classification in small-sample datasets. All simulation experiments are run in the Python-PyCharm Community Edition 2022 environment on a computer configured with a 2.60 GHz Intel (R) Core (TM) i7-10750 CPU, 16.0 GB RAM, and 64-bit Windows 10.

7. Discussion and Limitations

7.1. Discussion

The research in this paper is based on a practical HVDC project in China Southern Power Grid; thus, the data used in this paper come from actual measured fault data in HVDC systems over the last three years. By combining fault diagnosis technology with KG, monitored fault data can be transferred directly to KG when faults occur in future HVDC systems; e.g., the actual fault data (e.g., Excel data) are conveyed into KG and the KNN model parameters are set to be analyzed and processed by KG to obtain the type of fault and the solution. In addition, fault diagnosis technology is one of the core technologies of KG, and, therefore, integration of fault diagnosis and KG involves continuous improvement and development of KG. This paper is an application of fault diagnosis to actual HVDC systems and a study of fault diagnosis in actual system operation, which has solid engineering application value and can be used as a reference for future analysis of similar problems
In view of China’s current energy situation, resources are mainly distributed in the west and less in the east. In recent years, China has been vigorously implementing its western development strategy, of which the west–east electricity supply is a very important initiative. The western part of China is rich in wind and solar energy resources, but the economy is relatively backward and the demand for electricity is relatively small, while the eastern part is relatively poor in electricity resources but has a large demand for electricity, so it is necessary to transmit electricity from the western part to the eastern part. Therefore, HVDC technology has been vigorously promoted and developed in China. Use of an HVDC system can greatly improve China’s energy utilization efficiency and solve the problem of uneven energy distribution. Due to high investment and construction costs in the early stage of an HVDC transmission system, it plays an important role in the overall development of the country. Compared with AC transmission systems, when the electric energy generated by wind and photovoltaic power are connected, the impact on the system is smaller and the energy utilization rate can be improved.
The KNN algorithm is used for fault diagnosis of HVDC systems thanks to its high computation speed and accuracy under small-sample data. In general, when the amount of data is large, diagnosis accuracy may be reduced. However, probability of HVDC system failure is low and system power supply reliability is very high, at about 99.7116% [39]. Hence, the amount of data is small and the types of faults are few for HVDC systems, resulting in a very small amount of data for actual fault diagnosis, upon which the KNN algorithm is selected in this paper.
Overall, this paper randomly selects 80% of all datasets as training data. Respectively, the remaining 20% is test set Y1. The training data themselves are used as test set Y2, and then all data are used as test set Y3. The purpose of this is to test all the data and achieve cross-validation. In general, it is most reasonable that the test dataset and training set are different.

7.2. Limitations

The research in this paper is about fault diagnosis in actual HVDC transmission systems. As mentioned above, the probability of a fault in an HVDC system is very low, so the reliability of the system power supply is very high, which is a small-sample data problem. Although the neural network method and wavelet analysis are commonly used to solve a fault diagnosis problem of a power system, this paper mainly focuses on HVDC systems. Due to the small fault samples, the KNN method is well suited as it not only has a simple model but also provides fast and accurate diagnosis of small-sample problems. In this paper, only four types of faults are included in the dataset, so, to some extent, it does not cover all types of faults in HVDC transmission systems, such as transformer fault, generator fault, etc. In addition, the current work is mainly carried out under small data samples and the number of datasets is not large; thus, further improvement and enrichment regarding datasets are needed in the future. Since fault diagnosis is based on historical fault data to predict the system, the method proposed in this paper has some limitations for fault prediction in some special cases.

8. Conclusions

This paper proposes a novel HVDC system fault diagnosis model based on the KNN algorithm that is verified to be able to effectively, accurately, and quickly identify different types of faults of an HVDC system.
Fault diagnosis for an HVDC system is of great significance to ensure safe and reliable operation of a power system, and establishment of an HVDC system KG is the manner for intelligent development of the power system, while fault diagnosis is the core purpose of a KG. HVDC systems are exposed to fault risk during operation, both on transmission lines and in converter stations. Therefore, rapid and accurate fault identification and fault resolution based on monitored fault data are key foci of future research in power systems and key purposes of KG establishment. Future fault diagnosis should focus on combination of fault datasets and KG and establish a combination of fault diagnosis and artificial intelligence to continuously improve efficiency and accuracy of diagnosis.
In general, development of fault diagnosis technology for an HVDC system is still immature. If fault diagnosis can be carried out for flexible DC transmission and AC/DC hybrids in the future, it will be a further breakthrough in fault diagnosis technology. In addition, if more advanced AI technology can be applied to HVDC systems in the future, operation efficiency and reliability can be further improved. In addition, it is also necessary to develop proper filtering technology for HVDC systems that can help to reduce packet loss in long-distance transmission and negative influence caused by noises.

Author Contributions

Q.C.: writing the original draft and editing. Q.L. and J.W.: conceptualization. J.H., C.M., Z.L., and B.Y.: visualization and contributed to the discussion of the topic. All authors have read and agreed to the published version of the manuscript.

Funding

This work was supported by Technology Project of China Southern Power Grid (CGYKJXM20210309, CGYKJXM20220343).

Conflicts of Interest

The authors declare that they have no known competing financial interests or personal relationships that could have appeared to influence the work reported in this paper.

Nomenclature

ACalternating current
BCBayesian classifier
CNNconvolutional neural networks
DCalternating current
EDEuclidean distance
ESexpert system
HVDCHigh-voltage direct current
KGknowledge graph
KNNK-Nearest Neighbor
SVMsupport vector machine
Knumber of adjacent points
dthe distance between samples
Nthe number of samples
Sithe standard deviation of the sample data in the i-th dimension
xthe horizontal coordinate position of the sample
ythe vertical coordinate position of the sample
wclassification weight of samples
x*normalized sample data
paccuracy of fault diagnosis

References

  1. Mohamed, N.; Ahmed, E.; Tamou, N. Improving Low-Voltage Ride-Through Capability of a Multimegawatt DFIG Based Wind Turbine under Grid Faults. Prot. Control. Mod. Power Syst. 2020, 5, 370–382. [Google Scholar]
  2. Yang, B.; Liu, B.; Zhou, H.; Wang, J.; Yao, W.; Wu, S.; Shu, H.; Ren, Y. A Critical Survey of Technologies of Large Offshore Wind Farm Integration: Summarization, Advances, and Perspectives. Prot. Control. Mod. Power Syst. 2022, 7, 1–32. [Google Scholar] [CrossRef]
  3. Yang, B.; Li, Y.; Li, J.; Shu, H.; Zhao, X.; Ren, Y.; Li, Q. Comprehensive Summarization of Solid Oxide Fuel Cell: Control: A State-of-the-Art Review. Prot. Control. Mod. Power Syst. 2022, 7, 1–31. [Google Scholar] [CrossRef]
  4. Chen, Y.; Yang, B.; Guo, Z.; Wang, J.; Zhu, M.; Li, Z.; Li, Q.; Yu, T. Dynamic Reconfiguration for TEG Systems under Heterogeneous Temperature Distribution via Adaptive Coordinated Seeker. Prot. Control. Mod. Power Syst. 2022, 7, 1–19. [Google Scholar] [CrossRef]
  5. Tanmay, D.; Ranjit, R.; Kamal, K. Impact of the Penetration of Distributed Generation on Optimal Reactive Power Dispatch. Prot. Control. Mod. Power Syst. 2020, 5, 332–357. [Google Scholar]
  6. Mehdi, T.; Mehdi, N. Human Reliability Analysis in Maintenance Team of Power Transmission System Protection. Prot. Control. Mod. Power Syst. 2020, 5, 270–282. [Google Scholar]
  7. Liu, H.; Li, B.; Wen, W.; He, J.; Li, H.; Li, B.; Han, W. Review and Prospect on Transmission Line Protection in Flexible DC System. Power Syst. Technol. 2021, 45, 3463–3477. [Google Scholar]
  8. Yang, B.; Sang, Y.; Shi, K.; Yao, W.; Jiang, L.; Yu, T. Design and Real-time Implementation of Perturbation Observer based Sliding-Mode Control for VSC-HVDC Systems. Control. Eng. Pract. 2016, 56, 13–26. [Google Scholar] [CrossRef] [Green Version]
  9. Yang, B.; Jiang, L.; Yao, W.; Wu, Q. Perturbation Observer based Adaptive Passive Control for Damping Improvement of Multi-terminal Voltage Source Converter-based High Voltage Direct Current Systems. Trans. Inst. Meas. Control. 2017, 39, 1409–1420. [Google Scholar] [CrossRef] [Green Version]
  10. Yang, B.; Yu, T.; Zhang, X.; Huang, L.; Shu, H.; Jiang, L. Interactive Teaching-learning Optimizer for Parameter Tuning of VSC-HVDC Systems with Offshore Wind Farm Integration. IET Gener. Transm. Distrib. 2018, 12, 678–687. [Google Scholar] [CrossRef] [Green Version]
  11. Yang, B.; Jiang, L.; Yu, T.; Shu, H.; Zhang, C.; Yao, W.; Wu, Q. Passive Control Design for Multi-terminal VSC-HVDC Systems via Energy Shaping. Int. J. Electr. Power Energy Syst. 2018, 98, 496–508. [Google Scholar] [CrossRef]
  12. Yan, B.; Tian, Z.; Shi, S.; Weng, Z. New Fault Diagnosis Method for HVDC Transmission System. Autom. Electr. Power Syst. 2007, 31, 57–61. [Google Scholar]
  13. Sun, T. Fault Analysis and Line Protection Scheme of HVDC Transmission System. Electr. Power Technol. 2015, 4, 119–120. [Google Scholar]
  14. Li, Z. Research on a New Method of HVDC System Fault Diagnosis Based on Auto Disturbance Rejection Controller. Telecom Power Technol. 2010, 27, 39–43. [Google Scholar]
  15. Li, Z. Discussion on Protection Technology of DC Transmission System. Public Electr. 2022, 37, 43–44. [Google Scholar]
  16. Xu, H. Fault Analysis and Protection of DC Transmission System. Technol. Innov. Appl. 2017, 17, 167–168. [Google Scholar]
  17. Li, J.; Li, X.; Gao, T.; Zhang, J.; Zhang, B. Research and Application of Fault Handling Based on Power Grid Multivariate Information Knowledge Graph. Power Inf. Commun. Technol. 2021, 19, 30–38. [Google Scholar]
  18. Zhang, R.; Liu, J.; Zhang, B.; Li, J.; Gao, T.; Zhang, J. Research on Grid Fault Handling Knowledge Graph Construction and Real-Time Auxiliary Decision Based on Transfer Learning. Power Inf. Commun. Technol. 2022, 20, 24–34. [Google Scholar]
  19. Liu, F.; Shu, H.; Yang, D.; Yang, Y. Research on Fault Diagnosis Method of HVDC Transmission System. Yunnan Electr. Power 2010, 38, 23–25. [Google Scholar]
  20. Shao, X.; Ning, Y.; Liu, Y.; Zhang, H. Review and Prospects of Fault Diagnosis in Power System. Ind. Control. Comput. 2012, 25, 4–7. [Google Scholar]
  21. Yu, F.; Li, S.; Li, D.; Liu, X. Application of Support Vector Machine in Fault Diagnosis of HVDC Transmission System. Chin. J. Sci. Instrum. 2006, 27, 1734–1736. [Google Scholar]
  22. Yu, F.; Li, S.; Ma, X.; Liu, X. Research on Fault Diagnosis Model of HVDC System Based on SVM. J. Syst. Simul. 2007, 19, 3180–3183. [Google Scholar]
  23. Zhang, D.; Zhang, X.; Zhang, H.; He, J. Fault Diagnosis of AC/DC Transmission System Based on Convolutional Neural Network. Autom. Electr. Power Syst. 2022, 46, 132–140. [Google Scholar]
  24. Liu, H.; Xing, C.; Chen, S.; Yang, H.; Yan, Z. High Voltage Direct Current Transmission Based on Elman Neural Network System Commutation Failure Fault Diagnosis. Softw. Guide 2020, 19, 9–14. [Google Scholar]
  25. Zheng, X.; Peng, P. Fault Diagnosis of Flexible HVDC Converter Based on Preferred Wavelet Packet and AdaBoost-SVM. J. Power Syst. Autom. 2019, 31, 42–49. [Google Scholar]
  26. Chen, C.; Chen, S.; Bi, G.; Gao, J.; Zhao, X.; Li, L. Fault Diagnosis of Weak Receiving DC Transmission System Based on Parallel CNN-LSTM. Mot. Control. Appl. 2022, 49, 83–91. [Google Scholar]
  27. Huang, H. Application of KNN Algorithm in Single Terminal Fault Detection of HVDC Transmission. Energy Dev. 2021, 2, 22–27. [Google Scholar]
  28. Lu, D.; Ning, Q.; Yang, X. Fault Diagnosis of Rolling Bearing Based on KNN-Naive Bayes Algorithm. Comput. Meas. Control. 2018, 26, 21–27. [Google Scholar]
  29. Torres, O.; Alejandro, G. Grid Integration of Offshore Wind Farms Using a Hybrid HVDC Composed by an MMC with an LCC-Based Transmission System. Energy Procedia 2017, 137, 391–400. [Google Scholar] [CrossRef]
  30. Shu, N.; Ge, Z.; Luo, J.; Chen, K.; Ding, S. Fault Diagnosis System Based on Knowledge Graph. Comput. Sci. Technol. 2021, 39, 11–13. [Google Scholar]
  31. Liu, X.; Song, C.; Sun, L.; Ma, F. Research on Fault Intelligent Diagnosis Method Based on Knowledge Graph. Shandong Commun. Technol. 2019, 39, 18–20. [Google Scholar]
  32. Liu, R.; Xie, G.; Yuan, Z.; Song, W.; Wang, G. Research on Intelligent Fault Diagnosis Based on Knowledge Graph. Posts Telecommun. Des. Technol. 2020, 10, 30–35. [Google Scholar]
  33. Zheng, R.; Hu, Z.; Wen, Z.; Wang, J. AC Fault Detection Method for HVDC System. Guangdong Electr. Power 2020, 33, 97–104. [Google Scholar]
  34. Li, J.; Qian, J.; Li, J.; Shan, J. Influence of AC Side Fault of Converter Station on HVDC System. Yunnan Electr. Power 2007, 35, 10–12. [Google Scholar]
  35. Fan, S.; Yang, H.; Xiang, X.; Yang, H.; Li, W.; He, X. Modular Multilevel with DC Fault Ride through Capability Conversion Topology Deduction and Comparison. Electr. Power 2021, 54, 38–45. [Google Scholar]
  36. Song, X.; Gao, Y.; Ding, G.; Yan, H. Lightning Strike Interference and Fault Identification of Transmission System. Insul. Surge Arresters 2021, 1, 96–110. [Google Scholar]
  37. Narendra, K.; Sood, V.; Khorasani, K.; Patel, R. Application of a Radial Basis Function (RBF) Neural Network for Fault Diagnosis in a HVDC System. IEEE Trans. Power Syst. 1998, 13, 177–183. [Google Scholar] [CrossRef]
  38. Liu, X.; Dai, D.; Rao, H.; Cheng, C.; Ai, L.; Wu, S. Common Faults and Treatment Methods of Converter Valve in DC System. Electron. World 2015, 21, 115–117. [Google Scholar]
  39. Yuan, Y.; Wei, Z.; Lei, X.; Wang, W.; Sun, G. Survey of Commutation Failures in DC Transmission Systems. Electr. Power Autom. Equip. 2013, 33, 140–147. [Google Scholar]
  40. Wei, J.; Lin, L.; Cheng, T.; Mou, D. Commutation Failure Factors Analysis in HVDC Transmission System. J. Chongqing Univ. 2006, 29, 16–18. [Google Scholar]
  41. Chen, S.; Hua, X.; Xiang, W. Fault Diagnosis Method of Turbine Flow Passage Based on Improved KNN Algorithm and Its Application. Therm. Power Gener. 2021, 50, 84–90. [Google Scholar]
  42. Bhattacharya, G.; Ghosh, K.; Chowdhury, A. An Affinity-Based New Local Distance Function and Similarity Measure for KNN Algorithm. Pattern Recognit. Lett. 2012, 33, 356–363. [Google Scholar] [CrossRef]
  43. Maesschalck, R.; Rimbaud, D.; Massart, D. The Mahalanobis Distance. Chemom. Intell. Lab. Syst. 2000, 50, 1–18. [Google Scholar] [CrossRef]
  44. Maurer, C.; Qi, R.; Raghavan, V. A Linear Time Algorithm for Computing Exact Euclidean Distance Transforms of Binary Images in Arbitrary Dimensions. IEEE Trans. Pattern Anal. Mach. Intell. 2003, 25, 265–270. [Google Scholar] [CrossRef]
  45. Wang, Z.; Xu, K.; Hou, Y. Classification of Iris Based on KNN Algorithm with Different Distance Formulas. Wirel. Internet Technol. 2021, 13, 105–106. [Google Scholar]
  46. Available online: http://prpq.nea.gov.cn/gzdt/4638.html (accessed on 18 September 2020).
  47. Kalra, P. Fault Diagnosis for an HVDC System: A Feasibility Study of an Expert System Application. Electr. Power Syst. Res. 1988, 14, 83–89. [Google Scholar] [CrossRef]
  48. Liu, H.; Liu, J. Fault Diagnosis of Power Transformer Based on Graph Convolutional Network. J. Hunan Univ. Sci. Technol. 2021, 36, 75–81. [Google Scholar]
  49. Mejdoub, M.; Amar, C. Classification Improvement of Local Feature Vectors over The KNN Algorithm. Multimed. Tools Appl. 2013, 64, 197–218. [Google Scholar] [CrossRef]
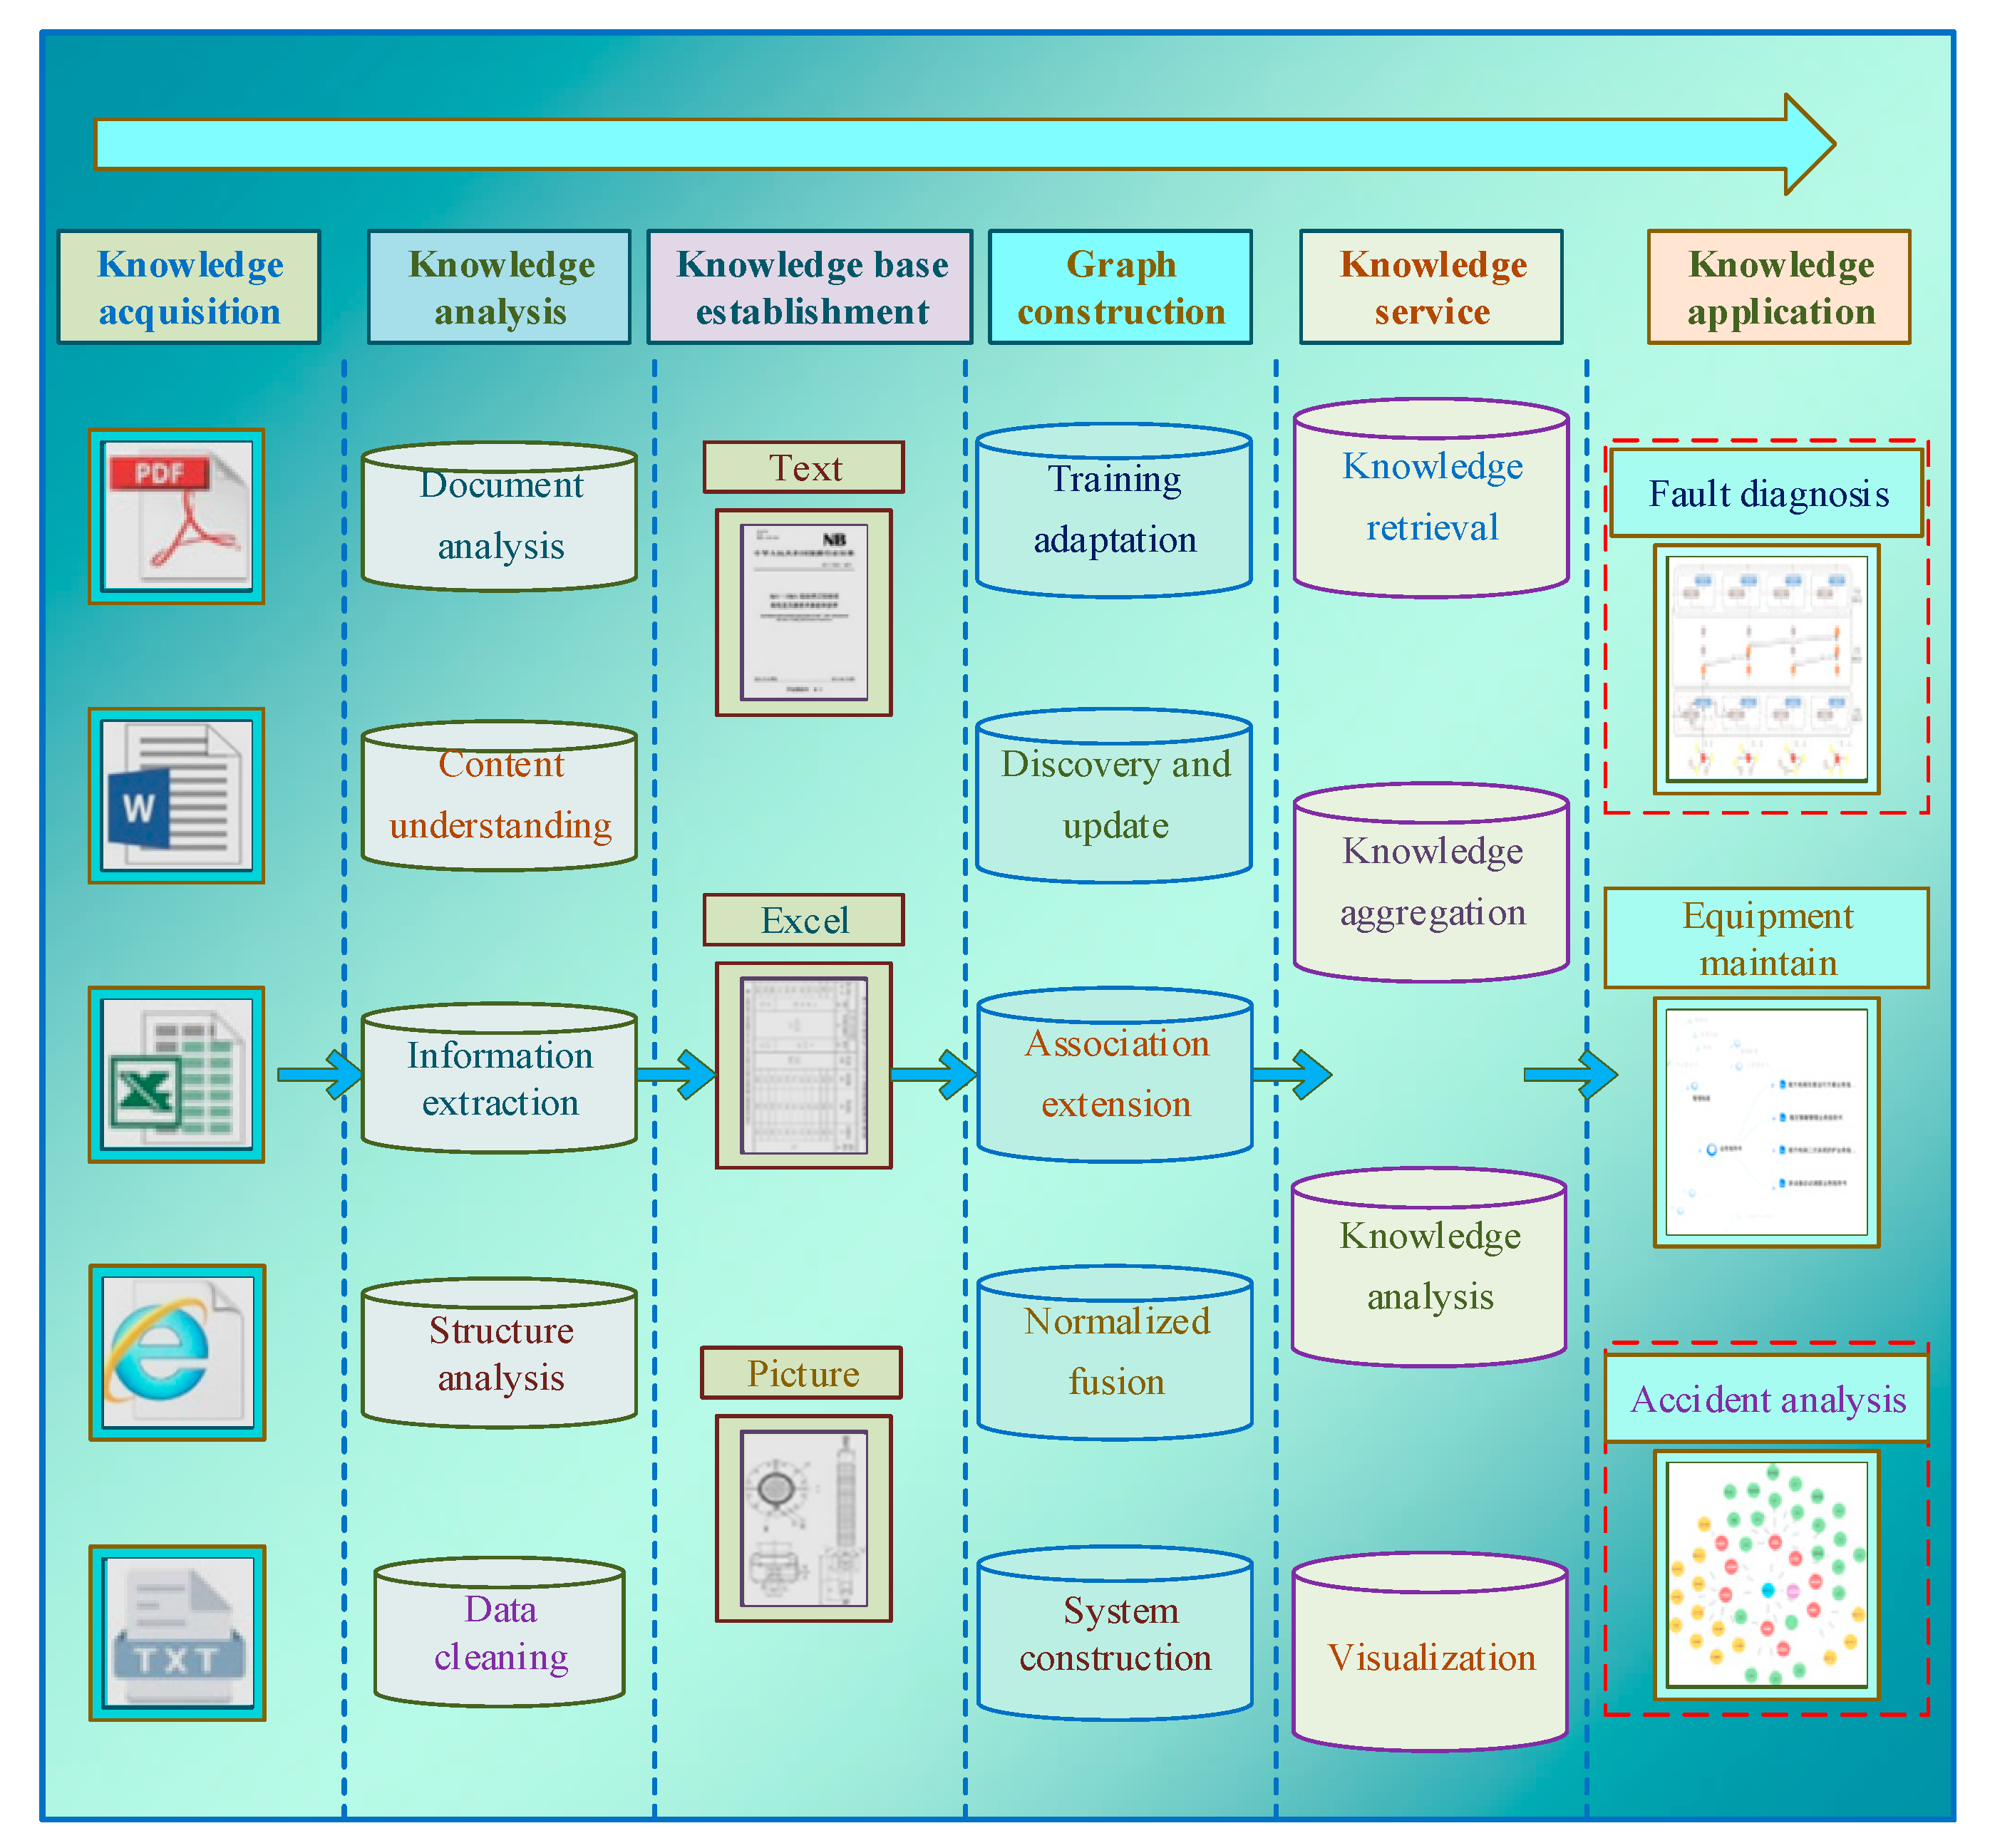
Figure 1. HVDC system KG construction diagram.
Sustainability 15 03717 g001
Figure 2. Schematic diagram of knowledge base classification.
Sustainability 15 03717 g002
Figure 3. Application of KG.
Sustainability 15 03717 g003
Figure 4. Practical application of the combination of fault diagnosis and KG.
Sustainability 15 03717 g004
Figure 5. KNN algorithm schematic diagram.
Sustainability 15 03717 g005
Figure 6. Schematic diagram of Tianshengqiao–Guangzhou HVDC project.
Sustainability 15 03717 g006
Figure 7. Fault type diagram corresponding to fault point of HVDC system.
Sustainability 15 03717 g007
Figure 8. Waveforms of HVDC system four types of faults. (a) AC fault data; (b) DC fault data; (c) converter valve fault data; (d) commutation failure fault data.
Sustainability 15 03717 g008aSustainability 15 03717 g008b
Figure 9. KNN algorithm fault diagnosis flow chart.
Sustainability 15 03717 g009
Figure 10. Confusion matrix of experimental results for test set Y1. (a) KNN model test result diagram; (b) SVM model test result diagram; (c) BC model test result diagram.
Sustainability 15 03717 g010aSustainability 15 03717 g010b
Figure 11. Confusion matrix of experimental results for test set Y2. (a) KNN model test result diagram; (b) SVM model test result diagram; (c) BC model test result diagram.
Sustainability 15 03717 g011aSustainability 15 03717 g011b
Figure 12. Confusion matrix of experimental results for test set Y3. (a) KNN model test result diagram; (b) SVM model test result diagram; (c) BC model test result diagram.
Sustainability 15 03717 g012aSustainability 15 03717 g012b
Table 1. Pseudo code of KNN model.
1: Establish KNN algorithm model;
2: Set KNN algorithm parameters: K, d ;
3: Import data and select the test set;
4: Calculate similarity;
5: Calculate the distance between training data and unknown data according to the selected d ;
6: Calculate weight and judge similarity according to w ( x i , y i ) ;
7: select front K data;
8: Record the times of each category;
9: Use the category with the most occurrences as the category of unknown data;
10: Repeated to judge all test data.
Table 2. Channel name and meaning.
SignalDescription MeaningSignalDescription Meaning
UACA(V)A-phase AC voltageIACD_L3(A)C-phase AC current of D-bridge valve side
UACB(V)B-phase AC voltageUDL(V)DC line voltage
UACC(V)C-phase AC voltageUDN(V)Neutral bus voltage
IACY_L1(A)A-phase AC current of Y-bridge valve sideIDN(A)Neutral bus current
IACY_L2(A)B-phase AC current of Y-bridge valve sideIDE(A)Grounding pole bus current
IACY_L3(A)C-phase AC current of Y-bridge valve sideIDH(A)High-voltage bus current
IACD_L1(A)A-phase AC current of D-bridge valve sideIDL(A)DC line current
IACD_L2(A)B-phase AC current of D-bridge valve sideSustainability 15 03717 i001Sustainability 15 03717 i002
Table 3. Parameter settings of three methods.
MethodParameter NameParameter Setting
KNNNeighbors: K7
Metric distanceEuclidean distance
Weight typeInverse distance
SVMPenalty coefficient: C1
KernelGaussian
Decision function shapeOne-versus-one
BCNuclear typeGaussian
Table 4. Experimental accuracy of three test sets.
Test SampleNumber of SamplesNumber of Positive SamplesNumber of Negative DataAccuracy
KNNSVMBCKNNSVMBCKNNSVMBC
Y112109823483.3%75%66.7%
Y2444439330511100%88.6%75%
Y356564850086100%85.7%89.3%
Disclaimer/Publisher’s Note: The statements, opinions and data contained in all publications are solely those of the individual author(s) and contributor(s) and not of MDPI and/or the editor(s). MDPI and/or the editor(s) disclaim responsibility for any injury to people or property resulting from any ideas, methods, instructions or products referred to in the content.