


Assessing the Role of Land-Use Planning in Near Future Climate-Driven Scenarios in Chilean Coastal Cities

 , , and
Abstract
1. Introduction
1.1. Climate Change and Land-Use Planning for Adaptation in Coastal Areas
1.2. Climate Change and Land-Use Planning in Chilean Coastal Areas
2. Methodology
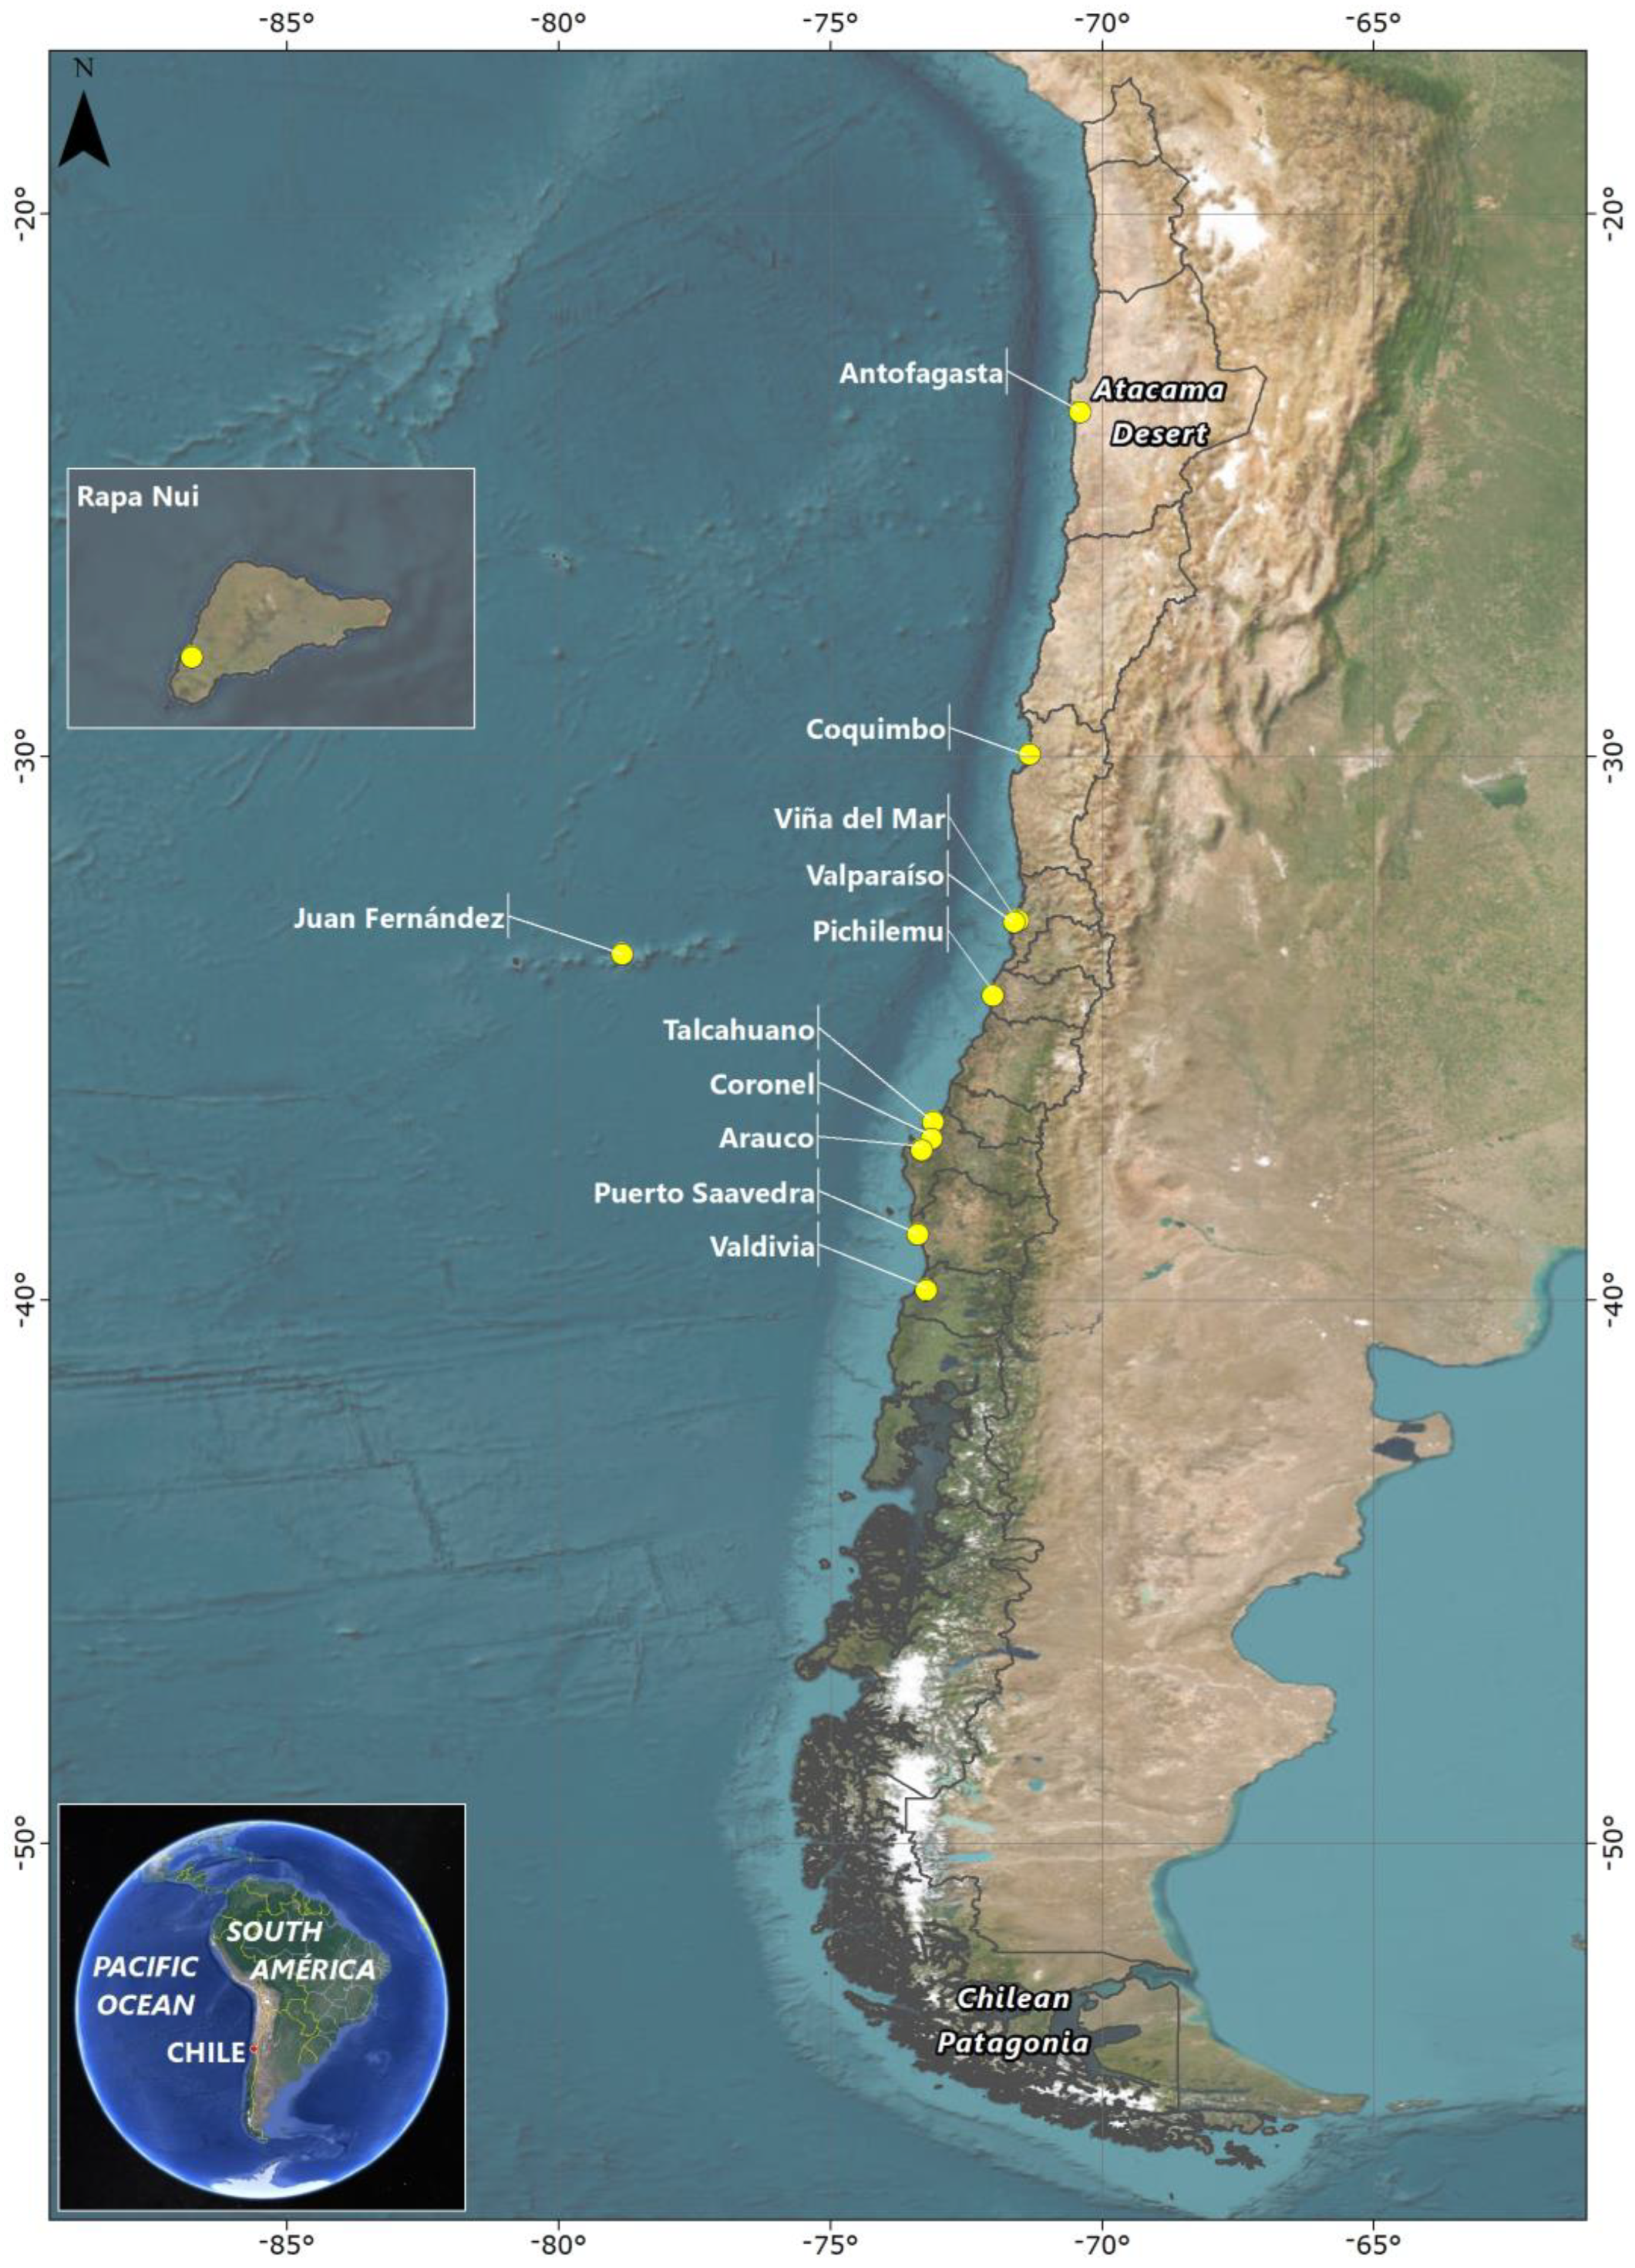
2.1. Selection of Examined Municipalities according to Their Exposure
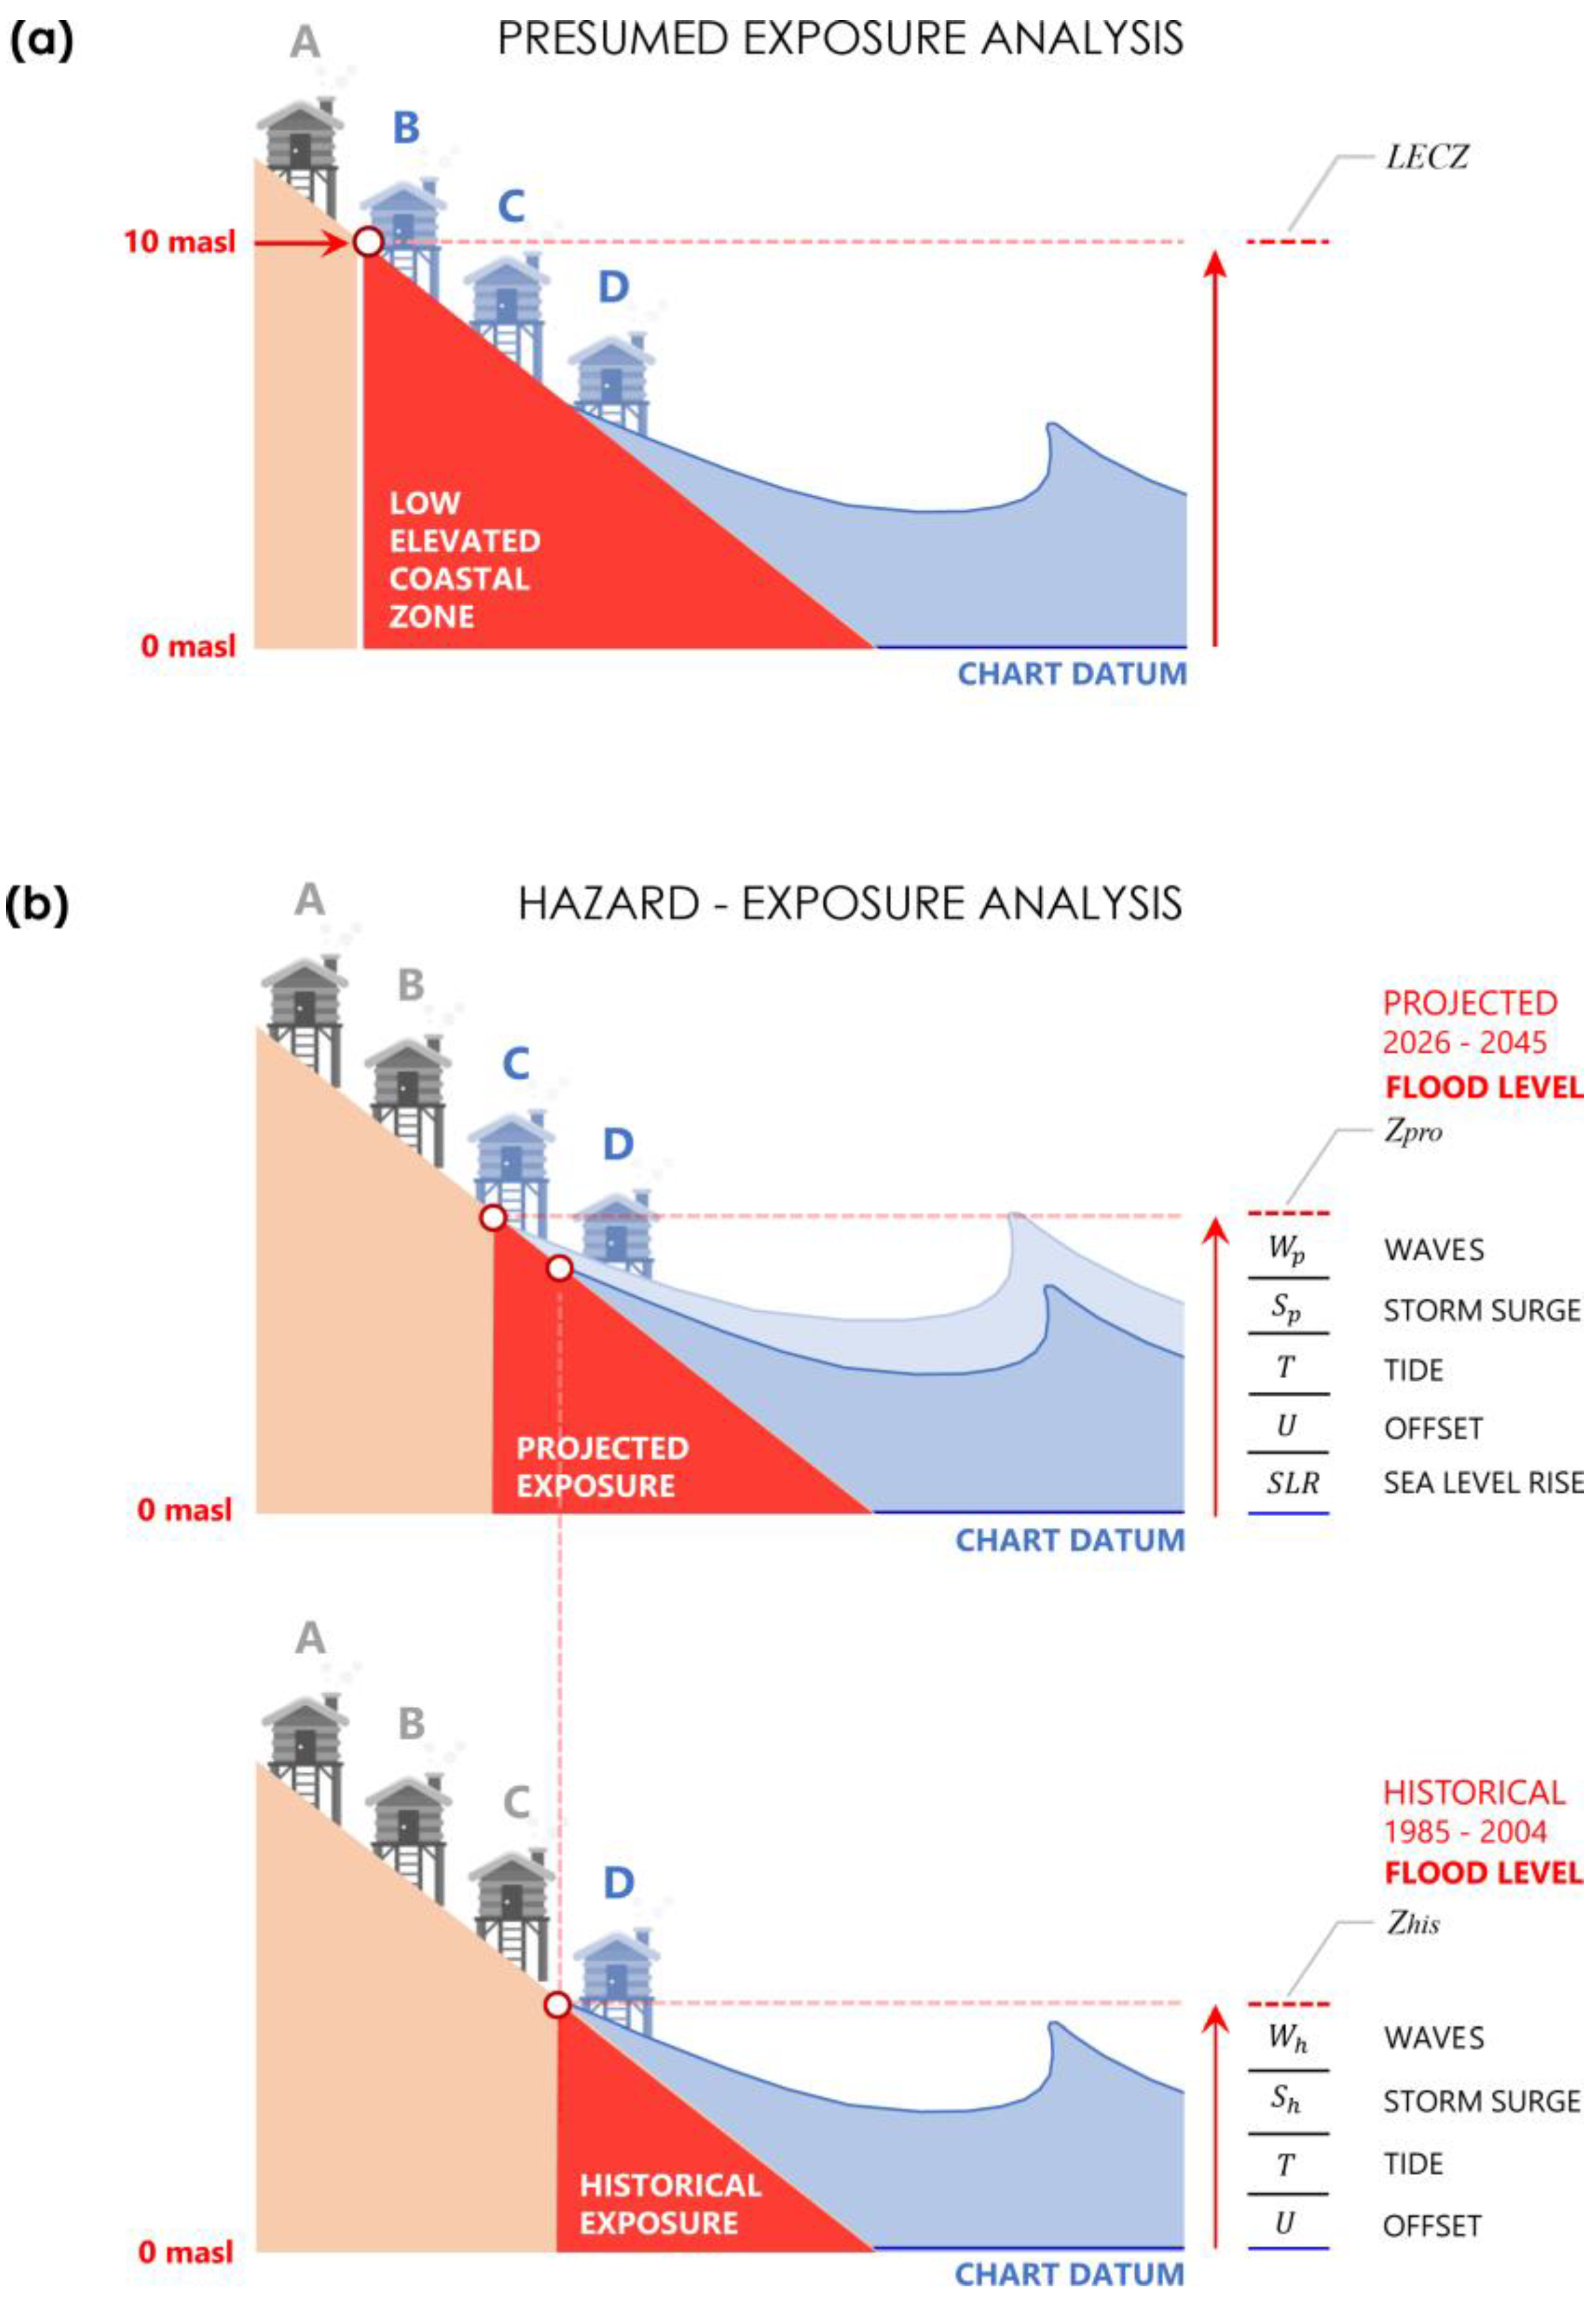
2.2. Computation of the Flooding Hazard
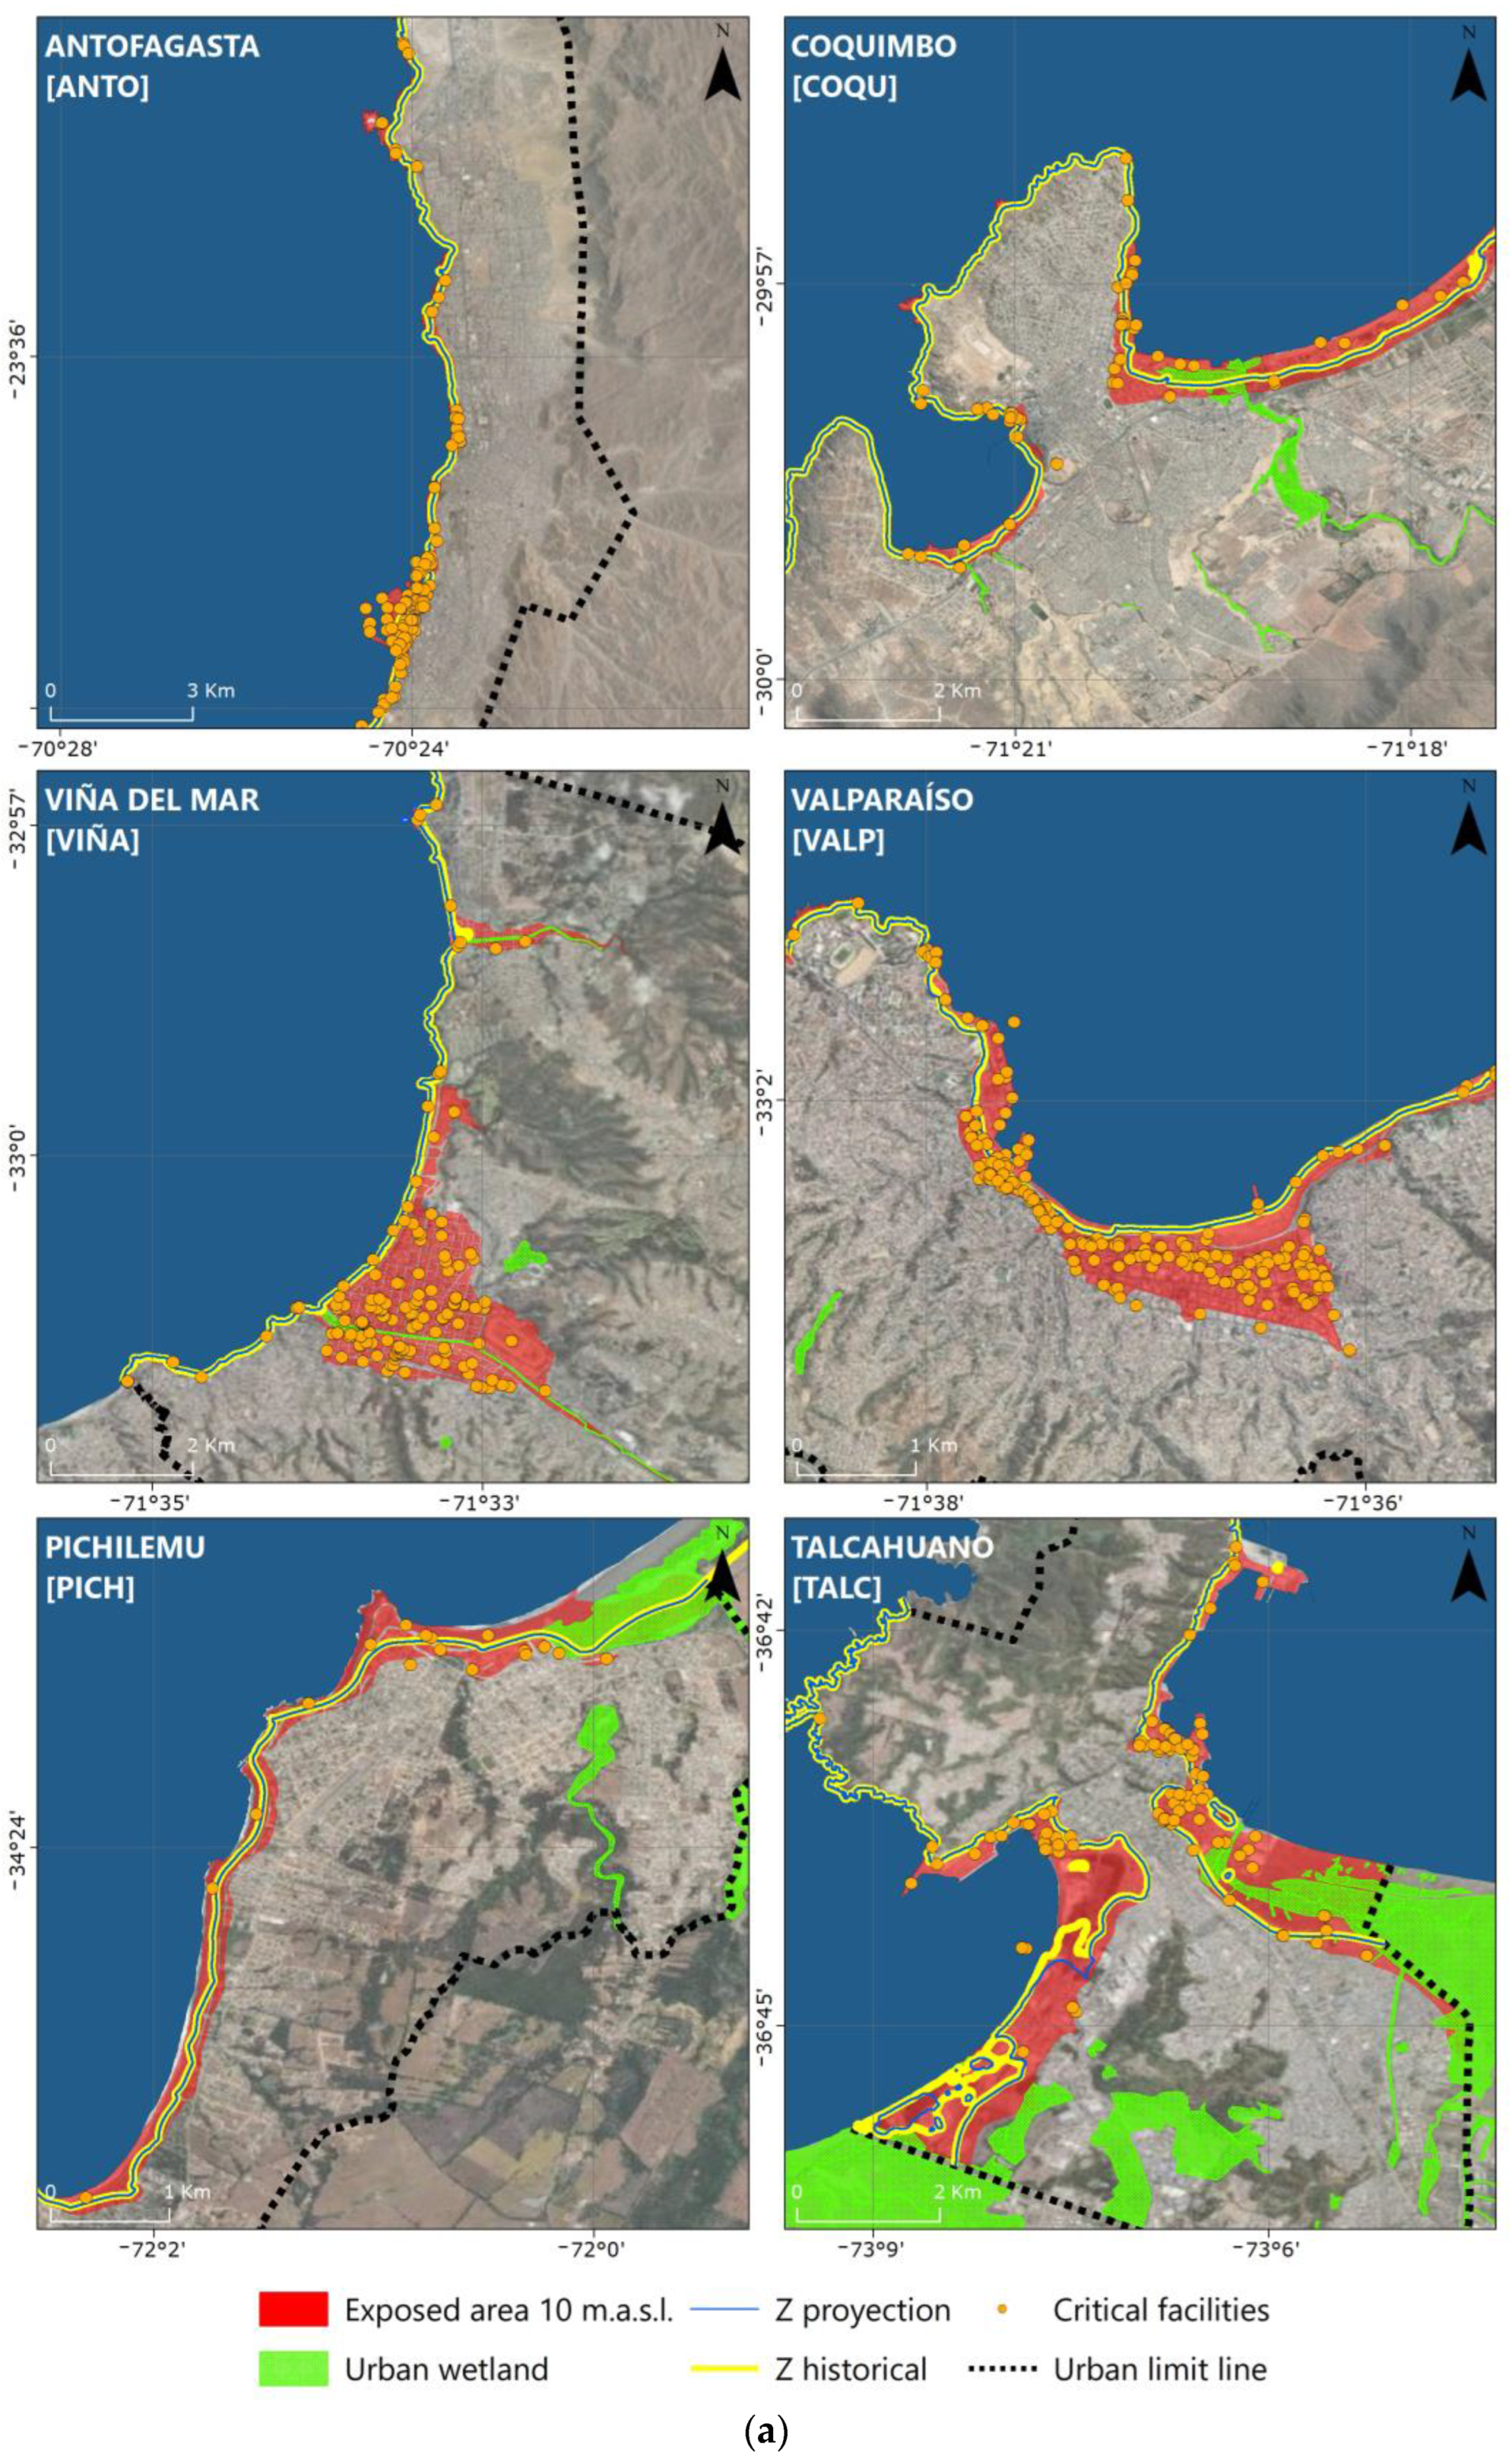
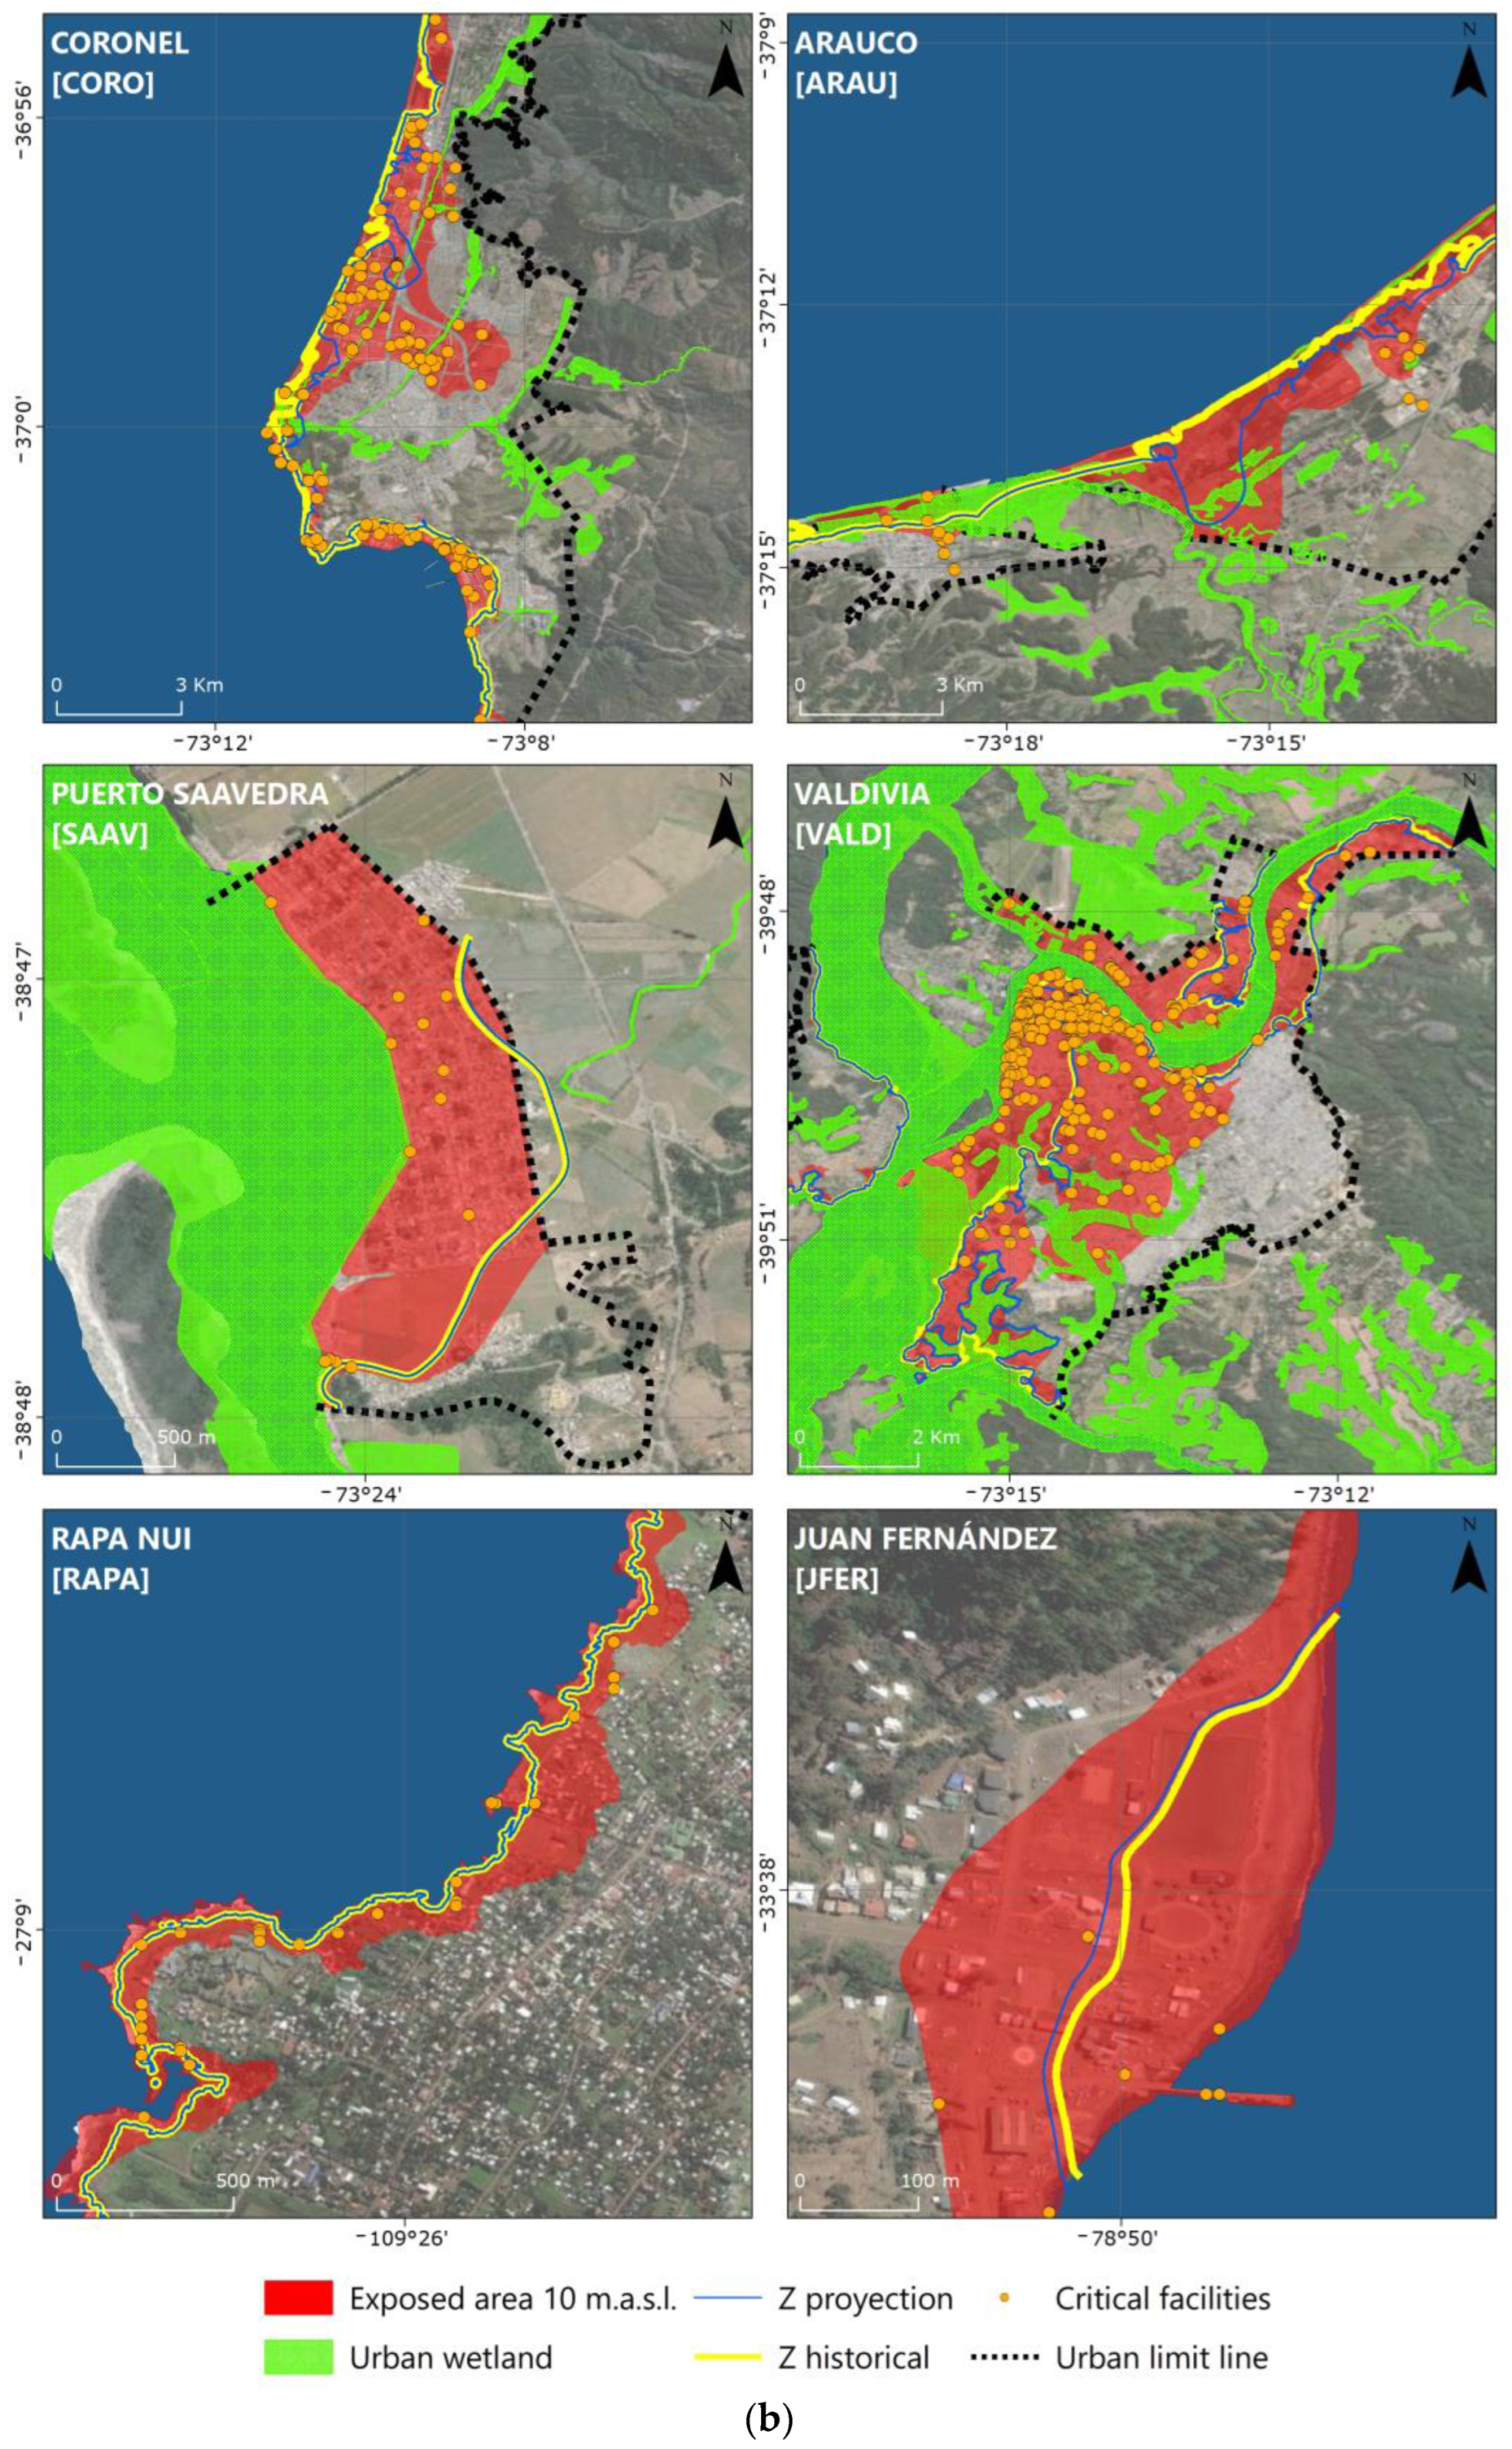
2.3. Land-Use Planning and Hazard Exposure in Significant Chilean Urban Coastal Areas
3. Results
3.1. Selection of Examined Municipalities according to Their Exposure
3.2. Land-Use Planning Analysis Based on Presumed Exposure Data (LECZ)
3.3. Land-Use Planning Analysis Based on Hazard Exposure Data (Historical and Projected)
4. Discussion
4.1. Relation between Presumed Exposure and Hazard Exposure Analysis
4.2. Perspectives on Local Urban Planning under Risk and Climate Change
4.3. Limitations of Land-Use Planning Analysis
4.4. Limitations on th Estimation of the Flood Hazard
5. Conclusions
Supplementary Materials
Author Contributions
Funding
Institutional Review Board Statement
Informed Consent Statement
Data Availability Statement
Acknowledgments
Conflicts of Interest
References
- IPCC. Summary for Policymakers. In Climate Change 2021: The Physical Science Basis. Contribution of Working Group I to the Sixth Assessment Report of the Intergovernmental Panel on Climate Change; Cambridge University Press: Cambridge, MA, USA, 2021. [Google Scholar]
- Pelling, M. The Vulnerability of Cities to Disasters and Climate Change: A Conceptual Framework. In Coping with Global Environmental Change, Disasters and Security; Brauch, H.G., Oswald Spring, Ú., Mesjasz, C., Grin, J., Kameri-Mbote, P., Chourou, B., Dunay, P., Birkmann, J., Eds.; Hexagon Series on Human and Environmental Security and Peace; Springer: Berlin/Heidelberg, Germany, 2011; Volume 5, pp. 549–558. ISBN 978-3-642-17775-0. [Google Scholar]
- McGranahan, G.; Balk, D.; Anderson, B. The Rising Tide: Assessing the Risks of Climate Change and Human Settlements in Low Elevation Coastal Zones. Environ. Urban. 2016, 19, 17–37. [Google Scholar] [CrossRef]
- Seavitt Nordenson, C.; Nordenson, G.; Chapman, J. Structures of Coastal Resilience; Island Press: Washington, DC, USA, 2018. [Google Scholar]
- United Nations. United Nations New Urban Agenda: H III: Habitat III: Quito 17–20 October 2016; United Nations: Nairobi, Kenya, 2017; ISBN 978-92-1-132731-1. [Google Scholar]
- Tsimopoulou, V.; Vrijling, J.K.; Kok, M.; Jonkman, S.; Stijnen, J.W. Economic Implications of Multi-Layer Safety Projects for Flood Protection. In Safety, Reliability and Risk Analysis: Beyond the Horizon; Steenbergen, R.D.J.M., van Gelder, P.H.A.J.M., Miraglia, S., Vrouwenvelder, A.C.W.M., Eds.; CRC Press: Boca Raton, Florida, 2013; pp. 891–912. [Google Scholar]
- Macintosh, A. Coastal Climate Hazards and Urban Planning: How Planning Responses Can Lead to Maladaptation. Mitig. Adapt. Strateg. Glob. Chang. 2013, 18, 1035–1055. [Google Scholar] [CrossRef]
- Gargiulo, C.; Battarra, R.; Tremiterra, M.R. Coastal Areas and Climate Change: A Decision Support Tool for Implementing Adaptation Measures. Land Use Policy 2020, 91, 104413. [Google Scholar] [CrossRef]
- Hamin, E.M.; Gurran, N. Urban Form and Climate Change: Balancing Adaptation and Mitigation in the U.S. and Australia. Habitat Int. 2009, 33, 238–245. [Google Scholar] [CrossRef]
- Sudmeier-Riex, K.I. Resilience-an Emerging Paradigm of Danger or of Hope? Disaster Prev. Manag. 2014, 23, 67–80. [Google Scholar] [CrossRef]
- Contreras-López, M.; Larraguibel, C.; Winckler, P.; Bassi, N.; Pérez, M. Determinación Del Riesgo de Los Impactos Del Cambio Climático En Las Costas de Chile; Volumen 2: Exposición de zonas costeras; Chilean Ministry of the Environment (MMA): Santiago, Chile, 2019. [Google Scholar]
- Garreaud, R.D. Cambio Climático: Bases Físicas e Impactos En Chile. Revista Tierra Adentro-INIA 2011, 93. Available online: https://bibliotecadigital.ciren.cl/handle/20.500.13082/29289 (accessed on 15 March 2022).
- Ruiz, A.; Dove, M. The World Bank Group Climate Risk Country Profile: Chile; World Bank Group: Washington, DC, USA, 2021. [Google Scholar]
- Winckler Grez, P.; Aguirre, C.; Farías, L.; Contreras-López, M.; Masotti, Í. Evidence of Climate-Driven Changes on Atmospheric, Hydrological, and Oceanographic Variables along the Chilean Coastal Zone. Clim. Chang. 2020, 163, 633–652. [Google Scholar] [CrossRef]
- Morales, E.; Winckler, P.; Herrera, M. Costas de Chile. Medio Natural, Cambio Climático, Ingeniería Oceánica y Gestión Costera; Servicio Hidrográfico y Oceanográfico de la Armada de Chile: Valparaíso, Chile, 2019; ISBN 978-956-235-031-0. [Google Scholar]
- Martínez, C.; Arenas, F.; Bergamini, K.; Urrea, J. Hacia Una Ley de Costas En Chile: Criterios y Desafíos En Un Contexto de Cambio Climático; Policy Papers CIGIDEN; Research Center for Integrated Disaster Risk Management (CIGIDEN): Santiago, Chile, 2019; ISBN 978-956-14-2445-6. [Google Scholar]
- Martínez, C.; López, P.; Rojas, C.; Qüense, J.; Hidalgo, R.; Arenas, F. A Sustainability Index for Anthropized and Urbanized Coasts: The Case of Concón Bay, Central Chile. Appl. Geogr. 2020, 116, 102166. [Google Scholar] [CrossRef]
- MINVU Ley General de Urbanismo y Construcciones; Ministry of Housing and Urbanism: Santiago, Chile, 2020.
- Martínez, C.; Moris, R.; Qüense, J. Valoración de Las Áreas de Riesgo Por Tsunami y Potencial de Evacuación: Propuestas Para La Reducción Del Riesgo de Desastres a Escala Local; Pontificia Universidad Católica de Chile: Santiago, Chile, 2016; ISBN 978-956-14-2053-3. [Google Scholar]
- Hettiarachchi, M.; Morrison, T.H.; McAlpine, C. Forty-Three Years of Ramsar and Urban Wetlands. Glob. Environ. Chang. 2015, 32, 57–66. [Google Scholar] [CrossRef]
- Medlock, J.M.; Leach, S.A. Effect of Climate Change on Vector-Borne Disease Risk in the UK. Lancet Infect. Dis. 2015, 15, 721–730. [Google Scholar] [CrossRef]
- Rojas, C.; Munizaga, J.; Rojas, O.; Martínez, C.; Pino, J. Urban Development versus Wetland Loss in a Coastal Latin American City: Lessons for Sustainable Land Use Planning. Land Use Policy 2019, 80, 47–56. [Google Scholar] [CrossRef]
- Kandus, P.; Minotti, P.G.; Morandeira, N.S.; Grimson, R.; González Trilla, G.; González, E.B.; San Martín, L.; Gayol, M.P. Remote Sensing of Wetlands in South America: Status and Challenges. Int. J. Remote Sens. 2018, 39, 993–1016. [Google Scholar] [CrossRef]
- Arenas, F.; Lagos, M.; Hidalgo, R. Los Riesgos Naturales En La Planificación Territorial; Centro de Políticas Públicas UC: Santiago, Chile, 2010; ISBN 0718-9745. [Google Scholar]
- Tolman, H.L.; Accensi, M.; Alves, H.; Ardhuin, F.; Bidlot, J.; Booij, N.; Bennis, A.-C.; Campbell, T.; Chalikov, D.; Chawla, A.; et al. User Manual and System Documentation of WAVEWATCH III R Version 4.18; National Oceanic and Atmospheric Administration (NOAA): Washington, DC, USA, 2013.
- Taylor, K.E.; Stouffer, R.J.; Meehl, G.A. An Overview of CMIP5 and the Experiment Design. Bull. Am. Meteorol. Soc. 2012, 93, 485–498. [Google Scholar] [CrossRef]
- WCRP World Climate Research Programme. Available online: https://esgf-node.llnl.gov/search/cmip5/ (accessed on 15 March 2022).
- Hemer, M.A.; Trenham, C.E. Evaluation of a CMIP5 Derived Dynamical Global Wind Wave Climate Model Ensemble. Ocean. Model. 2016, 103, 190–203. [Google Scholar] [CrossRef]
- National Geophysical Data Center 2-Minute Gridded Global Relief Data (ETOPO2v2), Natl. Oceanic and Atmos. Admin., U.S. Dept. of Commerce. Available online: http://www.ngdc.noaa.gov/mgg/fliers/06mgg01.html (accessed on 15 March 2022).
- Wessel, P.; Smith, W.H.F. A Global, Self-Consistent, Hierarchical, High-Resolution Shoreline Database. J. Geophys. Res. 1996, 101, 8741–8743. [Google Scholar] [CrossRef]
- Winckler, P.; Esparza, C.; Mora, J.; Melo, O.; Bambach, N.; Contreras-López, M.; Sactic, M.I. Impacts in Ports on a Tectonically Active Coast for Climate-Driven Projections under the RCP 8.5 Scenario: 7 Chilean Ports under Scrutiny. Coast. Eng. J. 2022, 64, 387–405. [Google Scholar] [CrossRef]
- Beyá, J.; Álvarez, M.; Gallardo, A.; Hidalgo, H.; Winckler, P. Generation and Validation of the Chilean Wave Atlas Database. Ocean. Model. 2017, 116, 16–32. [Google Scholar] [CrossRef]
- Stockdon, H.F.; Holman, R.A.; Howd, P.A.; Sallenger, A.H., Jr. Empirical parameterization of setup, swash, and runup. Coast. Eng. 2006, 53, 573–588. [Google Scholar] [CrossRef]
- CEPAL. Efectos Del Cambio Climático En La Costa de América Latina y El Caribe. Dinámicas, Tendencias y Variabilidad Climática; CEPAL: Santiago, Chile, 2015. [Google Scholar]
- SHOA Cotas de Marea. Available online: https://tiendavirtual.shoa.cl/index.php?option=com_virtuemart&view=category&virtuemart_category_id=54&Itemid=590 (accessed on 15 March 2022).
- Vicuña, M.; León, J.; Guzmán, S. Urban Form Planning and Tsunami Risk Vulnerability: Analysis of 12 Chilean Coastal Cities. Environ. Plan. B Urban Anal. City Sci. 2022, 49, 1967–1979. [Google Scholar] [CrossRef]
- UNISDR. Terminology on Disaster Risk Reduction; United Nations-International Strategy for Disaster Reduction (ISDR): Geneva, Switzerland, 2009; p. 30. [Google Scholar]
- Plafker, G.; Savage, J.C. Mechanism of the Chilean Earthquakes of May 21 and 22, 1960. Geol. Soc. Am. Bull. 1970, 81, 1001. [Google Scholar] [CrossRef]
- Poduje, I. El Despoblamiento de Valparaíso. Análisis de Resultados Censo 2017; ATISBA: Santiago de Chile, Chile, 2018. [Google Scholar]
- Fainstein, S.S.; Fainstein, N.I. City Planning and Political Values. Urban Aff. Q. 1971, 6, 341–362. [Google Scholar] [CrossRef]
- Orellana, A.; Vicuña, M.; Moris, R. Planificación Urbana y Calidad de Vida: Aproximación al Estado de La Planificación Local En Chile. CVU 2017, 10, 88. [Google Scholar] [CrossRef]
- Watson, V. ‘The Planned City Sweeps the Poor Away…’: Urban Planning and 21st Century Urbanisation. Prog. Plan. 2009, 72, 151–193. [Google Scholar] [CrossRef]
- MINVU. Hacia Una Nueva Política Urbana Para Chile: Política Nacional de Desarrollo Urbano; MINVU: Santiago, Chile, 2014; Volume 4, ISBN 978-956-9432-05-7. [Google Scholar]
- Fischler, R. Fifty Theses on Urban Planning and Urban Planners. J. Plan. Educ. Res. 2012, 32, 107–114. [Google Scholar] [CrossRef]
- León, J.; Castro, S.; Mokrani, C.; Gubler, A. Tsunami Evacuation Analysis in the Urban Built Environment: A Multi-Scale Perspective through Two Modeling Approaches in Viña Del Mar, Chile. Coast. Eng. J. 2020, 62, 389–404. [Google Scholar] [CrossRef]
- Surtiari, G.; Setiadi, N.; Garschagen, M.; Brikmann, J.; Djalante, R.; Maunati, Y. Coastal Resilience in Indonesia: From Planning to Implementation; Policy Press University of Bristol: Bristol, UK, 2016. [Google Scholar]
- Massel, S. Ocean Surface Waves: Their Physics and Prediction; Advanced Series on Ocean Engineering; World Scientific: Singapore, 1996; Volume 11, ISBN 978-981-02-2109-6. [Google Scholar]
- SHOA. Catálogo de Cartas y Publicaciones Náuticas. Available online: https://shoabucket.s3.amazonaws.com/shoa.cl/documentos/publicaciones/3000.pdf (accessed on 28 October 2022).
- Kanamori, H. The Energy Release in Great Earthquakes. J. Geophys. Res. 1977, 82, 2981–2987. [Google Scholar] [CrossRef]
- Fritz, H.M.; Petroff, C.M.; Catalán, P.A.; Cienfuegos, R.; Winckler, P.; Kalligeris, N.; Weiss, R.; Barrientos, S.E.; Meneses, G.; Valderas-Bermejo, C.; et al. Field Survey of the 27 February 2010 Chile Tsunami. Pure Appl. Geophys. 2011, 168, 1989–2010. [Google Scholar] [CrossRef]
- Poulos, A.; Monsalve, M.; Zamora, N.; de la Llera, J.C. An Updated Recurrence Model for Chilean Subduction Seismicity and Statistical Validation of Its Poisson Nature. Bull. Seismol. Soc. Am. 2019, 109, 66–74. [Google Scholar] [CrossRef]
- Martínez, C.; Grez, P.W.; Martín, R.A.; Acuña, C.E.; Torres, I.; Contreras-López, M. Coastal Erosion in Sandy Beaches along a Tectonically Active Coast: The Chile Study Case. Prog. Phys. Geogr. Earth Environ. 2022, 46, 250–271. [Google Scholar] [CrossRef]
- Sepúlveda, I.; Liu, P.L.-F.; Grigoriu, M.; Haase, J.S.; Winckler, P. Non-Stationary Probabilistic Tsunami Hazard Assessments Compounding Tides and Sea Level Rise. Earth’s Future 2022, 10, e2022EF002965. [Google Scholar] [CrossRef]
- Sepúlveda, I.; Haase, J.S.; Liu, P.L.-F.; Grigoriu, M.; Winckler, P. Non-Stationary Probabilistic Tsunami Hazard Assessments Incorporating Climate-Change-Driven Sea Level Rise. Earth’s Future 2021, 9, e2021EF002007. [Google Scholar] [CrossRef]


| Dimension | Variable | Description | Data Source |
|---|---|---|---|
| Population density | Existing density (people/ha) | Ratio between existing population and one hectare. | 2017 Census data (https://inechile.maps.arcgis.com/apps/webappviewer/index.html?id=c2155cac57d04032bf6ca5f151cddd6d, accessed on 20 May 2022) |
| Planned maximum density (people/ha) | Ratio between maximum planned population (according to CRP) and one hectare. When maximum density is not planned, it was estimated using the following urban codes: building height, floor area ratio, and building footprint. | Ministry of Housing and Urbanism official information on planning instruments (2022) (https://www.observatoriourbano.cl/; http://seguimientoipt.minvu.cl/main.php, accessed on 17 March 2022) Local municipalities websites (2022) | |
| Land uses | Types of zones (prohibited and allowed uses in each CRP) | Land-use zoning, including: Residential Commercial Industrial Non-buildable | |
| Risk areas | Surface and type of risk areas (ha) | Territory identified as a flood risk area by the CRP | |
| Critical facilities | Number of buildings per CRP zone (#) | Primary physical structures, technical facilities, and systems that are socially, economically, or operationally essential to the functioning of a society or community, both in routine circumstances and in the extreme circumstances of an emergency [37]. Mapping of: Health buildings (public and private establishments) Education (public and private establishments) Security (firefighters, research, police) Tourism (local development, tourism, and heritage) Industry (basic and dangerous services) Government (municipal services and municipal services and external) | Chilean infrastructure for geo-spatial data (https://www.ide.cl/, accessed on 16 January 2022) MMA [11] |
| Urban wetlands | Urban wetland surface (ha) | Proportion of urban wetlands within LECZ |
| Municipality | Acronym | Lon W | Lat S | Selection Criteria | (m) | (m) | CRP Enacted | CRP Mentions C.C. | CRP Mentions Tsunami | |
|---|---|---|---|---|---|---|---|---|---|---|
| Antofagasta | ANTO | 70°23′ | 23°39′ | Typical northern city | 0.19 | 4.67 | 4.88 | 2002 | No | Yes |
| Coquimbo | COQU | 71°17′ | 29°56′ | Evident erosion | 0.31 | 4.67 | 4.89 | 2019 | No | Yes |
| Viña del Mar | VIÑA | 71°33′ | 33°00′ | Conurbation | 0.55 | 4.74 | 4.97 | 2002 | No | No |
| Valparaíso | VALP | 71°35′ | 33°02′ | High | 0.93 | 4.74 | 4.97 | 2005 | No | No |
| Pichilemu | PICH | 72°00′ | 34°23′ | Low intervention | 0.30 | 4.82 | 5.04 | 2005 | No | No |
| Talcahuano | TALC | 73°07′ | 36°43′ | High | 1.00 | 4.92 | 5.14 | 2006 | No | No |
| Coronel | CORO | 73°08′ | 37°01′ | High | 0.61 | 4.90 | 5.12 | 2013 | No | Yes |
| Arauco | ARAU | 73°18′ | 37°14′ | High | 0.69 | 4.87 | 5.09 | 2014 | Yes | Yes |
| Puerto Saavedra | SAAV | 73°23′ | 38°47′ | High | 0.61 | 4.79 | 5.01 | 1964 | No | No |
| Valdivia | VALD | 73°14′ | 39°49′ | Low elevation | 0.39 | 4.78 | 5.01 | 1995 | No | No |
| Rapa Nui | RAPA | 109°20′ | 27°06′ | Remote island | - | 4.68 | 4.90 | 1971 | No | No |
| Juan Fernández | JFER | 78°49′ | 33°38′ | Remote island | - | 4.75 | 4.97 | 2013 | No | Yes |
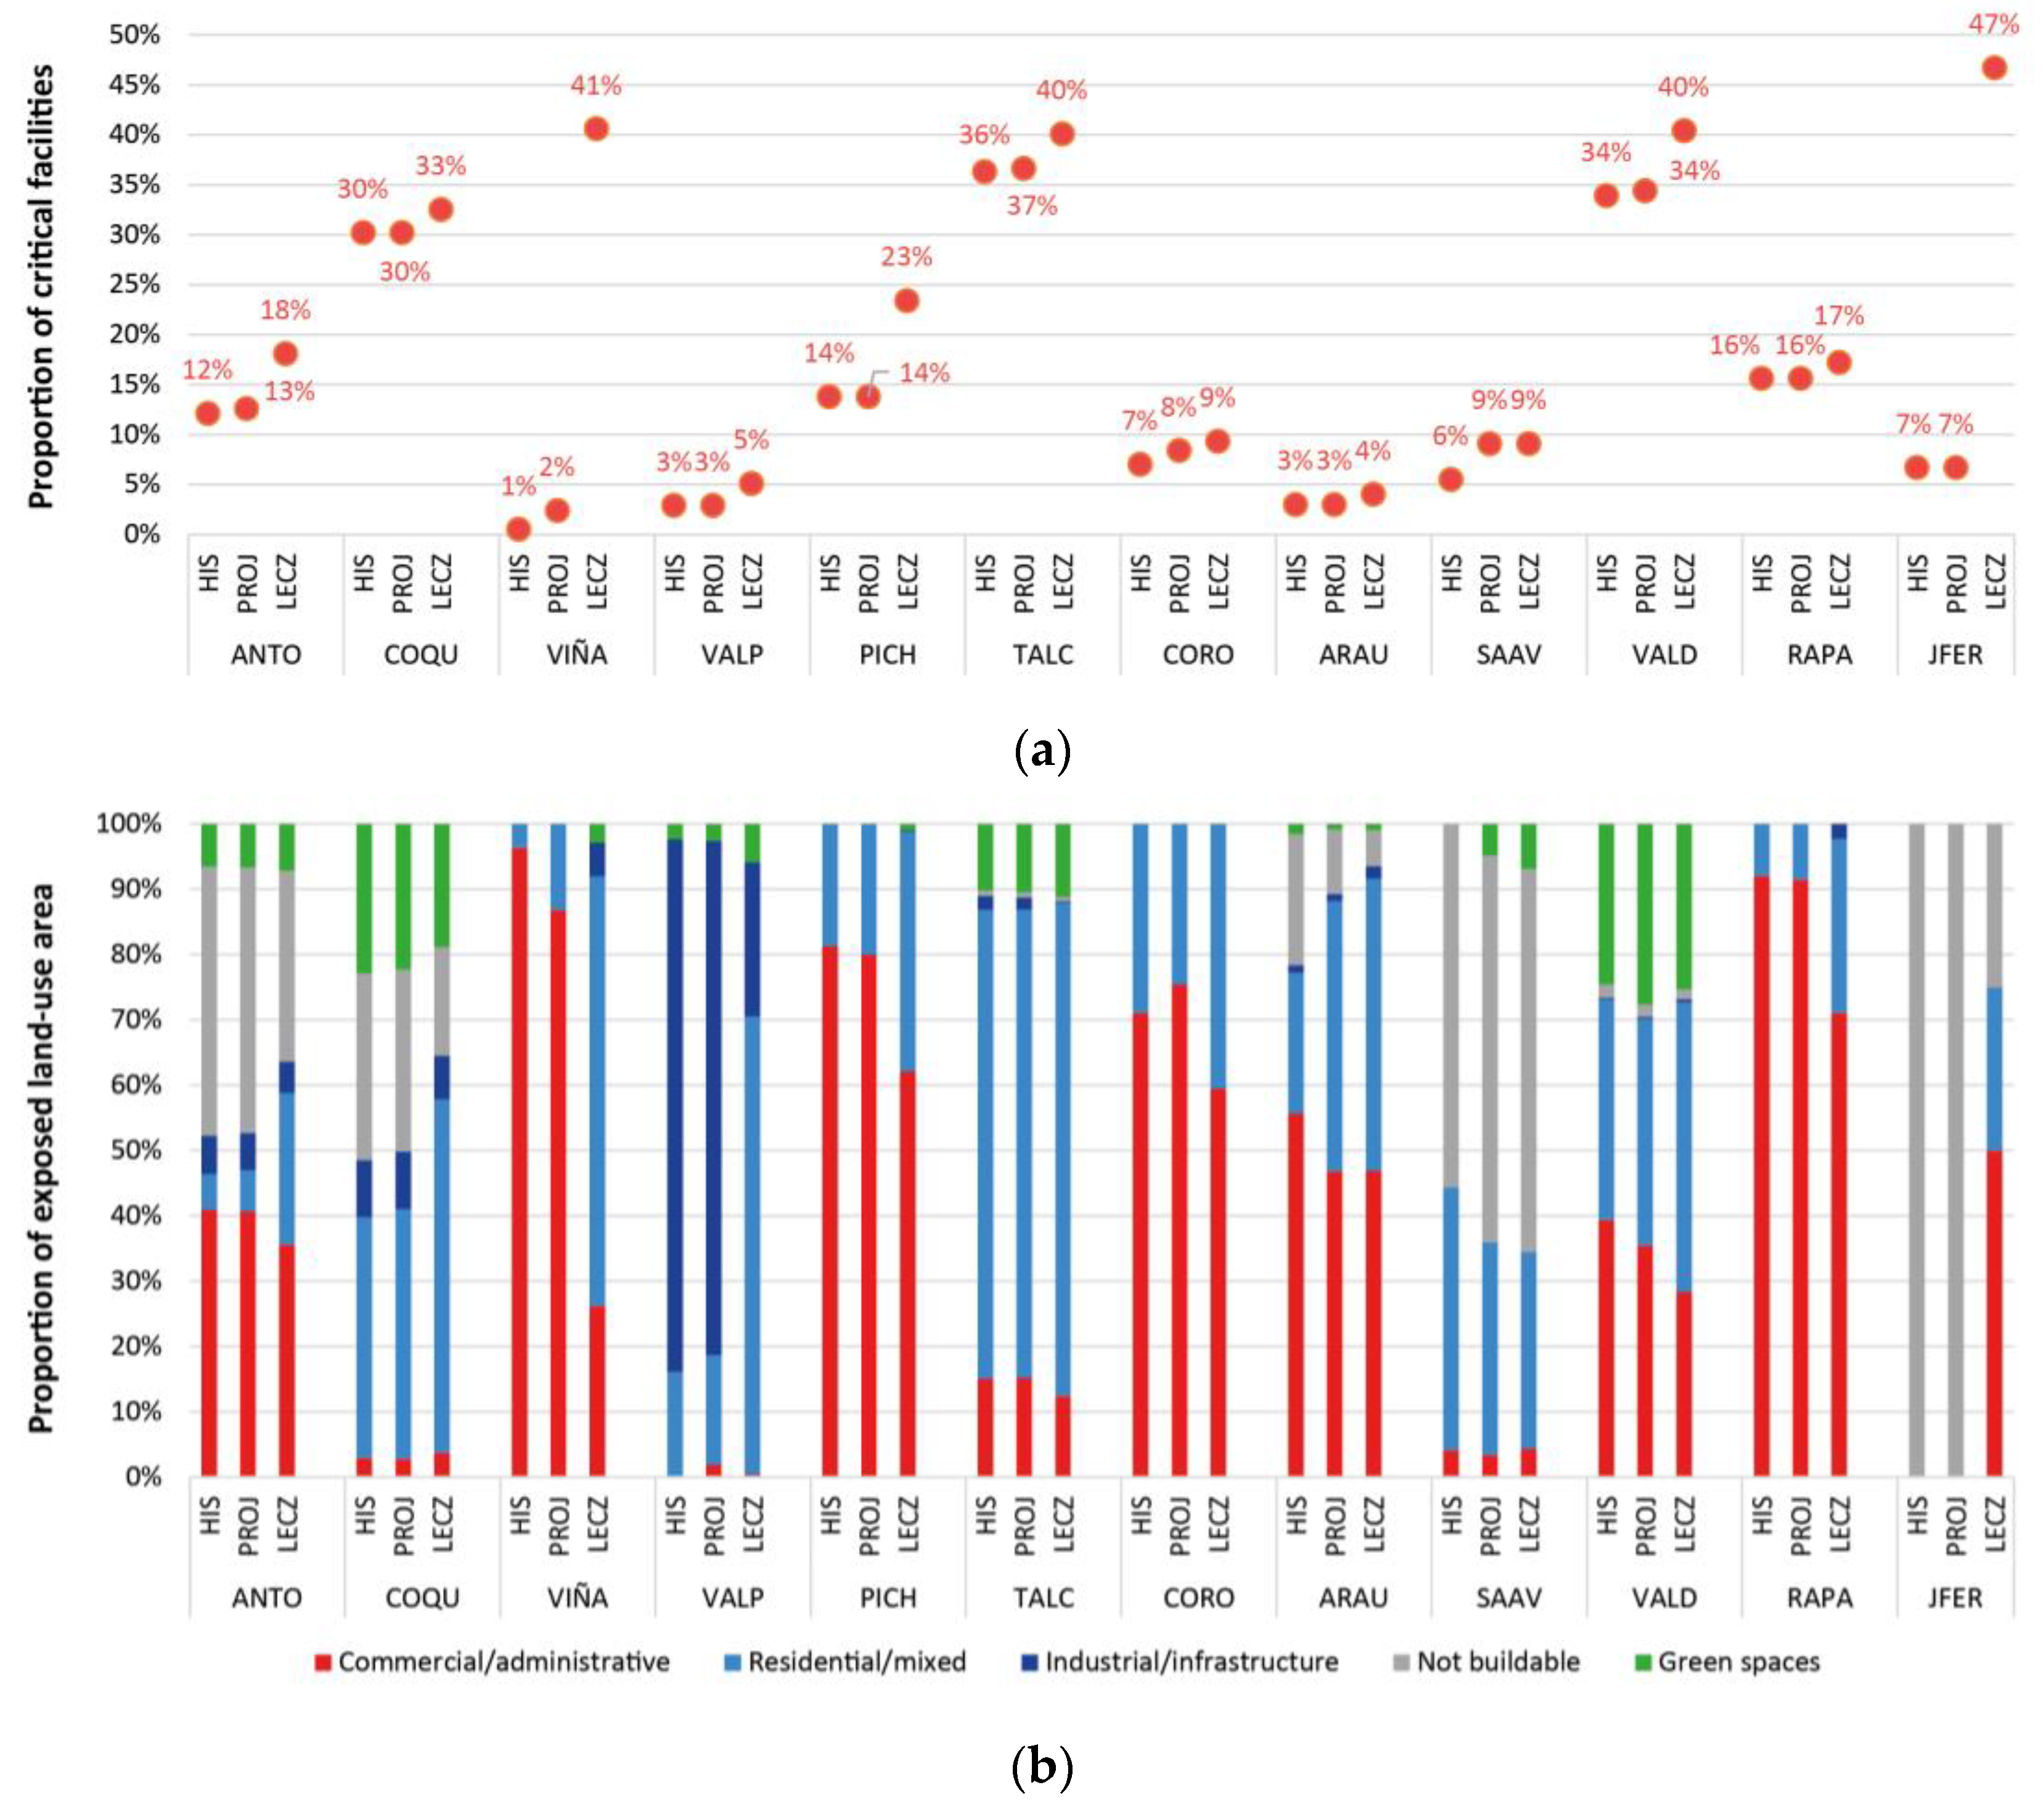
| Parameters | Unit | ANTO | COQU | VIÑA | VALP | PICH | TALC | CORO | ARAU | SAAV | VALD | RAPA | JFER | Sum |
|---|---|---|---|---|---|---|---|---|---|---|---|---|---|---|
| Total population | inhab | 361,873 | 227,730 | 334,248 | 296,655 | 16,394 | 151,749 | 116,262 | 36,257 | 12,450 | 166,080 | 7750 | 926 | 1,728,374 |
| Exposed population | inhab | 9,409 | 14,347 | 47,797 | 2,077 | 771 | 5463 | 1744 | 1885 | 149 | 15,778 | 1845 | 155 | 101,419 |
| Total urban area | km2 | 453.73 | 69.50 | 92.23 | 32.42 | 23.09 | 48.57 | 55.00 | 44.17 | 1.61 | 49.50 | 4.62 | 4.84 | 879.28 |
| Exposed urban area | km2 | 8.7 | 4.2 | 4.3 | 2.3 | 4.1 | 9.5 | 16.3 | 15.0 | 1.2 | 26.0 | 0.5 | 0.1 | 92.2 |
| Parameters | Unit | ANTO | COQU | VIÑA | VALP | PICH | TALC | CORO | ARAU | SAAV | VALD | RAPA | JFER | Mean |
| Exposed population | % | 2.6 | 6.3 | 14.3 | 0.7 | 4.7 | 3.6 | 1.5 | 5.2 | 1.2 | 9.5 | 23.8 | 16.7 | 7.5 |
| Exposed urban area | % | 1.9 | 6.0 | 4.6 | 7.1 | 18.0 | 19.5 | 29.6 | 33.9 | 73.1 | 52.6 | 9.7 | 2.6 | 21.6 |
| Exposed critical facilities | % | 18.1 | 32.5 | 40.6 | 5.1 | 23.4 | 40.1 | 9.3 | 4.0 | 9.1 | 40.4 | 17.2 | 46.7 | 23.9 |
| Exposed wetlands area | % | 7.1 | 26.8 | 47.1 | 0.0 | 35.9 | 33.3 | 8.9 | 40.8 | 40.5 | 58.8 | 0.0 | 0.0 | 24.9 |
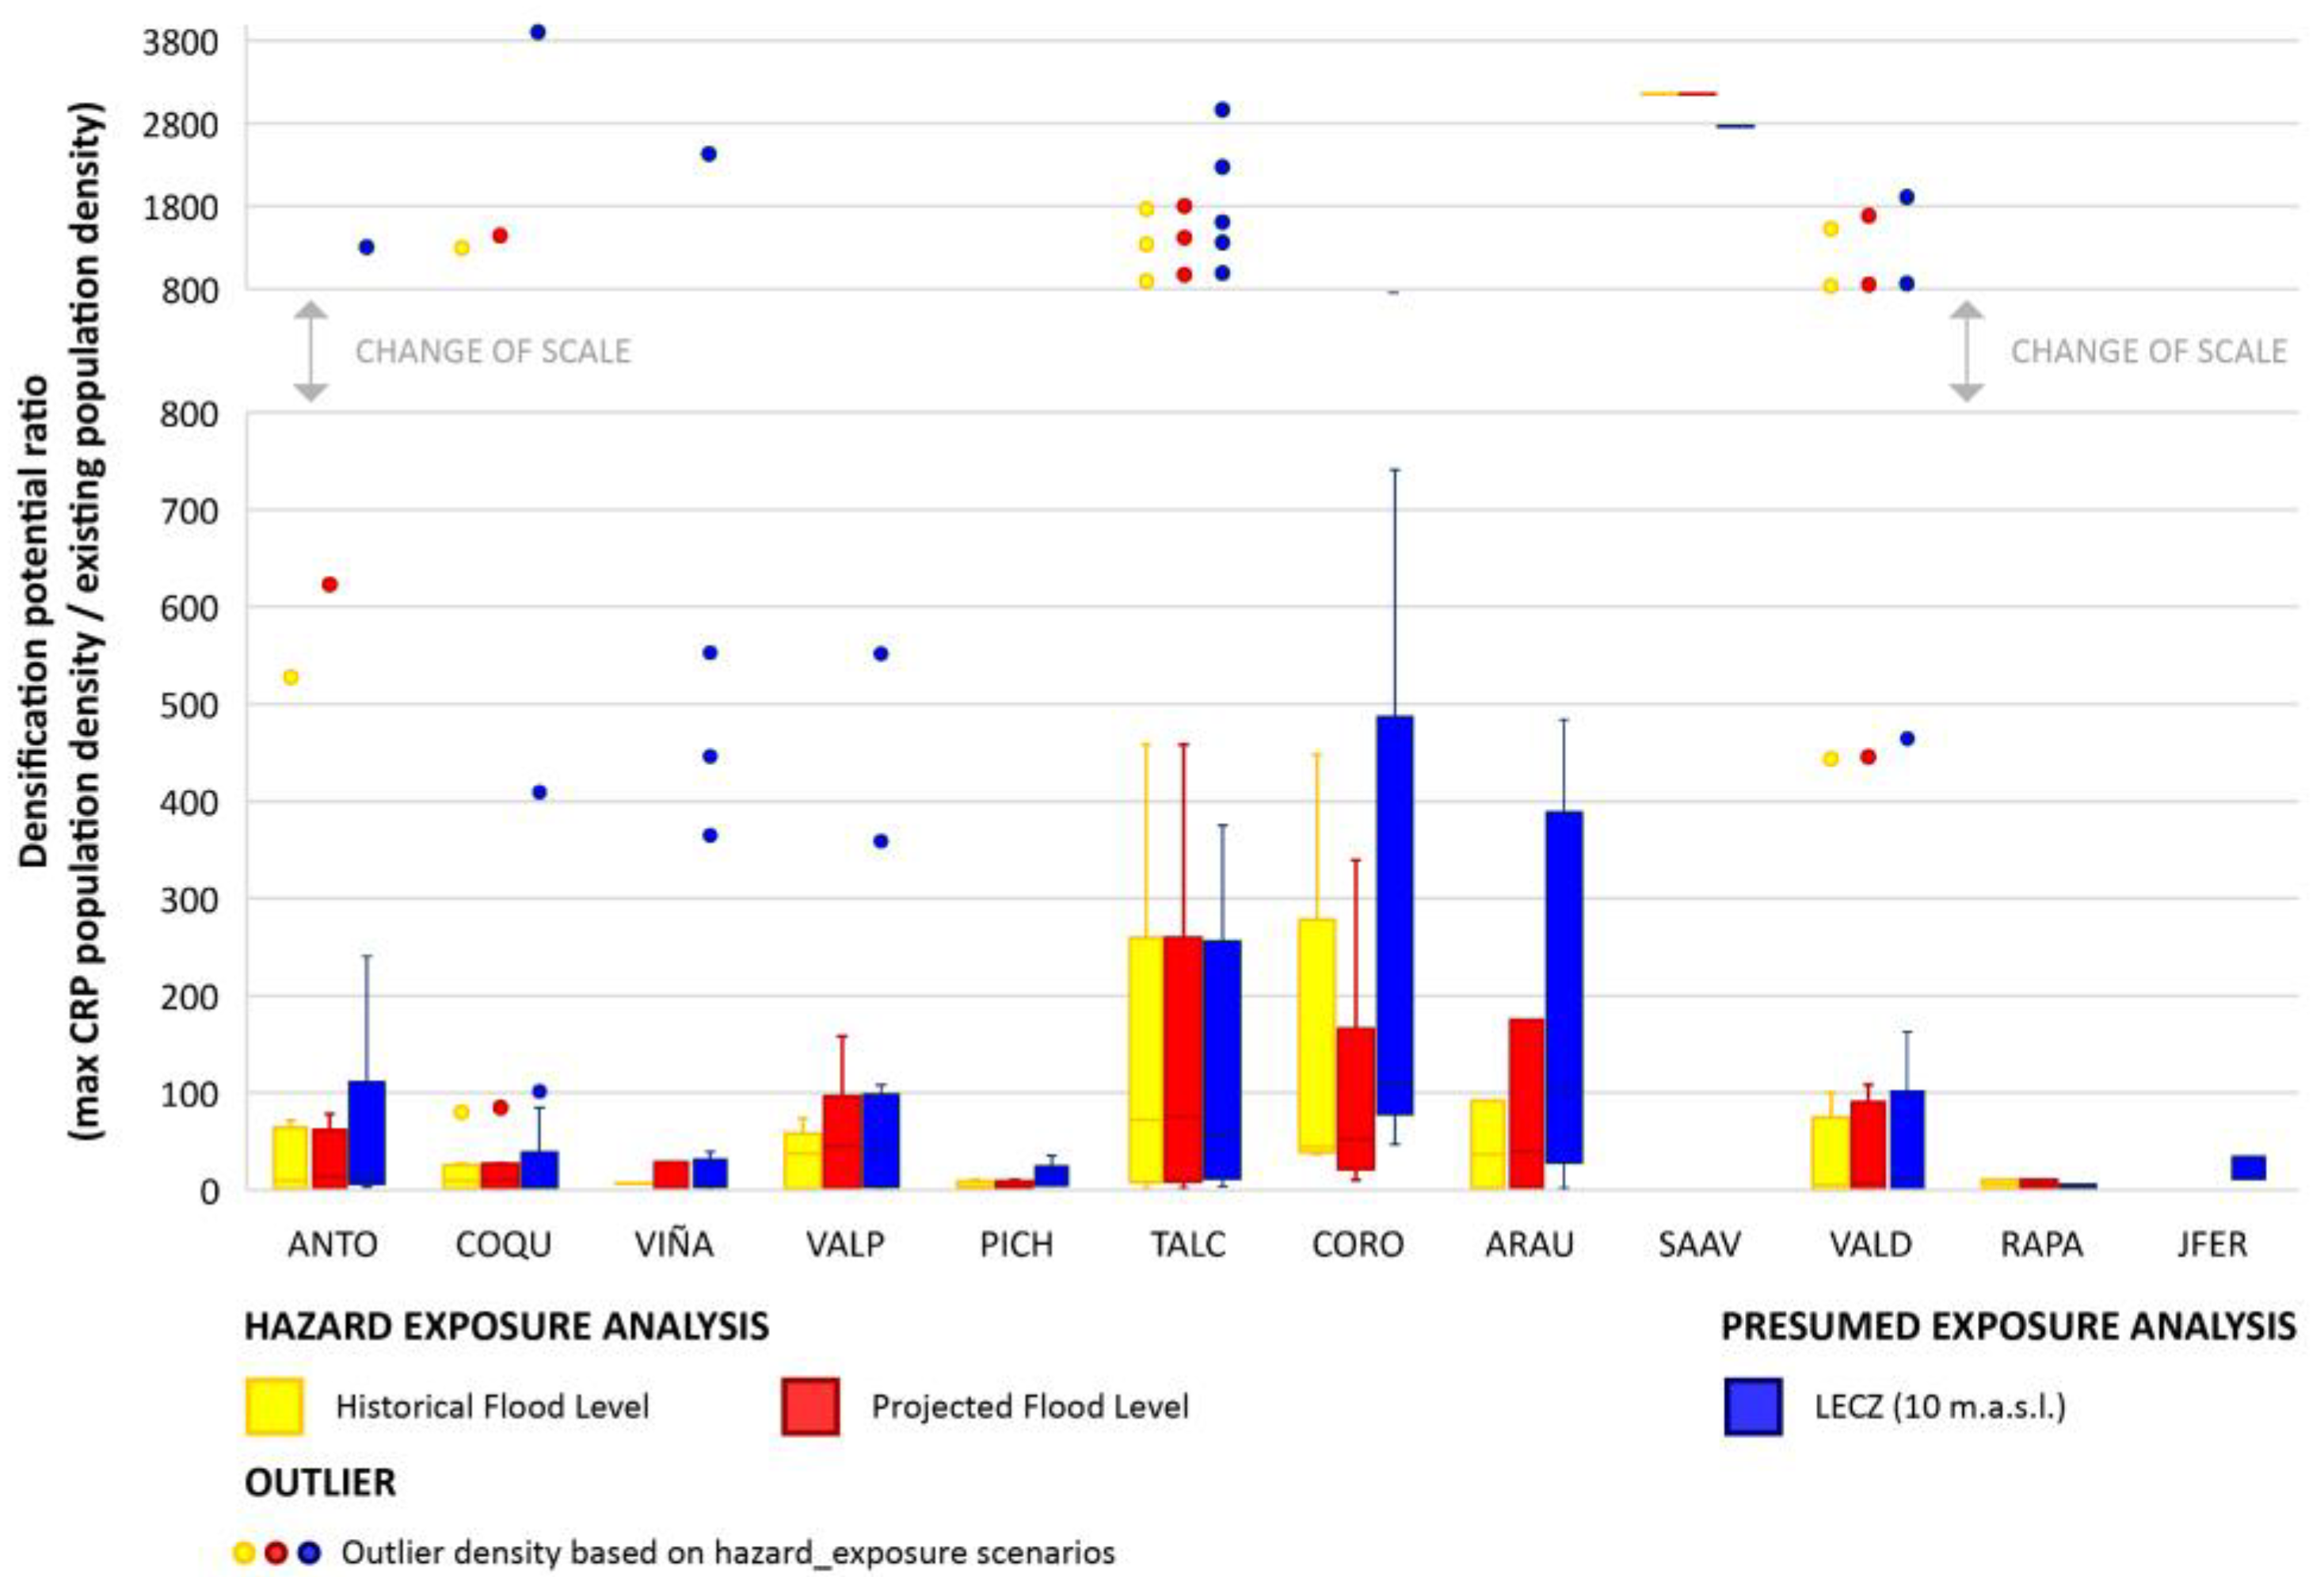
| Densification potential (Densification potential = max CRP density/existing density) (The densification potential was calculated concerning the accumulated density of each zone incorporated in the CRP, both for the existing density and the CRP density) | - | 7.3 | 1.4 | 3.3 | 4.4 | 3.0 | 11.3 | 6.3 | 2.5 | 6.4 | 0.7 | 1.1 | 8.7 | 4.7 |
| Floodable area defined as risky in CRP | % | 0.0 | 100.0 | 0.0 | 0.0 | 0.0 | 0.0 | 95.4 | 57.0 | 0.0 | 0.0 | 0.0 | 100.0 | 29.4 |
| Parameters | Unit | Period | ANTO | COQU | VIÑA | VALP | PICH | TALC | CORO | ARAU | SAAV | VALD | RAPA | JFER | Mean |
|---|---|---|---|---|---|---|---|---|---|---|---|---|---|---|---|
| Exposed urban area | km2 | Pro | 6.1 | 2.5 | 0.4 | 0.6 | 2.4 | 7.6 | 5.7 | 8.3 | 1.1 | 18.4 | 0.2 | 0.1 | 4.5 |
| His | 5.9 | 2.4 | 0.3 | 0.6 | 2.3 | 6.7 | 3.7 | 4.0 | 0.8 | 16.1 | 0.2 | 0.0 | 3.6 | ||
| Δ | 3% | 4% | 33% | 0% | 4% | 13% | 54% | 108% | 38% | 14% | 0% | Inf | |||
| Exposed urban area | % | Pro | 1.3 | 3.6 | 0.4 | 1.8 | 10.4 | 15.7 | 10.4 | 18.8 | 65.5 | 37.3 | 3.3 | 1.0 | 14.1 |
| His | 1.3 | 3.5 | 0.4 | 1.7 | 10.0 | 13.7 | 6.8 | 9.0 | 52.5 | 32.5 | 3.3 | 0.9 | 11.3 | ||
| Δ | 0% | 3% | 0% | 6% | 4% | 15% | 53% | 109% | 25% | 15% | 0% | 11% | |||
| Exposed population | % | Pro | 2.2 | 2.9 | 0.1 | 0.4 | 3.7 | 3.3 | 1.2 | 4.4 | 0.6 | 6.8 | 11.9 | 6.8 | 3.7 |
| His | 2.0 | 2.7 | 0.1 | 0.3 | 3.6 | 3.2 | 1.0 | 4.4 | 0.6 | 5.9 | 8.6 | 5.4 | 3.2 | ||
| Δ | 10% | 7% | 0% | 33% | 3% | 3% | 20% | 0% | 0% | 15% | 38% | 26% | |||
| Floodable area defined as risky in CRPs | % | Pro | 0.0 | 100.0 | 0.0 | 0.0 | 0.0 | 0.0 | 100.0 | 54.4 | 0.0 | 0.0 | 0.0 | 100 | 29.5 |
| His | 0.0 | 100.0 | 0.0 | 0.0 | 0.0 | 0.0 | 100.0 | 51.9 | 0.0 | 0.0 | 0.0 | 100 | 29.3 | ||
| Δ | 0% | 0% | 0% | 0% | 0% | 0% | 0% | 5% | 0% | 0% | 0% | 0% | |||
| Exposed critical facilities | % | Pro | 12.6 | 30.2 | 2.4 | 2.9 | 13.8 | 36.6 | 8.4 | 3.0 | 9.1 | 34.4 | 15.6 | 6.7 | 14.6 |
| His | 12.1 | 30.2 | 0.5 | 2.9 | 13.8 | 36.3 | 7.0 | 3.0 | 5.5 | 33.9 | 15.6 | 6.7 | 14.0 | ||
| Δ | 4% | 0% | 380% | 0% | 0% | 1% | 20% | 0% | 65% | 1% | 0% | 0% | |||
| Exposed wetlands area | % | Pro | 7.5 | 20.3 | 8.0 | 0 | 21.7 | 26.4 | 5.1 | 27.5 | 94.2 | 61.5 | 0.0 | 0.0 | 22.7 |
| His | 7.5 | 19.3 | 6.1 | 0 | 20.9 | 24.6 | 1.5 | 20.5 | 94.2 | 58.2 | 0.0 | 0.0 | 21.1 | ||
| Δ | 0% | 5% | 31% | 0% | 4% | 7% | 240% | 34% | 0% | 6% | 0% | 0% | |||
| Densification Potential (The densification potential was calculated concerning the accumulated density of each zone incorporated in the CRP, both for the existing density and the CRP density) | % | Pro | 7.0 | 1.9 | 2.1 | 8.8 | 1.4 | 13.4 | 7.6 | 8.4 | 58.2 | 0.8 | 0.8 | 0.0 | 9.2 |
| His | 6.4 | 1.9 | 7.1 | 5.5 | 1.2 | 12.8 | 6.7 | 6.2 | 58.2 | 0.5 | 1.4 | 0.0 | 9.0 | ||
| Δ | 9% | 0% | −70% | 60% | 17% | 5% | 13% | 35% | 0% | 60% | −43% | 0% |
Disclaimer/Publisher’s Note: The statements, opinions and data contained in all publications are solely those of the individual author(s) and contributor(s) and not of MDPI and/or the editor(s). MDPI and/or the editor(s) disclaim responsibility for any injury to people or property resulting from any ideas, methods, instructions or products referred to in the content. |
© 2023 by the authors. Licensee MDPI, Basel, Switzerland. This article is an open access article distributed under the terms and conditions of the Creative Commons Attribution (CC BY) license (https://creativecommons.org/licenses/by/4.0/).
Share and Cite
León, J.; Winckler, P.; Vicuña, M.; Guzmán, S.; Larraguibel, C. Assessing the Role of Land-Use Planning in Near Future Climate-Driven Scenarios in Chilean Coastal Cities. Sustainability 2023, 15, 3718. https://doi.org/10.3390/su15043718
León J, Winckler P, Vicuña M, Guzmán S, Larraguibel C. Assessing the Role of Land-Use Planning in Near Future Climate-Driven Scenarios in Chilean Coastal Cities. Sustainability. 2023; 15(4):3718. https://doi.org/10.3390/su15043718
Chicago/Turabian StyleLeón, Jorge, Patricio Winckler, Magdalena Vicuña, Simón Guzmán, and Cristian Larraguibel. 2023. "Assessing the Role of Land-Use Planning in Near Future Climate-Driven Scenarios in Chilean Coastal Cities" Sustainability 15, no. 4: 3718. https://doi.org/10.3390/su15043718
APA StyleLeón, J., Winckler, P., Vicuña, M., Guzmán, S., & Larraguibel, C. (2023). Assessing the Role of Land-Use Planning in Near Future Climate-Driven Scenarios in Chilean Coastal Cities. Sustainability, 15(4), 3718. https://doi.org/10.3390/su15043718