
Pollution and Risk Evaluation of Toxic Metals and Metalloid in Water Resources of San Jose, Occidental Mindoro, Philippines

 ,
, 
Abstract
1. Introduction
2. Materials and Methods
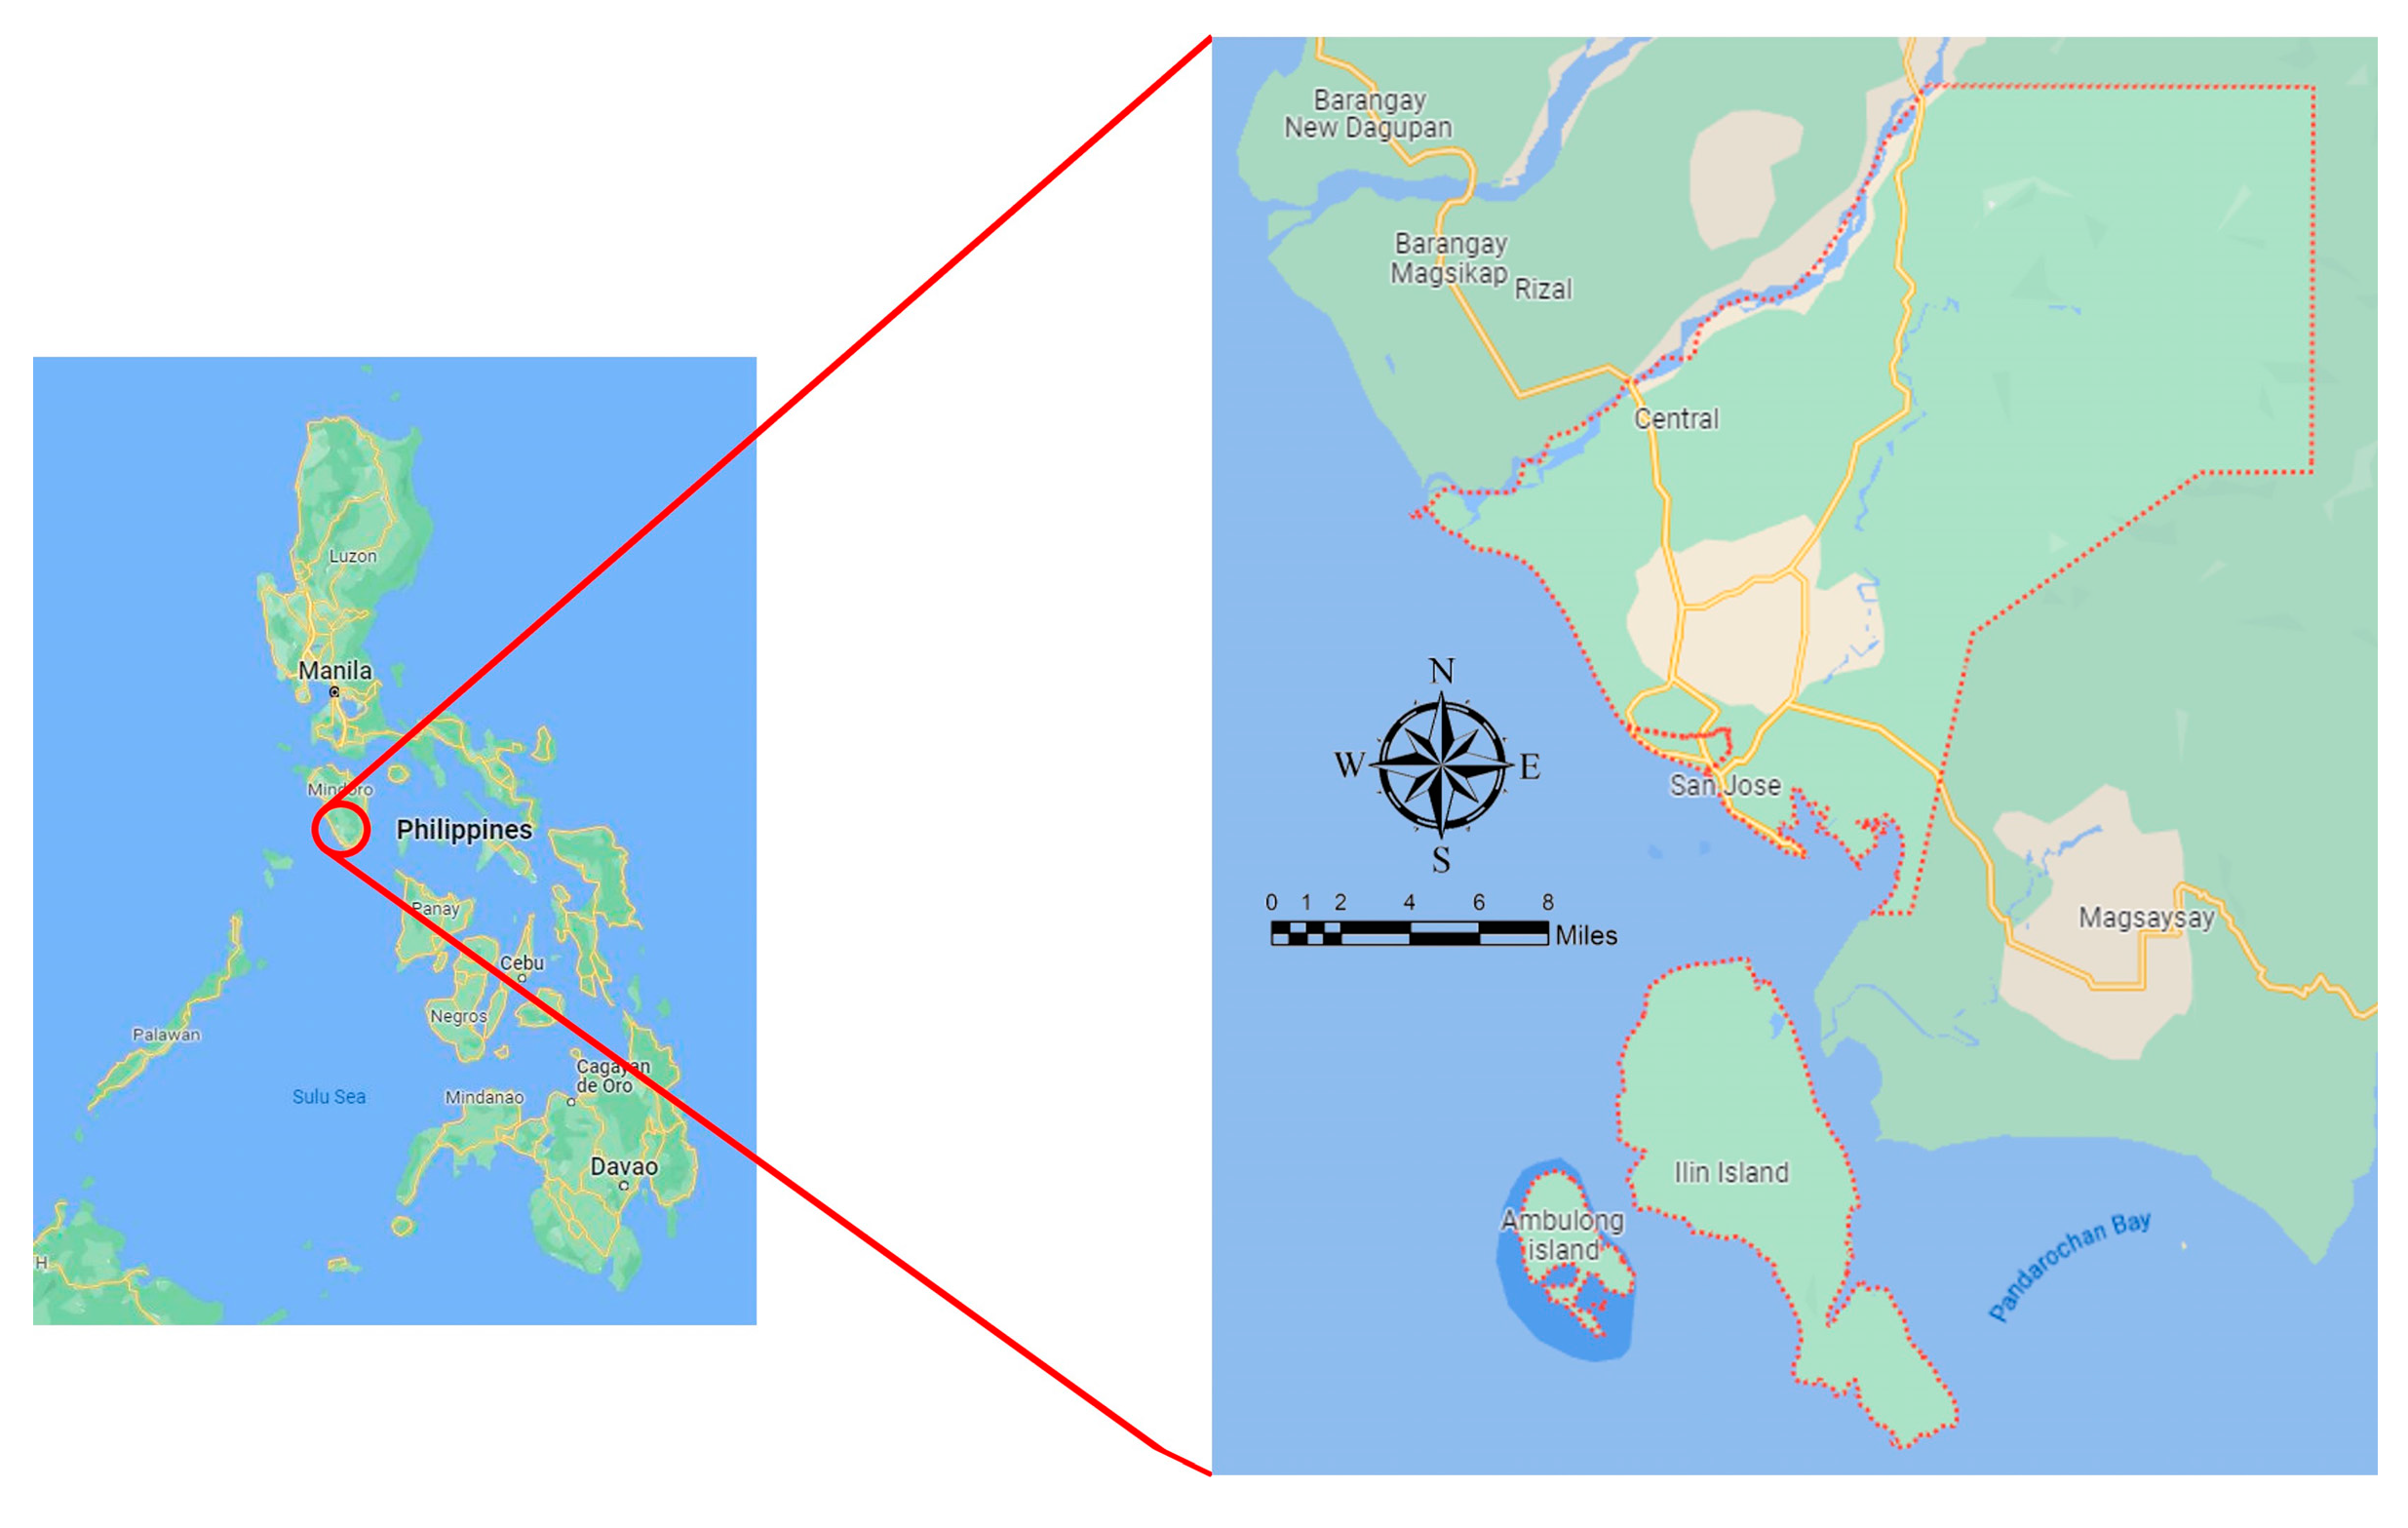
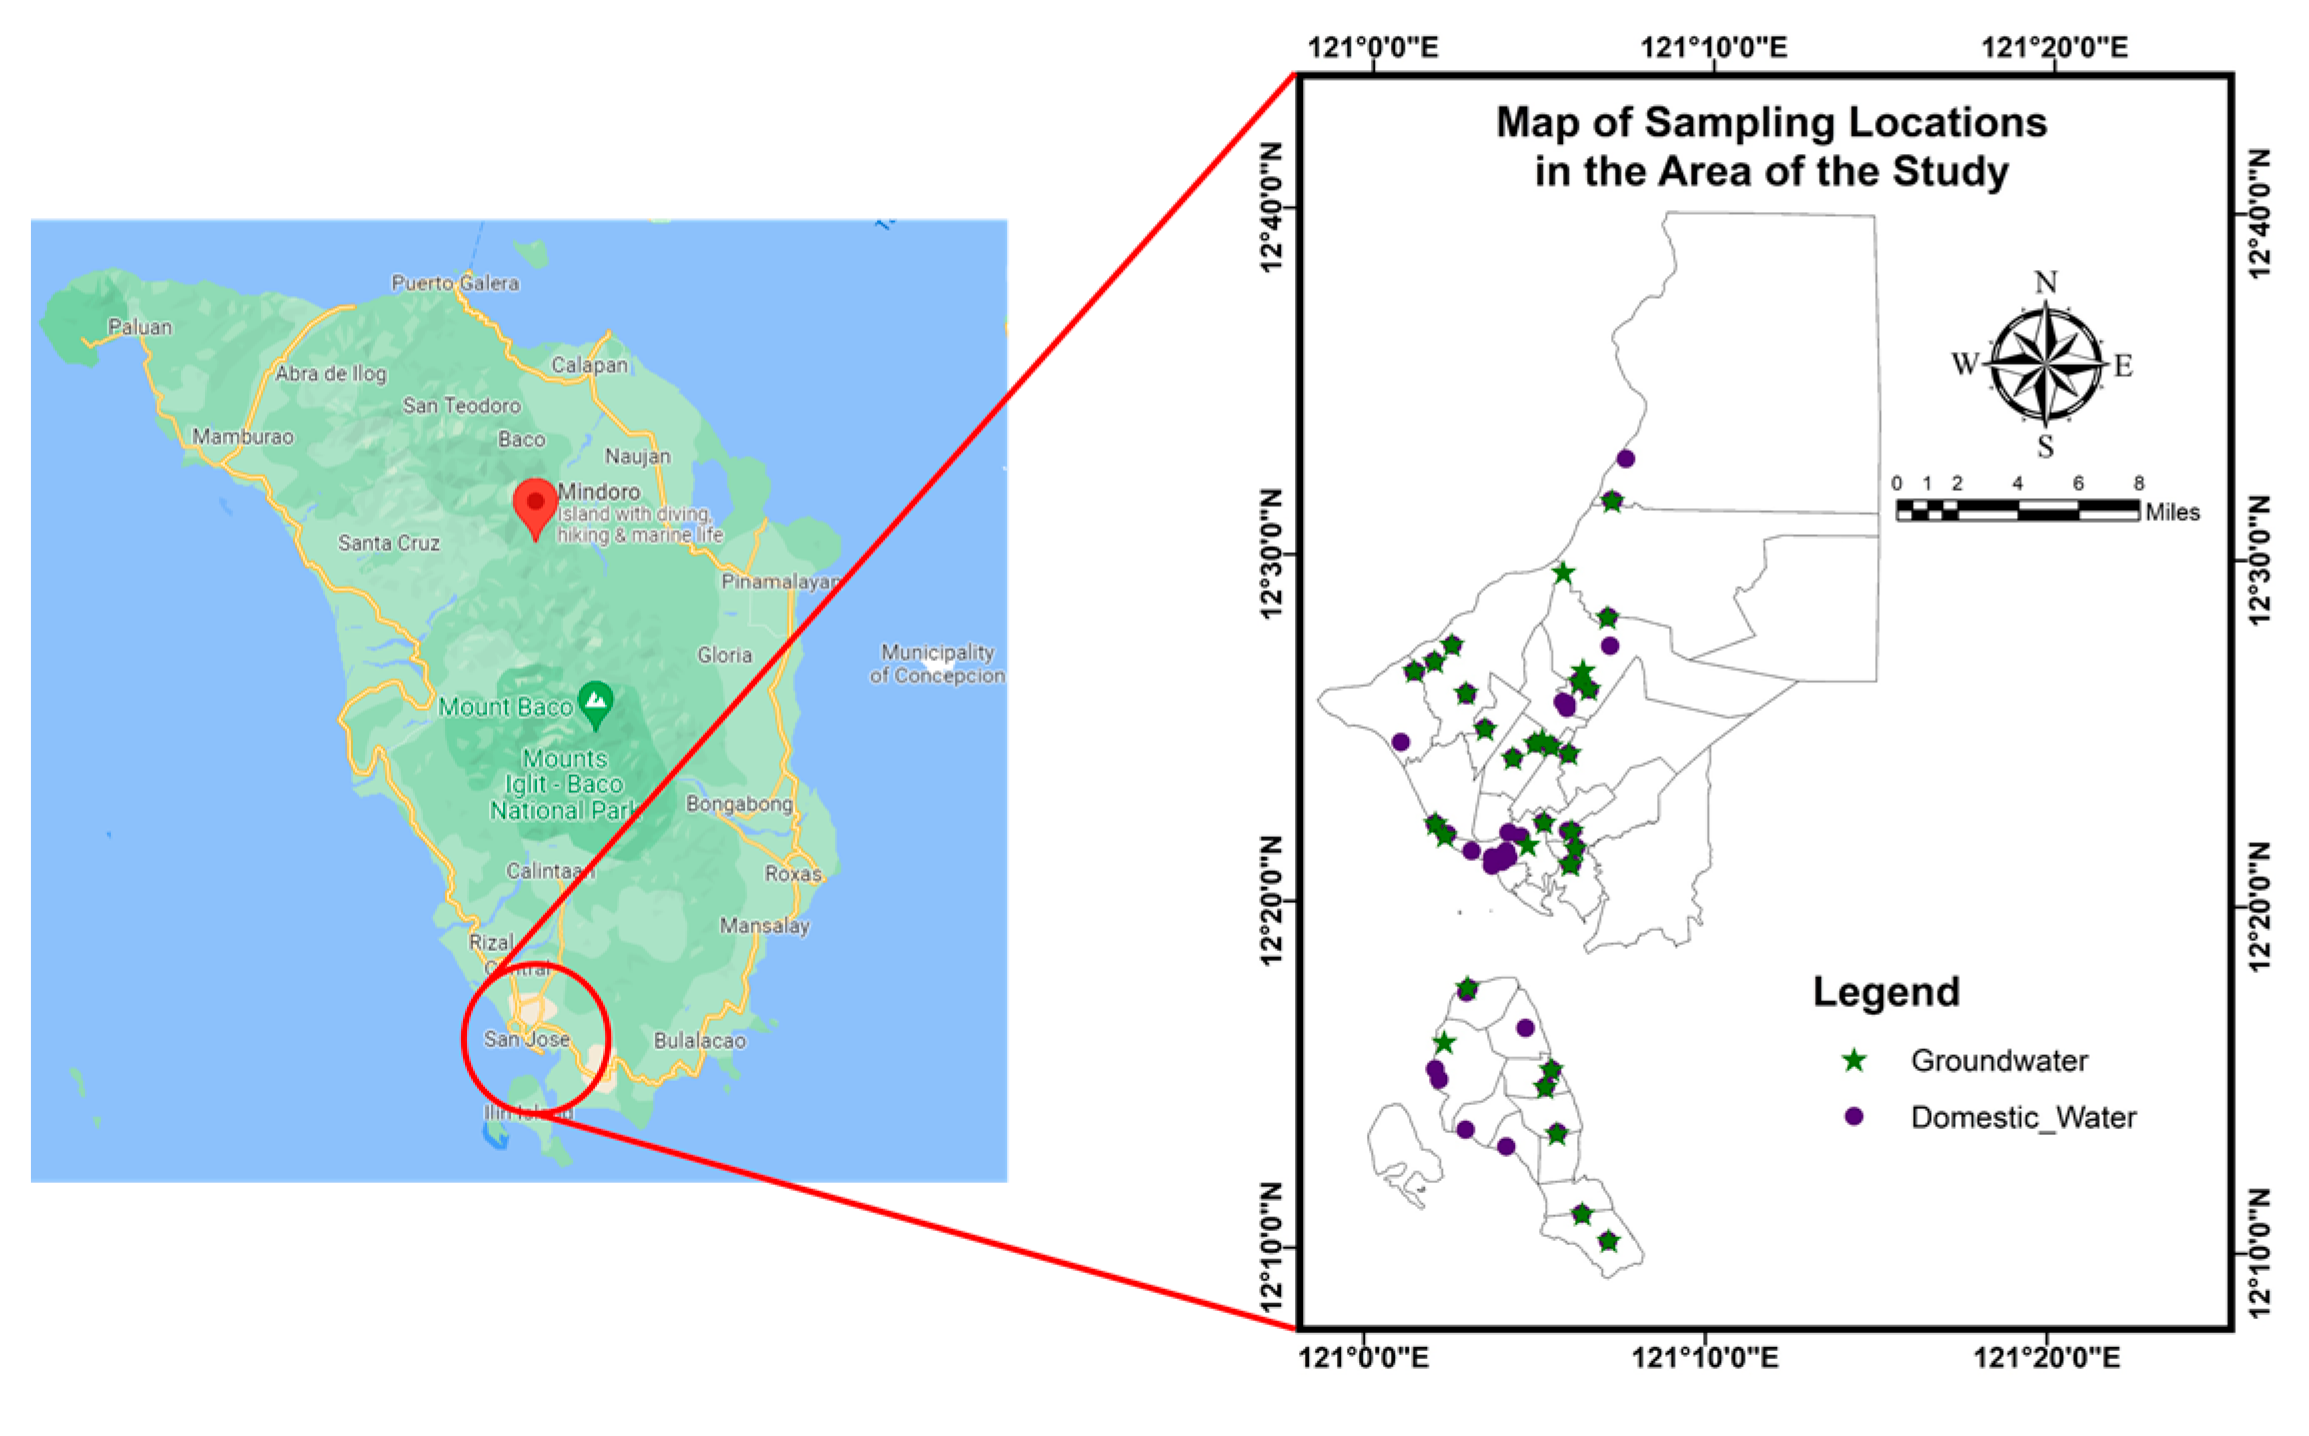
2.1. Description of the Study Area
2.2. Sample Collection, Preparation, and Analysis
2.3. Pollution Evaluation Indices
2.3.1. Metals Pollution Index (MPI)
2.3.2. Ecological Risk Index (ERI)
2.3.3. Nemerow’s Pollution Index (NPI)
2.3.4. Probabilistic Health Risk Assessment
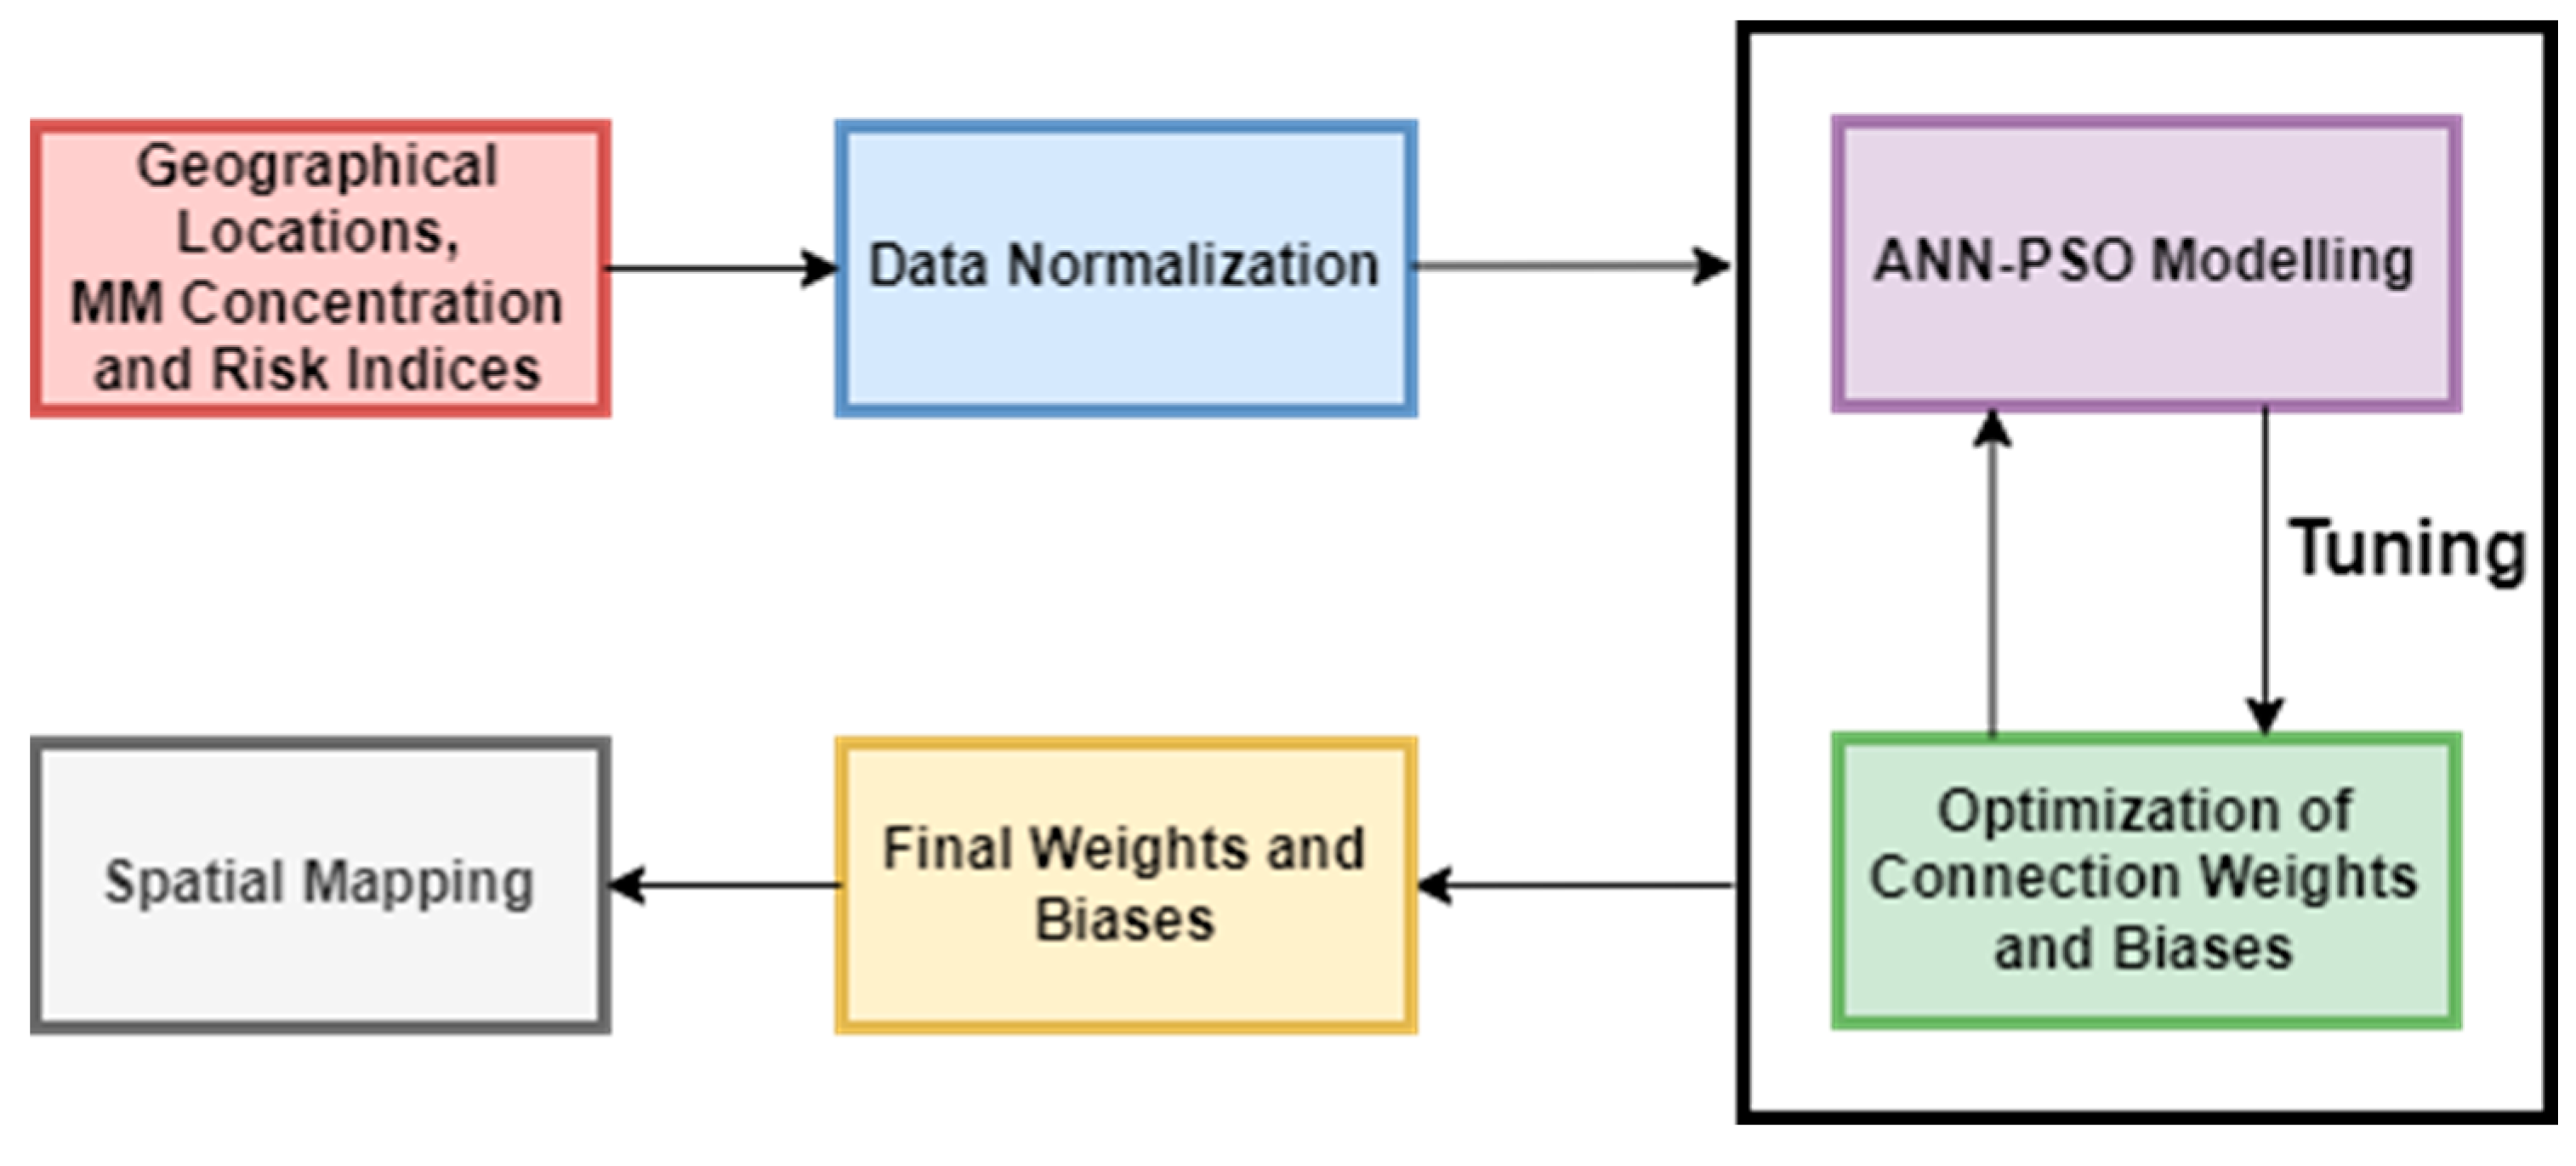
2.4. Spatial Mapping Using Machine Learning Geostatistical Interpolation (MLGI) Approach
2.5. Contamination Area Calculation
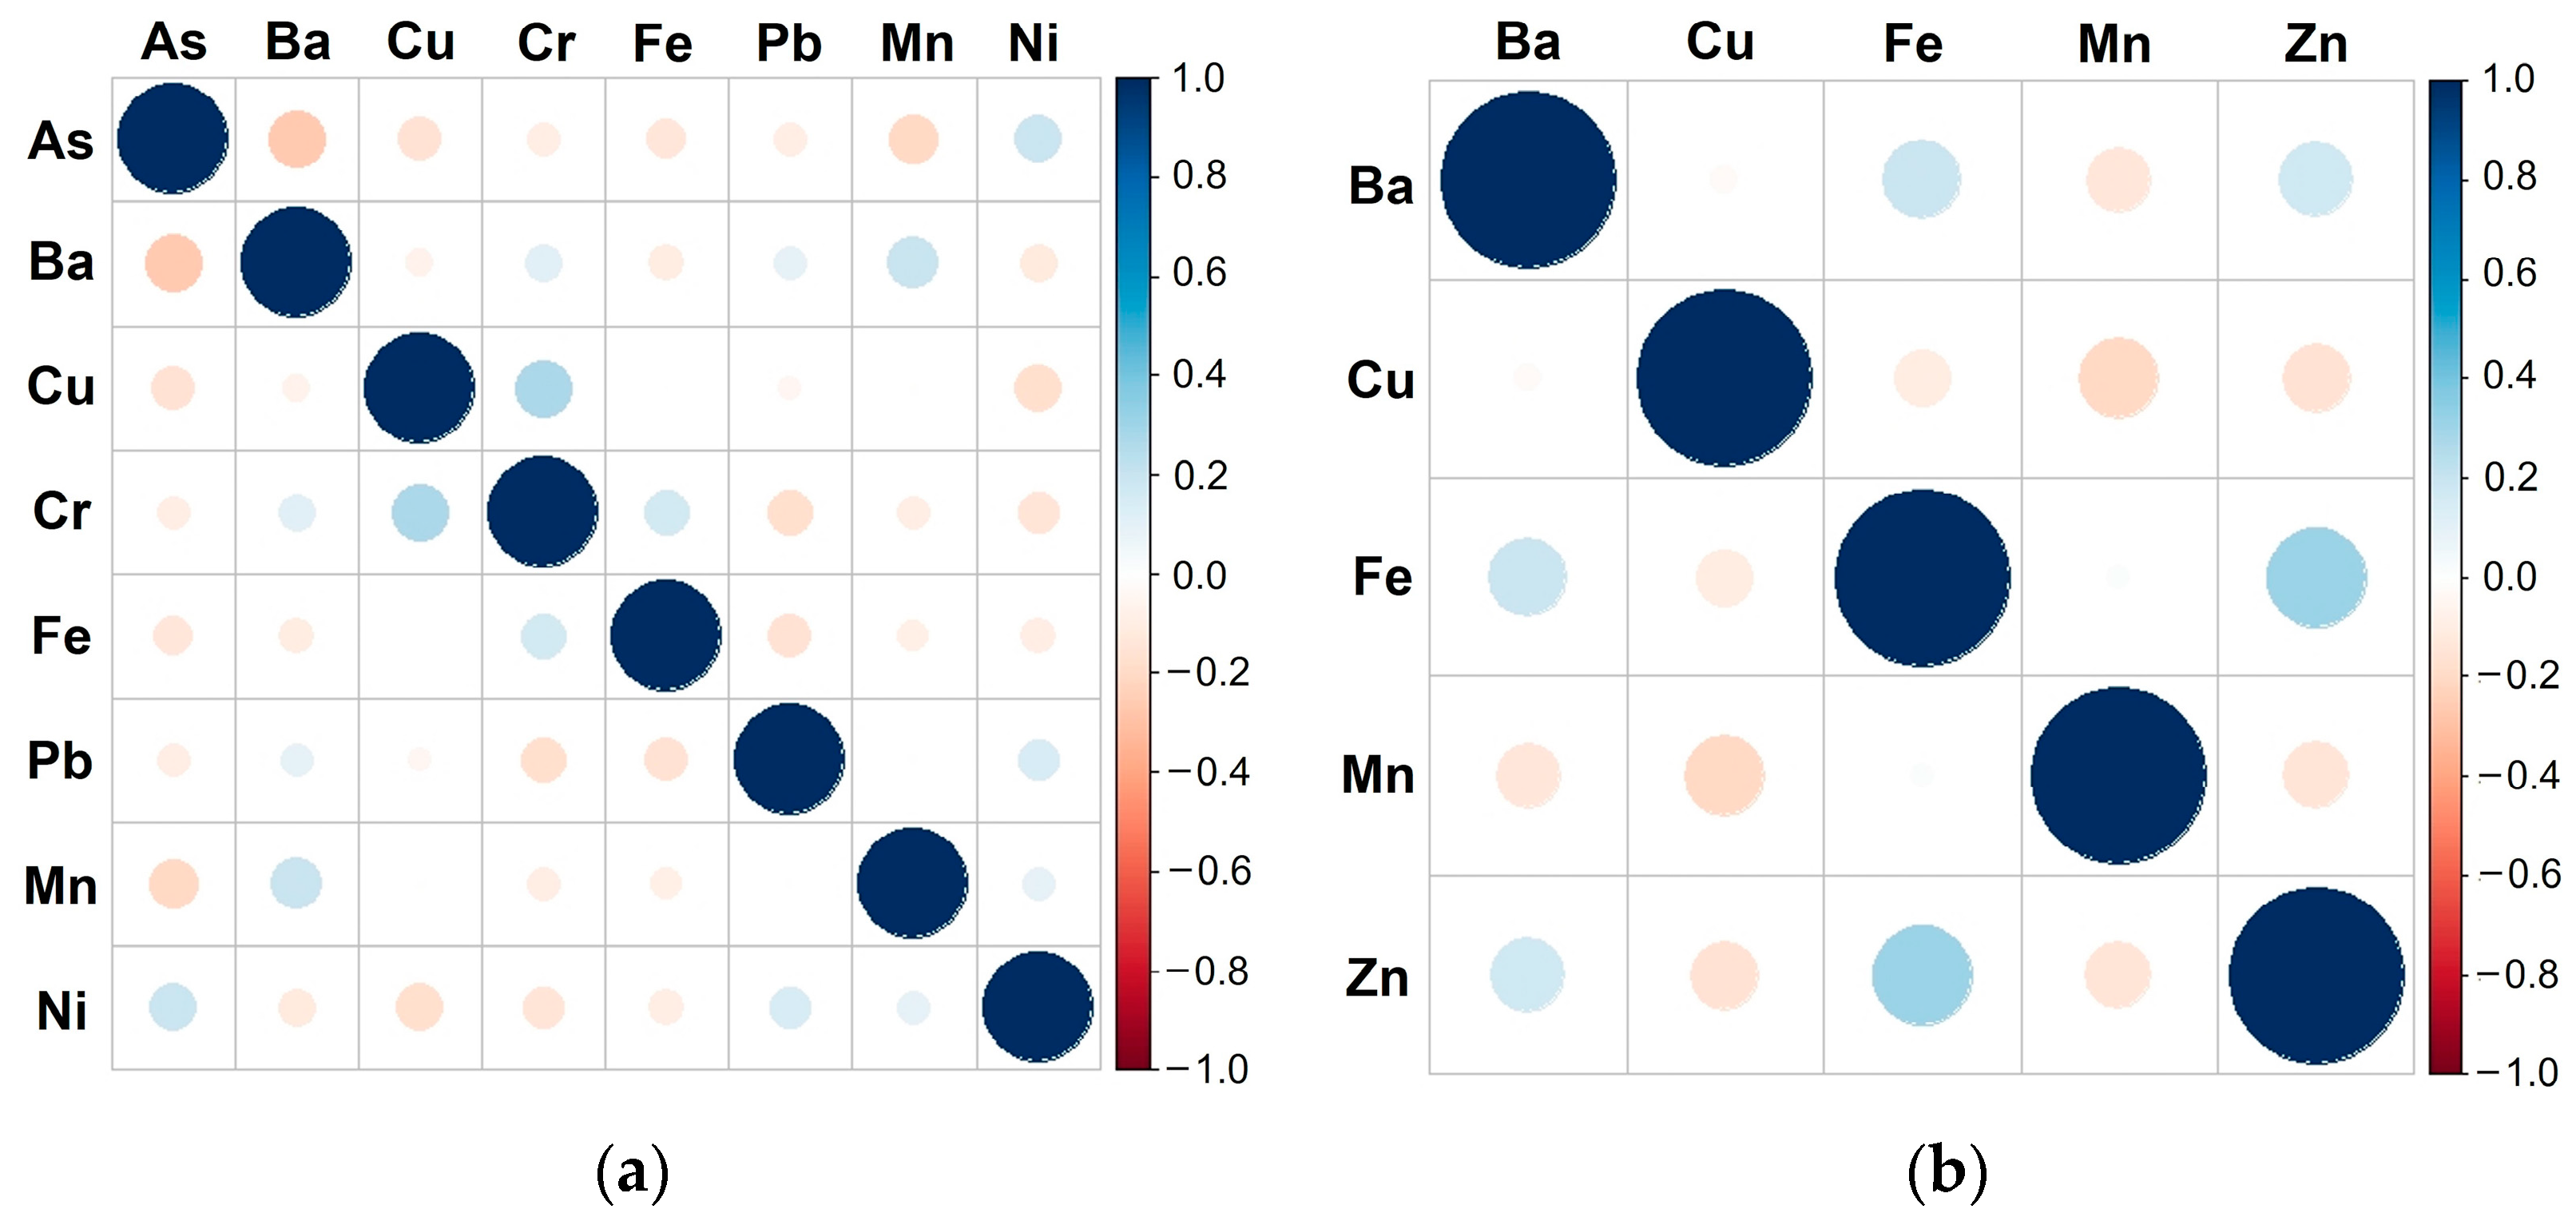
2.6. Statistical Analysis
3. Results and Discussion
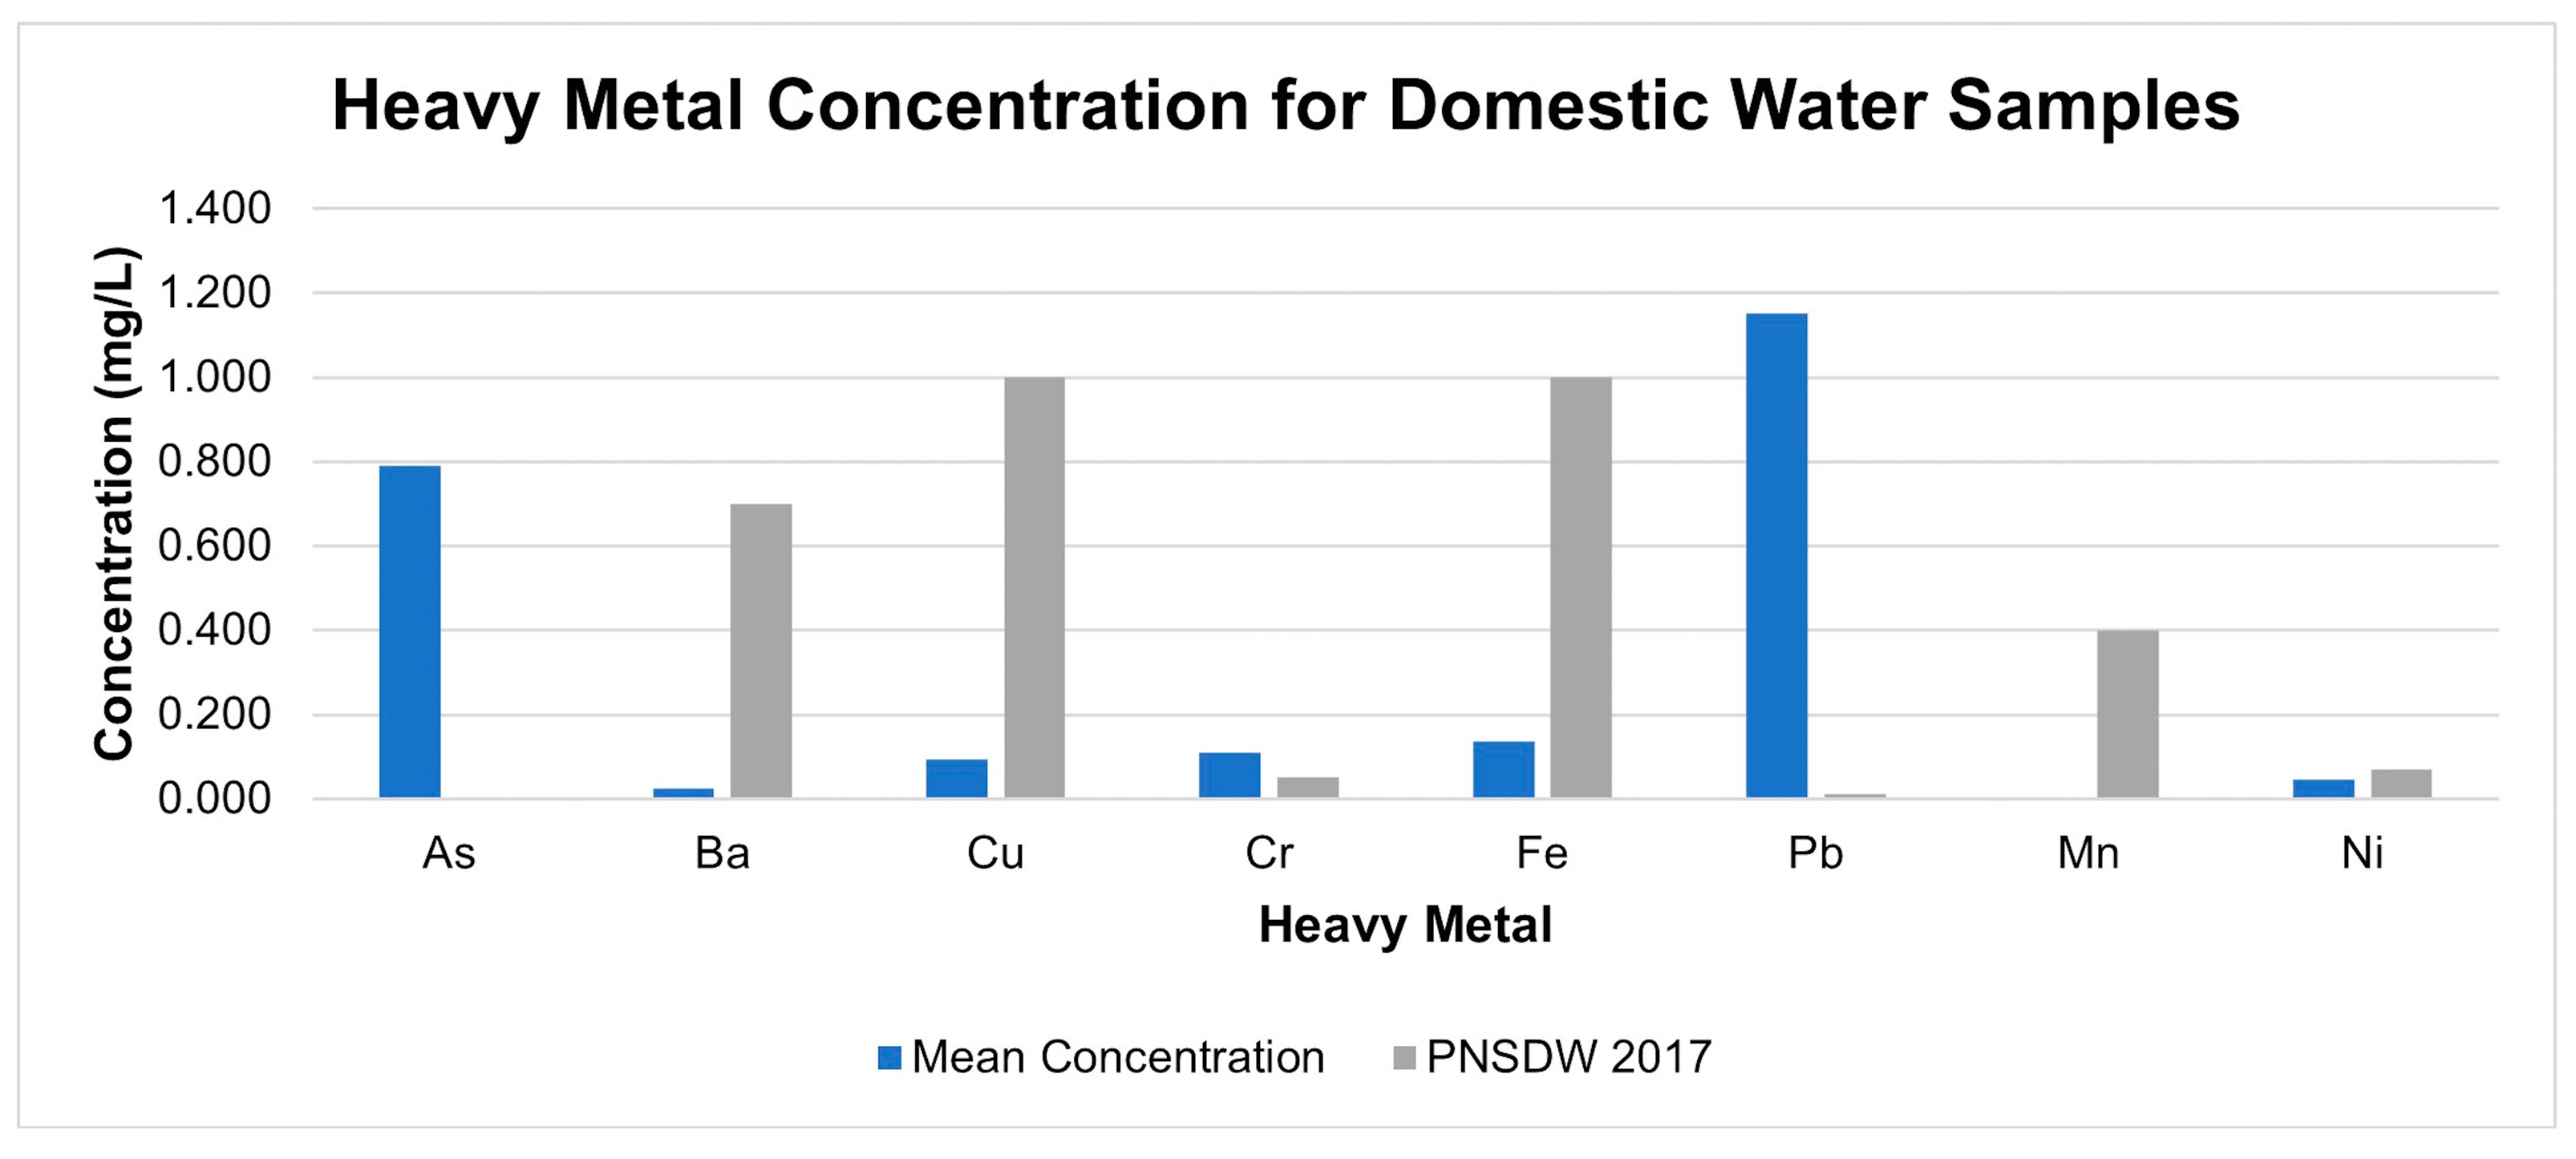
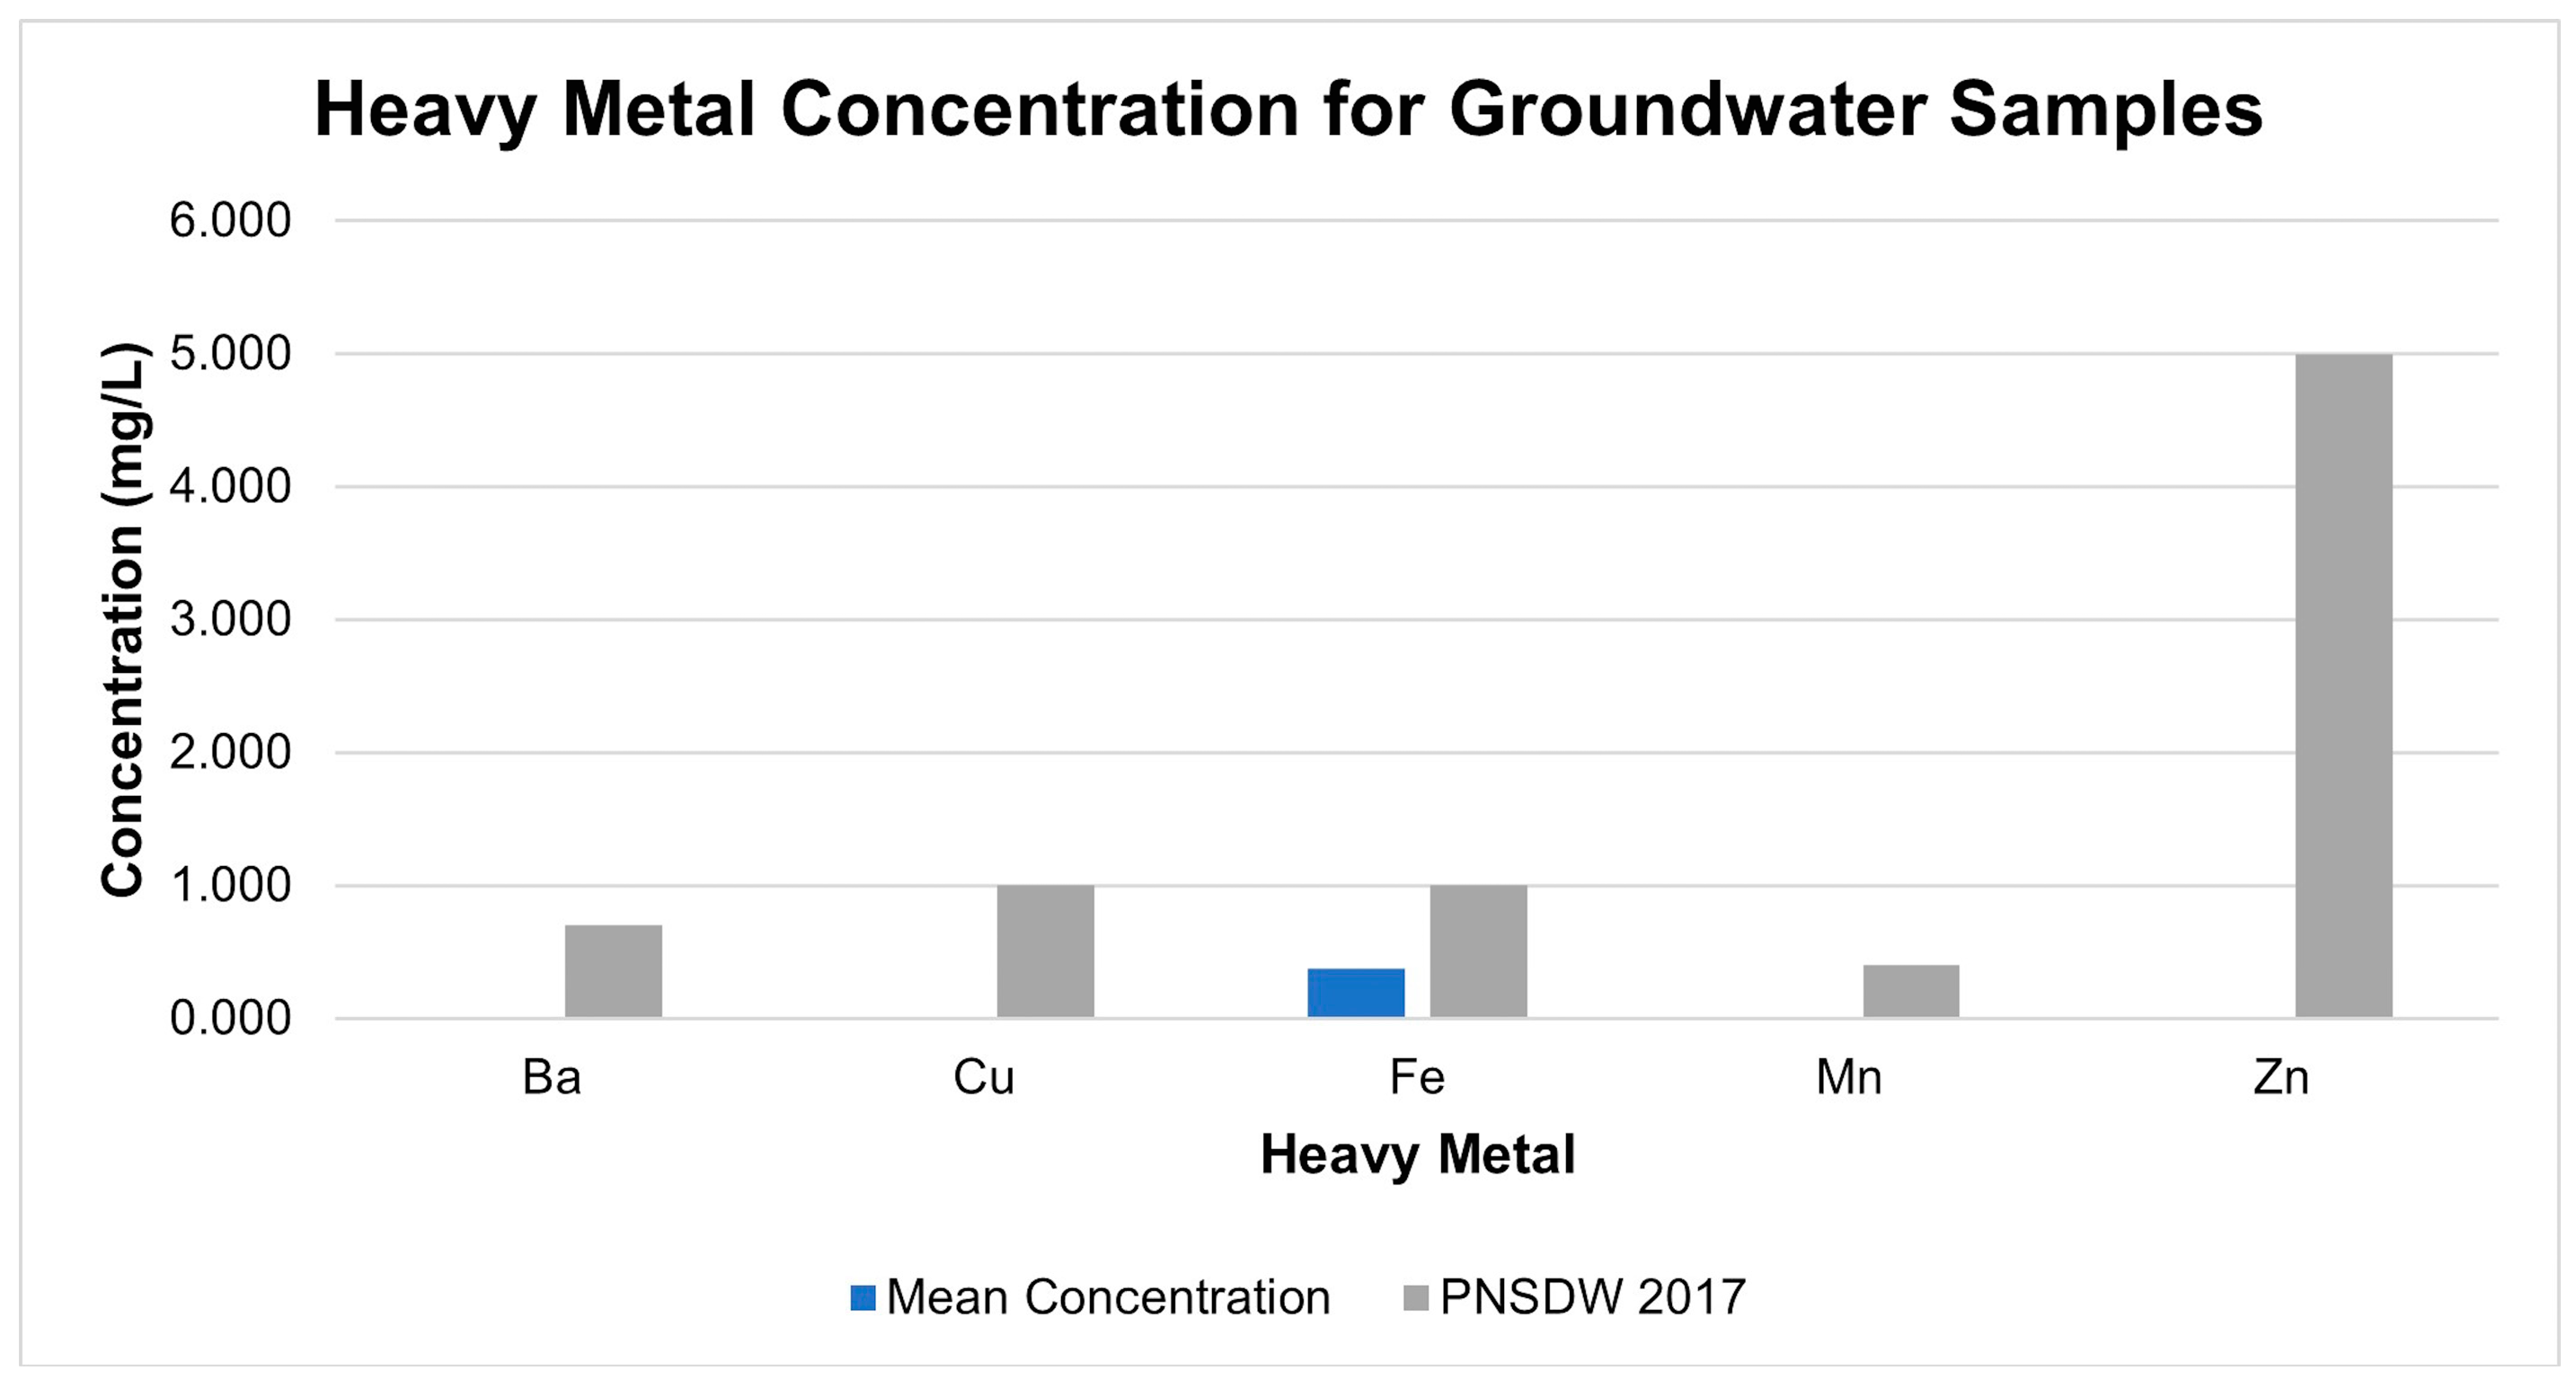
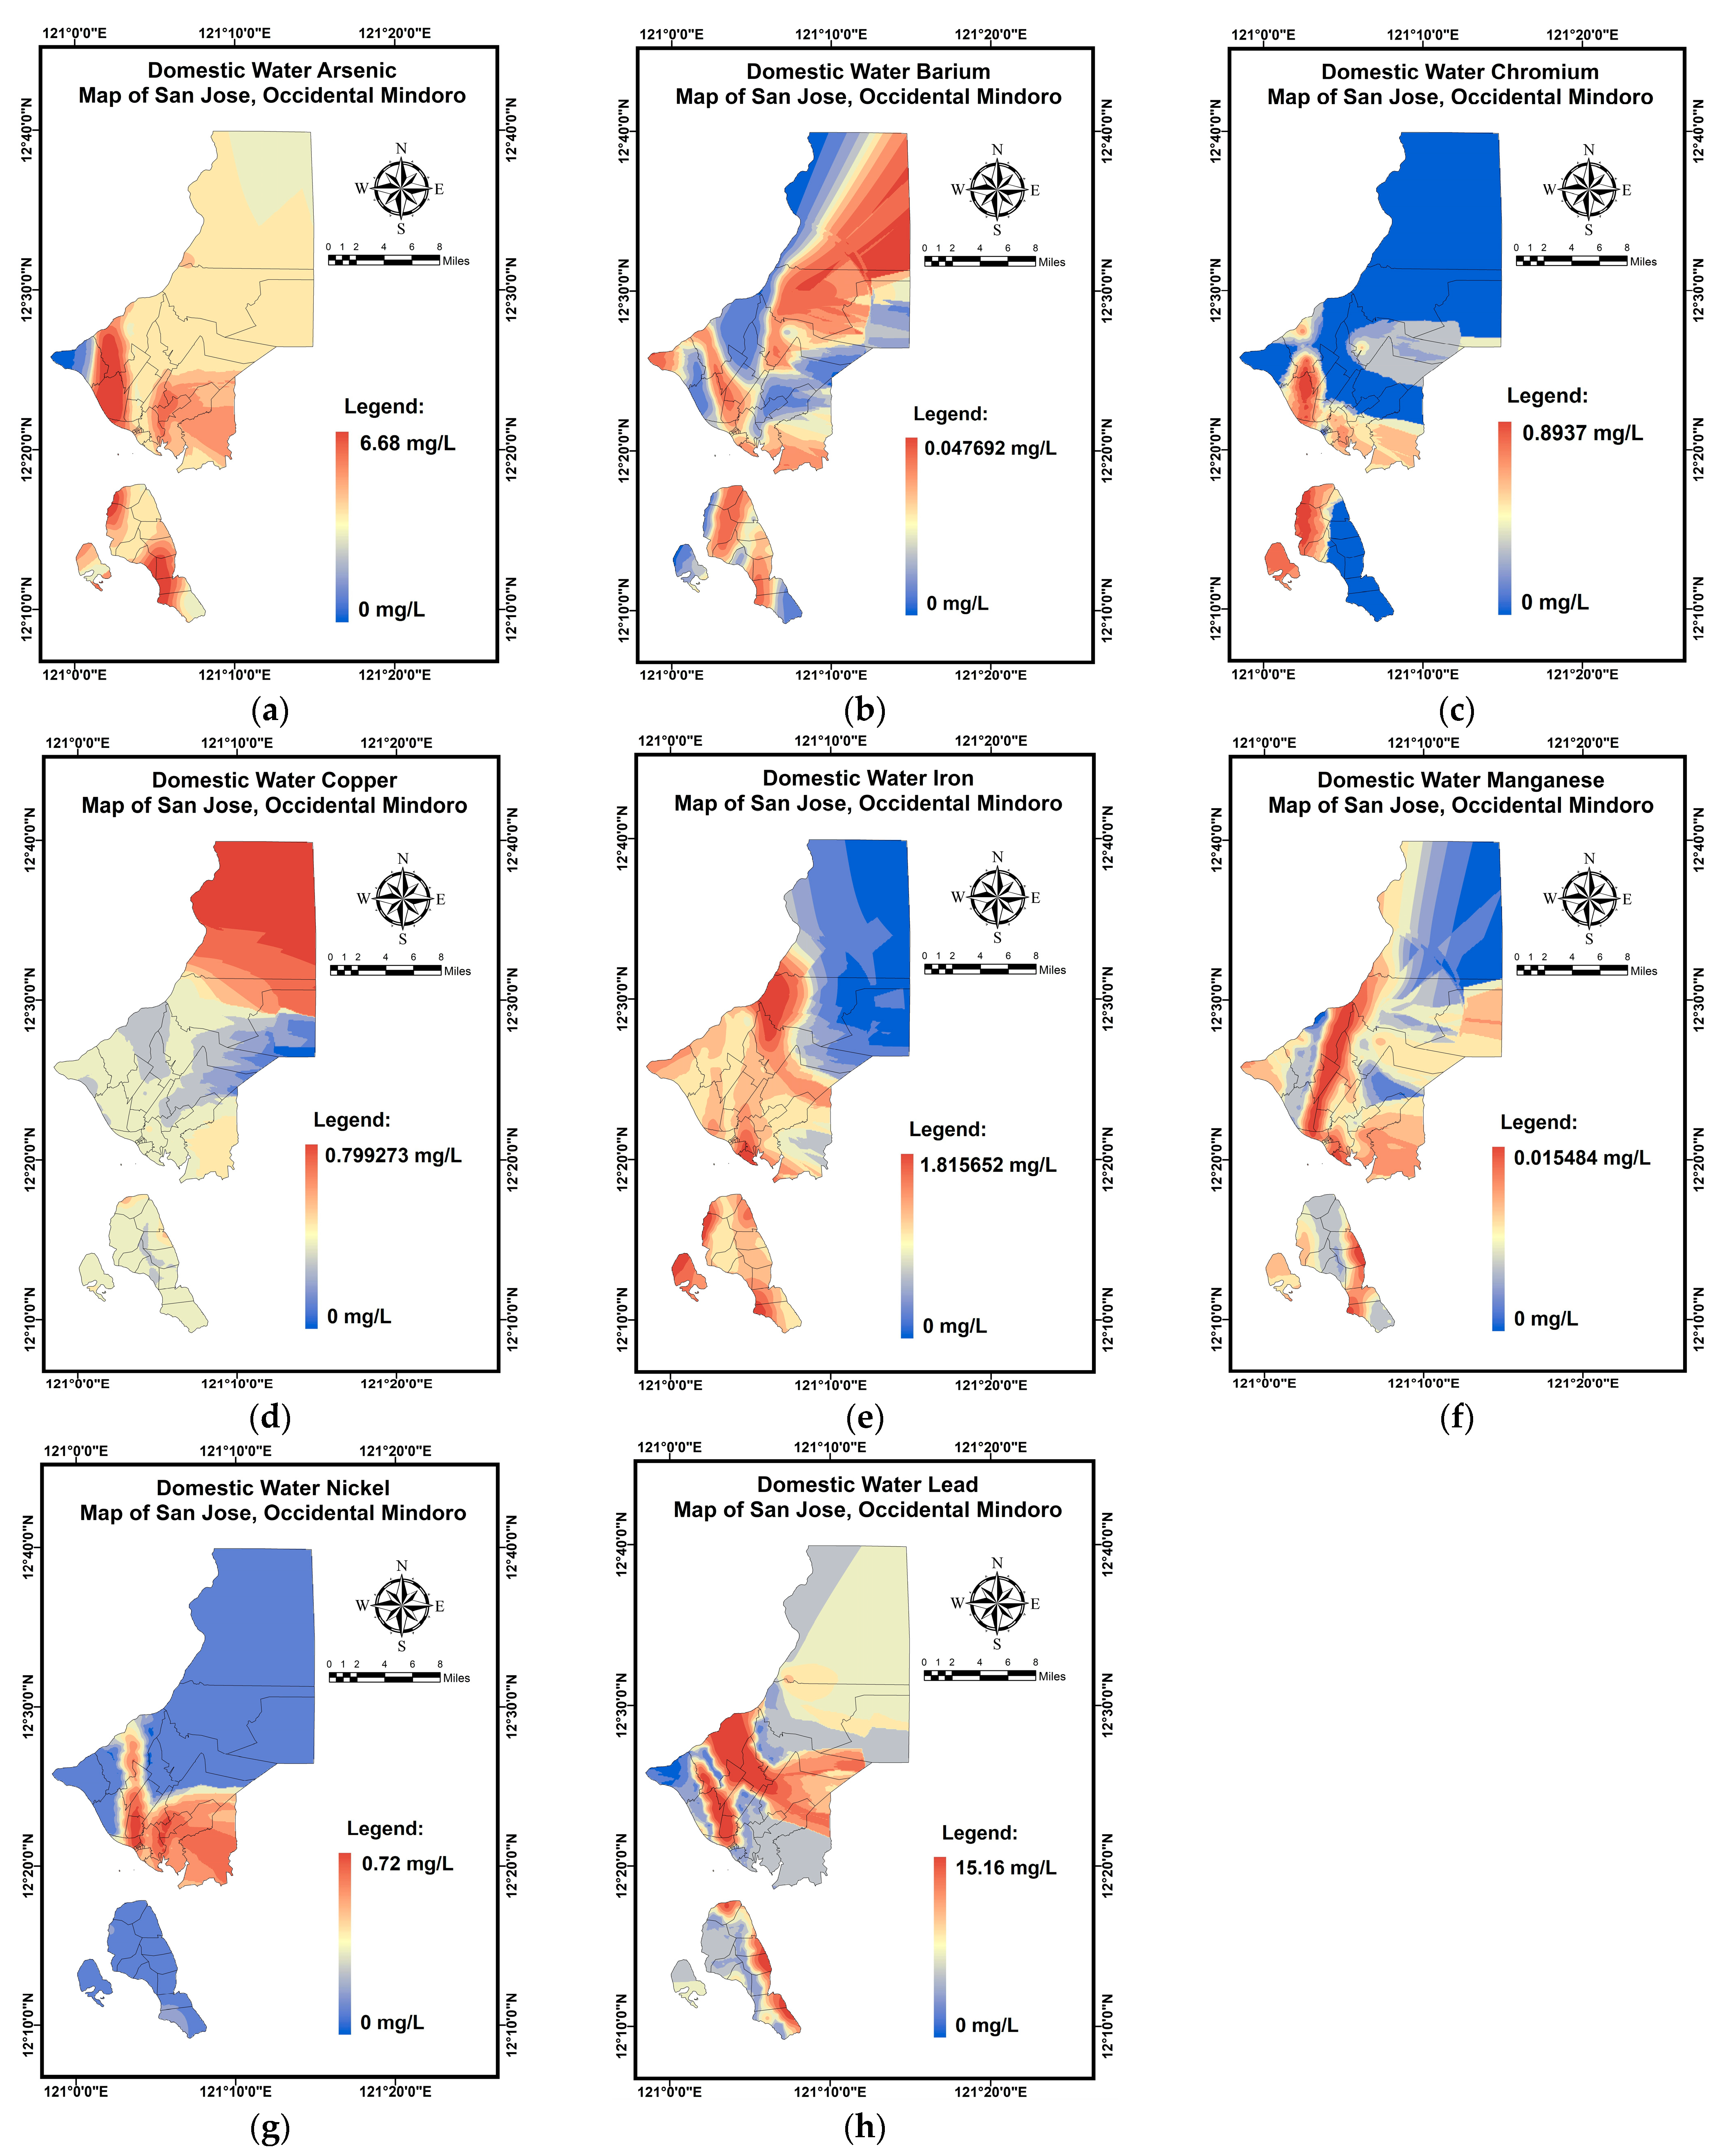
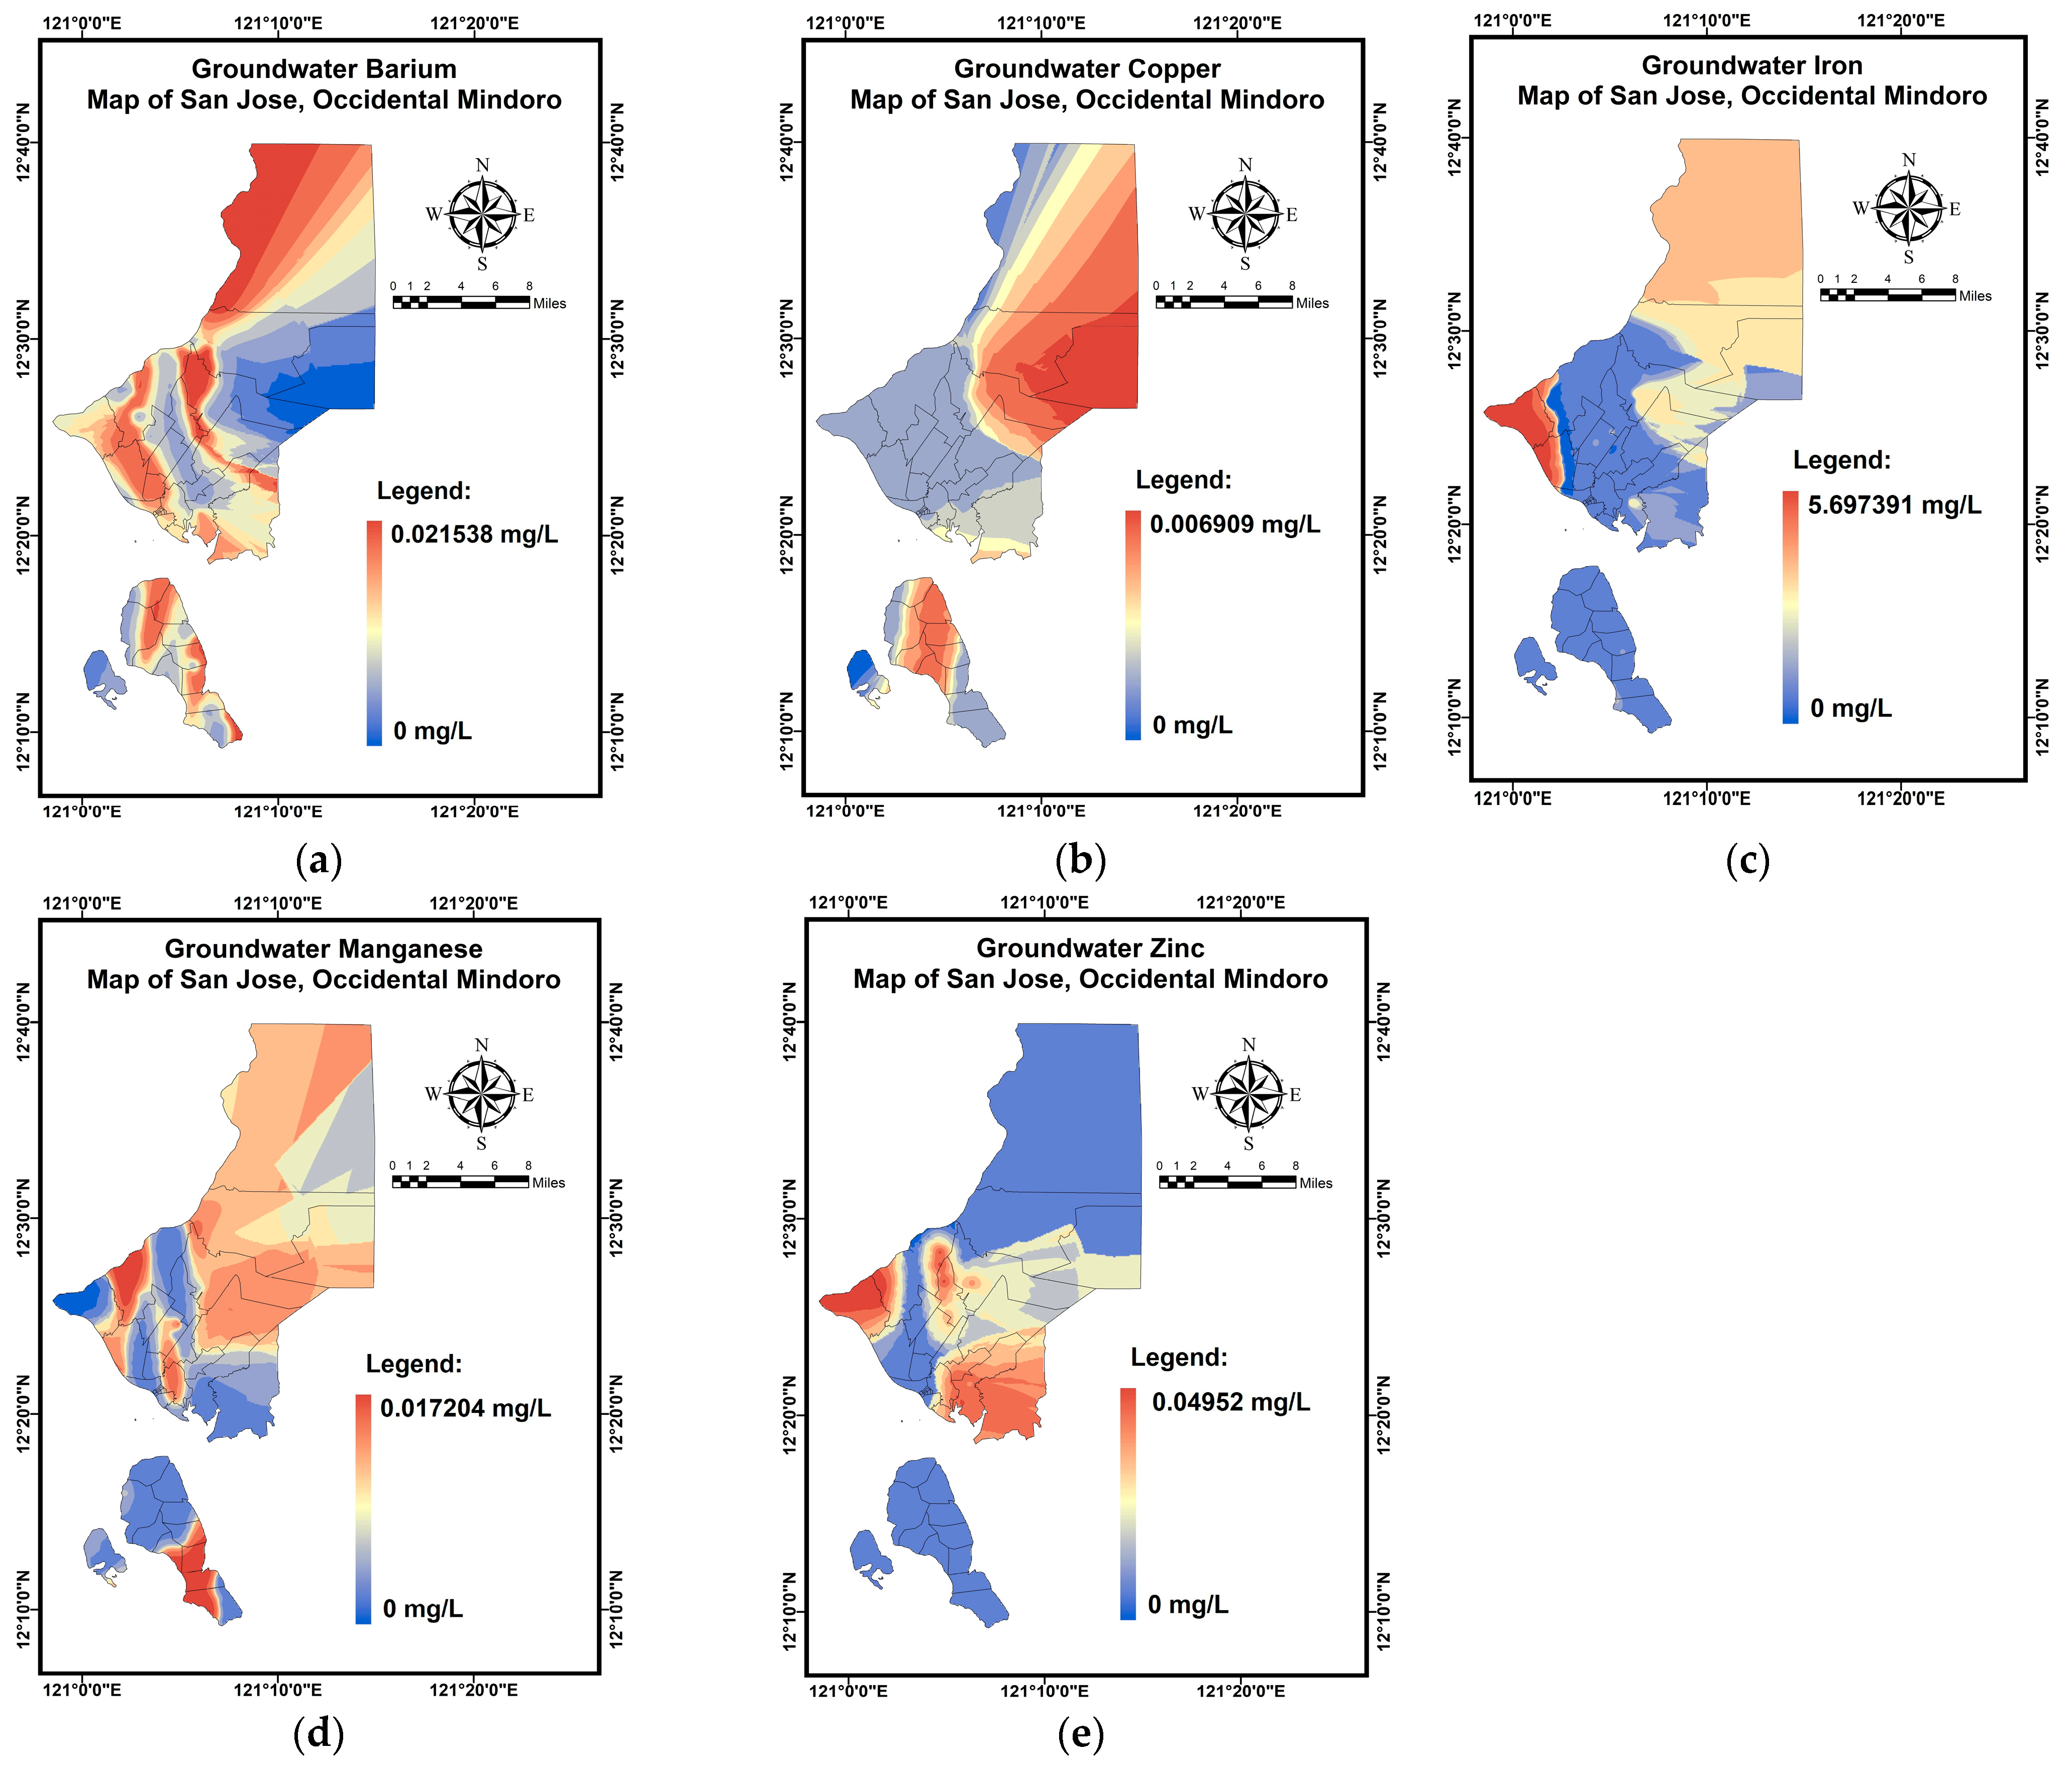
3.1. Metal Concentration
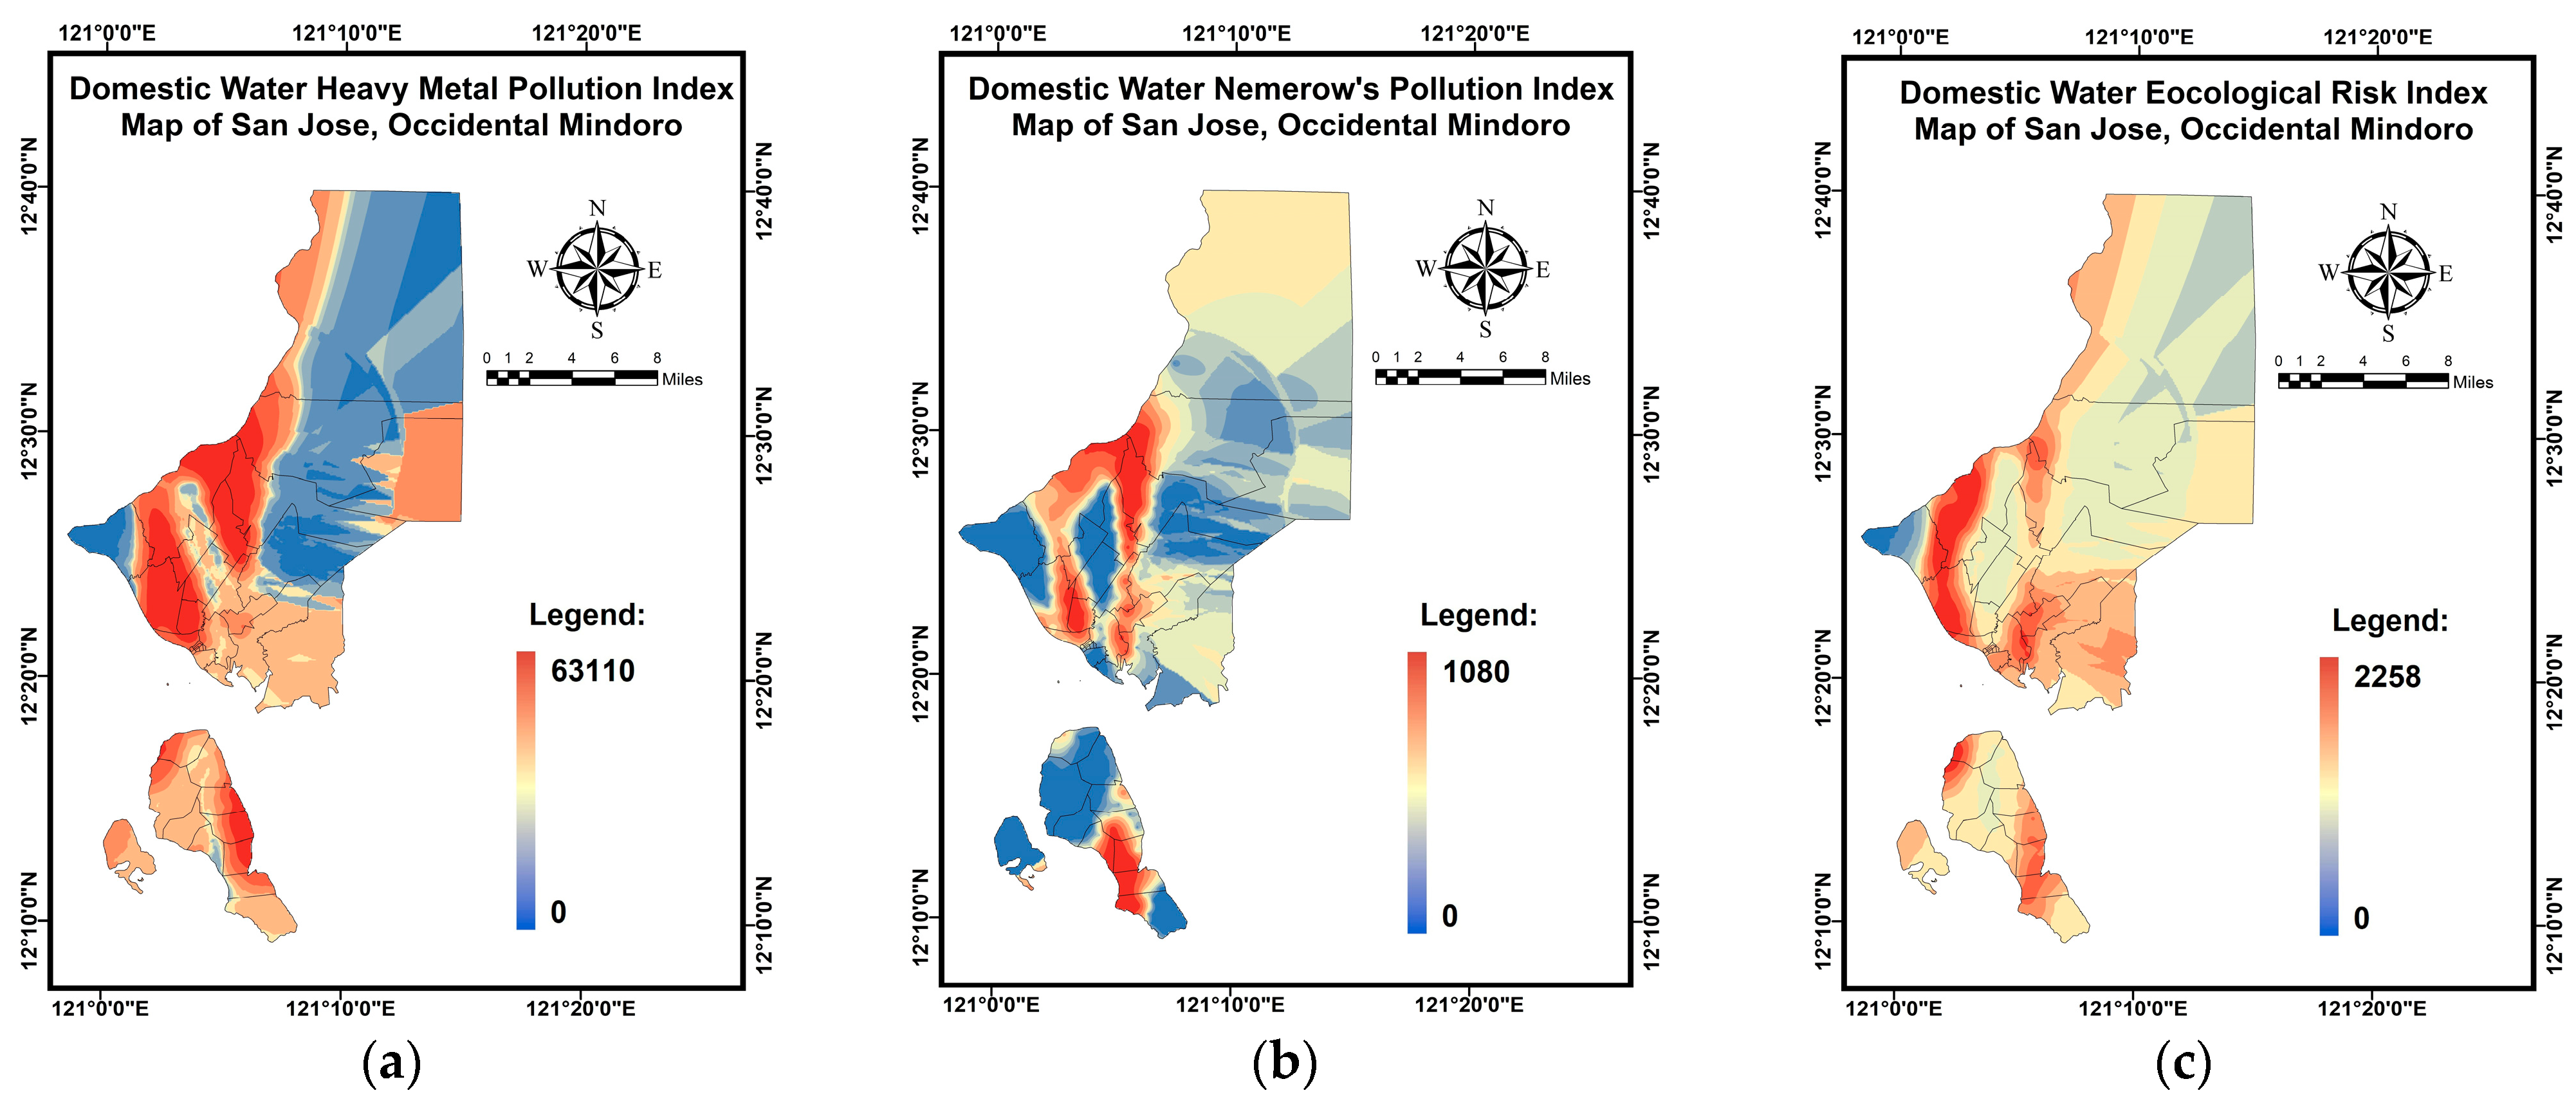
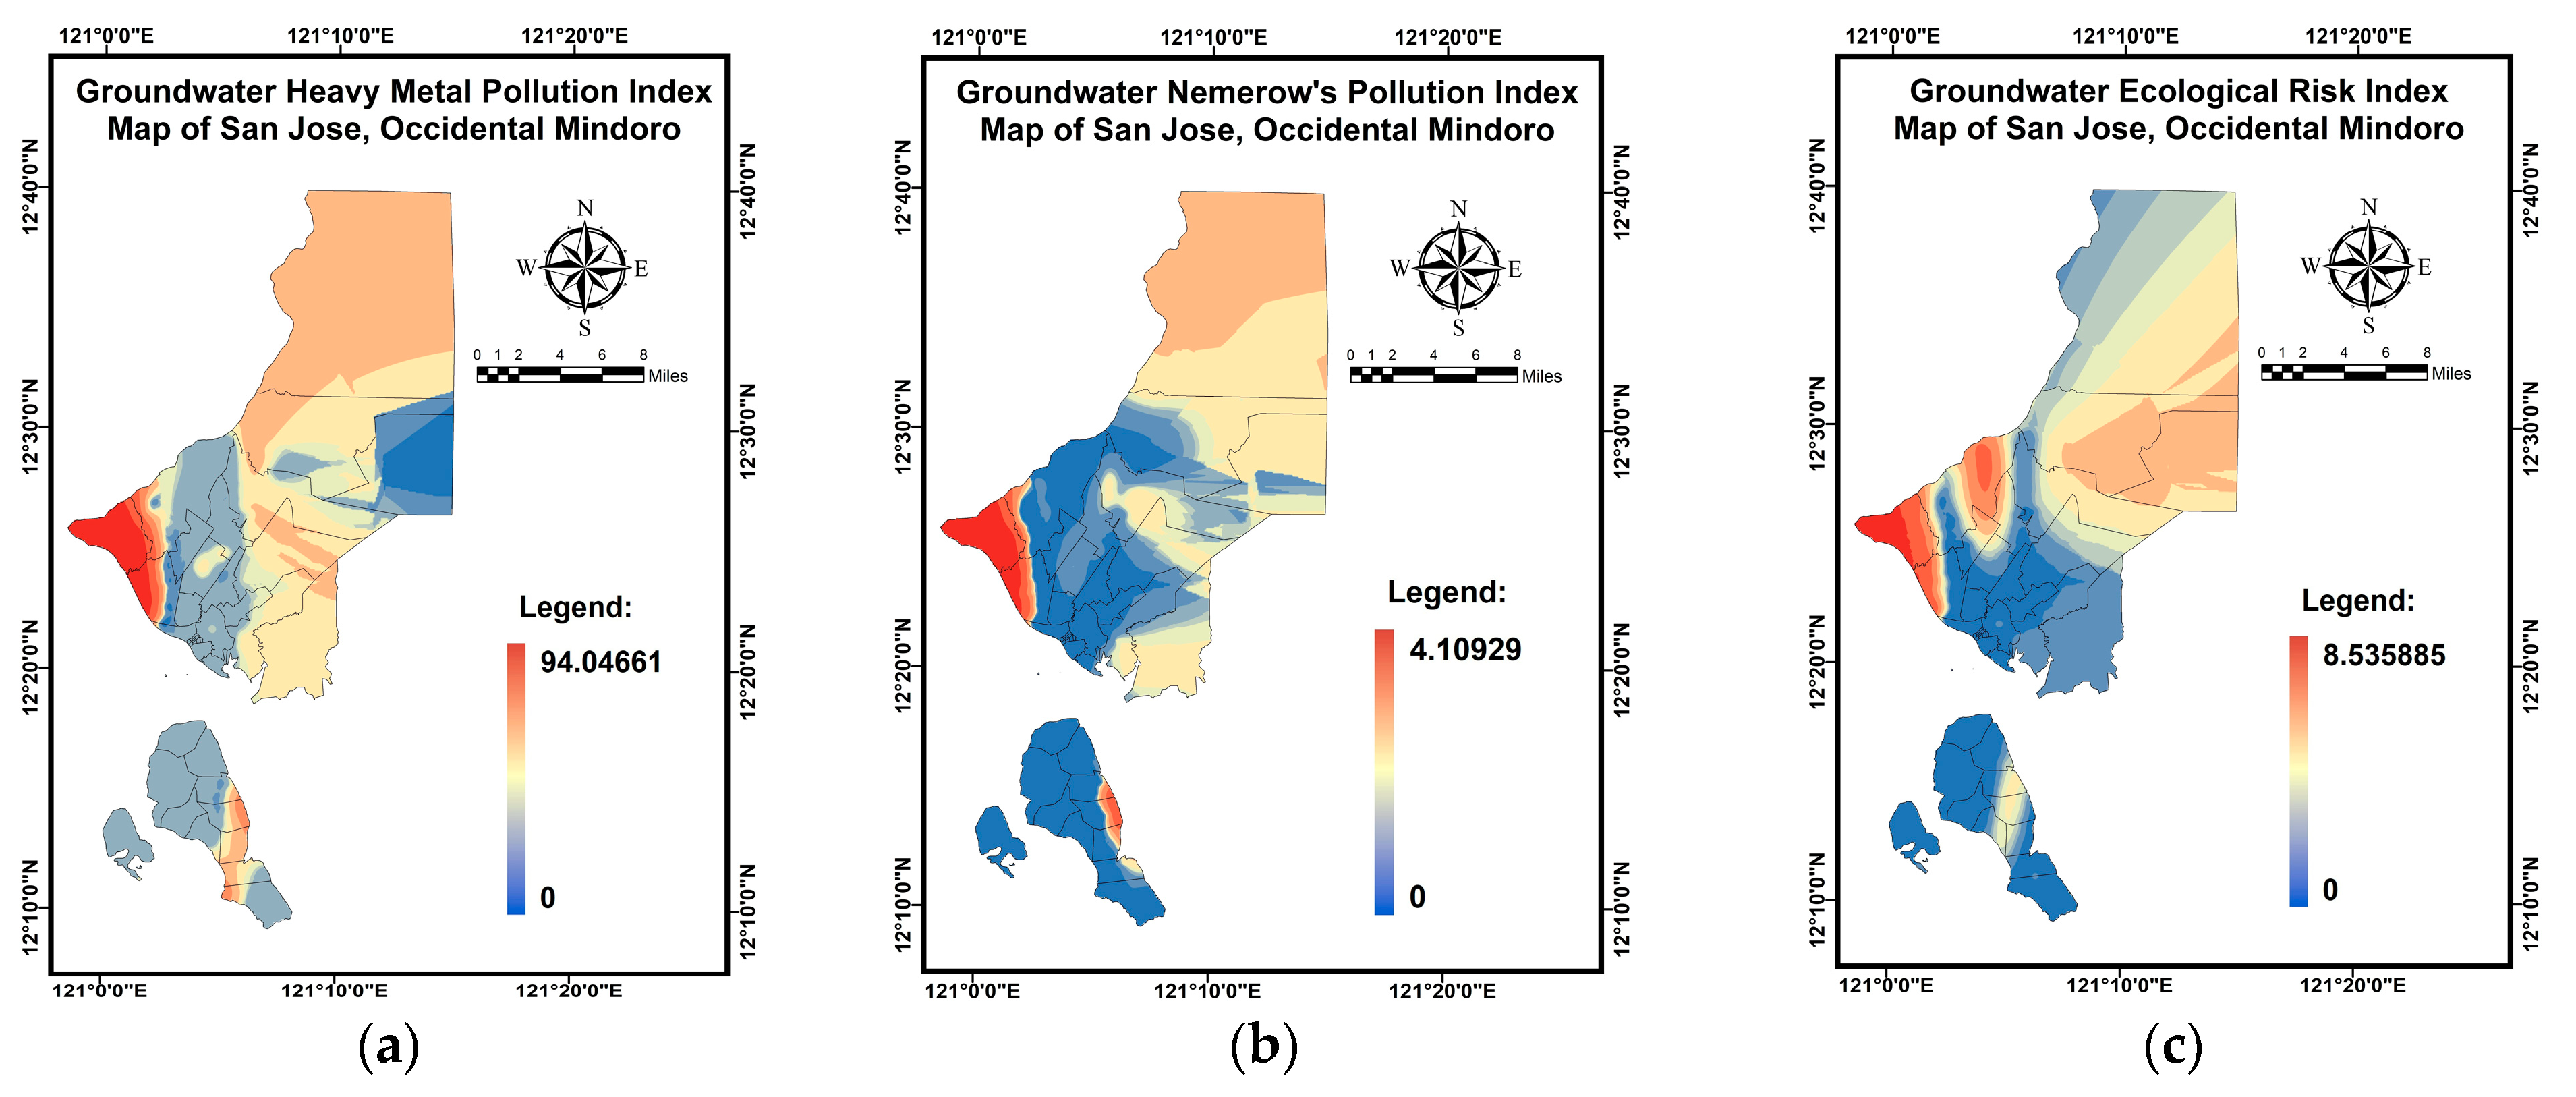
3.2. Pollution Evaluation Indices
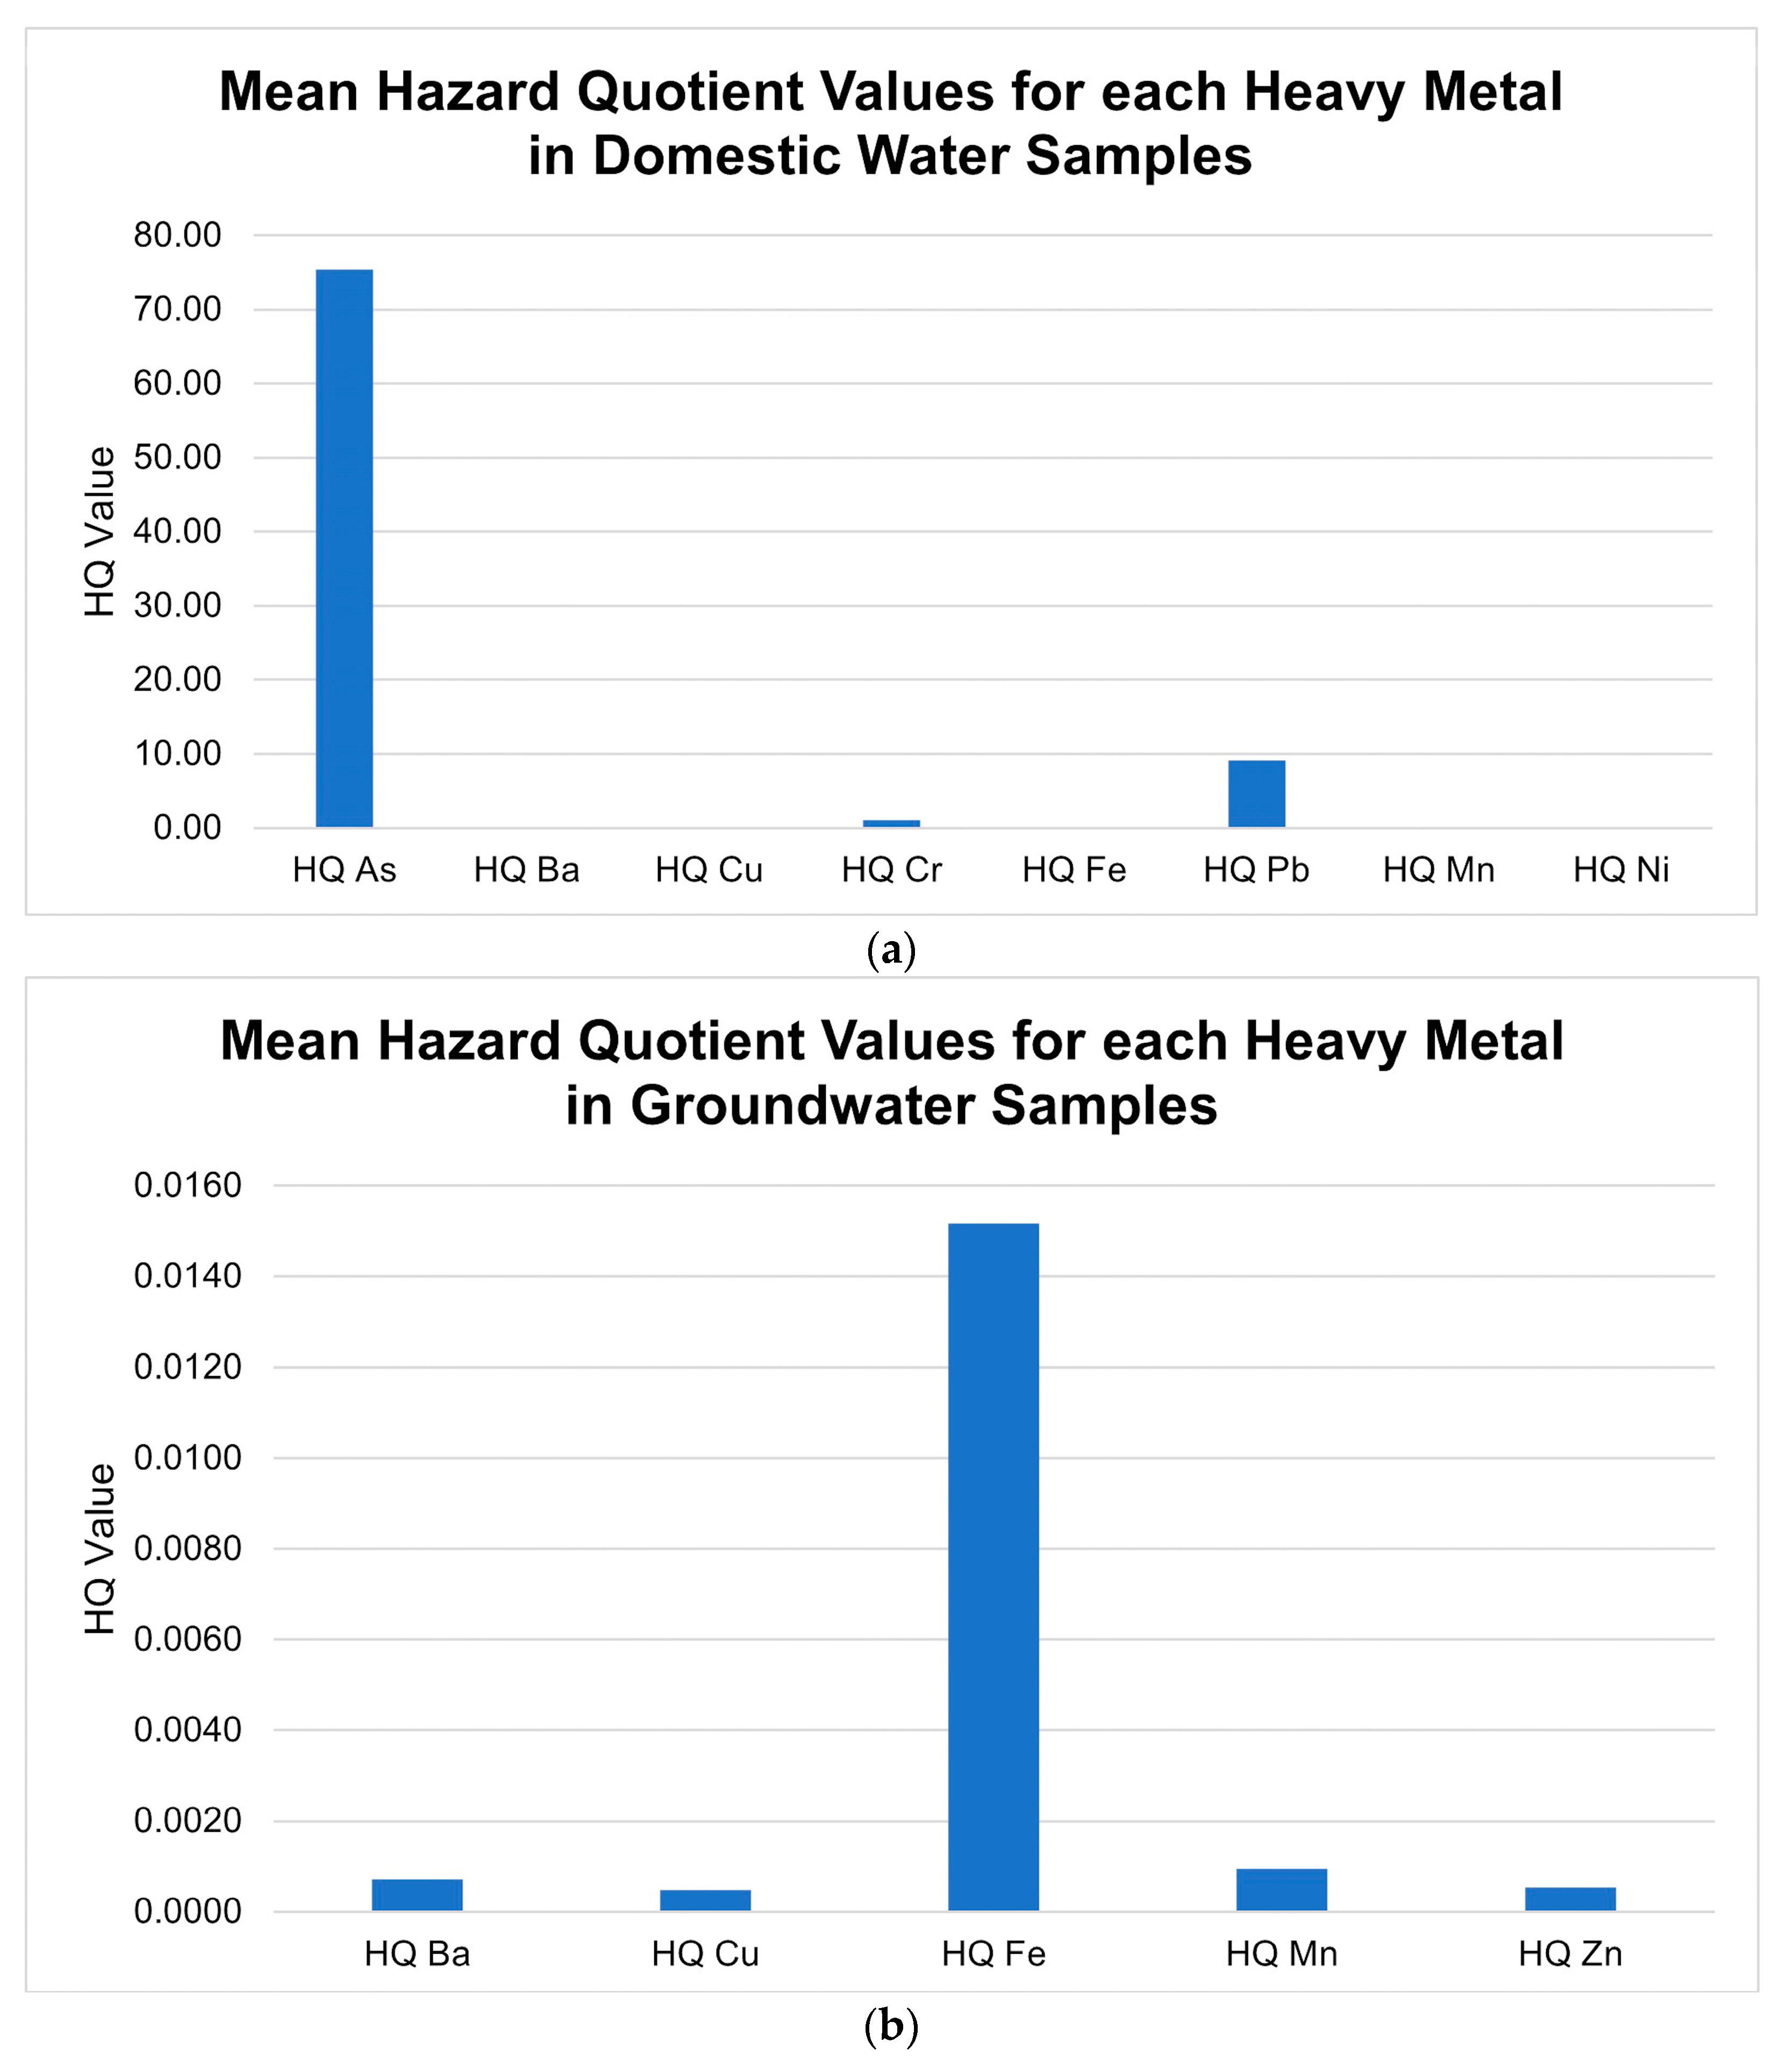
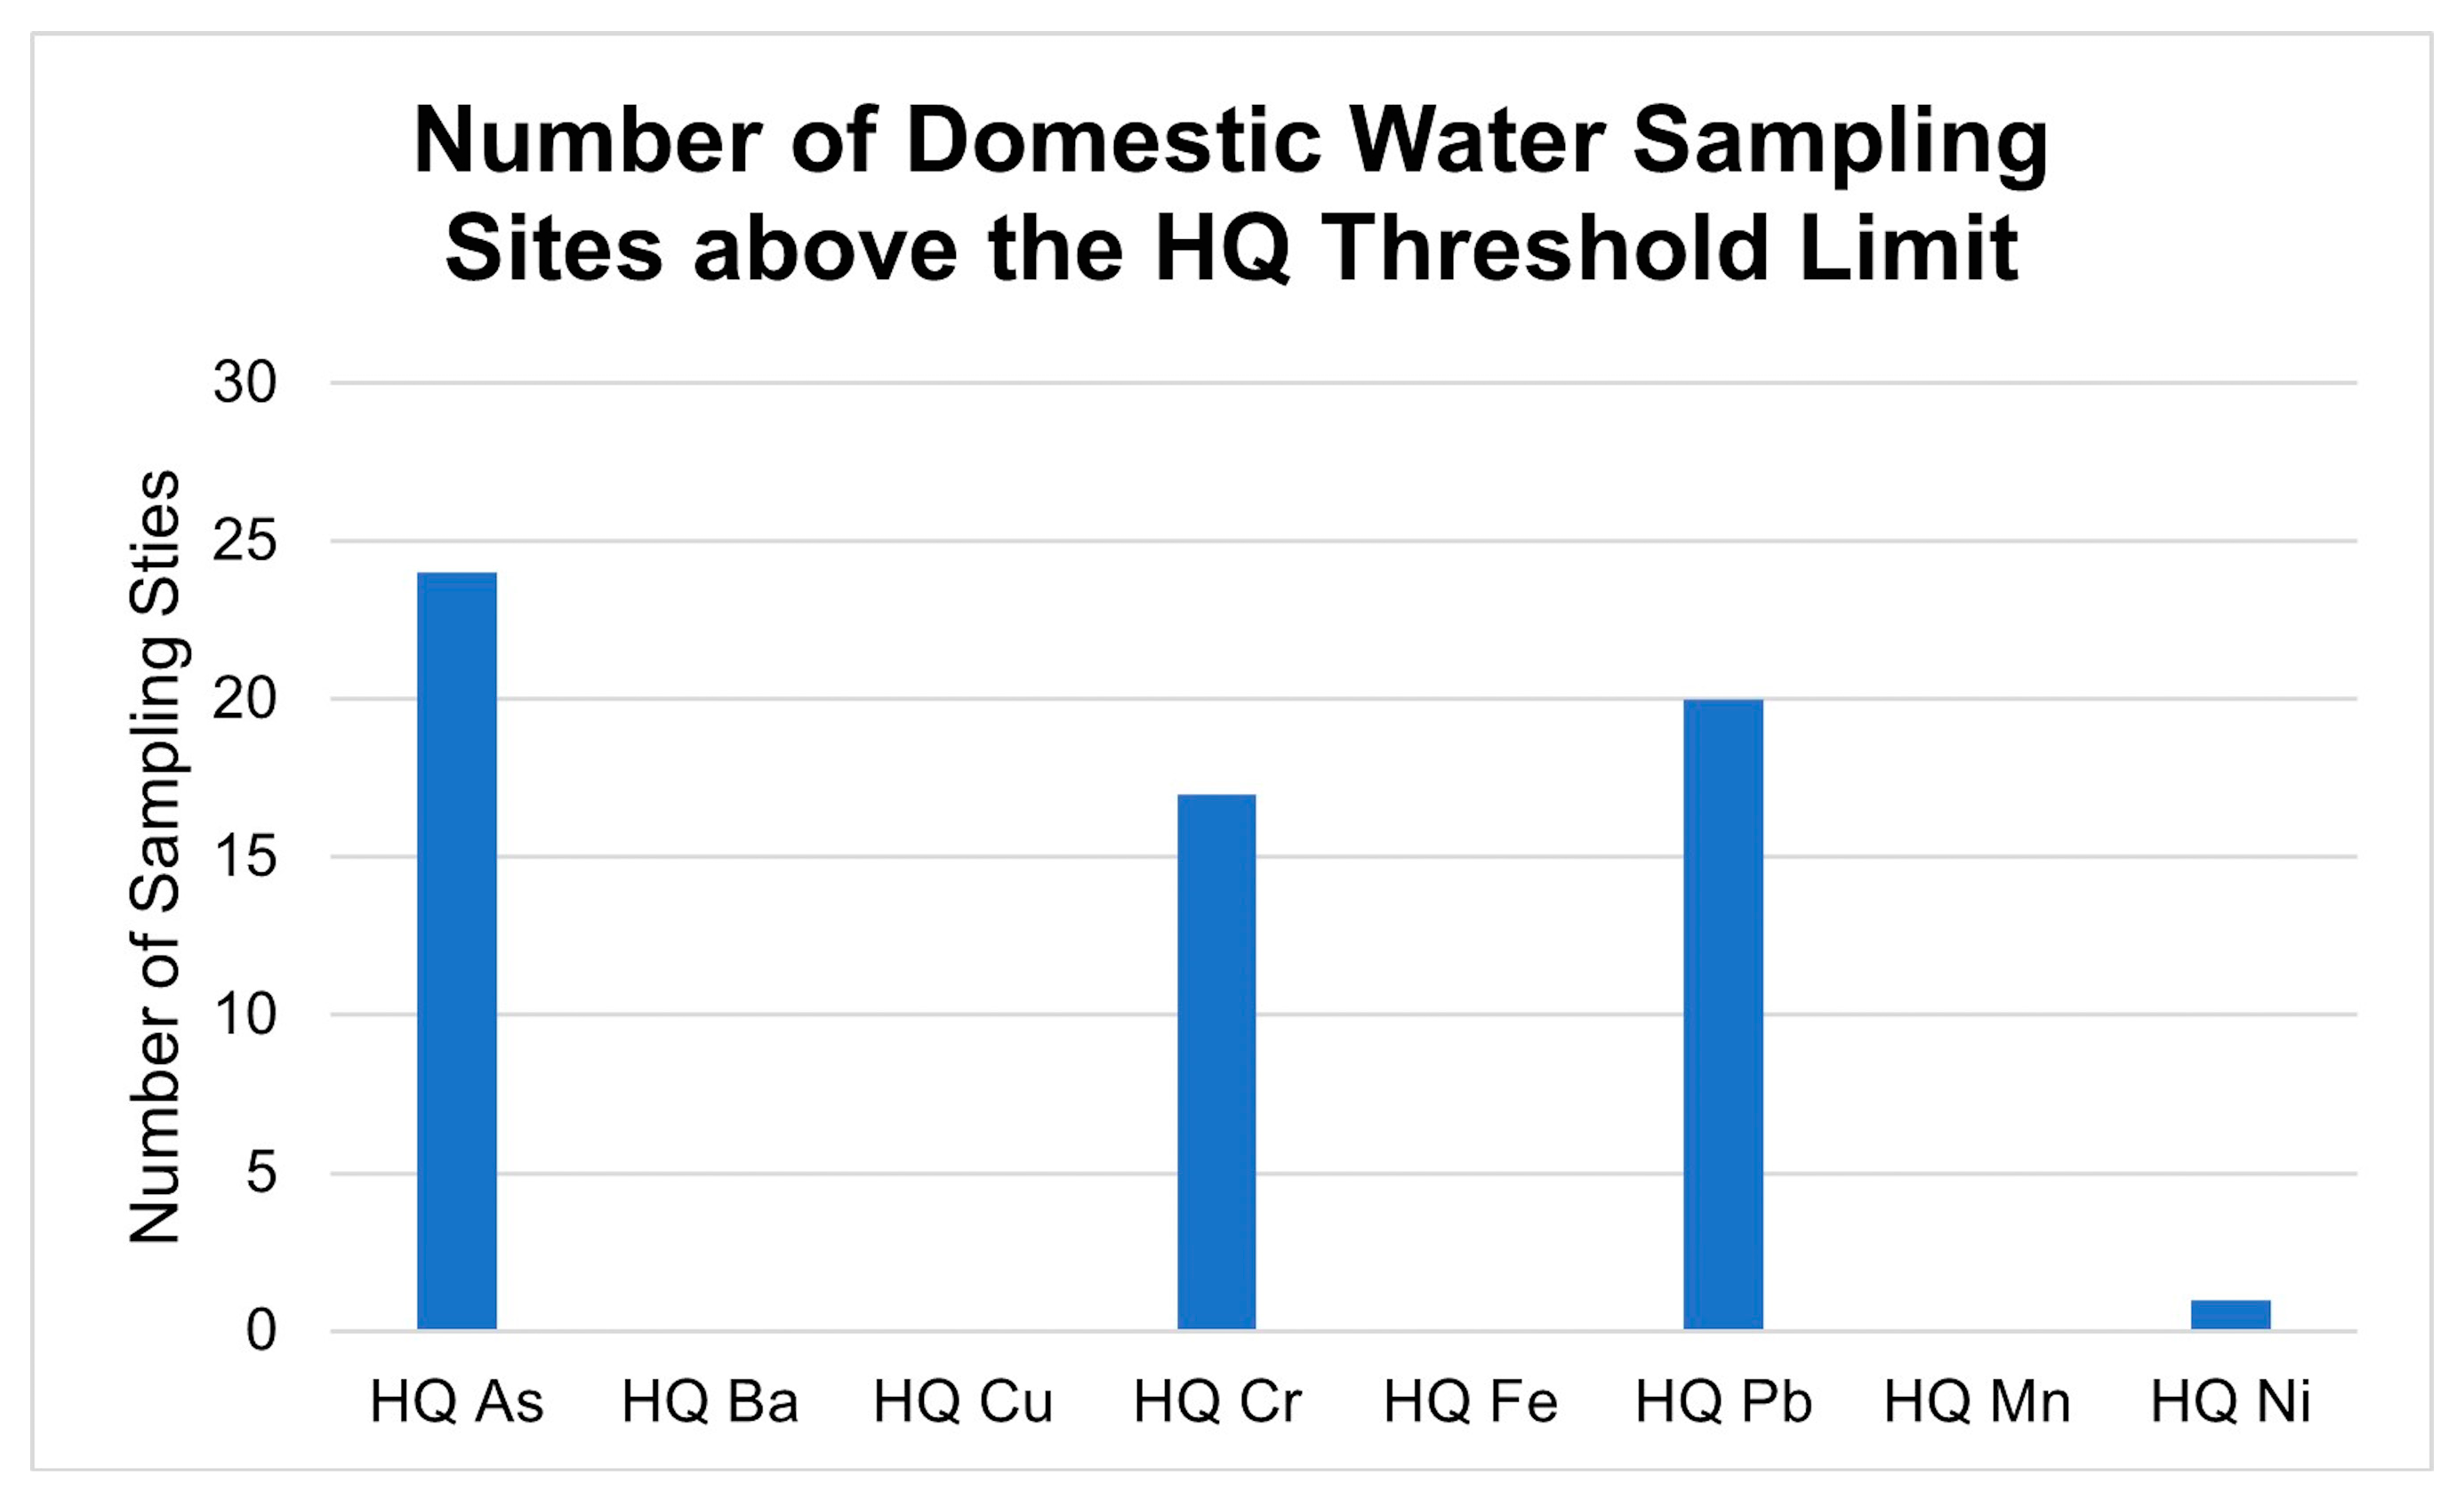
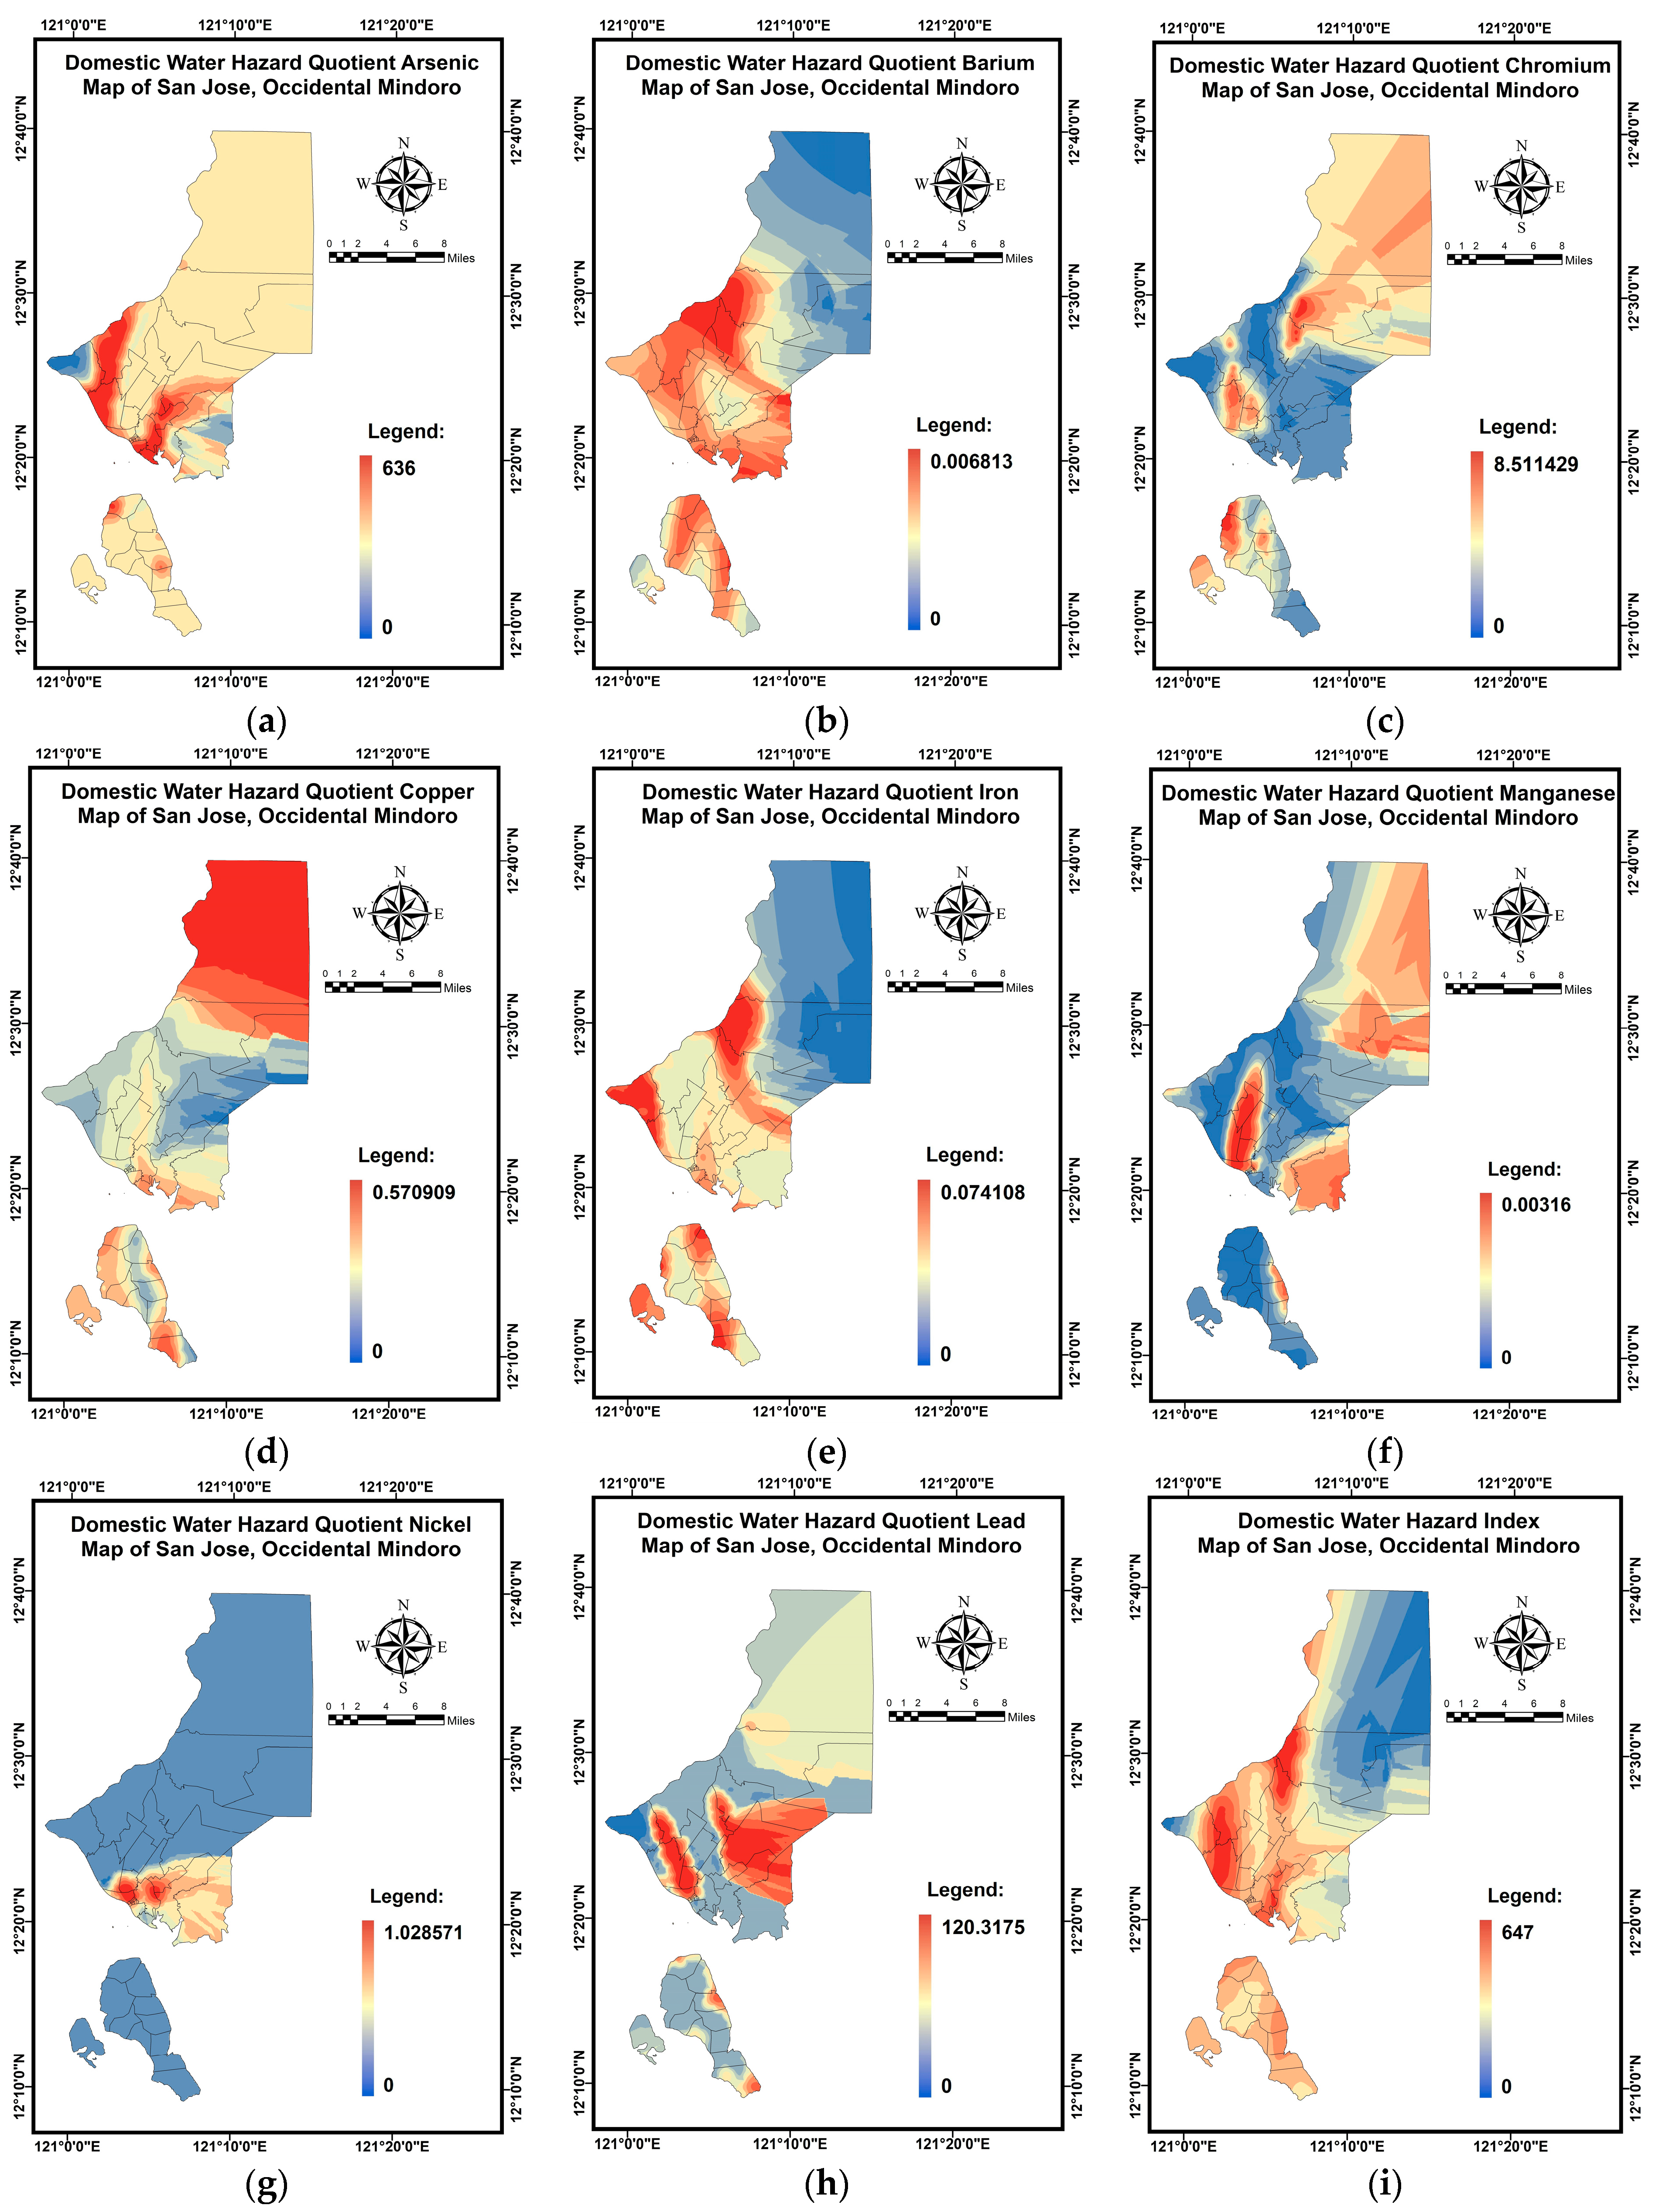
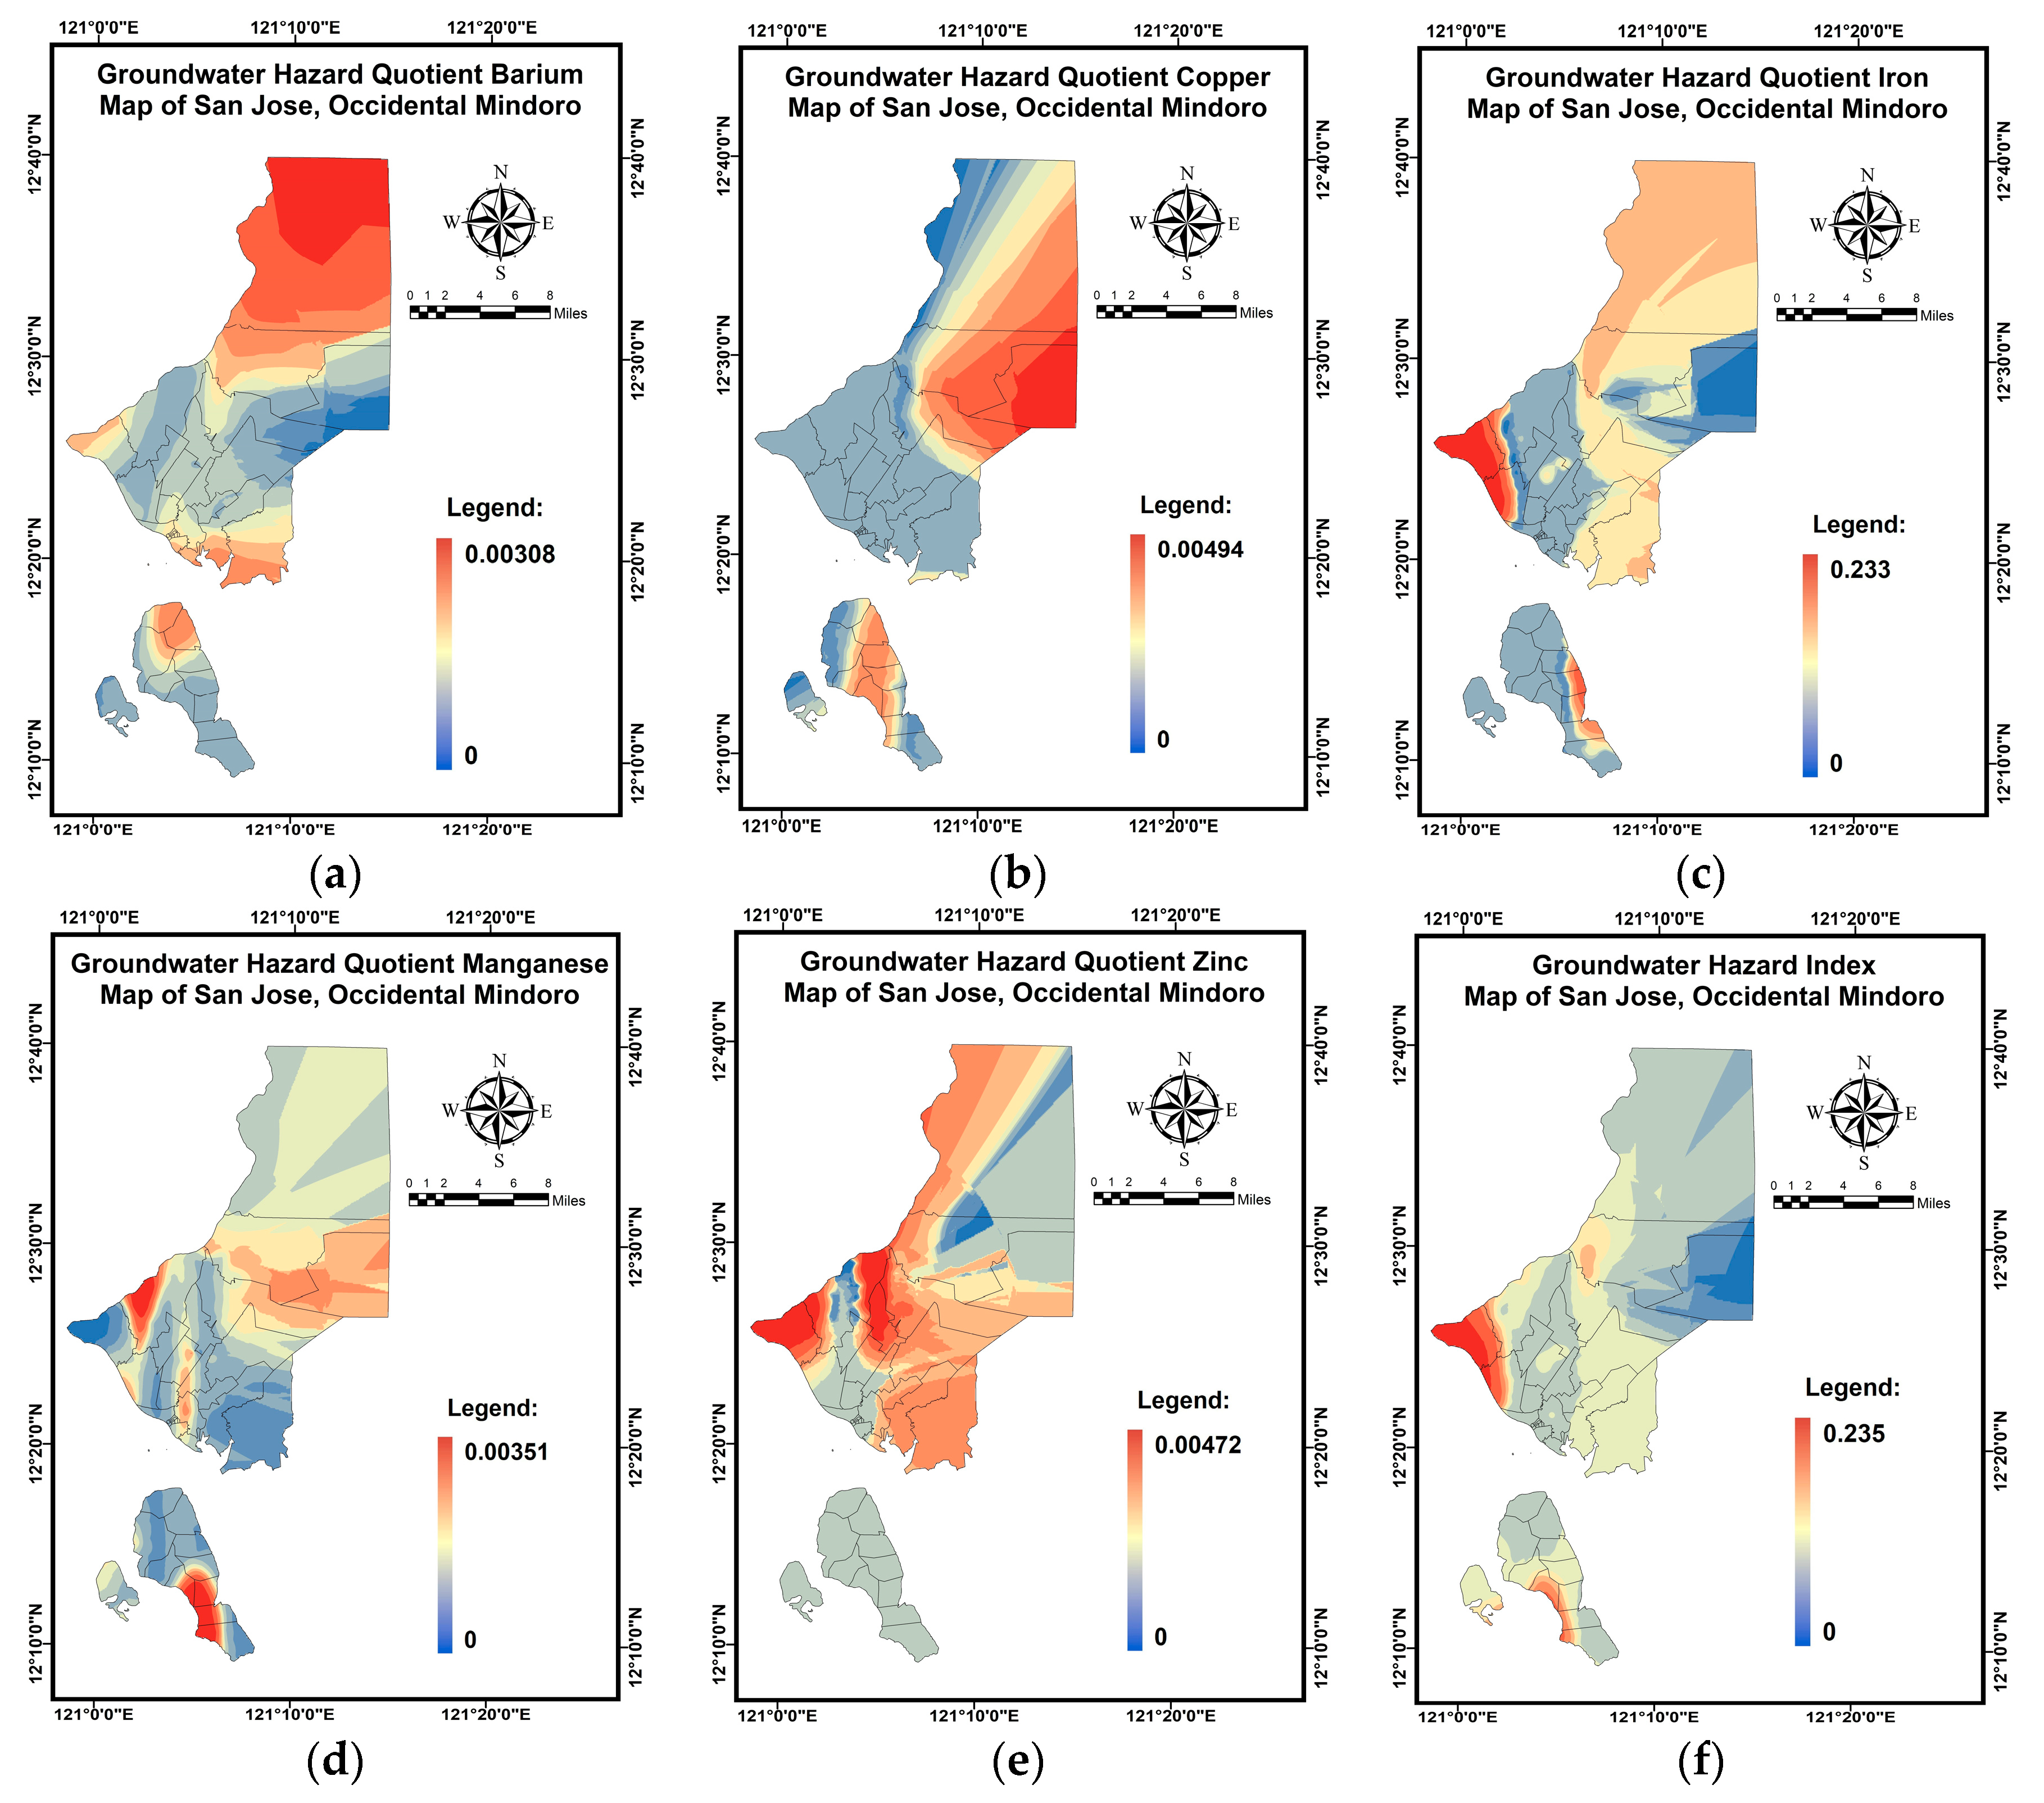
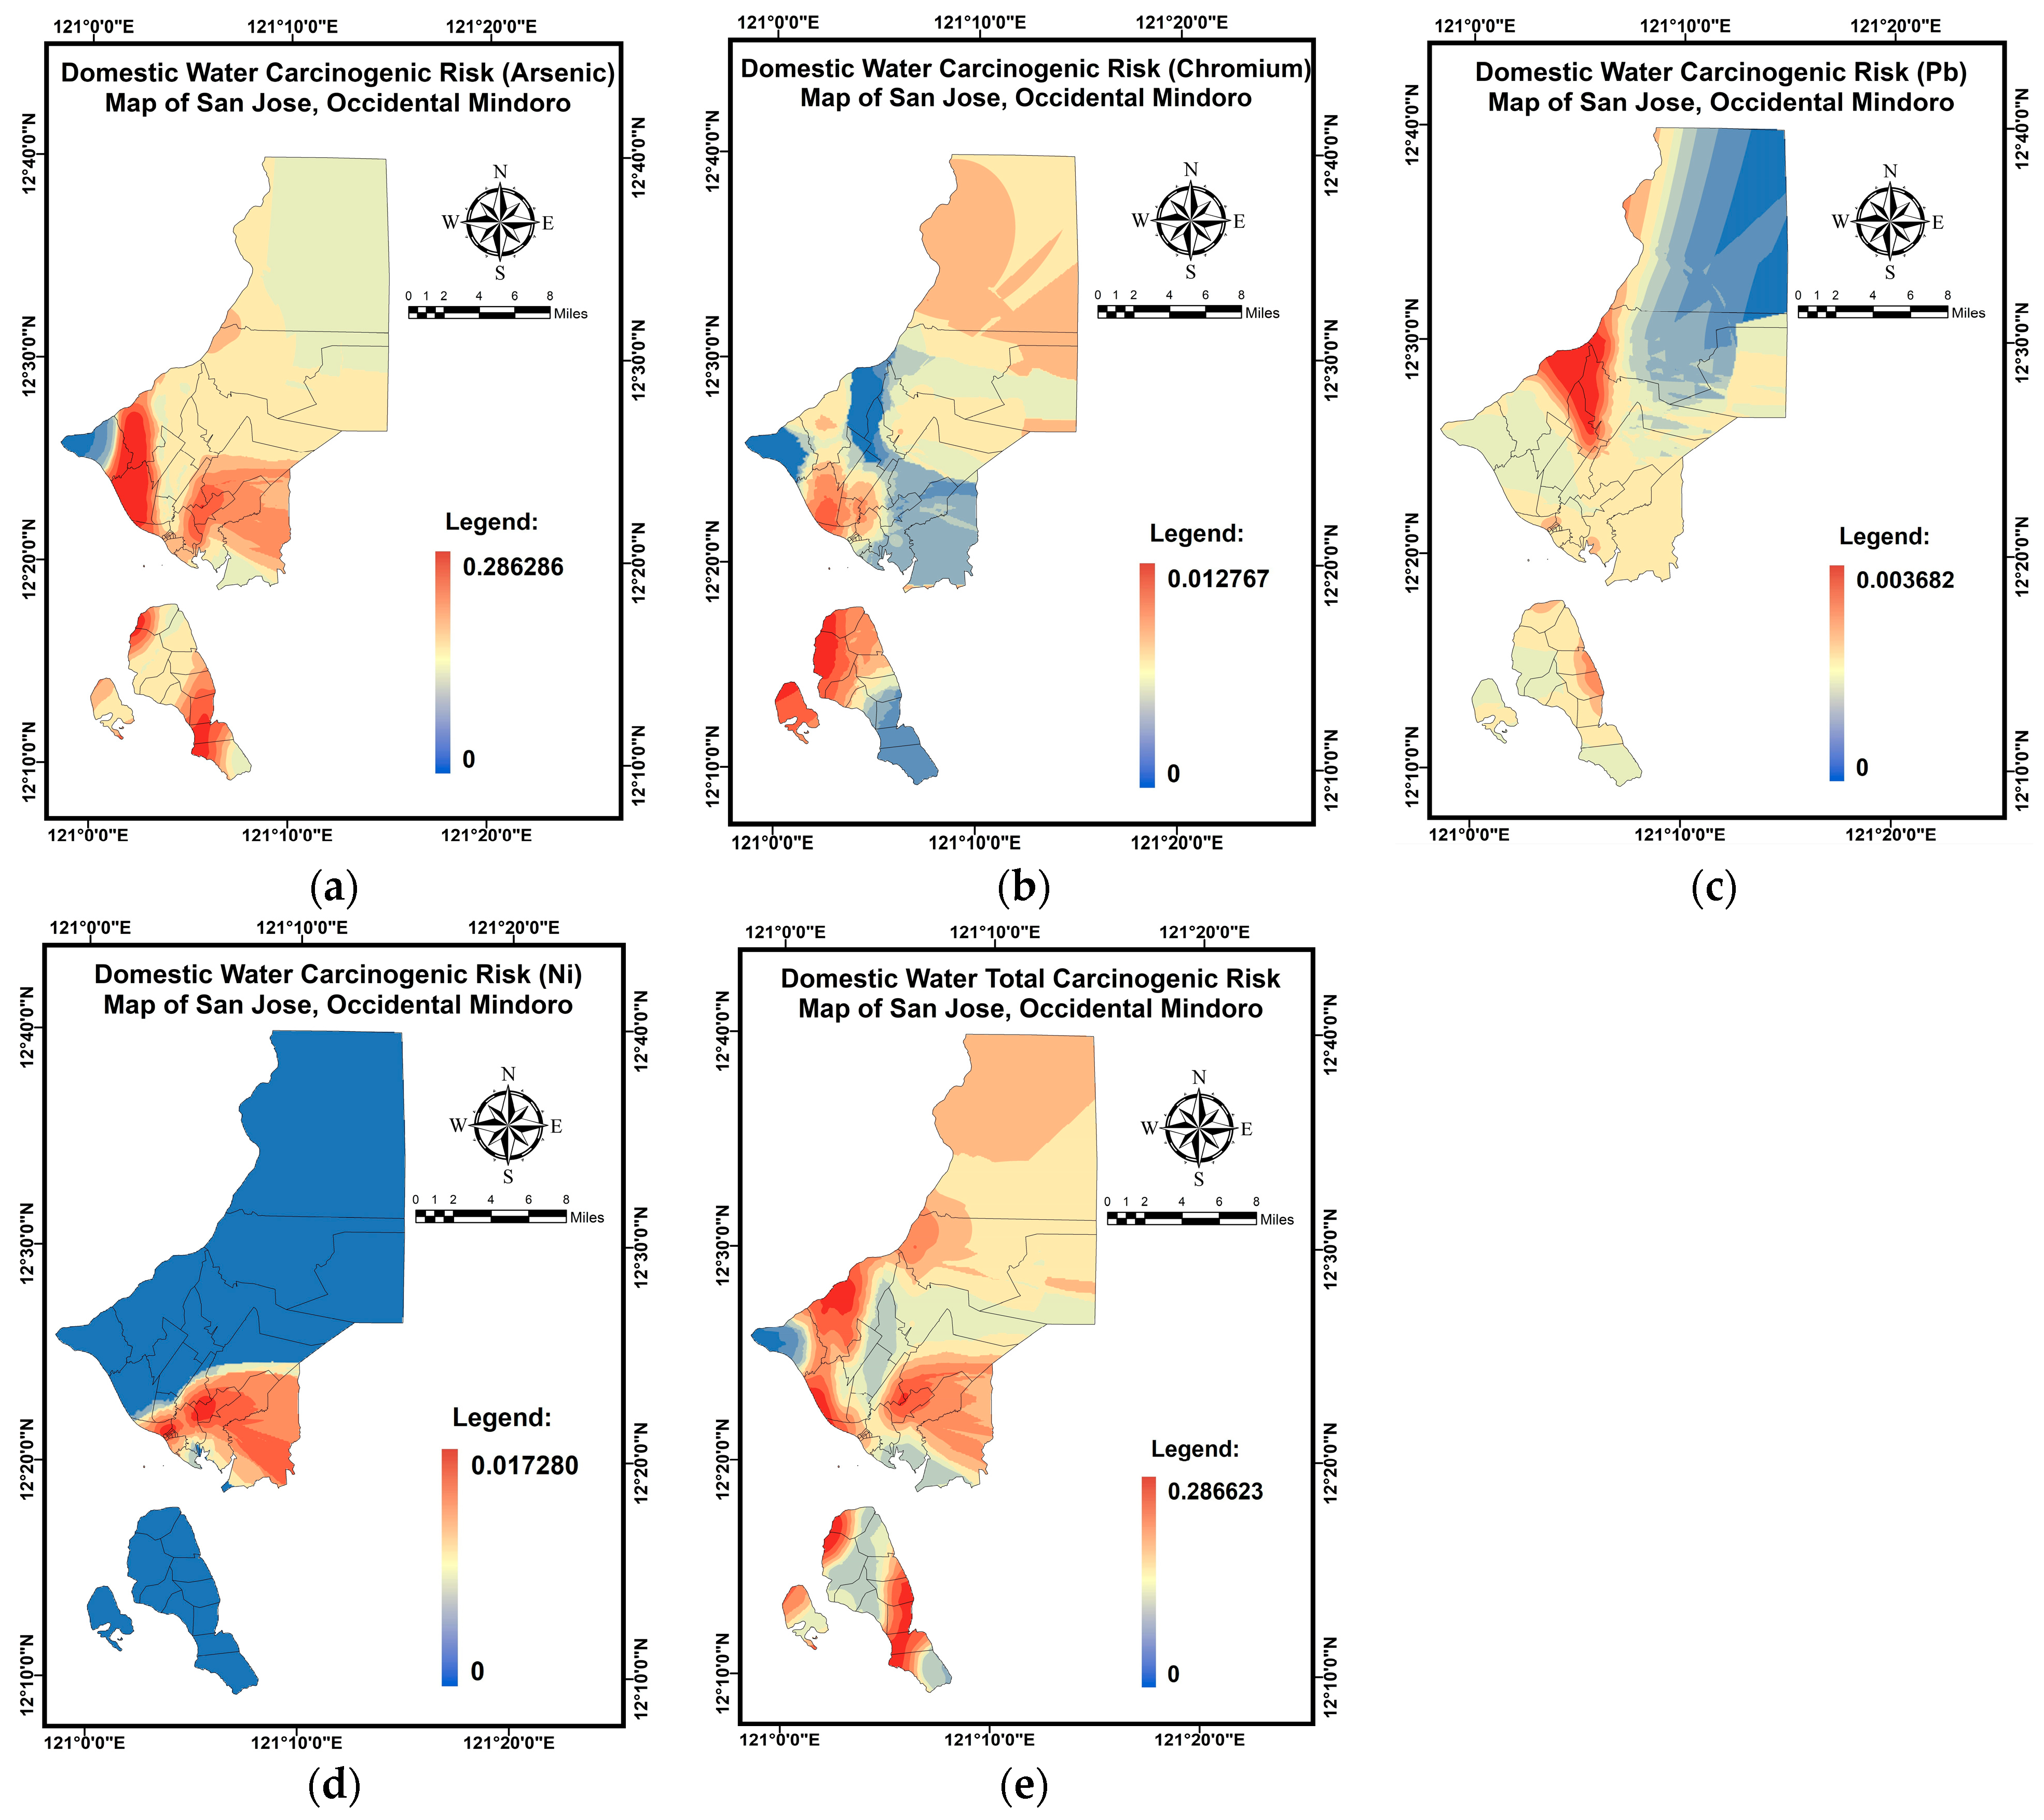
3.3. Probabilistic HRA
3.4. Spatial Mapping Using MLGI Approach
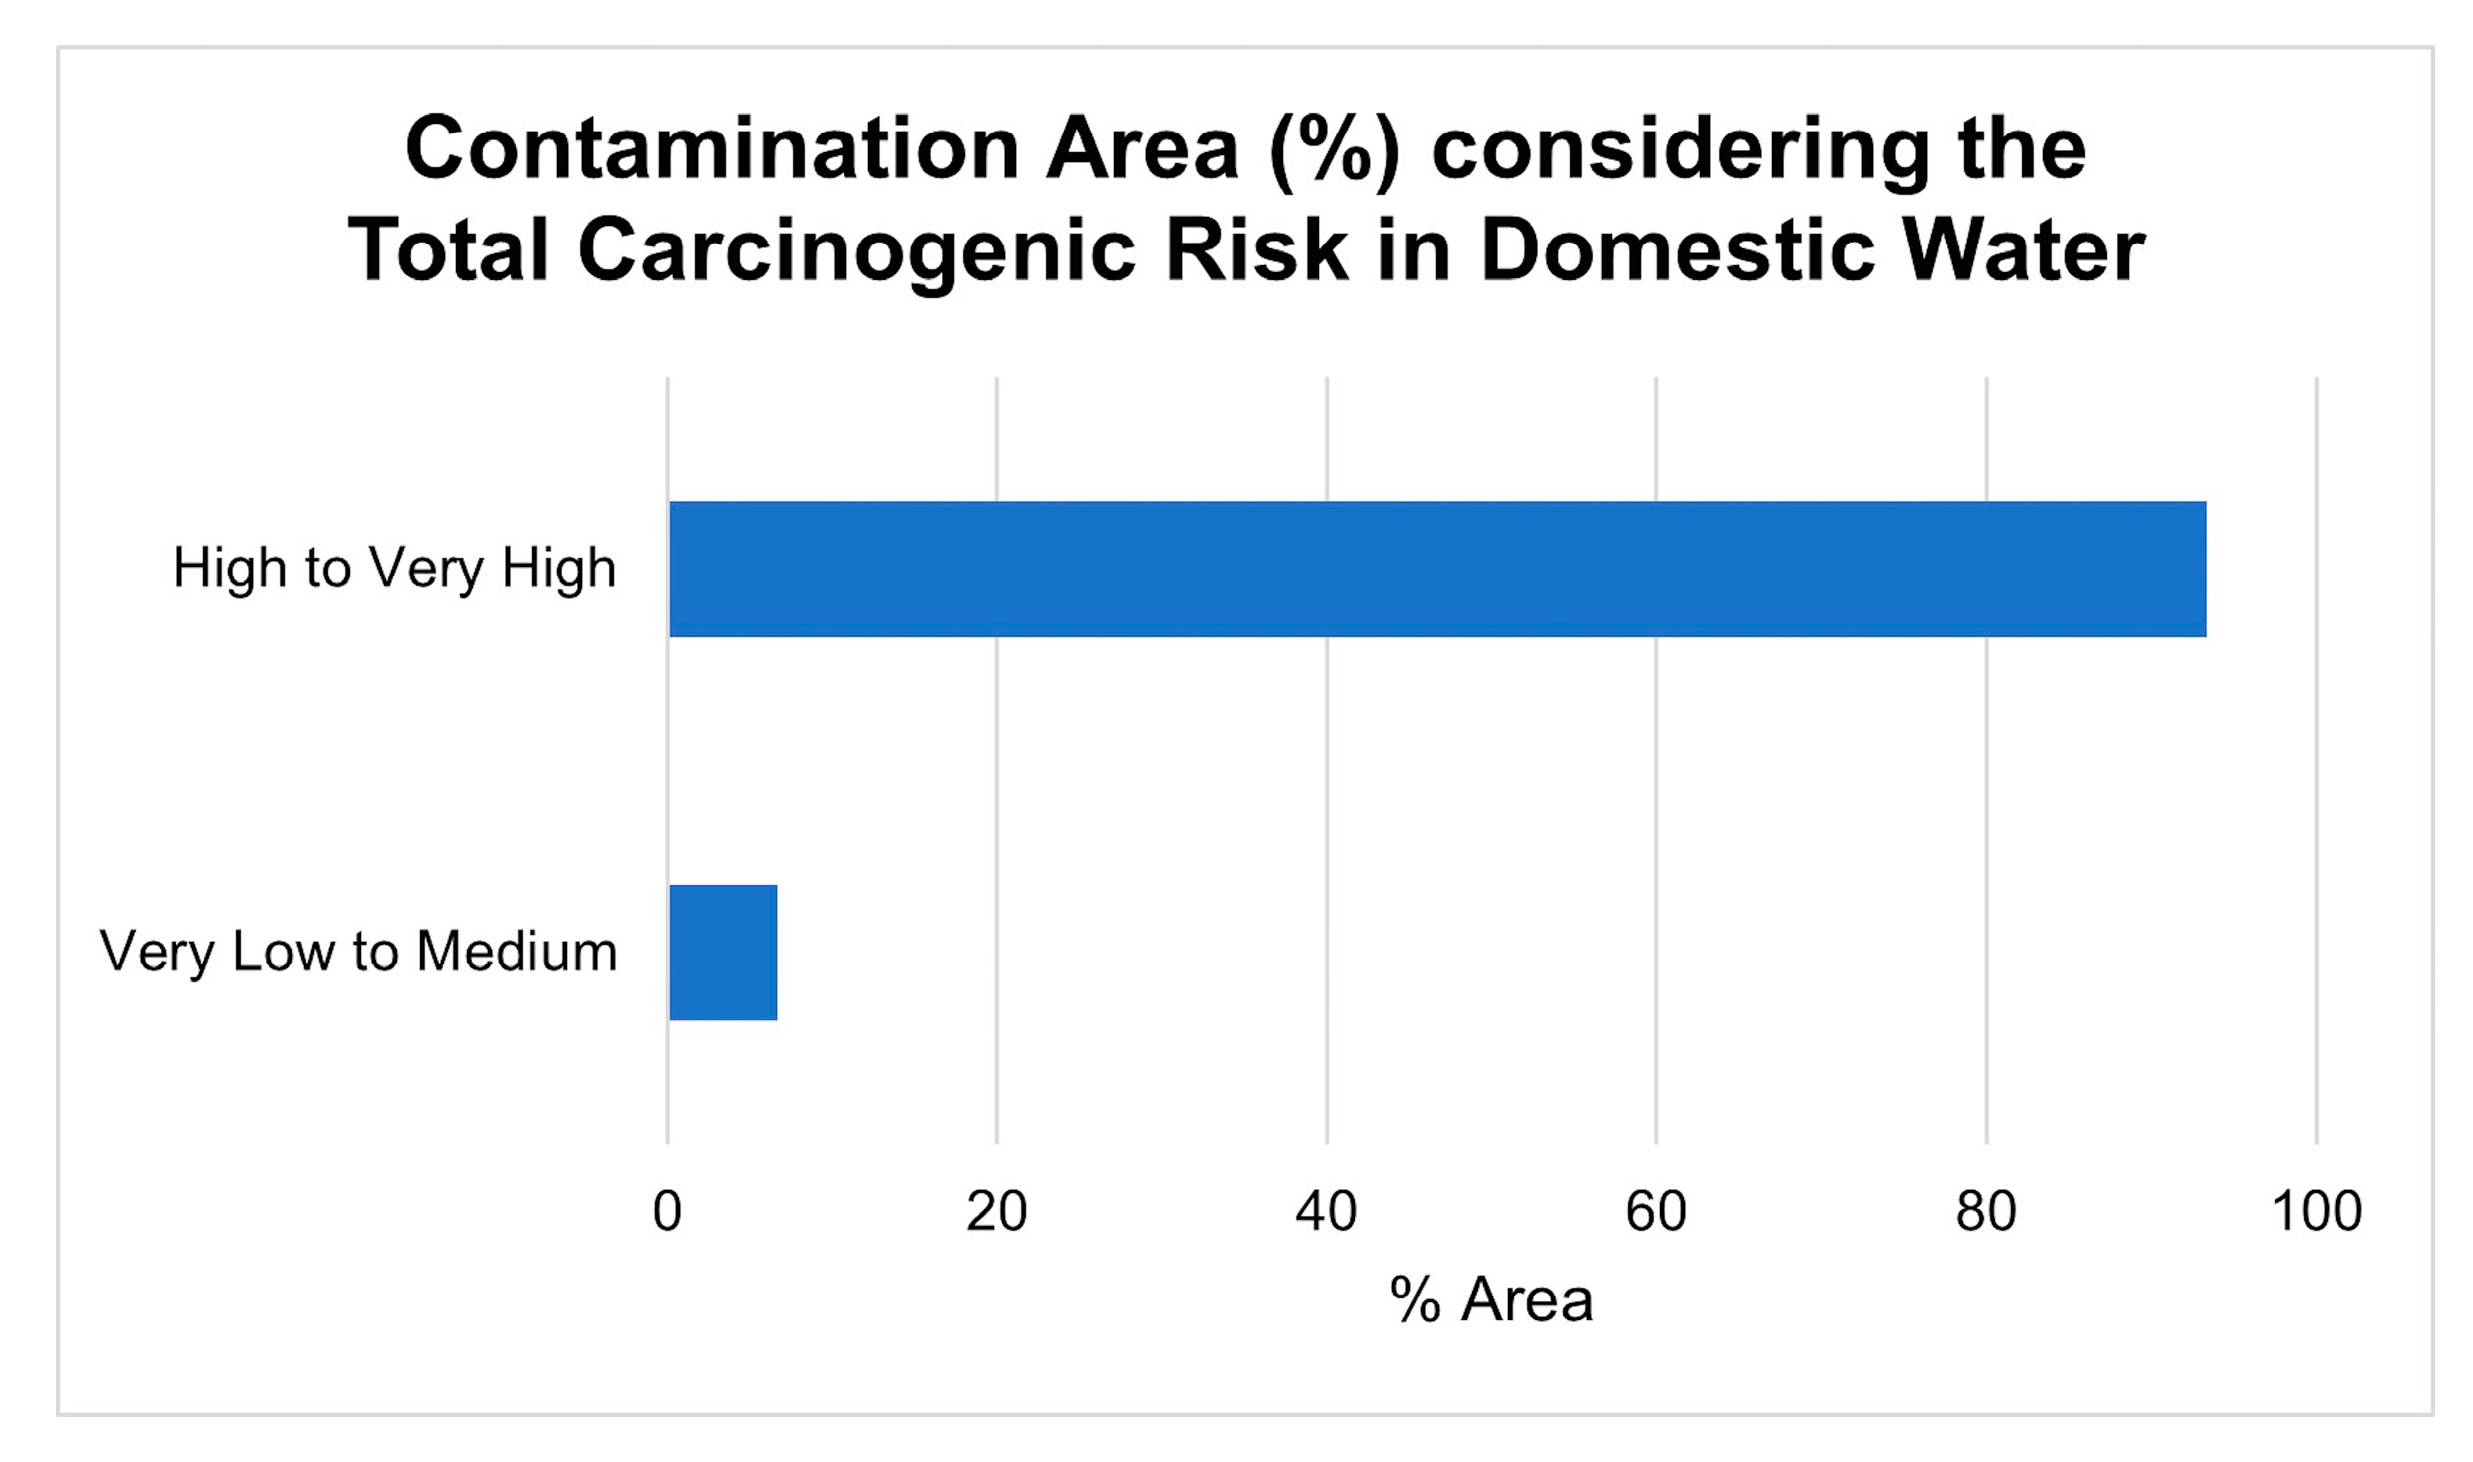
3.5. Contamination Area Calculation
4. Conclusions
Author Contributions
Funding
Institutional Review Board Statement
Informed Consent Statement
Data Availability Statement
Acknowledgments
Conflicts of Interest
Abbreviations
| Abbreviation/Symbol | Description |
| AT | Average Time |
| BW | Body Weight |
| Cd | Degree of Contamination |
| CDI | Chronic Daily Intake |
| CI | Contamination Index |
| CV | Coefficient of Variability |
| EBK | Empirical Bayesian Kriging |
| ED | Exposure Duration |
| EF | Exposure Frequency |
| ELCR | Excessive Lifetime Cancer Risk |
| ERI | Ecological Risk Index |
| GIS | Geographic Information System |
| GPS | Global Positioning System |
| HEI | Heavy Metal Evaluation Index |
| HI | Hazard Index |
| HM | Heavy Metal |
| HN | Hidden Neurons |
| HQ | Hazard Quotient |
| HRA | Health Risk Assessment |
| IR | Ingestion Rate |
| LOD | Limits of Detection |
| MAS | Metals Analysis System |
| MLGI | Machine Learning Geostatistical Interpolation |
| MMs | Metals and Metalloid |
| MPI | Metal Pollution Index |
| N | Number of Samples |
| NCR | Non-Carcinogenic Risk |
| NI | Number of Iterations |
| NN-PSO | Neural Network-Particle Swarm Optimization |
| NP | Number of Particles |
| NPI | Nemerow’s Pollution Index |
| PE | Polyethylene |
| PI | Pollution Index |
| PNSDW | Philippine National Standards for Drinking Water |
| RfD | Reference Dose |
| SD | Standard Deviation |
| SF | Slope Factor |
| Ti | Toxic-Response Factor |
| WRS | Water Refilling Station |
| WQ | Water Quality |
| XRF | X-Ray Fluorescence |
Appendix A

| Continent | Country | Parameters Evaluated | Index Calculated | Results |
|---|---|---|---|---|
| Bangladesh | Na, K, Ca, Mg, Mg, As, Fe, Mn, Cl, F, I, CO3, HCO3, NO3, PO4 | WQI, HQ/HI, CR | 8.69% (both pre- and post-monsoon) of the sampling sites have very poor WQI category; All sites have very high chronic risk during the pre-monsoon season, while that for post-monsoon is 20 of 23 sites; More than 70% of the sites have very high cancer risk during the pre-monsoon and the post-monsoon season [99]. | |
| Asia | Cambodia | Ag, Al, As, Ba, Cd, Co, Cr, Cu, Fe, Ga, Mn, Ni, Pb, Se, U, Zn | HQ/HI | HQ for As is the most significant element observed; Maximum value observed was HI = 3.57, which is greater than the threshold of 1.0 [100]. |
| China | Cr6+ | HQ/HI, CR | NCR shows induced risk for 7.47% and 12.07% of adults and children respectively, while that for CR shows 50.57% for adults and 16.67% for children [101]. | |
| India | Al, As, Cd, Co, Cr, Cu, Fe, Mn, Mo, Ni, Pb, V, Zn | HPI, HQ/HI, CR | Two sites have been identified as not suitable for drinking purposes without prior treatment; As is the most significant element to the NCR and CR in the area [102]. | |
| Iran | As, Cd, Cr | HI/HQ, CR | All sites have HQ > 1 considering As; Only one site has HQ < 1 considering Cr [103]. | |
| Iraq | As, Cr, Cu, Fe, Mn, Mo, Ni, Pb, Zn | HPI, HQ/HI, CR | 28% of the sites exhibit HPI values within the category of Medium to Highly Polluted [104]. | |
| Jordan | Cd, Co, Cr, Li, Mn, Mo, Ni, Pb, U, V, Zn | CI, HQ/HI, CR | CR was within the acceptable risk limits [105]. | |
| Kazakhstan | Cd, Co, Cu, Fe, Mn, Ni, Pb, Zn | HPI, HQ/HI, CR | 92.86% of the samples were considered to have a high level of pollution [106]. | |
| Korea | As, Cd, Cu, Pb, Zn | HQ/HI, CR | Water consumption on a frequent basis might potentially be detrimental due to long-term As exposure [107]. | |
| Kyrgyzstan | As, F | HQ/HI, CR | Children were observed to have a greater health risk than adults. Specifically, the CR of As via the oral intake pathway was above the permissible limits [108]. | |
| Lao PDR | As, B, Ba, Cr, Cu, Mn, Ni, Pb | HQ/HI, CR | Four sites observed HI > 1 and have CR above the acceptable risk level of 1 × 10⁻⁴ [109]. | |
| Malaysia | SO4, Cl, Ca, Mg, Na, K, Al, Fe, Mn, Zn, Sr, As, Cr, Cd, Ni, Cu, Co, Pb | WQI | Some sampling sites were categorized as slightly polluted with HM concentrations exceeding the permissible limits [110]. | |
| Nepal | Ba, Cd, Co, Cr, Cu, Pb, Li, Mn, Mo, Ni, Sb, Sr, V, Zn | WQI, HQ/HI | WQI observed in the sampling sites was within the excellent water category; HQ values observed in the sampling sites were all less than 1, which suggested that it poses no adverse health effects to the residents [111]. | |
| Pakistan | F, Cl, Pb, Cd, Ni, Zn, Fe, As | HQ/HI, CR | HQ considering As has a value observed greater than 1, which suggests that it poses potential adverse health effects in the residents; 3.3% of the sites have CR values above the USEPA threshold limit [112]. | |
| Philippines | As, Ba, Cu, Fe, Pb, Mn, Ni, Zn | HPI, NPI, HQ/HI, CR | All sampling locations were categorized to have a high level of pollution; CR via ingestion pathway exceeded the USEPA threshold limit [30]. | |
| Saudi Arabia | Ag, Al, B, Ba, Cr, Cu, Fe, Mo, Ni, Pb, V, Zn | HPI, Cd, HQ/HI | Potential NCR showed that HQ for Al, Mo, Cu, Cr, and Pb exceeded the recommended value of 1, implying that it can cause a potential adverse health effect [113]. | |
| Thailand | Ca2+, Mg2+, Na, K, Fe, SO42−, NO3−, Cl−, HCO3− | HQ/HI, CR | Study showed that As is the most significant element with respect to the NCR and chronic effects, and was predominant with adults [114]. | |
| United Arab Emirates | Cl−, SO42−, Ca2+, Na+, K+, Mg2+, Ba2+, As, Cd, Pb, Cr, Cu, Zn | HQ/HI | 30% of the sites were classified to have a very high risk [115]. | |
| Vietnam | As | CR | Skin CR is 11.5 times greater in unfiltered water and 14.8 times higher when consuming water for a lifetime that has been exposed to As [116]. | |
| Africa | Algeria | Cd, Cr, Cu, Mn, Ni, Pb, Zn | HPI, HEI | HPI values observed for all samples were below the critical value; No chronic HR was posed by the GW [117]. |
| Cameroon | As, Cd, Co, Cr, Cu, Ni, Pb, Zn | WQI, HPI, HEI, HQ/HI, CR | WQI suggests that the GW is categorized to be poor to unsuitable; HM concentrations presented a risk for non-carcinogenic health consequences; Ingestion of groundwater also posed a moderate to high risk of developing cancer in both adults and children [118]. | |
| Egypt | Fe, Mn, Pb, Cd, Ni, Cu, Zn, Cr, As | HQ/HI, CR | Ingestion is observed to be the most significant pathway of exposure; The prevalence of arsenic was stated to be accountable for the highest CR [119]. | |
| Ethiopia | Pb | HQ/HI, CR | Mean HQ levels both for children and adults were below 1; CR values for adults and children were within the permissible levels of USEPA [120]. | |
| Ghana | Na+, K+, Ca2+, Mg2+, HCO3, F−, Cl−, NO3−, PO43−, SO42−, Pb2+, Co, Cr, Fe, Mn, Zn, Cu, Cd | HQ/HI, CR | HQ due to Mn and Fe was greater than 1, implying that it can cause a potential adverse health effect [121]. | |
| Kenya | Cd, Ni, Pb | HPI, HEI, HQ/HI, CR | All samples had hazard indices that exceeded 1, which indicated a significant risk due to the metal exposure; CR values were greater than the USEPA permissible limit for both children and adults [122]. | |
| Morocco | Cd, Cr, Cu, Fe, Mn, Ni, Pb, Zn | HQ/HI | HQ was significantly influenced by Zn concentration [123]. | |
| Mozambique | Sr, Li, B, Al, Ba, V, Mn, Fe, Hg, Co, Ni, Cu, Pb, Zn, As, Rb, U | HQ/HI | HQ values exceed the maximum permissible limit for children due to ingestion pathway [124]. | |
| Nigeria | Cl, Fe, Zn, Pb, Cu, Ni, Cr, Mn, Cd | WQI, ERI, HEI, HPI, HQ/HI, CR | About 24% of the samples have deteriorated water quality; About 15% of the samples posed moderate ecological risks; Cu is the most significant element to the HI and more than 40% of the samples presented high chronic HR; High Cr risk was observed in 19% of the samples, while that for Cd and Ni is 14% [3]. | |
| Senegal | Pb, Cd, Cu, Fe, Mn | HQ/HI | High risk for infants and children with respect to Pb and Cd [125]. | |
| South Africa | Ag, Al, B, Cd, Co, Cu, Fe, Li, Mn, Li, Mn, Ni, Pb, Si, Zn | HPI, HQ/HI | Two zones presented high contamination classification based on their HPI values; All age groups were exposed to potential health risks due to HQ via ingestion pathway [126]. | |
| Sudan | CO32−, HCO3−, NO3−, NO2−, SO42−, NH3, F−, Cl−, Na+, K+, Mg2+, Ca2+ | HQ/HI | About 60% of the sampling sites presented potential health risks for both children and adults [127]. | |
| North and South America | Argentina | Ca2+, Mg+, K+, HCO3−, Cl−, SO42−, NO3−, Cr(IV) | HQ/HI, CR | HQ value via ingestion pathway is greater than 1 for both adults and children; CR due to Cr(VI) exceeded the permissible limit set by the USEPA [128]. |
| Brazil | Ca, Mg, Na, K, Cl−, HCO3−, SO42−, NH4+, NO3−, F−, Fe, Mn | WQI, HPI | WQI and HPI values presented samples that were of good quality [129]. | |
| Ecuador | Al, Ba, Ca, Fe, K, Mg, Mn, Na, Sr, Cu, Cr, Pb, Zn | HPI | 6.6% of the samples in a sampling region have Pb levels above the threshold value [130]. | |
| Mexico | As, F | HQ/HI | Observed HI > 1 for both adults and children suggests a potential health risk and was attributed to exposure to As and F [131]. | |
| Paraguay/ Uruguay/ Argentina/Bolivia | Li, B, Al, Si, V, Cr(III), Mn, Fe, Co, Ni, Cu, As, Rb, Sr, Cd, Cs, Ba, Pb, U | HPI, HQ/HI | 34 sites were categorized as highly polluted sites; HQ value calculated indicated no risk [132]. | |
| Peru | Au, Cd, Co, Cr, Cu, Fe, Mn, Mo, Ni, Pd, Pt, Sc, Ti, V, Zn, Al, Pb, Sn, As, B, Ge, Si, Er, Nd, Yb, P, Se, Ba, Ca, K, Li, Mg, Sr | HQ/HI, CR | As is the most significant CR. HQ via ingestion for As, B, Zn, Cu, Ba, and Sr were major contributors to the NCR [133]. | |
| Europe | Czech Republic | Crtotal, Zn, Pb, Cd, Hg | HEI, HPI | All samples were below the threshold value [134]. |
| Greece | Cr(VI), NO3-N | HQ/HI | HQ was acceptable for all sites considering adults; one site has HQ > 1 for children, suggesting potential adverse health effects; multiple sites have CR greater than the permissible limit by the USEPA [135]. | |
| Italy | Al, As, Ba, Cd, Cr, Cu, Fe, Mn, Ni, Pb, Se, Zn | HPI | HPI values were within the critical pollution level category [136]. | |
| Poland | Pb, Cd, Ni, Cu, Fe, Zn, NH4 | NPI, HQ/HI | High risk of contamination due to Pb and Cu [137]. | |
| Romania | NH4+, HCO3−, Cl−, NO3−, NO2−, SO42−, Li, Na, Mg, Al, K, Ca, Sr, Ba, Mn, Fe, Cu, Zn, Ga | WQI, HEI, HPI, Cd, HQ/HI | WQI values suggested water classification as marginal, poor, and very poor quality; Cl−, Al, and NO3− were the most significant parameters in the exceedance of HQ to the permissible limit; Fe and Li were the dominant contributors to HPI value [138]. | |
| Serbia | Al, As, Cu, Zn, Fe, Cr, Cd, Mn, Ni, Pb, Hg | HQ/HI | HQ due to As and Hg in multiple sites suggested potential non-carcinogenic health effects [139]. | |
| Ukraine | Al, As, Cr, Cd, Cu, Mn, Ni, Pb, Zn | HPI, HEI, HQ/HI | 17% of the samples have HI > 1, suggesting potential non-carcinogenic health effects [140] | |
| Oceania | Fiji | Cd, Cr, Mn, Ni, Pb, Zn | HQ/HI | HI > 1 for all sites both for children and adults, posing potential health risk; CR of Cd is higher compared to other metals in all sites, exceeding the USEPA threshold limit [141]. |
| Papua New Guinea | Ca, Mg, Mn | WQI | 14% of the samples have poor quality [142]. |
Appendix B
| Sampling Point Code | Barangay | Latitude (° N) | Longitude (° E) | Elevation |
|---|---|---|---|---|
| SJ-B01-DW1 | Bagong Sikat | 12.367 | 121.069 | 4.0 m |
| SJ-B04-DW2 | Barangay II Pob. | 12.353 | 121.066 | 7.0 m |
| SJ-B05-DW3 | Barangay III Pob. | 12.355 | 121.061 | 7.0 m |
| SJ-B05-DW3 | Barangay III Pob. | 12.358 | 121.068 | 1.0 m |
| SJ-B05-DW3 | Barangay III Pob. | 12.356 | 121.066 | 8.0 m |
| SJ-B06-DW4 | Barangay IV Pob. | 12.351 | 121.061 | 5.0 m |
| SJ-B08-DW5 | Barangay VI Pob. | 12.353 | 121.066 | 7.0 m |
| SJ-B11-DW6 | Batasan | 12.527 | 121.119 | 85.0 m |
| SJ-B12-DW7 | Bayotbot | 12.405 | 121.098 | 19.0 m |
| SJ-B13-DW8 | Bubog | 12.366 | 121.038 | 8.0 m |
| SJ-B13-DW8 | Bubog | 12.371 | 121.033 | 9.0 m |
| SJ-B14-DW9 | Buri | 12.223 | 121.094 | 163.0 m |
| SJ-C01-DW10 | Camburay | 12.427 | 121.097 | 26.0 m |
| SJ-C01-DW10 | Camburay | 12.429 | 121.097 | 28.0 m |
| SJ-C01-DW10 | Camburay | 12.430 | 121.095 | 28.0 m |
| SJ-C04-DW11 | Central | 12.434 | 121.048 | 20.0 m |
| SJ-C04-DW11 | Central | 12.457 | 121.041 | 27.0 m |
| SJ-C04-DW11 | Central | 12.449 | 121.032 | 18.0 m |
| SJ-I01-DW12 | Iling Proper | 12.245 | 121.088 | 144.0 m |
| SJ-I03-DW13 | Ipil | 12.253 | 121.091 | 17.0 m |
| SJ-L01-DW14 | La Curva | 12.410 | 121.016 | 6.0 m |
| SJ-L01-DW14 | La Curva | 12.403 | 121.071 | 13.0 m |
| SJ-L02-DW15 | Labangan Iling | 12.292 | 121.050 | 15.0 m |
| SJ-L03-DW16 | Labangan Poblacion | 12.355 | 121.069 | 8.0 m |
| SJ-L03-DW16 | Labangan Poblacion | 12.365 | 121.075 | 5.0 m |
| SJ-M01-DW17 | Mabini | 12.372 | 121.086 | 7.0 m |
| SJ-M01-DW17 | Mabini | 12.368 | 121.098 | 8.0 m |
| SJ-M02-DW18 | Magbay | 12.409 | 121.089 | 20.0 m |
| SJ-M03-DW19 | Mangarin | 12.360 | 121.102 | 7.0 m |
| SJ-M03-DW19 | Mangarin | 12.352 | 121.100 | 0.0 m |
| SJ-M03-DW19 | Mangarin | 12.352 | 121.099 | 7.0 m |
| SJ-M06-DW21 | Murtha | 12.471 | 121.117 | 47.0 m |
| SJ-M06-DW21 | Murtha | 12.436 | 121.108 | 25.0 m |
| SJ-M06-DW21 | Murtha | 12.440 | 121.103 | 28.0 m |
| SJ-M06-DW22 | Murtha | 12.457 | 121.118 | 36.0 m |
| SJ-N02-DW23 | Natandol | 12.184 | 121.106 | 55.0 m |
| SJ-P02-DW24 | Pawican | 12.171 | 121.119 | 99.0 m |
| SJ-S01-DW25 | San Agustin | 12.444 | 121.022 | 16.0 m |
| SJ-S02-DW26 | San Isidro | 12.417 | 121.057 | 13.0 m |
| SJ-S03-DW27 | San Roque | 12.358 | 121.051 | 4.0 m |
| SJ-A02-DW01 | Ansiray | 12.273 | 121.078 | 13.0 m |
| SJ-B01-DW02 | Bagong Sikat | 12.367 | 121.069 | 4.0 m |
| SJ-B02-DW03 | Bangkal | 12.224 | 121.049 | 5.0 m |
| SJ-B04-DW04 | Barangay II | 12.353 | 121.066 | 7.0 m |
| SJ-B05-DW05 | Barangay III | 12.356 | 121.066 | 8.0 m |
| SJ-B06-DW06 | Barangay IV Pob. | 12.351 | 121.061 | 5.0 m |
| SJ-B06-DW07 | Barangay VI Pob. | 12.353 | 121.066 | 7.0 m |
| SJ-B11-DW08 | Batasan | 12.527 | 121.118 | 71.0 m |
| SJ-B12-DW09 | Bayotbot | 12.405 | 121.098 | 19.0 m |
| SJ-B13-DW10 | Bubog | 12.366 | 121.039 | 9.0 m |
| SJ-C01-DW11 | Camburay | 12.429 | 121.097 | 28.0 m |
| SJ-C04-DW12 | Central | 12.433 | 121.048 | 16.0 m |
| SJ-C04-DW13 | Central | 12.457 | 121.041 | 27.0 m |
| SJ-I01-DW14 | Iling Proper | 12.253 | 121.034 | 20.0 m |
| SJ-I01-DW15 | Iling Proper | 12.248 | 121.036 | 26.0 m |
| SJ-I02-DW16 | Inasakan | 12.216 | 121.069 | 16.0 m |
| SJ-L01-DW17 | La Curva | 12.410 | 121.082 | 18.0 m |
| SJ-L01-DW18 | La Curva | 12.403 | 121.071 | 13.0 m |
| SJ-L02-DW19 | Labangan Iling | 12.290 | 121.049 | 52.0 m |
| SJ-L03-DW20 | Labangan Poblacion | 12.365 | 121.075 | 5.0 m |
| SJ-M01-DW21 | Mabini | 12.372 | 121.086 | 7.0 m |
| SJ-M01-DW22 | Mabini | 12.368 | 121.100 | 8.0 m |
| SJ-M02-DW23 | Magbay | 12.409 | 121.089 | 20.0 m |
| SJ-M03-DW24 | Mangarin | 12.360 | 121.102 | 7.0 m |
| SJ-M03-DW25 | Mangarin | 12.352 | 121.099 | 7.0 m |
| SJ-M05-DW26 | Monteclaro | 12.547 | 121.125 | 75.0 m |
| SJ-M06-DW27 | Murtha | 12.471 | 121.117 | 47.0 m |
| SJ-M06-DW28 | Murtha | 12.440 | 121.103 | 28.0 m |
| SJ-S01-DW29 | San Agustin | 12.444 | 121.023 | 16.0 m |
| SJ-S02-DW30 | San Isidro | 12.417 | 121.057 | 13.0 m |
| SJ-S03-DW31 | San Roque | 12.358 | 121.051 | 4.0 m |
| Sampling Point Code | Barangay | Latitude (° N) | Longitude (° E) | Elevation |
|---|---|---|---|---|
| SJ-B11-GW1 | Batasan | 12.527 | 121.119 | 85.0 m |
| SJ-B12-GW2 | Bayotbot | 12.405 | 121.098 | 19.0 m |
| SJ-B13-GW3 | Bubog | 12.365 | 121.038 | 8.0 m |
| SJ-B13-GW4 | Bubog | 12.266 | 121.038 | 48.0 m |
| SJ-B13-GW5 | Bubog | 12.371 | 121.033 | 9.0 m |
| SJ-B14-GW6 | Buri | 12.223 | 121.094 | 163.0 m |
| SJ-C01-GW7 | Camburay | 12.492 | 121.095 | 144.0 m |
| SJ-C04-GW8 | Central | 12.434 | 121.048 | 20.0 m |
| SJ-C04-GW9 | Central | 12.457 | 121.041 | 27.0 m |
| SJ-C04-GW10 | Central | 12.449 | 121.032 | 18.0 m |
| SJ-I01-GW11 | Iling Proper | 12.245 | 121.088 | 144.0 m |
| SJ-I03-GW12 | Ipil | 12.253 | 121.091 | 17.0 m |
| SJ-L01-GW13 | La Curva | 12.410 | 121.082 | 18.0 m |
| SJ-L01-GW14 | La Curva | 12.412 | 121.085 | 20.0 m |
| SJ-L01-GW15 | La Curva | 12.403 | 121.071 | 13.0 m |
| SJ-L02-GW16 | Labangan Iling | 12.292 | 121.050 | 15.0 m |
| SJ-L03-GW17 | Labangan Poblacion | 12.361 | 121.078 | 7.0 m |
| SJ-M01-GW18 | Mabini | 12.372 | 121.086 | 7.0 m |
| SJ-M01-GW19 | Mabini | 12.368 | 121.100 | 8.0 m |
| SJ-M02-GW20 | Magbay | 12.409 | 121.089 | 20.0 m |
| SJ-M03-GW21 | Mangarin | 12.360 | 121.102 | 7.0 m |
| SJ-M03-GW22 | Mangarin | 12.352 | 121.100 | 0.0 m |
| SJ-M03-GW23 | Mangarin | 12.352 | 121.099 | 7.0 m |
| SJ-M06-GW25 | Murtha | 12.471 | 121.117 | 47.0 m |
| SJ-M06-GW26 | Murtha | 12.436 | 121.108 | 25..0 m |
| SJ-M06-GW27 | Murtha | 12.440 | 121.103 | 28.0 m |
| SJ-M06-GW28 | Murtha | 12.445 | 121.105 | 31.0 m |
| SJ-N02-GW29 | Natandol | 12.184 | 121.106 | 55.0 m |
| SJ-P02-GW30 | Pawican | 12.171 | 121.119 | 99.0 m |
| SJ-S01-GW31 | San Agustin | 12.444 | 121.022 | 16.0 m |
| SJ-S02-GW32 | San Isidro | 12.417 | 121.057 | 13.0 m |
Appendix C


References
- Bhattacharya, S.; Das, S.; Das, S.; Kalashetty, M.; Warghat, S.R. An integrated approach for mapping groundwater potential applying geospatial and MIF techniques in the semiarid region. Environ. Dev. Sustain. 2021, 23, 495–510. [Google Scholar] [CrossRef]
- Kumar, V.; Parihar, R.D.; Sharma, A.; Bakshi, P.; Singh Sidhu, G.P.; Bali, A.S.; Karaouzas, I.; Bhardwaj, R.; Thukral, A.K.; Gyasi-Agyei, Y.; et al. Global Evaluation of Heavy Metal Content in Surface Water Bodies: A Meta-Analysis Using Heavy Metal Pollution Indices and Multivariate Statistical Analyses. Chemosphere 2019, 236, 124364. [Google Scholar] [CrossRef]
- Ukah, B.U.; Egbueri, J.C.; Unigwe, C.O.; Ubido, O.E. Extent of heavy metals pollution and health risk assessment of groundwater in a densely populated industrial area, Lagos, Nigeria. Int. J. Energy Water Resour. 2019, 3, 291–303. [Google Scholar] [CrossRef]
- Mirzabeygi, M.; Abbasnia, A.; Yunesian, M.; Nodehi, R.N.; Yousefi, N.; Hadi, M.; Mahvi, A.H. Heavy metal contamination and health risk assessment in drinking water of Sistan and Baluchistan, Southeastern Iran. Hum. Ecol. Risk Assess. Int. J. 2017, 23, 1893–1905. [Google Scholar] [CrossRef]
- Mohammadi, A.A.; Zarei, A.; Majidi, S.; Ghaderpoury, A.; Hashempour, Y.; Saghi, M.H.; Alinejad, A.; Yousefi, M.; Hosseingholizadeh, N.; Ghaderpoori, M. Carcinogenic and non-carcinogenic health risk assessment of heavy metals in drinking water of Khorramabad, Iran. MethodsX 2019, 6, 1642–1651. [Google Scholar] [CrossRef]
- Hoang, H.G.; Lin, C.; Tran, H.T.; Chiang, C.F.; Bui, X.T.; Cheruiyot, N.K.; Shern, C.C.; Lee, C.W. Heavy metal contamination trends in surface water and sediments of a river in a highly-industrialized region. Environ. Technol. Innov. 2020, 20, 101043. [Google Scholar] [CrossRef]
- Yeh, G.; Lin, C.; Nguyen, D.H.; Hoang, H.G.; Shern, J.C.; Hsiao, P.J. A five-year investigation of water quality and heavy metal mass flux of an industrially affected river. Environ. Sci. Pollut. Res. 2021, 29, 12465–12472. [Google Scholar] [CrossRef] [PubMed]
- Yousefi, M.; Ghalehaskar, S.; Asghari, F.B.; Ghaderpoury, A.; Dehghani, M.H.; Ghaderpoori, M.; Mohammadi, A.A. Distribution of fluoride contamination in drinking water resources and health risk assessment using geographic information system, northwest Iran. Regul. Toxicol. Pharmacol. 2019, 107, 104408. [Google Scholar] [CrossRef]
- Zhang, Y.; Xu, B.; Guo, Z.; Han, J.; Li, H.; Jin, L.; Chen, F.; Xiong, Y. Human health risk assessment of groundwater arsenic contamination in Jinghui irrigation district, China. J. Environ. Manag. 2019, 237, 163–169. [Google Scholar] [CrossRef]
- Peana, M.; Medici, S.; Dadar, M.; Zoroddu, M.A.; Pelucelli, A.; Chasapis, C.T.; Bjørklund, G. Environmental barium: Potential exposure and health-hazards. Arch. Toxicol. 2021, 95, 2605–2612. [Google Scholar] [CrossRef] [PubMed]
- Miah, M.R.; Ijomone, O.M.; Okoh, C.O.; Ijomone, O.K.; Akingbade, G.T.; Ke, T.; Krum, B.; da Cunha Martins, A., Jr.; Akinyemi, A.; Aranoff, N.; et al. The effects of manganese overexposure on brain health. Neurochem. Int. 2020, 135, 104688. [Google Scholar] [CrossRef]
- Grzeszczak, K.; Kwiatkowski, S.; Kosik-Bogacka, D. The role of Fe, Zn, and Cu in pregnancy. Biomolecules 2020, 10, 1176. [Google Scholar] [CrossRef]
- Long, X.; Liu, F.; Zhou, X.; Pi, J.; Yin, W.; Li, F.; Huang, S.; Ma, F. Estimation of spatial distribution and health risk by arsenic and heavy metals in shallow groundwater around Dongting Lake plain using GIS mapping. Chemosphere 2021, 269, 128698. [Google Scholar] [CrossRef] [PubMed]
- Mahapatra, S.R.; Venugopal, T.; Shanmugasundaram, A.; Giridharan, L.; Jayaprakash, M. Heavy metal index and geographical information system (GIS) approach to study heavy metal contamination: A case study of north Chennai groundwater. Appl. Water Sci. 2020, 10, 238. [Google Scholar] [CrossRef]
- Saleh, H.N.; Panahande, M.; Yousefi, M.; Asghari, F.B.; Oliveri Conti, G.; Talaee, E.; Mohammadi, A.A. Carcinogenic and non-carcinogenic risk assessment of heavy metals in groundwater wells in Neyshabur Plain, Iran. Biol. Trace Elem. Res. 2019, 190, 251–261. [Google Scholar] [CrossRef]
- Gad, M.; El-Safa, A.; Magda, M.; Farouk, M.; Hussein, H.; Alnemari, A.M.; Elsayed, S.; Khalifa, M.M.; Moghanm, F.S.; Eid, E.M.; et al. Integration of water quality indices and multivariate modeling for assessing surface water quality in Qaroun Lake, Egypt. Water 2021, 13, 2258. [Google Scholar] [CrossRef]
- Cüce, H.; Kalıpcı, E.; Ustaoğlu, F.; Kaynar, I.; Baser, V.; Türkmen, M. Multivariate statistical methods and GIS based evaluation of the health risk potential and water quality due to arsenic pollution in the Kızılırmak River. Int. J. Sediment Res. 2022, 37, 754–765. [Google Scholar]
- Yüksel, B.; Ustaoğlu, F.; Arica, E. Impacts of a garbage disposal facility on the water quality of çavuşlu stream in Giresun, Turkey: A health risk assessment study by a validated ICP-MS assay. Aquat. Sci. Eng. 2021, 36, 181–192. [Google Scholar] [CrossRef]
- Bushero, D.M.; Angello, Z.A.; Behailu, B.M. Evaluation of hydrochemistry and identification of pollution hotspots of little Akaki river using integrated water quality index and GIS. Environ. Chall. 2022, 8, 100587. [Google Scholar] [CrossRef]
- Nath, B.K.; Chaliha, C.; Bhuyan, B.; Kalita, E.; Baruah, D.C.; Bhagabati, A.K. GIS mapping-based impact assessment of groundwater contamination by arsenic and other heavy metal contaminants in the Brahmaputra River valley: A water quality assessment study. J. Clean. Prod. 2018, 201, 1001–1011. [Google Scholar] [CrossRef]
- San Jose, Province of Occidental Mindoro. Available online: https://www.philatlas.com/luzon/mimaropa/occidental-mindoro/san-jose.html (accessed on 14 January 2023).
- Municipality of San Jose, Province of Occidental Mindoro. Available online: https://www.occidentalmindoro.gov.ph/san-jose/ (accessed on 14 January 2023).
- Executive Summary of San Jose, Province of Occidental Mindoro. Available online: https://coa.gov.ph/download/5184/occidental-mindoro/71786/san-jose-executive-summary-2021-6.pdf (accessed on 14 January 2023).
- Climate Change-Responsive Integrated River Basin Management and Development Master Plans for the 8 Clustered River Basins. Available online: https://riverbasin.denr.gov.ph/masterplans/8Cluster%20Executive%20Summary/RBCOCluster3ExecutiveSummary.pdf (accessed on 14 January 2023).
- Municipal Planning and Development Office. Municipality of San Jose, Province of Occidental Mindoro—Comprehensive Land and Water Use Plan 2017–2030; Municipal Planning and Development Office: San Jose, Philippines, 2017; Volume 1.
- de Jesus, K.L.M.; Senoro, D.B.; Dela Cruz, J.C.; Chan, E.B. A Hybrid Neural Network–Particle Swarm Optimization Informed Spatial Interpolation Technique for Groundwater Quality Mapping in a Small Island Province of the Philippines. Toxics 2021, 9, 273. [Google Scholar] [CrossRef] [PubMed]
- Melquiades, F.L.; Appoloni, C. Application of XRF and field portable XRF for environmental analysis. J. Radioanal. Nucl. Chem. 2004, 262, 533–541. [Google Scholar] [CrossRef]
- Zhou, S.; Yuan, Z.; Cheng, Q.; Zhang, Z.; Yang, J. Rapid in situ determination of heavy metal concentrations in polluted water via portable XRF: Using Cu and Pb as example. Environ. Pollut. 2018, 243, 1325–1333. [Google Scholar] [CrossRef] [PubMed]
- Wu, C.M.; Tsai, H.T.; Yang, K.H.; Wen, J.C. How reliable is X-ray fluorescence (XRF) measurement for different metals in soil contamination? Environ. Forensics 2012, 13, 110–121. [Google Scholar] [CrossRef]
- Senoro, D.B.; de Jesus, K.L.M.; Nolos, R.C.; Lamac, M.R.L.; Deseo, K.M.; Tabelin, C.B. In Situ Measurements of Domestic Water Quality and Health Risks by Elevated Concentration of Heavy Metals and Metalloids Using Monte Carlo and MLGI Methods. Toxics 2022, 10, 342. [Google Scholar] [CrossRef]
- Senoro, D.B.; de Jesus, K.L.M.; Mendoza, L.C.; Apostol, E.M.D.; Escalona, K.S.; Chan, E.B. Groundwater quality monitoring using in-situ measurements and hybrid machine learning with empirical Bayesian kriging interpolation method. Appl. Sci. 2022, 12, 132. [Google Scholar] [CrossRef]
- Monjardin, C.E.F.; Senoro, D.B.; Magbanlac, J.J.M.; de Jesus, K.L.M.; Tabelin, C.B.; Natal, P.M. Geo-accumulation index of manganese in soils due to flooding in Boac and Mogpog Rivers, Marinduque, Philippines with mining disaster exposure. Appl. Sci. 2022, 12, 3527. [Google Scholar] [CrossRef]
- Wagh, V.M.; Panaskar, D.B.; Mukate, S.V.; Gaikwad, S.K.; Muley, A.A.; Varade, A.M. Health Risk Assessment of Heavy Metal Contamination in Groundwater of Kadava River Basin, Nashik, India. Model Earth Syst. Environ. 2018, 4, 969–980. [Google Scholar] [CrossRef]
- Kumar, S.; Toppo, S.; Kumar, A.; Tewari, G.; Beck, A.; Bachan, V.; Singh, T.B.N. Assessment of Heavy Metal Pollution in Groundwater of an Industrial Area: A Case Study from Ramgarh, Jharkhand, India. Int. J. Environ. Anal. Chem. 2020, 102, 7290–7312. [Google Scholar] [CrossRef]
- Abdel-Satar, A.M.; Ali, M.H.; Goher, M.E. Indices of water quality and metal pollution of Nile River, Egypt. Egypt. J. Aquat. Res. 2017, 43, 21–29. [Google Scholar] [CrossRef]
- Manan, T.S.B.A.; Beddu, S.; Kamal, N.L.M.; Mohamad, D.; Itam, Z.; Khan, T.; Machmudah, A.; Dutykh, D.; Mohtar, W.H.M.W.; Jusoh, H.; et al. Ecological Risk Indicators for Leached Heavy Metals from Coal Ash Generated at a Malaysian Power Plant. Sustainability 2021, 13, 10222. [Google Scholar] [CrossRef]
- Hoang, H.G.; Lin, C.; Chiang, C.F.; Bui, X.T.; Lukkhasorn, W.; Bui, T.P.T.; Tran, H.T.; Vo, T.D.H.; Le, V.G.; Nghiem, L.D. The individual and synergistic indexes for assessments of heavy metal contamination in global rivers and risk: A review. Curr. Pollut. Rep. 2021, 7, 247–262. [Google Scholar] [CrossRef]
- Senoro, D.B.; Monjardin, C.E.F.; Fetalvero, E.G.; Benjamin, Z.E.C.; Gorospe, A.F.B.; de Jesus, K.L.M.; Ical, M.L.G.; Wong, J.P. Quantitative Assessment and Spatial Analysis of Metals and Metalloids in Soil Using the Geo-Accumulation Index in the Capital Town of Romblon Province, Philippines. Toxics 2022, 10, 633. [Google Scholar] [CrossRef]
- de Jesus, K.L.M.; Senoro, D.B.; Natal, P.; Bonifacio, P. Groundwater Heavy Metal Contamination and Pollution Index in Marinduque Island, Philippines using Empirical Bayesian Kriging Method. J. Mech. Eng. 2021, 10, 119–141. [Google Scholar]
- Eslami, H.; Esmaeili, A.; Razaeian, M.; Salari, M.; Hosseini, A.N.; Mobini, M.; Barani, A. Potentially Toxic Metal Concentration, Spatial Distribution, and Health Risk Assessment in Drinking Groundwater Resources of Southeast Iran. Geosci. Front. 2022, 13, 101276. [Google Scholar] [CrossRef]
- Wu, B.; Zhao, D.Y.; Jia, H.Y.; Zhang, Y.; Zhang, X.X.; Cheng, S.P. Preliminary Risk Assessment of Trace Metal Pollution in Surface Water from Yangtze River in Nanjing Section, China. Bull. Environ. Contam. Toxicol. 2009, 82, 405–409. [Google Scholar] [CrossRef]
- Bortey-Sam, N.; Nakayama, S.M.M.; Ikenaka, Y.; Akoto, O.; Baidoo, E.; Mizukawa, H.; Ishizuka, M. Health Risk Assessment of Heavy Metals and Metalloid in Drinking Water from Communities near Gold Mines in Tarkwa, Ghana. Environ. Monit. Assess. 2015, 187, 397. [Google Scholar] [CrossRef] [PubMed]
- Maleki, A.; Jari, H. Evaluation of Drinking Water Quality and Non-Carcinogenic and Carcinogenic Risk Assessment of Heavy Metals in Rural Areas of Kurdistan, Iran. Environ. Technol. Innov. 2021, 23, 101668. [Google Scholar] [CrossRef]
- Wongsasuluk, P.; Chotpantarat, S.; Siriwong, W.; Robson, M. Heavy Metal Contamination and Human Health Risk Assessment in Drinking Water from Shallow Groundwater Wells in an Agricultural Area in Ubon Ratchathani Province, Thailand. Environ. Geochem. Health 2014, 36, 169–182. [Google Scholar] [CrossRef]
- Karim, Z. Risk Assessment of Dissolved Trace Metals in Drinking Water of Karachi, Pakistan. Bull. Environ. Contam. Toxicol. 2011, 86, 676–678. [Google Scholar] [CrossRef]
- Antoine, J.M.R.; Fung, L.A.H.; Grant, C.N. Assessment of the Potential Health Risks Associated with the Aluminium, Arsenic, Cadmium and Lead Content in Selected Fruits and Vegetables Grown in Jamaica. Toxicol. Rep. 2017, 4, 181–187. [Google Scholar] [CrossRef] [PubMed]
- Oskarsson, A. Barium. In Handbook on the Toxicology of Metals; Elsevier: Amsterdam, The Netherlands, 2022; pp. 91–100. [Google Scholar]
- Ahmad, W.; Alharthy, R.D.; Zubair, M.; Ahmed, M.; Hameed, A.; Rafique, S. Toxic and Heavy Metals Contamination Assessment in Soil and Water to Evaluate Human Health Risk. Sci. Rep. 2021, 11, 17006. [Google Scholar] [CrossRef] [PubMed]
- Mishra, P.; Pandey, C.M.; Singh, U.; Gupta, A.; Sahu, C.; Keshri, A. Descriptive statistics and normality tests for statistical data. Ann. Card. Anaesth. 2019, 22, 67. [Google Scholar] [PubMed]
- Monjardin, C.E.F.; de Jesus, K.L.M.; Claro, K.S.E.; Paz, D.A.M.; Aguilar, K.L. Projection of water demand and sensitivity analysis of predictors affecting household usage in urban areas using artificial neural network. In Proceedings of the 2020 IEEE 12th International Conference on Humanoid, Nanotechnology, Information Technology, Communication and Control, Environment, and Management (HNICEM), New York, NY, USA, 3–7 December 2020; pp. 1–6. [Google Scholar]
- De Jesus, K.L.M.; Senoro, D.B.; Dela Cruz, J.C.; Chan, E.B. Neuro-particle swarm optimization based in-situ prediction model for heavy metals concentration in groundwater and surface water. Toxics 2022, 10, 95. [Google Scholar] [CrossRef]
- Khalid, S.; Shahid, M.; Shah, A.H.; Saeed, F.; Ali, M.; Qaisrani, S.A.; Dumat, C. Heavy metal contamination and exposure risk assessment via drinking groundwater in Vehari, Pakistan. Environ. Sci. Pollut. Res. 2020, 27, 39852–39864. [Google Scholar] [CrossRef]
- Schober, P.; Boer, C.; Schwarte, L.A. Correlation coefficients: Appropriate use and interpretation. Anesth. Analg. 2018, 126, 1763–1768. [Google Scholar] [CrossRef]
- Egbueri, J.C. Groundwater Quality Assessment Using Pollution Index of Groundwater (PIG), Ecological Risk Index (ERI) and Hierarchical Cluster Analysis (HCA): A Case Study. Groundw. Sustain. Dev. 2020, 10, 100292. [Google Scholar] [CrossRef]
- Ghosh, G.C.; Khan, J.H.; Chakraborty, T.K.; Zaman, S.; Kabir, A.H.M.E.; Tanaka, H. Human Health Risk Assessment of Elevated and Variable Iron and Manganese Intake with Arsenic-Safe Groundwater in Jashore, Bangladesh. Sci. Rep. 2020, 10, 5206. [Google Scholar] [CrossRef]
- Sharma, N.; Sodhi, K.K.; Kumar, M.; Singh, D.K. (2021). Heavy metal pollution: Insights into chromium eco-toxicity and recent advancement in its remediation. Environ. Nanotechnol. Monit. Manag. 2021, 15, 100388. [Google Scholar]
- Garcia, A.J.; Okeagu, C.N.; Kaye, A.D.; Abd-Elsayed, A. Metabolism, Pathophysiology, and Clinical Considerations of Iron Overload, a Comprehensive Review. Essent. Blood Prod. Manag. Anesth. Pract. 2021, 289–299. [Google Scholar] [CrossRef]
- Das, K.K.; Reddy, R.C.; Bagoji, I.B.; Das, S.; Bagali, S.; Mullur, L.; Khodnapur, J.P.; Biradar, M.S. Primary concept of nickel toxicity—An overview. J. Basic Clin. Physiol. Pharmacol. 2019, 30, 141–152. [Google Scholar] [CrossRef] [PubMed]
- Sachdeva, C.; Thakur, K.; Sharma, A.; Sharma, K.K. Lead: Tiny but mighty poison. Indian J. Clin. Biochem. 2018, 33, 132–146. [Google Scholar] [CrossRef]
- Kianoush, S.; Balali-Mood, M.; Mousavi, S.R.; Shakeri, M.T.; Dadpour, B.; Moradi, V.; Sadeghi, M. Clinical, toxicological, biochemical, and hematologic parameters in lead exposed workers of a car battery industry. Iranian J. Med. Sci. 2013, 38, 30. [Google Scholar]
- Liu, B.; Lv, L.; An, M.; Wang, T.; Li, M.; Yu, Y. Heavy Metals in Marine Food Web from Laizhou Bay, China: Levels, Trophic Magnification, and Health Risk Assessment. Sci. Total Environ. 2022, 841, 156818. [Google Scholar] [CrossRef]
- Alfaifi, H.; El-Sorogy, A.S.; Qaysi, S.; Kahal, A.; Almadani, S.; Alshehri, F.; Zaidi, F.K. Evaluation of heavy metal contamination and groundwater quality along the Red Sea coast, southern Saudi Arabia. Mar. Pollut. Bull. 2021, 163, 111975. [Google Scholar] [CrossRef]
- Sajil Kumar, P.J.; Davis Delson, P.; Thomas Babu, P. Appraisal of heavy metals in groundwater in Chennai city using a HPI model. Bull. Environ. Contam. Toxicol. 2012, 89, 793–798. [Google Scholar] [CrossRef]
- Xu, S.; Li, S.L.; Yue, F.; Udeshani, C.; Chandrajith, R. Natural and anthropogenic controls of groundwater quality in Sri Lanka: Implications for chronic kidney disease of unknown etiology (CKDu). Water 2021, 13, 2724. [Google Scholar] [CrossRef]
- Snousy, M.G.; Morsi, M.S.; Elewa, A.M.; Ahmed, S.A.E.F.; El-Sayed, E. Groundwater vulnerability and trace element dispersion in the Quaternary aquifers along middle Upper Egypt. Environ. Monit. Assess. 2020, 192, 174. [Google Scholar] [CrossRef]
- Sako, A.; Bamba, O.; Gordio, A. Hydrogeochemical processes controlling groundwater quality around Bomboré gold mineralized zone, Central Burkina Faso. J. Geochem. Explor. 2016, 170, 58–71. [Google Scholar] [CrossRef]
- Vasileiou, E.; Papazotos, P.; Dimitrakopoulos, D.; Perraki, M. Expounding the origin of chromium in groundwater of the Sarigkiol basin, Western Macedonia, Greece: A cohesive statistical approach and hydrochemical study. Environ. Monit. Assess. 2019, 191, 509. [Google Scholar] [CrossRef]
- Rezaei, A.; Hassani, H.; Jabbari, N. Evaluation of groundwater quality and assessment of pollution indices for heavy metals in North of Isfahan Province, Iran. Sustain. Water Resour. Manag. 2019, 5, 491–512. [Google Scholar] [CrossRef]
- Çelebi, A.; Şengörür, B.; Kløve, B. Seasonal and spatial variations of metals in Melen Watershed Groundwater, Turkey. CLEAN–Soil Air Water 2015, 43, 739–745. [Google Scholar] [CrossRef]
- Atangana, E.; Oberholster, P.J. Using heavy metal pollution indices to assess water quality of surface and groundwater on catchment levels in South Africa. J. Afr. Earth Sci. 2021, 182, 104254. [Google Scholar] [CrossRef]
- Esmaeili, S.; Asghari Moghaddam, A.; Barzegar, R.; Tziritis, E. Multivariate statistics and hydrogeochemical modeling for source identification of major elements and heavy metals in the groundwater of Qareh-Ziaeddin plain, NW Iran. Arab. J. Geosci. 2018, 11, 5. [Google Scholar] [CrossRef]
- Duggal, V.; Rani, A.; Mehra, R.; Balaram, V. Risk assessment of metals from groundwater in northeast Rajasthan. J. Geol. Soc. India 2017, 90, 77–84. [Google Scholar] [CrossRef]
- Varghese, J.; Jaya, D.S. Metal pollution of groundwater in the vicinity of Valiathura sewage farm in Kerala, South India. Bull. Environ. Contam. Toxicol. 2014, 93, 694–698. [Google Scholar] [CrossRef] [PubMed]
- Karthikeyan1, S.; Arumugam, S.; Muthumanickam, J.; Kulandaisamy, P.; Subramanian, M.; Annadurai, R.; Senapathi, V.; Sekar, S. Causes of heavy metal contamination in groundwater of Tuticorin industrial block, Tamil Nadu, India. Environ. Sci. Pollut. Res. 2021, 28, 18651–18666. [Google Scholar] [CrossRef] [PubMed]
- Hoang, H.G.; Chiang, C.F.; Lin, C.; Wu, C.Y.; Lee, C.W.; Cheruiyot, N.K.; Tran, H.T.; Bui, X.T. Human health risk simulation and assessment of heavy metal contamination in a river affected by industrial activities. Environ. Pollut. 2021, 285, 117414. [Google Scholar] [CrossRef]
- Khairudin, K.; Abu Bakar, N.F.; Ul-Saufie, A.Z.; Abd Wahid, M.Z.A.; Yahaya, M.A.; Mazlan, M.F.; Pin, Y.S.; Osman, M.S. Unravelling Anthropogenic Sources in Kereh River, Malaysia: Analysis of Decadal Spatial-Temporal Evolutions by Employing Multivariate Techniques. Case Stud. Chem. Environ. Eng. 2022, 6, 100271. [Google Scholar] [CrossRef]
- Topal, M.; Arslan Topal, E.I.; Öbek, E. Investigation of Potential Health Risks in Terms of Arsenic in Grapevine Exposed to Gallery Waters of an Abandoned Mining Area in Turkey. Environ. Technol. Innov. 2020, 20, 101058. [Google Scholar] [CrossRef]
- Yang, X.; Duan, J.; Wang, L.; Li, W.; Guan, J.; Beecham, S.; Mulcahy, D. Heavy Metal Pollution and Health Risk Assessment in the Wei River in China. Environ. Monit. Assess. 2015, 187, 111. [Google Scholar] [CrossRef] [PubMed]
- Rahaman, M.S.; Rahman, M.M.; Mise, N.; Sikder, M.T.; Ichihara, G.; Uddin, M.K.; Kurasaki, M.; Ichihara, S. Environmental arsenic exposure and its contribution to human diseases, toxicity mechanism and management. Environ. Pollut. 2021, 289, 117940. [Google Scholar] [CrossRef] [PubMed]
- Izah, S.C.; Inyang, I.R.; Angaye, T.C.; Okowa, I.P. A review of heavy metal concentration and potential health implications of beverages consumed in Nigeria. Toxics 2016, 5, 1. [Google Scholar] [CrossRef]
- Briffa, J.; Sinagra, E.; Blundell, R. Heavy metal pollution in the environment and their toxicological effects on humans. Heliyon 2020, 6, e04691. [Google Scholar] [CrossRef] [PubMed]
- Nickel, W.N.; Steelman, T.J.; Sabath, Z.R.; Potter, B.K. Extra-articular retained missiles; is surveillance of lead levels needed? Mil. Med. 2018, 183, e107–e113. [Google Scholar] [CrossRef]
- Vahidinia, A.; Samiee, F.; Faradmal, J.; Rahmani, A.; Taravati Javad, M.; Leili, M. Mercury, lead, cadmium, and barium levels in human breast milk and factors affecting their concentrations in Hamadan, Iran. Biol. Trace Elem. Res. 2019, 187, 32–40. [Google Scholar] [CrossRef] [PubMed]
- Su, J.F.; Le, D.P.; Liu, C.H.; Lin, J.D.; Xiao, X.J. Critical care management of patients with barium poisoning: A case series. Chin. Med. J. 2020, 133, 724–725. [Google Scholar] [CrossRef]
- Bhoelan, B.S.; Stevering, C.H.; Van Der Boog, A.T.J.; Van der Heyden, M.A.G. Barium toxicity and the role of the potassium inward rectifier current. Clin. Toxicol. 2014, 52, 584–593. [Google Scholar] [CrossRef]
- Yang, F.; Massey, I.Y. Exposure routes and health effects of heavy metals on children. Biometals 2019, 32, 563–573. [Google Scholar]
- Chittick, E.A.; Srebotnjak, T. An analysis of chemicals and other constituents found in produced water from hydraulically fractured wells in California and the challenges for wastewater management. J. Environ. Manag. 2017, 204, 502–509. [Google Scholar] [CrossRef]
- Yuen, H.W.; Becker, W. Iron Toxicity. In StatPearls; StatPearls Publishing: Treasure Island, FL, USA, 2022. [Google Scholar]
- Alharbi, O.A.; Loni, O.A.; Zaidi, F.K. Hydrochemical assessment of groundwater from shallow aquifers in parts of Wadi Al Hamad, Madinah, Saudi Arabia. Arab. J. Geosci. 2017, 10, 35. [Google Scholar] [CrossRef]
- Rehabilitation/Improvement of Mindoro East Coast Road Project. Available online: https://documents1.worldbank.org/curated/en/709531468095354137/pdf/E14670v50EAP1EA1P079935.pdf (accessed on 11 January 2023).
- Chotpantarat, S.; Thamrongsrisakul, J. Natural and anthropogenic factors influencing hydrochemical characteristics and heavy metals in groundwater surrounding a gold mine, Thailand. J. Asian Earth Sci. 2021, 211, 104692. [Google Scholar] [CrossRef]
- People Using Safely Managed Drinking Water Services (% of population)—Philippines. Available online: https://data.worldbank.org/indicator/SH.H2O.SMDW.ZS?locations=PH (accessed on 7 February 2023).
- Chen, X.; Chen, W. GIS-based landslide susceptibility assessment using optimized hybrid machine learning methods. Catena 2021, 196, 104833. [Google Scholar] [CrossRef]
- Bui, D.T.; Van Le, H.; Hoang, N.D. GIS-based spatial prediction of tropical forest fire danger using a new hybrid machine learning method. Ecol. Inform. 2018, 48, 104–116. [Google Scholar]
- Fanos, A.M.; Pradhan, B.; Mansor, S.; Yusoff, Z.M.; Abdullah, A.F.B. A hybrid model using machine learning methods and GIS for potential rockfall source identification from airborne laser scanning data. Landslides 2018, 15, 1833–1850. [Google Scholar] [CrossRef]
- Pham, B.T.; Prakash, I.; Bui, D.T. Spatial prediction of landslides using a hybrid machine learning approach based on random subspace and classification and regression trees. Geomorphology 2018, 303, 256–270. [Google Scholar] [CrossRef]
- Bui, D.T.; Hoang, N.D.; Nguyen, H.; Tran, X.L. Spatial prediction of shallow landslide using Bat algorithm optimized machine learning approach: A case study in Lang Son Province, Vietnam. Adv. Eng. Inform. 2019, 42, 100978. [Google Scholar]
- Al-Ruzouq, R.; Shanableh, A.; Yilmaz, A.G.; Idris, A.; Mukherjee, S.; Khalil, M.A.; Gibril, M.B.A. Dam site suitability mapping and analysis using an integrated GIS and machine learning approach. Water 2019, 11, 1880. [Google Scholar] [CrossRef]
- Rahman, M.; Islam, M.; Bodrud-Doza, M.; Muhib, M.; Zahid, A.; Shammi, M.; Tareq, S.M.; Kurasaki, M. Spatio-temporal assessment of groundwater quality and human health risk: A case study in Gopalganj, Bangladesh. Expo. Health 2018, 10, 167–188. [Google Scholar] [CrossRef]
- Phan, K.; Phan, S.; Huoy, L.; Suy, B.; Wong, M.H.; Hashim, J.H.; Yasin, M.S.M.; Aljunid, S.M.; Sthiannopkao, S.; Kim, K.W. Assessing mixed trace elements in groundwater and their health risk of residents living in the Mekong River basin of Cambodia. Environ. Pollut. 2013, 182, 111–119. [Google Scholar] [CrossRef]
- Wang, L.; Li, P.; Duan, R.; He, X. Occurrence, controlling factors and health risks of Cr6+ in groundwater in the Guanzhong Basin of China. Expo. Health 2022, 14, 239–251. [Google Scholar] [CrossRef]
- Ravindra, K.; Mor, S. Distribution and health risk assessment of arsenic and selected heavy metals in Groundwater of Chandigarh, India. Environ. Pollut. 2019, 250, 820–830. [Google Scholar] [CrossRef] [PubMed]
- Shams, M.; Tavakkoli Nezhad, N.; Dehghan, A.; Alidadi, H.; Paydar, M.; Mohammadi, A.A.; Zarei, A. Heavy metals exposure, carcinogenic and non-carcinogenic human health risks assessment of groundwater around mines in Joghatai, Iran. Int. J. Environ. Anal. Chem. 2022, 102, 1884–1899. [Google Scholar] [CrossRef]
- Al-Jumaily, H.A.; Mohammad, O.A.; Rasheed, B.R. Health Risk Assessment of Heavy Metals in Ground and Tap Water of Chamchamal City-Sulaymaniyah Governorate/Kurdistan Region, Iraq. Tikrit J. Pure Sci. 2020, 25, 62–70. [Google Scholar]
- Al-Hwaiti, M.S.; Brumsack, H.J.; Schnetger, B. Heavy metal contamination and health risk assessment in waste mine water dewatering using phosphate beneficiation processes in Jordan. Environ. Earth Sci. 2018, 77, 661. [Google Scholar] [CrossRef]
- Zhang, W.; Ma, L.; Abuduwaili, J.; Ge, Y.; Issanova, G.; Saparov, G. Distribution characteristics and assessment of heavy metals in the surface water of the Syr Darya River, Kazakhstan. Pol. J. Environ. Stud. 2020, 29, 979–988. [Google Scholar] [CrossRef]
- Lim, H.S.; Lee, J.S.; Chon, H.T.; Sager, M. Heavy metal contamination and health risk assessment in the vicinity of the abandoned Songcheon Au–Ag mine in Korea. J. Geochem. Explor. 2008, 96, 223–230. [Google Scholar] [CrossRef]
- Li, Y.; Ma, L.; Abuduwaili, J.; Li, Y. Spatiotemporal distributions of fluoride and arsenic in rivers with the role of mining industry and related human health risk assessments in Kyrgyzstan. Expo. Health 2022, 14, 49–62. [Google Scholar] [CrossRef]
- Chanpiwat, P.; Lee, B.T.; Kim, K.W.; Sthiannopkao, S. Human health risk assessment for ingestion exposure to groundwater contaminated by naturally occurring mixtures of toxic heavy metals in the Lao PDR. Environ. Monit. Assess. 2014, 186, 4905–4923. [Google Scholar] [CrossRef]
- Kusin, F.M.; Rahman, M.S.A.; Madzin, Z.; Jusop, S.; Mohamat-Yusuff, F.; Ariffin, M. The occurrence and potential ecological risk assessment of bauxite mine-impacted water and sediments in Kuantan, Pahang, Malaysia. Environ. Sci. Pollut. Res. 2017, 24, 1306–1321. [Google Scholar] [CrossRef]
- Tripathee, L.; Kang, S.; Sharma, C.M.; Rupakheti, D.; Paudyal, R.; Huang, J.; Sillanpää, M. Preliminary health risk assessment of potentially toxic metals in surface water of the Himalayan Rivers, Nepal. Bull. Environ. Contam. Toxicol. 2016, 97, 855–862. [Google Scholar] [CrossRef] [PubMed]
- Abeer, N.; Khan, S.A.; Muhammad, S.; Rasool, A.; Ahmad, I. Health risk assessment and provenance of arsenic and heavy metal in drinking water in Islamabad, Pakistan. Environ. Technol. Innov. 2020, 20, 101171. [Google Scholar] [CrossRef]
- Rajmohan, N.; Niyazi, B.A.; Masoud, M.H. Trace metals pollution, distribution and associated health risks in the arid coastal aquifer, Hada Al-Sham and its vicinities, Saudi Arabia. Chemosphere 2022, 297, 134246. [Google Scholar] [CrossRef]
- Nilkarnjanakul, W.; Watchalayann, P.; Chotpantarat, S. Spatial distribution and health risk assessment of As and Pb contamination in the groundwater of Rayong Province, Thailand. Environ. Res. 2022, 204, 111838. [Google Scholar] [CrossRef] [PubMed]
- Mahmoud, M.T.; Hamouda, M.A.; Al Kendi, R.R.; Mohamed, M.M. Health risk assessment of household drinking water in a district in the UAE. Water 2018, 10, 1726. [Google Scholar] [CrossRef]
- Bui Huy, T.; Tuyet-Hanh, T.T.; Johnston, R.; Nguyen-Viet, H. Assessing health risk due to exposure to arsenic in drinking water in Hanam Province, Vietnam. Int. J. Environ. Res. Public Health 2014, 11, 7575–7591. [Google Scholar]
- Benhaddya, M.L.; Halis, Y.; Hamdi-Aïssa, B. Assessment of heavy metals pollution in surface and groundwater systems in Oued Righ region (Algeria) using pollution indices and multivariate statistical techniques. Afr. J. Aquat. Sci. 2020, 45, 269–284. [Google Scholar] [CrossRef]
- Boum-Nkot, S.N.; Nlend, B.; Komba, D.; Ndondo, G.N.; Bello, M.; Fongoh, E.J.; Ntamak-Nida, M.J.; Etame, J. Hydrochemistry and assessment of heavy metal groundwater contamination in an industrialized city of sub-Saharan Africa (Douala, Cameroon). Implication on human health. HydroResearch 2023, 6, 52–64. [Google Scholar] [CrossRef]
- Seleem, E.M.; Mostafa, A.; Mokhtar, M.; Salman, S.A. Risk assessment of heavy metals in drinking water on the human health, Assiut City, and its environs, Egypt. Arab. J. Geosci. 2021, 14, 427. [Google Scholar] [CrossRef]
- Endale, Y.T.; Ambelu, A.; Mees, B.; Du Laing, G. Exposure and health risk assessment from consumption of Pb contaminated water in Addis Ababa, Ethiopia. Heliyon 2021, 7, e07946. [Google Scholar] [CrossRef]
- Opoku, P.A.; Anornu, G.K.; Gibrilla, A.; Owusu-Ansah, E.D.G.J.; Ganyaglo, S.Y.; Egbi, C.D. Spatial distributions and probabilistic risk assessment of exposure to heavy metals in groundwater in a peri-urban settlement: Case study of Atonsu-Kumasi, Ghana. Groundw. Sustain. Dev. 2020, 10, 100327. [Google Scholar] [CrossRef]
- Nyambura, C.; Hashim, N.O.; Chege, M.W.; Tokonami, S.; Omonya, F.W. Cancer and non-cancer health risks from carcinogenic heavy metal exposures in underground water from Kilimambogo, Kenya. Groundw. Sustain. Dev. 2020, 10, 100315. [Google Scholar] [CrossRef]
- Nshimiyimana, F.X.; Faciu, M.E.; El Blidi, S.; El Abidi, A.; Soulaymani, A.; Fekhaoui, M.; Lazar, G. Seasonal influence and risk assessment of heavy metals contamination in groundwater, Arjaat village, Morocco. Environ. Eng. Manag. J. 2016, 15, 579–587. [Google Scholar]
- Ricolfi, L.; Barbieri, M.; Muteto, P.V.; Nigro, A.; Sappa, G.; Vitale, S. Potential toxic elements in groundwater and their health risk assessment in drinking water of Limpopo National Park, Gaza Province, Southern Mozambique. Environ. Geochem. Health 2020, 42, 2733–2745. [Google Scholar] [CrossRef]
- Peleka, J.C.M.; Diop, C.; Foko, R.F.; Daffe, M.L.; Fall, M. Health risk assessment of trace metals in drinking water consumed in Dakar, Senegal. J. Water Resour. Prot. 2021, 13, 915–930. [Google Scholar] [CrossRef]
- Elumalai, V.; Brindha, K.; Lakshmanan, E. Human exposure risk assessment due to heavy metals in groundwater by pollution index and multivariate statistical methods: A case study from South Africa. Water 2017, 9, 234. [Google Scholar] [CrossRef]
- Idriss, I.E.; Abdel-Azim, M.; Karar, K.I.; Osman, S.; Idris, A.M. Isotopic and chemical facies for assessing the shallow water table aquifer quality in Goly Region, White Nile State, Sudan: Focusing on nitrate source apportionment and human health risk. Toxin Rev. 2021, 40, 764–776. [Google Scholar] [CrossRef]
- Ceballos, E.; Dubny, S.; Othax, N.; Zabala, M.E.; Peluso, F. Assessment of human health risk of chromium and nitrate pollution in groundwater and soil of the Matanza-Riachuelo River Basin, Argentina. Expo. Health 2021, 13, 323–336. [Google Scholar] [CrossRef]
- Rupias, O.J.B.; Pereira, S.Y.; de Abreu, A.E.S. Hydrogeochemistry and groundwater quality assessment using the water quality index and heavy-metal pollution index in the alluvial plain of Atibaia river-Campinas/SP, Brazil. Groundw. Sustain. Dev. 2021, 15, 100661. [Google Scholar] [CrossRef]
- Cipriani-Avila, I.; Molinero, J.; Jara-Negrete, E.; Barrado, M.; Arcos, C.; Mafla, S.; Custode, F.; Vilaña, G.; Carpintero, N.; Ochoa-Herrera, V. Heavy metal assessment in drinking waters of Ecuador: Quito, Ibarra and Guayaquil. J. Water Health 2020, 18, 1050–1064. [Google Scholar] [CrossRef]
- Fernández-Macias, J.C.; Ochoa-Martínez, Á.C.; Orta-García, S.T.; Varela-Silva, J.A.; Pérez-Maldonado, I.N. Probabilistic human health risk assessment associated with fluoride and arsenic co-occurrence in drinking water from the metropolitan area of San Luis Potosí, Mexico. Environ. Monit. Assess. 2020, 192, 712. [Google Scholar] [CrossRef] [PubMed]
- Avigliano, E.; Clavijo, C.; Scarabotti, P.; Sánchez, S.; Vegh, S.L.; del Rosso, F.R.; Caffetti, J.D.; Facetti, J.F.; Domanico, A.; Volpedo, A.V. Exposure to 19 elements via water ingestion and dermal contact in several South American environments (La Plata Basin): From Andes and Atlantic Forest to sea front. Microchem. J. 2019, 149, 103986. [Google Scholar] [CrossRef]
- Ccanccapa-Cartagena, A.; Paredes, B.; Vera, C.; Chavez-Gonzales, F.D.; Olson, E.J.; Welp, L.R.; Zyaykina, N.N.; Filley, T.R.; Warsinger, D.M.; Jafvert, C.T. Occurrence and probabilistic health risk assessment (PRA) of dissolved metals in surface water sources in Southern Peru. Environ. Adv. 2021, 5, 100102. [Google Scholar] [CrossRef]
- Podlasek, A.; Jakimiuk, A.; Vaverková, M.D.; Koda, E. Monitoring and assessment of groundwater quality at landfill sites: Selected case studies of Poland and the Czech Republic. Sustainability 2021, 13, 7769. [Google Scholar] [CrossRef]
- Kelepertzis, E. Investigating the sources and potential health risks of environmental contaminants in the soils and drinking waters from the rural clusters in Thiva area (Greece). Ecotoxicol. Environ. Saf. 2014, 100, 258–265. [Google Scholar] [CrossRef]
- Tiwari, A.K.; De Maio, M.; Amanzio, G. Evaluation of metal contamination in the groundwater of the Aosta Valley Region, Italy. Int. J. Environ. Res. 2017, 11, 291–300. [Google Scholar] [CrossRef]
- Dąbrowska, D.; Witkowski, A.J. Groundwater and Human Health Risk Assessment in the Vicinity of a Municipal Waste Landfill in Tychy, Poland. Appl. Sci. 2022, 12, 12898. [Google Scholar] [CrossRef]
- Dippong, T.; Hoaghia, M.A.; Mihali, C.; Cical, E.; Calugaru, M. Human health risk assessment of some bottled waters from Romania. Environ. Pollut. 2020, 267, 115409. [Google Scholar] [CrossRef]
- Ulniković, V.P.; Kurilić, S.M. Heavy metal and metalloid contamination and health risk assessment in spring water on the territory of Belgrade City, Serbia. Environ. Geochem. Health 2020, 42, 3731–3751. [Google Scholar] [CrossRef]
- Dippong, T.; Resz, M.A. Quality and Health Risk Assessment of Groundwaters in the Protected Area of Tisa River Basin. Int. J. Environ. Res. Public Health 2022, 19, 14898. [Google Scholar] [CrossRef]
- Kumar, S.; Islam, A.R.M.T.; Islam, H.T.; Hasanuzzaman, M.; Ongoma, V.; Khan, R.; Mallick, J. Water resources pollution associated with risks of heavy metals from Vatukoula Goldmine region, Fiji. J. Environ. Manag. 2021, 293, 112868. [Google Scholar] [CrossRef] [PubMed]
- Doaemo, W.; Betasolo, M.; Montenegro, J.F.; Pizzigoni, S.; Kvashuk, A.; Femeena, P.V.; Mohan, M. Evaluating the Impacts of Environmental and Anthropogenic Factors on Water Quality in the Bumbu River Watershed, Papua New Guinea. Water 2023, 15, 489. [Google Scholar] [CrossRef]


| Name of Watershed | Barangays Covered | Area (km2) |
|---|---|---|
| Busuanga | Batasan, Camburay, Central, Monteclaro, Murtha, and San Agustin | 199.96 |
| Cabariwan | Bayotbot, Labangan Poblacion, Mabini, Mangarin, Mapaya, Natandol, and Pawican | 47.34 |
| Caguray | Batasan, Bayotbot, Mapaya, Monteclaro, and Murtha | 52.39 |
| Labangan | All barangays except Mapaya | 242.92 |
| As | Ba | Cu | Cr | Fe | Pb | Mn | Ni | |
|---|---|---|---|---|---|---|---|---|
| N | 71.000 | 71.000 | 71.000 | 71.000 | 71.000 | 71.000 | 71.000 | 71.000 |
| Max | 6.680 | 0.050 | 0.800 | 0.890 | 1.820 | 15.160 | 0.020 | 0.720 |
| Min | 0.000 | 0.000 | 0.000 | 0.000 | 0.000 | 0.000 | 0.000 | 0.000 |
| Mean | 0.792 | 0.024 | 0.093 | 0.110 | 0.138 | 1.152 | 0.003 | 0.045 |
| SD | 1.762 | 0.016 | 0.157 | 0.225 | 0.279 | 3.302 | 0.004 | 0.152 |
| Skewness | 2.228 | −0.629 | 2.493 | 2.172 | 3.895 | 3.538 | 1.592 | 3.314 |
| Kurtosis | 3.716 | −1.107 | 7.019 | 3.878 | 19.340 | 12.349 | 2.552 | 9.867 |
| CV% | 222.640 | 66.560 | 168.250 | 205.150 | 202.610 | 286.580 | 137.570 | 339.760 |
| PNSDW | 0.010 | 0.700 | 1.000 | 0.050 | 1.000 | 0.010 | 0.400 | 0.070 |
| Ba | Cu | Fe | Mn | Zn | |
|---|---|---|---|---|---|
| N | 33 | 33 | 33 | 33 | 33 |
| Max | 0.020 | 0.010 | 5.700 | 0.020 | 0.050 |
| Min | 0.000 | 0.000 | 0.000 | 0.000 | 0.000 |
| Mean | 0.0051 | 0.0007 | 0.3716 | 0.0047 | 0.0056 |
| SD | 0.006 | 0.002 | 1.213 | 0.005 | 0.012 |
| Skewness | 1.209 | 2.868 | 3.897 | 0.995 | 2.207 |
| Kurtosis | 1.149 | 6.654 | 14.832 | 0.455 | 4.511 |
| CV% | 114.31 | 310.56 | 326.63 | 102.27 | 220.23 |
| PNSDW | 0.700 | 1.000 | 1.000 | 0.400 | 5.000 |
| HN | NP | NI | ET (s) | Validation | Testing | |
|---|---|---|---|---|---|---|
| As | 25 | 9 | 2000 | 124.18818 | 0.98617 | 0.99656 |
| Ba | 29 | 6 | 2000 | 124.47877 | 0.95023 | 0.98621 |
| Cr | 29 | 3 | 2000 | 160.77287 | 0.96793 | 0.98507 |
| Cu | 30 | 7 | 2000 | 121.85391 | 0.98758 | 0.94860 |
| Fe | 22 | 7 | 2000 | 128.33642 | 0.95715 | 0.97733 |
| Mn | 25 | 2 | 2000 | 125.32753 | 0.94777 | 0.93157 |
| Ni | 28 | 7 | 2000 | 153.38283 | 0.99861 | 0.99971 |
| Pb | 29 | 9 | 2000 | 122.88486 | 0.99728 | 0.98994 |
| Index | HN | NP | NI | ET (s) | Validation | Testing |
|---|---|---|---|---|---|---|
| HPI | 27 | 8 | 2000 | 128.95811 | 0.98384 | 0.99973 |
| NPI | 29 | 5 | 2000 | 130.91300 | 0.99203 | 0.99400 |
| ERI | 30 | 1 | 2000 | 140.66034 | 0.98862 | 0.98091 |
| HN | NP | NI | ET (s) | Validation | Testing | |
|---|---|---|---|---|---|---|
| Ba | 25 | 6 | 2000 | 125.76638 | 0.92786 | 0.97901 |
| Cu | 27 | 7 | 2000 | 132.61975 | 0.99957 | 0.99987 |
| Fe | 30 | 2 | 2000 | 141.61058 | 0.99868 | 0.99706 |
| Mn | 29 | 3 | 2000 | 143.39959 | 0.99152 | 0.99922 |
| Zn | 26 | 1 | 2000 | 150.94246 | 0.99997 | 0.99994 |
| Index | HN | NP | NI | ET (s) | Validation | Testing |
|---|---|---|---|---|---|---|
| HPI | 26 | 2 | 2000 | 149.06667 | 0.99962 | 0.99984 |
| NPI | 29 | 3 | 2000 | 141.51668 | 0.99869 | 0.99781 |
| ERI | 28 | 4 | 2000 | 142.93539 | 0.98216 | 0.99958 |
| Index | HN | NP | NI | ET (s) | Validation | Testing |
|---|---|---|---|---|---|---|
| HQ (As) | 29 | 5 | 2000 | 131.72678 | 0.98983 | 0.99024 |
| HQ (Ba) | 27 | 2 | 2000 | 119.00130 | 0.96164 | 0.93469 |
| HQ (Cr) | 29 | 5 | 2000 | 114.47954 | 0.98674 | 0.98510 |
| HQ (Cu) | 28 | 7 | 2000 | 116.09329 | 0.99268 | 0.99534 |
| HQ (Fe) | 26 | 7 | 2000 | 114.40573 | 0.99709 | 0.99748 |
| HQ (Mn) | 29 | 9 | 2000 | 115.17782 | 0.98861 | 0.99820 |
| HQ (Ni) | 26 | 7 | 2000 | 121.11026 | 0.97369 | 0.94806 |
| HQ (Pb) | 27 | 8 | 2000 | 126.85262 | 0.98794 | 0.96551 |
| HI | 28 | 2 | 2000 | 118.55610 | 0.98692 | 0.98708 |
| Index | HN | NP | NI | ET (s) | Validation | Testing |
|---|---|---|---|---|---|---|
| HQ (Ba) | 26 | 7 | 2000 | 137.11112 | 0.99029 | 0.97838 |
| HQ (Cu) | 27 | 10 | 2000 | 136.08892 | 0.99998 | 0.99997 |
| HQ (Fe) | 28 | 10 | 2000 | 123.77389 | 0.99662 | 0.99922 |
| HQ (Mn) | 27 | 3 | 2000 | 134.97920 | 0.99599 | 0.99213 |
| HQ (Zn) | 29 | 5 | 2000 | 132.29242 | 0.99781 | 0.99719 |
| HI | 26 | 9 | 2000 | 135.89116 | 0.99918 | 0.99589 |
| Index | HN | NP | NI | ET (s) | Validation | Testing |
|---|---|---|---|---|---|---|
| CR (As) | 27 | 5 | 2000 | 139.80123 | 0.98699 | 0.99963 |
| CR (Cr) | 23 | 1 | 2000 | 139.84580 | 0.99420 | 0.99058 |
| CR (Pb) | 30 | 6 | 2000 | 131.91650 | 0.99112 | 0.99518 |
| CR (Ni) | 28 | 9 | 2000 | 179.67048 | 0.97320 | 0.97238 |
| TCR | 26 | 4 | 2000 | 138.49763 | 0.99742 | 0.99289 |
Disclaimer/Publisher’s Note: The statements, opinions and data contained in all publications are solely those of the individual author(s) and contributor(s) and not of MDPI and/or the editor(s). MDPI and/or the editor(s) disclaim responsibility for any injury to people or property resulting from any ideas, methods, instructions or products referred to in the content. |
© 2023 by the authors. Licensee MDPI, Basel, Switzerland. This article is an open access article distributed under the terms and conditions of the Creative Commons Attribution (CC BY) license (https://creativecommons.org/licenses/by/4.0/).
Share and Cite
Senoro, D.B.; De Jesus, K.L.M.; Monjardin, C.E.F. Pollution and Risk Evaluation of Toxic Metals and Metalloid in Water Resources of San Jose, Occidental Mindoro, Philippines. Sustainability 2023, 15, 3667. https://doi.org/10.3390/su15043667
Senoro DB, De Jesus KLM, Monjardin CEF. Pollution and Risk Evaluation of Toxic Metals and Metalloid in Water Resources of San Jose, Occidental Mindoro, Philippines. Sustainability. 2023; 15(4):3667. https://doi.org/10.3390/su15043667
Chicago/Turabian StyleSenoro, Delia B., Kevin Lawrence M. De Jesus, and Cris Edward F. Monjardin. 2023. "Pollution and Risk Evaluation of Toxic Metals and Metalloid in Water Resources of San Jose, Occidental Mindoro, Philippines" Sustainability 15, no. 4: 3667. https://doi.org/10.3390/su15043667
APA StyleSenoro, D. B., De Jesus, K. L. M., & Monjardin, C. E. F. (2023). Pollution and Risk Evaluation of Toxic Metals and Metalloid in Water Resources of San Jose, Occidental Mindoro, Philippines. Sustainability, 15(4), 3667. https://doi.org/10.3390/su15043667