Abstract
Accurately understanding the correlation characteristics of energy consumption between regions is an important basis for scientifically formulating energy policies and an important entry point for realizing carbon peak and carbon neutrality goals. Based on the energy consumption data of the Yangtze River Delta urban agglomeration (YRDUA) from 2004 to 2017, the social network analysis method is applied to investigate the spatial correlation characteristics of the energy consumption of 26 cities and its influencing factors in the YRDUA. The energy consumption presents an obvious spatial correlation network structure. The network density fluctuates by approximately 0.3, and the network structure is relatively stable. Hangzhou, Suzhou and other cities are at the center of the network, playing the role of intermediaries. In the network, 10 cities, such as Shanghai and Shaoxing, have the characteristics of bidirectional spillover effects and act as “guides”, while Nanjing, Yangzhou and Chuzhou have the characteristics of brokers and act as “bridges”. The regional differences in geographical adjacency, FDI, industrial agglomeration and environmental regulation intensity are positively correlated with the network, and the impact coefficients are 0.486, 0.093, 0.072 and 0.068, respectively. Infrastructure differences are negatively correlated with the network, with an impact coefficient of −0.087.
1. Introduction
As China’s economy develops rapidly, its energy consumption is increasing daily, growing from 571.44 million tons of standard coal in 1978 to 4.97 billion tons in 2020 [1]. In 1992, China consumed more energy than it produced for the first time in its history, and the energy shortage became increasingly serious. In 2020, China’s energy dependence on foreign countries was 20%, of which crude oil accounted for 73%, exceeding the warning line of 50%. According to a BP statistical review of world energy, China’s primary energy consumption in 2020 was 14.546 billion joules, a year-on-year increase of 2.4%, and it ranked first worldwide in primary energy consumption, accounting for 26.1% of world consumption. China’s growing energy consumption has raised concerns about its energy security and the sustainability of economic development [2,3]. In addition, the increase in energy consumption has resulted in an intensification of carbon emissions and environmental pollution, which are major obstacles to the sustainable development of China’s economy and society.
Cities are the main spaces for human life and work. Due to the rapid industrialization and urbanization in China, cities have become the main body of energy consumption and the main source of carbon emissions [4,5]. As an advanced form of urbanization development, urban agglomerations have increasingly replaced single cities and absorbed a large number of people, logistics, capital and information flows. They have a strong influence on surrounding cities and have become the most dynamic region for China’s economic development. In this process, the energy consumption of each city is inevitably affected by other cities, which forms a spatial correlation among cities. Therefore, for urban agglomerations, which are still in the process of agglomeration development, to achieve their energy conservation and emission reduction tasks, cities should not only consider their own energy consumption but also fully consider and effectively “contain” the energy consumption of their associated cities. In this context, it is necessary to understand the spatial distribution changes in energy consumption within urban agglomerations and clarify the spatial correlation and spatial structure of energy consumption among urban residents to formulate practical and coordinated energy conservation measures.
2. Literature Review
Scholars have studied the spatial characteristics of energy consumption from different perspectives, such as spatial difference, spatial convergence and spatial correlation. Due to the significant differences in economic development, city size and resource endowment among regions, the energy consumption of each region is also different. Scholars have used the Gini coefficient, Theil index, kernel density estimation, spatial hierarchical clustering, center of gravity model and standard deviation ellipse to analyze the spatial difference characteristics of energy consumption [6,7,8,9,10]. However, under certain conditions, there is also absolute convergence and conditional β convergence of energy consumption, and the spatial difference is further narrowed [11]. Moreover, due to the acceleration of regional integration, regional economic exchanges are becoming increasingly frequent, and regional energy consumption is interacting and interdependent, showing certain spatial agglomeration characteristics and spillover effects [12,13,14]. For different regions and different energy types, the spatial aggregation characteristics may be different. For example, there is a positive spatial autocorrelation in electricity and natural gas consumption in London [15], electricity consumption in China, renewable energy in the world and energy consumption in buildings, which all have a positive spatial autocorrelation [16,17,18]. China’s coal and thermal energy consumption show significant positive spatial autocorrelation, while oil shows significant negative spatial autocorrelation. There is no significant spatial autocorrelation between natural gas and electricity [19].
The influencing factors of energy consumption mainly include technological progress, economic growth, economic structure, urbanization and other factors. Among them, technological progress can improve energy efficiency and reduce energy consumption, and the two are significantly correlated [20]. Fixed asset investment is considered to be the main factor for the growth of energy consumption, particularly in provinces where the investment structure is inclined toward high-energy-consuming industries [21]. Often, energy intensity and consumption are greatly impacted by the government’s efforts to promote economic growth in China. Therefore, government fiscal expenditure is considered to be an important factor leading to an increase in energy consumption [18]. The government’s energy-saving policies, public transport improvement, energy-saving lifestyle and other environmental regulatory policies may improve energy efficiency and reduce energy use [22]. However, these mitigation effects may be offset by economic growth and living demand. More obviously, China’s rapid urbanization process increases employment opportunities, promotes the improvement in people’s living standards and supports infrastructure development in urban areas, which will undoubtedly increase energy consumption [23]. The relevant costs of economic activity exchange in regions with close geographical distance are relatively low, so energy consumption transfer between departments is more likely to occur in geographically adjacent regions. The relevant costs of economic activity exchange in regions with close geographical distance are relatively low, so energy consumption transfer between departments is more likely to occur in geographically adjacent regions [24]. With large-scale infrastructure construction, and continuous improvements in refrigeration, heating systems and public transport facilities, the energy demand may continue to grow [25]. Generally, FDI can increase the energy consumption of a host country [26]. With the increase in the continuous agglomeration of industries, the energy consumption of marginal cities has increased significantly, and the spatial correlation of energy consumption between cities has deepened [27]. At the micro level, social factors, such as family size, marriage and apartment living, are considered to be important factors affecting power consumption [13].
Social network analysis (SNA) is a quantitative analysis method based on mathematical methods and graph theory. It is used to study social phenomena and system structure from the perspective of relationships. Recently, this method has gained popularity and played a significant role in social networks, population mobility, urban spatial structure, international trade, technological innovation and other fields [28,29,30,31,32,33]. In addition, the SNA method was applied to environmental energy fields, such as carbon emissions, pollution control and energy consumption [34,35]. For example, in the field of carbon emissions, Wang et al. [36] used the SNA method and quadratic allocation procedure (QAP) to identify the network structure and effects of CO2 emissions in China by constructing a modified gravity model. Song et al. [37] studied the spatial correlation structure and effects of the CO2 emissions of the Chengdu–Chongqing urban agglomeration through the SNA method. Bai et al. [38] used the SNA method to find that the carbon emissions from interprovincial transportation in China present an intuitive spatial correlation network and a significant “core-edge” distribution pattern. Shen et al. [39], based on the analysis of the characteristics of carbon emission differences among three urban agglomerations, used the SNA method to study the collective carbon emissions of three urban agglomerations from the perspectives of the whole, individual and association. In the field of environmental pollution, Su et al. [40] constructed a spatial correlation network for China’s provincial pollution control based on the gravity model, analyzed the structural characteristics of the network and explored the main factors affecting the network strength using the QAP method. In recent years, this method has also been introduced into the field of energy consumption. Bu et al. [41] used the SNA method to explore the network characteristics of China’s interprovincial natural gas consumption. Liu et al. [42] used the SNA method to analyze the transmission path of power consumption and interindustry economic growth. Li and Li [43] used the SNA method to evaluate the spatial correlation network characteristics of China’s natural gas market.
In summary, most of the above studies use exploratory spatial analysis methods and spatial regression models to analyze the spatial correlation characteristics of energy consumption. Due to the limitations of spatial econometric models, they can explain only the correlation of energy consumption between regions, but the analysis of correlation and even the spatial structure of revealing the correlation are slightly insufficient. Furthermore, most existing studies are conducted at the national or provincial level and cannot be carried out at the urban level at a smaller scale. As the highest spatial form of urban development in China, urban agglomerations have closer internal economic, trade, population and energy exchanges than provinces, and the correlation of energy consumption is more prominent. Therefore, this paper takes China’s Yangtze River Delta urban agglomeration (YRDUA) as the research sample and uses the SNA method to explore the spatial correlation structure of energy consumption and its influencing factors. The main contributions are as follows:
(1) Based on the perspective of relational data and networks, we construct the spatial correlation network of energy consumption in the YRDUA using the modified gravity model and depict the structural form of the spatial relationship of energy consumption. This helps us study its internal correlation structure from the perspective of smaller urban agglomerations.
(2) The SNA method is used to reveal the overall characteristics, individual characteristics and cluster characteristics of the spatial correlation network of energy consumption. The classical method of sociology is integrated into economic research, which fully reflects the advantages of the cross connection between sociology and energy economics.
(3) The linkages and synergies of energy consumption within urban agglomerations are rarely studied, although they are particularly important in densely populated urban areas. This paper deeply reveals the impact of the spatial correlation network on energy consumption and provides a relatively new idea for formulating a cross-regional cooperative energy-saving mechanism.
3. Materials and Methods
3.1. Study Area
In China, the YRDUA has the strongest innovation capability, the highest level of openness and the greatest economic development. It plays a decisive role in national modernization construction, and its regional connectivity and policy synergy must be improved further. Therefore, exploring the spatial correlation of energy consumption in the YRDUA is conducive to the in-depth implementation of the regional coordinated development strategy, leading the Yangtze River Economic Belt to coordinate energy conservation. The geographical distribution of the YRDUA in China is shown in Figure 1.
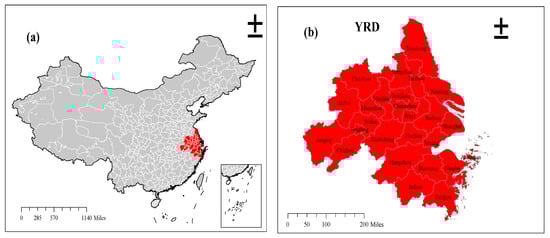
Figure 1.
Study area. Note: (a) represents the position of the Yangtze River Delta urban agglomeration in China; (b) represents the Yangtze River Delta urban agglomeration.
3.2. Gravitational Model
The first step in SNA is to build an association network. In the study, the point represents a single city and the line represents the link strength of energy consumption between two cities. Studies have adopted three main methods: the gravity model, VAR and the Granger test. Compared with VAR and the Granger test, the gravity model can consider many factors, such as economic strength, population, distance and energy consumption among cities, so it is the most widely used. Using the modified gravity model, we analyze the spatial correlation of energy consumption among 26 cities in the YRDUA. The formula is as follows:
where represents the gravity of energy consumption between city and city , is the resident population of city , is the GDP of city , is the energy consumption of city and represents the distance between city and city . represents the weighted proportion coefficient of energy consumption between city and city .
To reduce the impact of distance between cities to a lower level, the friction coefficient is set as 1 in this paper. According to the modified gravitation matrix, the correlation matrix of energy consumption among cities is calculated. To facilitate the description of the network structure, the energy consumption incidence matrix is binarized in this paper. Set the average value of each row in the energy consumption linkage matrix as the threshold value (). When a value is higher than the threshold, it is recorded as 1, indicating that there is a spatial association between two cities; when it is lower than the threshold, it is recorded as 0, meaning that the two cities have no spatial association.
3.3. Characteristic Index of the Spatial Correlation Network
3.3.1. Overall Network Characteristics
The network density and correlation coefficient are used to describe the characteristics of the whole network. Network density is an indicator of the tightness of the network between cities. The greater the network density is, the closer the energy consumption relationship between cities. The formula is as follows:
where denotes the network density; denotes the number of nodes; and is the relationship between nodes and .
3.3.2. Individual Network Characteristics
In SNA, three indicators, degree centrality, betweenness centrality and closeness centrality, are usually applied to describe the characteristics of individual networks. Among them, degree centrality can be divided into in-degree and out-degree centrality. This paper describes the energy consumption relationship of 26 cities through four indicators: in-degree (), out-degree (), closeness degree (), and betweenness degree ().
Degree centrality () indicates the degree of direct energy consumption association between cities and the other 25 cities. If the value is higher, city has a high degree of correlation with the other 25 cities in terms of energy consumption; that is, it is the center of the urban agglomeration. The point out degree () indicates the number of energy consumption associations issued by the city. If the value is higher, it means that the energy consumption spillover degree of city to other cities is higher. The in degree () indicates the number of energy consumption association relationships received by city . If the value is higher, city benefits more from energy consumption in other cities. Degree centrality is calculated as follows:
where represents the number of nodes.
The betweenness degree () reflects the extent to which city has the ability to control other cities. The higher the value of is, the more city is in a controlling position in the association network and the closer it is to the center of the spatial correlation network, such that it plays the role of a “bridge” or “intermediary”.
Closeness centrality () is the degree to which city is not influenced or controlled by other cities in the network. The higher the value is, the more direct the connection between city and other cities in terms of energy consumption.
3.3.3. Block Model
To carry out spatial cluster analysis on the energy consumption of the YRDUA, this paper adopts the block model method of SNA. Through block model analysis, the internal status of the spatial correlation network of energy consumption and the position and role of each city in the block can be well analyzed, and the correlation within and between blocks can be deeply analyzed. Four types of blocks are identified in the network: net spillover block, net benefit block, two-way spillover block and broker block.
3.3.4. QAP Analysis
According to the traditional multiple regression analysis method, the analyzed data should be independent of each other. Therefore, under the premise of the correlation between variables, they cannot meet the requirements of traditional statistical tests and regression analysis. This paper selects the hypothesis test of the relationship hierarchy in the SNA method. The hypothesis test of the relational hierarchy includes matrix correlation analysis and matrix regression analysis. Matrix correlation analysis can convert the research object matrix into a long matrix, compare the values of the two matrices to calculate the correlation coefficients and carry out nonparametric tests. Matrix regression analysis can simultaneously analyze the regression relationship between the target matrix and multiple matrices.
Following a comprehensive review of the factors selected by previous studies, six factors are chosen for QAP regression analysis: geographical adjacency (GEO), environmental regulation (ER), infrastructure (INF), foreign direct investment (FDI), industrial agglomeration (AGG) and technological innovation (TI). The main reasons are as follows. The relevant costs of economic activity exchange in regions with close geographical distance are relatively low, so energy consumption transfer between departments is more likely to occur in geographically adjacent regions [24]. Subsidies, taxes, energy conservation policies and other environmental regulatory policies adopted by the government may improve energy efficiency and reduce energy use [22]. With large-scale infrastructure construction, the continuous improvements in refrigeration, heating systems and public transport facilities, the energy demand may continue to grow [25]. Generally, FDI can increase the energy consumption of the host country [26]. With the increase in the continuous agglomeration of industries, the energy consumption of marginal cities has increased significantly, and the spatial correlation of energy consumption between cities has deepened [27]. Technological progress can improve energy efficiency and reduce energy consumption, and the two are significantly correlated [20]. The expression of the model is set as follows:
where Y, GEO, ER, INF, FDI, AGG and TI are relation matrices and Y denotes the spatial correlation matrix of energy consumption. GEO is the geographical adjacency matrix. If two cities are adjacent, it is recorded as 1; otherwise, it is recorded as 0. ER, INF, FDI, AGG and TI represent the difference matrix of the independent variables.
3.4. Data Source
This paper uses the annual panel data of 26 cities in China’s YRDUA from 2004 to 2017. The data source and processing procedures are as follows: the energy consumption data are from the statistical yearbooks of each province. The population and GDP are directly derived from the China Urban Statistical Yearbook. Environmental regulation is expressed by the comprehensive utilization rate of industrial solid waste. Infrastructure is represented by the number of buses per 10,000 people. FDI is measured by foreign direct investment as a percentage of GDP. Industrial agglomeration is measured by the location entropy index of the manufacturing industry. The data required for the above indicators are from the China Urban Statistical Yearbook. Technological innovation is represented by the number of patents authorized per capita, which comes from the patent cloud database. The geographical distance between cities is expressed by spherical distance and calculated by ArcGIS.
4. Results and Discussion
4.1. Characteristics of the Overall Network Structure
The gravity model is used to construct the spatial correlation matrix of the energy consumption of 26 cities in the YRDUA from 2004 to 2017, and the diagram is drawn based on ArcGIS and the UCINET visualization tool Netdraw. Due to space limitations, only the spatial distribution and the spatial correlation network of energy consumption in 2017 are shown in Figure 2 and Figure 3. As presented in Figure 2, the total energy consumption in 2017 was divided into five levels, from dark red to light red, indicating the total energy consumption from high to low. Among them, Shanghai has the largest total energy consumption, ranking fifth. Suzhou, Wuxi and Jiaxing take second place in total energy consumption, which belongs to the fourth level. The third level is composed of 10 cities, including Nantong, Huzhou, Shaoxing and Ningbo. The second level is composed of seven cities, including Hangzhou, Jinhua and Yancheng. The total energy consumption of the first level is the smallest, consisting of Anqing City, Chizhou City, Xuancheng City and Chuzhou City, for a total of 4 cities. Figure 2 also shows the trend of energy consumption decreasing from east to west. The energy consumption of the YRDUA is mainly concentrated in the eastern coastal cities, especially Shanghai and its neighboring cities. Figure 3 is the spatial correlation network diagram of the energy consumption of the YRDUA in 2017, which is drawn using UCINET software after the calculation of the modified gravity model. The white dots represent 26 cities in the YRDUA, and the red lines represent the energy consumption associations formed among the cities. If the attraction between two cities is not higher than the threshold, there is no red line connection. The 26 cities are located in the whole network relationship, and there are no isolated cities. Thus, 247 connecting lines, from the relationship-sending city to the relationship-receiving city, have formed a complex spatial connection network of energy consumption, which meets the basic conditions of SNA.
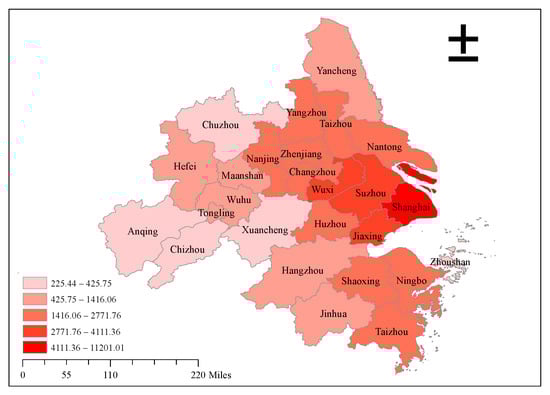
Figure 2.
The spatial distribution of energy consumption in 2017.
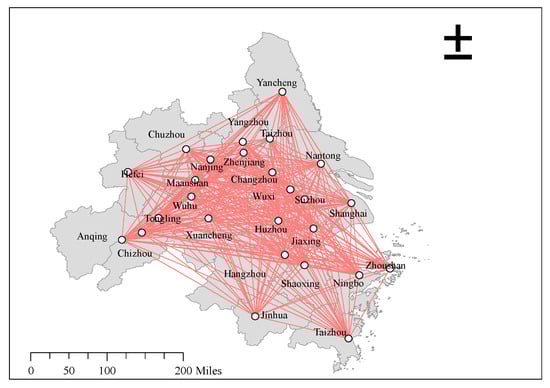
Figure 3.
The spatial correlation network of energy consumption in 2017.
4.2. Overall Network Density
As shown in Figure 4, the total number of spatial correlation relationships of energy consumption in the YRDUA fluctuated between 227 and 247 from 2004 to 2017, and the average value was 236. The overall network density fluctuates between 0.35 and 0.38, and the average value is 0.363. This shows that during the sample investigation period, the correlation of 26 cities in the YRDUA shows a certain spatial correlation, but from the numerical point of view, the maximum number of relationships among 26 cities is 650 (25*26), while the number of relationships identified by the gravity model used in this paper varies by approximately 236. Hence, the YRDUA needs to strengthen the spatial correlation and stability of energy consumption.
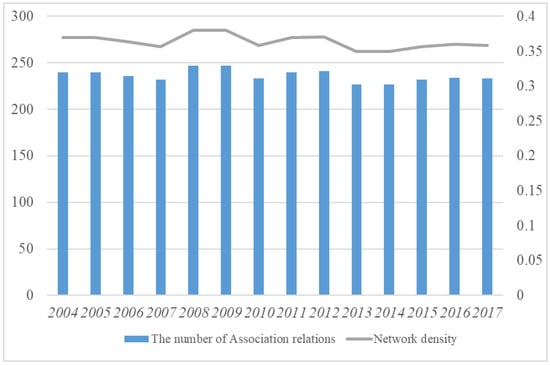
Figure 4.
The association relations and network density of energy consumption.
4.3. Centrality Analysis Results
The difference in energy consumption in each city leads to the directivity of the energy consumption network. In each associated network, the degree of each point can be divided into in degree and out degree. The in degree represents the influence value of city i by other cities. If the value is large, city i is also greatly affected. Otherwise, the impact is small. The out degree represents the active impact of city i, that is, the ability to have an impact on other cities. If the out degree is large, city i has a greater impact on other cities; otherwise, the impact is small. The in-degree, out-degree, closeness degree and betweenness degree of the YRDUA in 2005, 2008, 2011 and 2014, calculated by UCINET software, are shown in Table 1, Table 2, Table 3 and Table 4.

Table 1.
Degree of the network.
Table 2.
Out degree of the network.
Table 3.
Closeness centrality of the network.
Table 4.
Betweenness centrality of the spatial correlation network.
As shown in Table 1, in the network in 2005, 2008, 2011 and 2014, there are almost no significant changes in penetration. During the selected sample study years, Hangzhou, Suzhou, Nanjing, Nantong, Wuxi, Shanghai and Changzhou are the cities whose penetration is greater than the annual average. Among them, Hangzhou ranked first in the four years. In 2005, 2008, 2011 and 2014, the sum of the in-degree values of Hangzhou, Suzhou, Nanjing, Nantong, Wuxi, Shanghai, Changzhou and Yangzhou accounted for 54.17%, 52.23%, 52.08% and 53.30% of the sum of the point entry values of the 26 cities in that year, respectively. Huzhou, Jinhua, Taizhou, Chizhou, Tongling and Zhoushan ranked in the last six cities in the four years. Among them, Zhoushan had an in degree of only 1 for 3 years, and its in degree in 2005 was 0. In the past four years, the sum of the in-degree values of Huzhou, Jinhua, Taizhou, Chizhou, Tongling and Zhoushan accounted for 6–7% of the total in-degree values of the 26 cities in that year.
As shown in Table 2, in the network in 2005, 2008, 2011 and 2014, the change range of the out degree of 26 cities was smaller than that of the in degree, and the out degree of many cities in the four years was 6 or more. During the selected sample study years, the cities whose out degrees were greater than the annual average were Nanjing, Chuzhou, Hefei, Yancheng, Taizhou, Changzhou, Jinhua, Shanghai and Hangzhou. Among them, Nanjing ranked first in the four years.
As shown in Table 3, the cities where the degree of closeness to the center of the research sample in the four years was higher than the average value of that year are Hangzhou, Suzhou, Nanjing, Nantong, Wuxi and Shanghai. Anqing, Chizhou, Tongling and Zhoushan were among the last four cities in terms of the closeness degree. Hangzhou ranked first in 2005, 2008, 2011 and 2014. Except in 2017, Hangzhou’s proximity to the center was 34 units higher than that of Zhoushan, showing two-level differentiation. In all four years, the value of 10–14 cities remained at approximately 60–65.
As shown in Table 4, the cities with betweenness degree values greater than the annual average in the four years are Hangzhou, Suzhou, Nanjing, Nantong, Wuxi and Shanghai. Among them, the value of betweenness degree in Hangzhou ranked first for all four years. Zhoushan city and Taizhou city had a betweenness degree of 0 in 2005 and 2014. The two cities hardly played any intermediary role in energy consumption. In the four years of the sample study, 14–17 cities each year had betweenness degree values less than 1, and Hangzhou, once again, played an incomparable role as an energy consumption center. In terms of the betweenness degree of energy consumption, the two-level differentiation of 26 cities is more obvious. In 2014, the betweenness degree of Hangzhou was 478-times that of Jiaxing.
4.4. Block Model Analysis Results
The maximum segmentation degree is 2, and the concentration standard is 0.2. According to Table 5, the 26 cities of the YRDUA are divided into four blocks, and the four blocks are distinguished by different colors, as shown in Figure 5.
Table 5.
Subgroup partition table in the Yangtze River Delta.
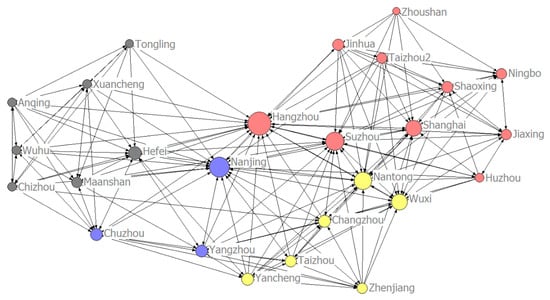
Figure 5.
Energy consumption network of the YRDUA in 2011.
As shown in Table 5, the YRDUA was divided into four blocks from 2004 to 2017, and the block division method in the four years selected by the sample hardly changed significantly; only some cities, such as Ma’anshan, Chuzhou and Suzhou, presented changes. However, according to the four-year division, the members of the four blocks were basically fixed. For example, the members of the first block are Shanghai, Shaoxing, Jinhua, Zhoushan, Suzhou, Ningbo, Jiaxing, Huzhou, Taizhou and Hangzhou. The members of the second block are Wuxi, Zhenjiang, Taizhou, Nantong, Changzhou and Yancheng. The members of the third block are Nanjing, Yangzhou and Chuzhou. The members of the fourth block are Hefei, Tongling, Ma’anshan, Anqing, Chizhou, Xuancheng and Wuhu. Basically, four suburban agglomerations centered on Shanghai, Nantong, Nanjing and Hefei are formed.
According to the 4-year division, the first, second, third and fourth blocks can be regarded as the blocks, led by Shanghai, Wuxi, Nanjing and Hefei, respectively. Although the members of each block have little change, the relationship between members within the block and the density between blocks present some changes.
Table 6 reflects the location of the four blocks in the network and the attributes of each block. In 2011, there were 227 relationships in the overall energy consumption network of the YRDUA, 121 within the block and 106 outside the block, meaning that there are certain spatial relationships and spillovers between the blocks. The actual internal relationship proportion of the first block is 59%, the expected internal relationship proportion is 32%, the total overflow is 78, the total acceptance is 72, the external receiving relationship is 26 and the outgoing relationship is 32, belonging to the “net overflow” block. The first block is mainly located in the southeastern YRDUA. It is composed of eight cities in Zhejiang Province and Suzhou and Shanghai in Jiangsu Province, and eight of them are coastal cities. Shanghai and Hangzhou are the core cities in the first sector and some prefecture-level cities in Zhejiang Province. Therefore, there is mainly an energy consumption spillover relationship with other cities. The actual internal relationship proportion of the second block is 65%, the expected internal relationship proportion is 28%, the total overflow is 74, the total acceptance is 92, the external acceptance relationship is 44 and the outgoing relationship is 26. Among them, the number of receiving relationships and sending relationships between the second block and outside the block is greater than that of the first block. As the second block is in line with the characteristics that the actual proportion of internal relations is greater than the expected proportion of internal relations, it belongs to the “net benefit” block. The second block is located in the northeast of the YRDUA and consists of six cities in Jiangsu Province; only Yancheng city and Nantong city are near the sea. The six cities in the second block mainly accept the overflow of energy consumption from other cities.
Table 6.
Analysis of spillover effects.
The third block involves 38 spillovers and 42 acceptances in total. In the spillover relationships, the acceptance relationship outside the block is 30, the issuance relationship is 12, the actual internal relationship proportion is 32% and the expected internal relationship proportion is 12%. This is the “two-way spillover” block and includes Nanjing, the core city in the Shanghai Nanjing Hangzhou industrial zone. Among the related relationships involved in the fourth block, there are 37 spillovers and 21 acceptances, 6 acceptances and 15 originations outside the sector. The actual internal relationship accounts for 41%, and the expected internal relationship accounts for 16%, belonging to the “broker” block.
Based on the above analysis, the relationship diagram of the four blocks is constructed, as shown in Figure 6. The first block is the net overflow block, including Shanghai, Shaoxing, Jinhua, Zhoushan, Suzhou, Ningbo, Jiaxing, Huzhou, Taizhou and Hangzhou. The second sector, that is, the net benefit block, includes Wuxi, Zhenjiang, Taizhou, Nantong, Changzhou and Yancheng. The third block, the two-way overflow block, consists of Nanjing, Yangzhou and Chuzhou. Finally, the fourth block is the broker block, which includes Hefei, Tongling, Ma’anshan, Anqing, Chizhou, Xuancheng and Wuhu.
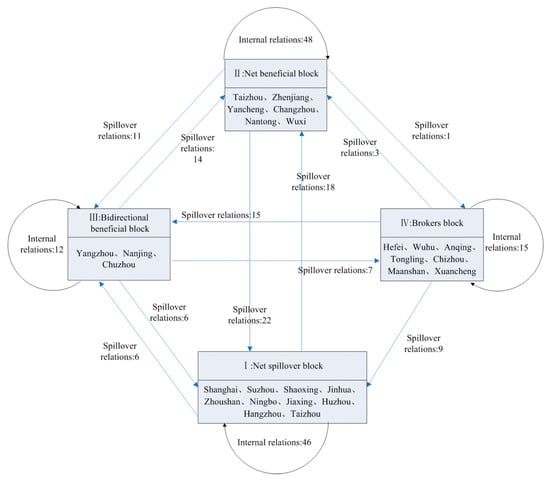
Figure 6.
Spatial associations among the four blocks.
As shown in Table 7, among the four blocks in 2005, the third block, composed of Yangzhou, Nanjing, Ma’anshan and Chuzhou, had the largest internal density, followed by subgroup 2, composed of Taizhou, Zhenjiang, Yancheng, Changzhou, Nantong and Wuxi, with an internal density of 0.9. Among the four blocks in 2008, the third block, composed of Yangzhou and Nanjing, had the largest block density. Compared with 2005, the number of members in the third block decreased by two cities, leaving only Yangzhou and Nanjing. Therefore, Yangzhou and Nanjing played a more important role in the third block. The second block with the highest block density was composed of Taizhou, Zhenjiang, Yancheng, Changzhou, Nantong and Wuxi. Compared with the internal density level of the block in 2005, the internal density of the second block and the third block increased, with the third block presenting an increase from 0.917 to 1 and the second block increasing from 0.9 to 0.917, indicating that the internal relations between the two blocks became closer than in 2005, and the energy consumption relations among cities within the block increased. In 2011, the third block, composed of Yangzhou, Nanjing and Chuzhou, had the largest internal density, followed by the second block, composed of Taizhou, Zhenjiang, Yancheng, Changzhou, Nantong and Wuxi. The internal members of the second block did not change. In terms of density value, the third block still maintained a level of 1, and the second block fell back to a level of 0.9. In 2014, the third block, composed of Yangzhou, Nanjing, Chuzhou and Ma’anshan, had the largest internal density of the block, followed by the second block, composed of Taizhou, Zhenjiang, Yancheng, Changzhou, Nantong, Wuxi, Suzhou and Yangzhou. Except for the third block, whose density remained at a level of 1, the density of the other three blocks dropped slightly. For the composition of members, in 2011, the members of the third block increased with the addition of Ma’anshan and returned to the structural composition of Yangzhou, Nanjing, Chuzhou and Ma’anshan. After remaining unchanged for the first three years of the study sample period, the second block saw the introduction of Suzhou and Yangzhou. The addition of new members may have led to a decline in the internal density of the block.
Table 7.
Density matrix and image matrix for spatial clustering.
For a more concise analysis, this paper compares the density matrix with the value of the overall network density. If the density value is greater than the overall network density value, it is recorded as 1; otherwise, it is recorded as 0. Thus, the image matrix of the energy consumption association network of the YRDUA is obtained, as shown in Table 7. Overall, the relationship between most blocks is less than the overall network density. From 2005 to 2014, the four blocks maintained a close internal relationship, and the relationship between blocks was maintained at a level of three every year, indicating a low correlation between blocks. The second block and the third block maintained close two-way contact in 2005, 2008 and 2011, and the fourth block and the third block maintained one-way contact for all four years. There was no energy consumption connection between the fourth block and the first block in the four years. In 2014, a one-way energy consumption connection was added between the first and second blocks, mainly because Suzhou was moved from the original first block to the second block. In the second block, Suzhou had a high urban quality, leading other members of the second block to strengthen the energy consumption connection with the first block and making the energy consumption connection density between the first block and the second block greater than the overall network density. This also reflects the close energy consumption relationship between Suzhou and the first block centered on Shanghai. Moreover, Yangzhou changed from the original third block to the second block in 2014, so the connection between the second block and the third block decreased and was less than the overall network density. As reflected in the image matrix, the energy consumption connection between the second block and the third block became 0, reflecting the close energy consumption connection between Yangzhou and the second block centered on Wuxi.
4.5. Influencing Factors of the Spatial Correlation Network
4.5.1. QAP Correlation Analysis
The QAP correlation analysis results are obtained by selecting 5000 random displacements, as shown in Table 8. The correlation coefficient represents the actual observable correlation between the relationship matrix of the explained variable (spatial correlation of energy consumption) and the explanatory variable (industrial agglomeration, environmental regulation, foreign indirect investment, geographical adjacency, infrastructure, technological innovation). The greater the correlation coefficient is, the greater the impact of the corresponding explanatory variable on the network.
Table 8.
QAP correlation analysis results (1).
Table 8 shows that the coefficient between geographical adjacency and spatial correlation is significant at the 1% level; the coefficients between infrastructure, foreign investment and spatial correlation are significant at the 5% level; and the coefficient between industrial agglomeration and spatial correlation is significant at the 10% level. The coefficient between infrastructure and spatial correlation is negative, indicating that regional proximity is an important factor in the spatial correlation of energy consumption. Geographical adjacency, foreign investment and industrial agglomeration have a positive impact on spatial correlation.
As shown in Table 9, the spatial correlation network of energy consumption in the YRDUA shows a positive correlation with geographical adjacency, foreign direct investment and industrial agglomeration, with the strongest and most significant correlation. This shows that cities with shorter geographical distance, more foreign investment and strong industrial agglomeration tend to establish close ties, which affect the formation of spatial networks. Moreover, the coefficient of environmental regulation is positive, but the significance is weak. There is a negative correlation between infrastructure construction and the spatial correlation network, which is significant at the 1% level. Again, it is proven that infrastructure construction has a very obvious impact on the spatial correlation. Finally, the coefficient of technological innovation is negative, and the significance is not strong, which indicates a need for further investigation. Through the correlation coefficient matrix, it can be seen that there are correlations between various relationship networks to varying degrees. On this basis, it is necessary to control variables and further carry out multiple regression analysis.
Table 9.
QAP correlation analysis results (2).
4.5.2. QAP Regression Analysis
The results of QAP multiple regression analysis show that R2 reaches 0.276, indicating that the model can better explain the formation mechanism of the spatial correlation network to a certain extent. Table 10 shows that the coefficient of GEO is significant at the 1% level, and the unstandardized coefficient and standardized coefficient are positive, indicating that geographical location does have a positive effect on the spatial spillover of energy consumption, and the geographical relationship is the most important of the six factors listed. The coefficient of INF is significant at the 5% level, indicating that infrastructure differences affect the spatial correlation of energy consumption. The negative coefficient means that the greater the infrastructure difference is, the smaller the spatial correlation and spillover of energy consumption among cities. The coefficient of FDI is significant at the 5% level, indicating that the difference in FDI affects the spatial correlation of energy consumption. The coefficient is positive, indicating that the greater the difference in foreign indirect investment is, the greater the spatial correlation and spillover of energy consumption among cities. The coefficient of AGG is significant at the 10% level, indicating that the industrial agglomeration difference affects the spatial correlation of energy consumption. The regression coefficient is positive, indicating that the greater the industrial agglomeration difference is, the greater the spatial correlation and spillover of energy consumption among cities. The coefficient of ER is significant at the 10% level, indicating that the environmental regulation difference affects the spatial correlation of energy consumption. The coefficient is positive, indicating that the greater the environmental regulation difference is, the greater the spatial correlation and spillover of energy consumption among cities.
Table 10.
QAP regression results.
The research in this paper shows that at the urban level, energy consumption has significant spatial correlation network characteristics. Liu et al. [24], Huang [44] and other scholars found that energy consumption and energy efficiency have the characteristics of a spatial correlation network at the provincial level. The conclusions of both studies are basically the same, and both indicate that energy consumption has spatial correlation characteristics. In addition, this paper also finds that geographical distance and the spatial correlation network of energy consumption show a significant positive correlation, which is related to Liu et al. [24]. The level of technological innovation is negatively correlated with the spatial correlation network of energy consumption, but not significantly. There is a significant positive correlation between environmental regulation and the spatial correlation network of energy consumption, which is consistent with the conclusion of Huang [44]. FDI has a significant positive correlation with the spatial correlation network of energy consumption, which is also consistent with the conclusion of Amoakoa and Insaidoo [26].
5. Conclusions and Recommendations
Based on the SNA method, this paper takes the 26 cities in the YRDUA in China as the research sample, constructs the spatial correlation network of energy consumption through the modified gravity model and studies the overall characteristics, individual characteristics and spatial clustering of the network. Finally, the QAP method is applied to analyze the influencing factors in the network. The following conclusions are drawn:
First, in terms of the overall network characteristics, from 2004 to 2017, the average number of network relationships of energy consumption in the YRDUA is 236, and the average value of the network density is 0.363. The energy consumption links within the urban agglomeration become increasingly closer, showing a complex network correlation.
Second, in terms of the characteristics of each node in the network, the cities with the highest in degree are Hangzhou, Suzhou and Nanjing, and the cities with the lowest ranking are Zhoushan, Chizhou and Tongling. The cities with the highest out degree are Nanjing, Yancheng and Taizhou. The top three cities in terms of closeness degree are Hangzhou, Suzhou and Nanjing. The top three cities in betweenness degree are Hangzhou, Suzhou and Nanjing. The three indicators of Hangzhou are all in first place in the sample period. The four indicators of Zhoushan city in the sample period are at the bottom.
Third, the spatial clustering characteristics show that in the first block, Shanghai, Suzhou, Shaoxing, Jinhua, Zhoushan, Ningbo, Jiaxing, Huzhou, Hangzhou and Taizhou were two-way overflow blocks; in the second block, Zhenjiang city, Yancheng city, Changzhou city, Nantong city and Wuxi city were net beneficiaries; in the third block, Nanjing, Yangzhou and Chuzhou were brokers; and in block 4, Hefei, Wuhu, Tongling, Anqing, Chizhou, Ma’anshan and Xuancheng were net overflow blocks. The four blocks all had a correlation of energy consumption within their own blocks, and there was an overflow relationship between the blocks.
Fourth, from the results of the QAP regression analysis, the regional differences in geographical adjacency, foreign indirect investment, industrial agglomeration and environmental regulation are significantly positively correlated with the spatial correlation network of energy consumption. There is a significant negative correlation between the regional difference in infrastructure and the network.
These policy recommendations are derived from the above conclusions. First, all cities should continue to deepen the reform of the energy consumption system and improve the legal system of environmental protection. Moreover, the supervision and control mechanism should be improved, and the evaluation and assessment system of relevant responsible and supervisory personnel should be established and improved. Second, the role of cities in the network should be taken advantage of to achieve spatial collaborative energy conservation. For cities with “net spillovers”, such as Zhenjiang and Yancheng, and “net benefits”, such as Hefei and Wuhu, we should accelerate technological innovation related to energy consumption and provide preferential policies and convenient services for enterprises engaged in zero carbon, low carbon, clean energy and other businesses. For cities with “two-way spillovers”, such as Shanghai and Suzhou, and “brokers” made up of Nanjing Yangzhou and Chuzhou, more stringent policies should be formulated to regulate and manage local energy consumption and guide enterprises to introduce advanced technology and phase out high-energy-consuming equipment to reduce energy consumption. Third, we should further strengthen cross-regional collaborative energy conservation. For example, we should establish a joint headquarters for energy consumption, responsible for coordinating the energy consumption among cities; develop laws and regulations to regulate the responsibilities and coordination mechanisms of the joint command; establish an information-sharing platform related to energy consumption; and disclose the energy consumption monitoring data of each city on a quarterly or monthly basis so that governments at all levels can accurately monitor and enterprises can regulate their consumption in a timely way. According to the overall and individual characteristics of each city in the energy consumption network, we should reasonably allocate energy-saving indicators and formulate energy-saving policies according to local conditions. Fourth, the spatial correlation of energy consumption in the Yangtze River Delta urban agglomeration is mainly affected by differences in geographical location, foreign investment, industrial agglomeration, environmental regulation and infrastructure construction. Therefore, the Yangtze River Delta urban agglomeration should further consolidate the existing network relationship and further strengthen the links between cities in the network by making use of the proximity relationship in geographical location, similar foreign investment, industrial agglomeration, environmental regulation and infrastructure construction.
Author Contributions
Writing—review and editing, Supervision, Conceptualization, Validation, H.W.; Writing—original draft, Methodology, Formal analysis, Software, P.L. All authors have read and agreed to the published version of the manuscript.
Funding
This work was supported by the National Social Science Fund of China (No. 22XTJ004), the Social Science Project of Shaanxi (No. 2021D062), the Shaanxi Soft Science Foundation (No. 2022KRM079) and the National Statistical Science Research Project (No. 2022LY068).
Institutional Review Board Statement
Not applicable.
Informed Consent Statement
Not applicable.
Data Availability Statement
The datasets from this paper are available from the corresponding author on reasonable request.
Conflicts of Interest
The authors declare no conflict of interest.
References
- National Bureau of Statistics of China. China Statistical Yearbook; China Statistics Press: Beijing, China, 2020. [Google Scholar]
- Zhang, X.; Geng, Y.; Shao, S.; Wilson, J.; Song, X.Q.; You, W. China’s non-fossil energy development and its 2030 CO2 reduction targets: The role of urbanization. Appl. Energy 2020, 216, 114353. [Google Scholar] [CrossRef]
- Wang, A.I.; Hu, S.; Lin, B.Q. Emission abatement cost in China with consideration of technological heterogeneity. Appl. Energy 2021, 290, 116748. [Google Scholar] [CrossRef]
- Mi, Z.F.; Zhang, Y.K.; Guan, D.B.; Shan, Y.L.; Liu, Z.; Cong, R.G.; Yuan, X.C.; Wei, Y.M. Consumption-based emission accounting for Chinese cities. Appl. Energy 2016, 184, 1073–1081. [Google Scholar] [CrossRef]
- Han, F.; Xie, R.; Lu, Y.; Fang, J.Y.; Liu, Y. The effects of urban agglomeration economies on carbon emissions: Evidence from Chinese cities. J. Clean. Prod. 2018, 172, 1096–1110. [Google Scholar] [CrossRef]
- Kang, X.; Yang, D. An analysis on the difference of regional energy consumption in China based on the method of the Theil index. Resour. Sci. 2010, 3, 485–490. [Google Scholar]
- Wu, S.; Zheng, X.; Wei, C. Measurement of inequality using household energy consumption data in rural China. Nat. Energy 2017, 2, 795–803. [Google Scholar] [CrossRef]
- Wang, S.; Liu, Y.; Zhao, C.; Pu, H. Residential energy consumption and its linkages with life expectancy in mainland China: A geographically weighted regression approach and energy-ladder-based perspective. Energy 2019, 177, 347–357. [Google Scholar] [CrossRef]
- Wang, S.B.; Liu, H.M.; Pu, H.X.; Yang, H. Spatial disparity and hierarchical cluster analysis offinal energy consumption in China. Energy 2020, 197, 117195. [Google Scholar] [CrossRef]
- Wang, N.; Fu, X.D.; Wang, S.B. Spatial-temporal variation and coupling analysis of residential energy consumption and economic growth in China. Appl. Energy 2022, 309, 118504. [Google Scholar] [CrossRef]
- Hao, Y.; Peng, H. On the convergence in China’s provincial per capita energy consumption: New evidence from a spatial econometric analysis. Energy Econ. 2017, 68, 31–43. [Google Scholar] [CrossRef]
- Jiang, S.R.; Wang, J.Y.; Shi, L.; Ma, Z. Impact of energy consumption and air pollution on economic growth:An empirical study based on dynamic spatial Durbin model. Energy Procedia 2019, 158, 4011–4016. [Google Scholar]
- Park, J.; Yun, S.J. Social determinants of residential electricity consumption in Korea: Findings from a spatial panel model. Energy 2021, 239, 122272. [Google Scholar] [CrossRef]
- Jeetoo, J. Spatial interaction effect in renewable energy consumption in sub-Saharan Africa. Renew. Energy 2022, 190, 148–155. [Google Scholar]
- Tian, W.; Song, J.; Li, Z. Spatial regression analysis of domestic energy in urban areas. Energy 2014, 76, 629–640. [Google Scholar] [CrossRef]
- Liu, X.R.; Guo, W.; Feng, Q.; Wang, P. Spatial correlation, driving factors and dynamic spatial spillover of electricity consumption in China: A perspective on industry heterogeneity. Energy 2022, 257, 124756. [Google Scholar] [CrossRef]
- Lv, Z.K.; Liu, W.X.; Xu, T. Evaluating the impact of information and communication technology on renewable energy consumption: A spatial econometric approach. Renew. Energy 2022, 189, 1–12. [Google Scholar] [CrossRef]
- Zhang, L.M.; Li, R.Y. Impacts of green certification programs on energy consumption and GHG emissions in buildings: A spatial regression approach. Energy Build. 2022, 256, 111677. [Google Scholar] [CrossRef]
- Wang, T.; Wen, Y.Y.; Lin, B.Q. Energy consumption and the influencing factors in China: A nonlinear perspective. J. Clean. Prod. 2020, 249, 119375. [Google Scholar] [CrossRef]
- Huang, J.B.; Xiang, S.Q.; Wu, P.L.; Chen, X. How to control China’s energy consumption through technological progress: A spatial heterogeneous investigation. Energy 2022, 238, 121965. [Google Scholar] [CrossRef]
- Lin, B.Q.; Wang, M. Possibilities of decoupling for China’s energy consumption from economic growth: A temporal-spatial analysis. Energy 2019, 185, 951–960. [Google Scholar]
- Lv, Y.L.; Chen, W.; Chen, J.Q. Modelling dynamic impacts of urbanization on disaggregated energy consumption in China: A spatial Durbin modelling and decomposition approach. Energy Policy 2019, 133, 110841. [Google Scholar] [CrossRef]
- Ji, X.; Chen, B. Assessing the energy-saving effect of urbanization in China based on stochastic impacts by regression on population, affluence and technology (STIRPAT) model. J. Clean. Prod. 2017, 163, 306–314. [Google Scholar] [CrossRef]
- Liu, H.J.; Liu, C.M.; Sun, Y.N. Spatial correlation network structure of energy consumption and its effect in China. China Ind. Econ. 2015, 5, 83–95. [Google Scholar]
- Wang, S.Y.; Chen, H.N.; Wei, P. Study on the influencing factors of energy consumption in China’s cities along the belt and road: Based on two-way fixed effects model. J. China Univ. Petrol. 2022, 2, 19–26. [Google Scholar]
- Amoakoa, S.; Insaidoo, M. Symmetric impact of FDI on energy consumption: Evidence from Ghana. Energy 2021, 223, 120005. [Google Scholar] [CrossRef]
- Li, Y.M.; Sun, L.Y.; Zhang, H.L.; Liu, T.T.; Fang, K. Does industrial transfer within urban agglomerations promote dual control of total energy consumption and energy intensity? J. Clean. Prod. 2018, 204, 607–617. [Google Scholar] [CrossRef]
- Norbutas, L.; Corten, R. Network structure and economic prosperity in municipalities: A large-scale test of social capital theory using social media data. Soc. Netw. 2018, 52, 120–134. [Google Scholar] [CrossRef]
- Hamilton, J.; Hogan, B.; Lucas, K.; Mayne, R. Conversations about conservation? Using social network analysis to understand energy practices. Energy Res. Soc. Sci. 2019, 49, 180–191. [Google Scholar] [CrossRef]
- Yu, J.K.; Ma, J.Q. Social network analysis as a tool for the analysis of the international trade network of aquatic products. Aquacult. Int. 2020, 28, 1195–1211. [Google Scholar] [CrossRef]
- Zhang, P.F.; Zhao, Y.Y.; Zhu, X.H.; Cai, Z.W.; Xu, J.X.; Shi, S. Spatial structure of urban agglomeration under the impact of high-speed railway construction: Based on the social network analysis. Sustain. Cities Soc. 2020, 62, 10240. [Google Scholar] [CrossRef]
- Leng, Z.H.; Sun, H.; Cheng, J.H.; Wang, H.; Yao, Z. China’s rare earth industry technological innovation structure and driving factors: A social network analysis based on patents. Resour. Policy 2021, 73, 102233. [Google Scholar] [CrossRef]
- Meng, X.X.; Liu, M.L.; Wang, J. Innovation network economic model of new energy automobile industry based on social network perspective. J. Therm. Anal. Calorim. 2021, 144, 1671–1680. [Google Scholar] [CrossRef]
- Sun, L.; Qin, L.; Taghizadeh-Hesary, F.; Zhang, J.; Mohsin, M.; Chaudhry, I.S. Analyzing carbon emission transfer network structure among provinces in China: New evidence from social network analysis. Environ. Sci. Pollut. Res. 2020, 27, 23281–23300. [Google Scholar] [CrossRef] [PubMed]
- Wang, H.P.; Ge, Q. Analysis of the spatial association network of PM2.5 and its influencing factors in China. Int. J. Environ. Res. Public Health 2022, 19, 12753. [Google Scholar] [CrossRef] [PubMed]
- Wang, F.; Gao, M.N.; Liu, J.; Fan, W.N. The Spatial Network Structure of China’s Regional Carbon Emissions and Its Network Effect. Energies 2018, 11, 2076. [Google Scholar] [CrossRef]
- Song, J.; Feng, Q.; Wang, X.; Fu, H.; Jiang, W.; Chen, B. Spatial association and effect evaluation of CO2 emission in the Chengdu-Chongqing urban agglomeration: Quantitative evidence from social network analysis. Sustainability 2019, 11, 1. [Google Scholar] [CrossRef]
- Bai, C.Q.; Zhou, L.; Xia, M.L.; Feng, C. Analysis of the spatial association network structure of China’s transportation carbon emissions and its driving factors. J. Environ. Manag. 2020, 253, 109765. [Google Scholar] [CrossRef]
- Shen, W.R.; Liang, H.W.; Dong, L.; Ren, J.Z.; Wang, G.J. Synergistic CO2 reduction effects in Chinese urban agglomerations: Perspectives from social network analysis. Sci. Total Environ. 2021, 798, 149352. [Google Scholar] [CrossRef]
- Su, Y.; Yu, Y.Q. Spatial association effect of regional pollution control. J. Clean. Prod. 2019, 213, 540–552. [Google Scholar] [CrossRef]
- Bu, Y.; Wang, E.D.; Bai, J.H.; Shi, Q.B. Spatial pattern and driving factors for interprovincial natural gas consumption in China: Based on SNA and LMDI. J. Clean. Prod. 2020, 263, 121392. [Google Scholar] [CrossRef]
- Liu, D.; Zeng, X.M.; Su, B.; Wang, W.B.; Sun, K.; Sadia, U.H. A social network analysis regarding electricity consumption and economic growth in China. J. Clean. Prod. 2020, 274, 122973. [Google Scholar] [CrossRef]
- Li, F.Y.; Li, X.M. An empirical analysis on regional natural gas market of China from a spatial pattern and social network perspective. Energy 2022, 244, 122598. [Google Scholar] [CrossRef]
- Huang, J. The spatial network structure of energy-environmental efficiency and its determinants in China. Resour. Sci. 2018, 40, 759–772. [Google Scholar]
Disclaimer/Publisher’s Note: The statements, opinions and data contained in all publications are solely those of the individual author(s) and contributor(s) and not of MDPI and/or the editor(s). MDPI and/or the editor(s) disclaim responsibility for any injury to people or property resulting from any ideas, methods, instructions or products referred to in the content. |
© 2023 by the authors. Licensee MDPI, Basel, Switzerland. This article is an open access article distributed under the terms and conditions of the Creative Commons Attribution (CC BY) license (https://creativecommons.org/licenses/by/4.0/).