Article

Attitudinal and Behavioural Differences towards Farm Animal Welfare among Consumers in the BRIC Countries and the USA

1
CISAS—Centre for Research and Development in Agri-Food Systems and Sustainability, Instituto Politécnico de Viana do Castelo, Rua Escola Industrial e Comercial Nun’Álvares, 34, 4900-347 Viana do Castelo, Portugal
2
IUL DINÂMIÁCET, ISCTE-Instituto Universitário de Lisboa, Avenida das Forças Armadas, 1649-026 Lisboa, Portugal
3
Department of Economics and Finance, Durham University, Stockton Road, The Palatine Centre, Durham DH1 3LE, UK
*
Author to whom correspondence should be addressed.
Sustainability 2023, 15(4), 3619; https://doi.org/10.3390/su15043619
Submission received: 4 January 2023 / Revised: 10 February 2023 / Accepted: 14 February 2023 / Published: 16 February 2023
(This article belongs to the Special Issue Food Security and Nutrition and Sustainable Agriculture)

Abstract

:
This study explores cross-cultural differences in consumers’ attitudes toward farm animal welfare (FAW) in BRIC countries. Questionnaires administered in each country contained the following questions: (i) “It is important to me that animals used for food are well cared for”, (ii) “The typical nationality thinks it is important that animals used for food are well cared for”, (iii) “Low meat prices are more important than the well-being of animals used for food”, and (iv) “The typical nationality thinks that low meat prices are more important than the well-being of animals used for food”. Answers were given on a Likert scale (from total disagreement to total agreement). Data fit multinomial logistic models using “Country” and “Gender” as factors and “Age” as a covariate. The results showed that women had stronger pro-animal attitudes. Statements on the perception of FAW importance had an agreement tendency that increased with age, while the opposite was true for meat prices. Brazil showed the highest levels of individual pro-FAW attitudes, and the same trend in relation to meat prices. Russia showed a slightly lower pro-FAW attitude, but the perception of the compatriots’ attitudes towards FAW showed the opposite. Russians in general disagree with low meat prices in exchange for the detriment of FAW. Indians were the least supportive of FAW and, together with the Chinese, were the least supportive of an increase in meat prices to improve FAW. The Chinese showed prominent levels of neutrality towards FAW. These results may contribute to the definition of food and trade policies and help to adjust the supply chain to consumers’ socio-cultural and economic differences.

1. Introduction

During the 21st century, human society has developed an increased interest in food safety, production sustainability, and the welfare of farmed animals [1,2]. The research developments, particularly in animal sentience recognition, together with the societal awareness of the detrimental effects on animals caused by industrialised production systems, have triggered debates [3,4] that have spread from Western societies all over the world [5]. The United Nations Sustainable Development Goals include farm animal welfare [6,7,8]. However, distinct cultures have different perceptions [9,10] and laws [11], and the debate over animal welfare arises in international forums, such as the World Trade Organization (WTO), causing disputes [12]. The WTO has, however, recognised the justification for trade restrictions, following article 20 of the General Agreement on Tariffs and Trade (GATT) achieved under the Uruguay Round. This ruling recognises states’ sovereignty to follow their own animal health and welfare standards and, therefore, justifies trade restrictions.
The globalization of the economy is inevitable, and new players, such as the “BRIC” countries (Brazil, Russia, India, and China), have gained increased importance. These countries alone accounted for more than 40% of the world’s population and over 50% of world’s Gross Agricultural Production in 2018 [13]. The definition of food policies in the BRIC countries may have implications in the world agricultural markets and in global food security [14]. International cooperation is, therefore, necessary to overcome divergences perceived by some as market protectionism, and by others as a consumers’ demand [15]. The World Organization for Animal Health (OIE) aims to promote the development of animal welfare standards based on scientific research. Communication with governments, organizations, and the public is seen as paramount to promoting capacity building and education for the development of animal welfare standards [16].
The implementation of ethical, sustainable, and safe animal production systems is on the horizon of modern society, yet these values are still conflicting with economic interests [17]. In certain countries, such as the UK [18] and the USA [19], the meat industry faces external pressures related to animal welfare. There is a direct relationship between animal welfare, meat, and the quality of other animal products [6,12,17]. Poletto and Hötzel [20] differentiate between two distinct types of economies and socio-political nations: the first spends a minor portion of their personal income on food and particularly on animal protein; as for the second, the personal income spent on these goods accounts for an important part of the household budget. Examples of the former are the USA and EU countries with developed economies, with the latter consisting of the emerging BRIC economies [21]. In these emerging economies, farm animal welfare (FAW) importance and its contribution to safe and ethically sustainable farm animal production is still evolving away from the standards demanded by developed economies [20].
The global population growth and the increasing incomes of middle-class consumers continue to increase the demand for animal-based protein [22]. While some economies demand higher FAW standards, with consumers willing to pay for these, in developing economies, the price may still be a limiting factor, with productivity shadowing FAW [5]. A good illustration of the societal differences in animal protein demand between these two economies may be achieved using Maslow’s hierarchy of needs [23]; while the former is already at the self-esteem level, the latter may still be at the level of satisfaction of physiological needs.
To establish food policies favouring higher levels of hierarchical needs and embracing the cross-cultural differences of various global economies, one needs to understand the factors behind these differences. This is the objective of this study. Using socio-economic variables and consumer preferences, the paper aims to contribute to knowledge by exploring the perspectives of BRIC consumers towards the trade-off between FAW and the animal protein market.

2. Materials and Methods

2.1. Data Sourcing

Data were obtained from Faunalytics. This charity conducted an exploratory study [24] of attitudinal and behavioural differences towards FAW among people in the “BRIC” countries and the USA. Data [25] (Anderson, 2018b) are available from the Faunalytics repository at Open Science Framework.

2.2. Collection of Data

Data were collected from the BRIC countries and the United States using questionnaires previously translated into the languages of the countries being studied. Two bilingual translators executed the translation, and both versions were contrasted and revised for discrepancy checking [26]. The questions in the survey were accurately written and submitted for expert consultation before translation, as is required in cross-cultural surveys [27]. A back-translation implementation was performed to potentialise the language equivalence across countries. Simple and direct wording was a main concern, with the use of symmetrical response scales and positively and negatively framed questions [28]. The complete details of the procedure of this survey can be accessed in the project pre-registration [29]. The data were collected by the market research company YouGov® in May and June of 2018 and were characterised in the following way: The sample in the USA was nationally representative of adults; the samples in Brazil and Russia were representative of adults based around urban areas; the sample in India represented all urban adults; and in China, the sample represented online adults. All participants in the survey were chosen randomly from a panel of volunteers who were over 18 years old. Age and gender were balanced by a stratification strategy.
Data collection included demographic variables (age, gender) and nine survey questions, of which four were used in this study. Interviewees were asked to what degree they disagreed or agreed with the statements that follow:
  • “It is important to me that animals used for food are well cared for”
  • “Low meat prices are more important than the well-being of animals used for food”
  • “The typical nationality thinks it is important that animals used for food are well cared for”
  • “The typical nationality thinks that low meat prices are more important than the well-being of animals used for food”
The information was collected using a Likert scale: (1) strongly disagree; (2) disagree; (3) neither agree nor disagree; (4) agree; (5) strongly agree.
Data were collected by professionals from the company YouGov®. The procedure respected the ethics involved with a guarantee of anonymity and data protection and an explanation for the interviewees of the purpose of the procedure.

2.3. Statistical Analysis

The original dataset was cleaned from outliers through the production of box plots using the Tuckey method. As a result, 28 entries were removed and did not enter the analysis. To research the disagreement or agreement with the statements, the Likert scale entered a multinomial logistic regression as the dependent variable, a function of the demographic variable’s country, age, and gender. The models were tested for significance via the −2 log-likelihood chi-square test, and their parameters were tested via the Wald chi-square test. The relative quality of the models was evaluated through the AIC (Akaike information criterion).
The assumptions for the multinomial logistic regression models were evaluated as follows:
  • The dependent variables were measured at a nominal level with at least three values, which are verified by the use of a Likert scale.
  • Independent variables can be ordinal, continuous, or nominal. Ordinal variables are treated as continuous or categorical. This is verified, as all the variables are ordinal and treated as continuous.
  • The dependent variable needs independent observations and mutually exclusive and exhaustive categories. Independence is guaranteed, as they arise from different individuals.
  • Multicollinearity between independent variables cannot be observed. The correlation between independent variables was used to check this aspect.
  • The linearity between the logit transformation of the dependent variable and any continuous independent variables was checked via the Box–Tidwell transformation test.
  • Outliers were identified and removed.

2.4. Analytical Procedure

The models were adjusted with the five categories of the Likert scale, and afterwards, to facilitate the interpretation of the results, some categories were aggregated: (1) strongly disagree with (2) disagree and (4) agree with (5) strongly agree. Thus, we created three main categories: disagree, neutral, and agree. These categories are represented in the graphs and subject to result interpretation, analysis, and discussion in this study.
The calculation of the probability (Pi) of a citizen of a particular nationality to have given a particular score for the evaluation of each of the statements is calculated with the generic equation:
P i = exp ( X i β i ) 1 + 5 i = 2 exp ( X i β i )
Pi is the probability for scoring each of the “i” scores (2, 3, 4, 5). The parameters of the equations (βiXi) are assembled linearly in the form:
β m X m + β 1 X 1 + β 2 X 2 + β 3 X 1 X m + β 4 X 1 X 2 + β 5 X 1 X 2 + β 6 X 1 X 2 X m
where:
βm is the parameter for “Country: (China, Brazil, India, Russia, and the USA), with Xm being the dummy variable for this parameter. It takes the value “one” when the respective country is in the equation and “zero” if not. β1 is the parameter of the covariate “Age”, and X1 is the age. β2 is the parameter for “Gender” (Female, Male), where X2 is the associated dummy variable, taking the value of “one” for males and “zero” for females. β3, β4, and β5 are the parameters for the 2-way interaction terms (“Age × Country”, “Age × Gender”, and “Country × Gender”, respectively), and β6 is the parameter for the 3-way interaction “Age × Gender × Country”.
Score 1 (strongly disagree) is the reference; therefore, for the calculation of P1 in Equation (1), the numerator assumes the value 1.
The logistic coefficients (β) for the dependent variables in each alternative score of the statement were calculated and represent the expected degree of change in the logit for each unit of change in the predictor. The logit is the membership odds for each score. The closer to zero the logistic coefficient is, the lower the influence of the predictor in predicting the logit. The odds ratio associated with each predictor is defined by exp(β). Predictors increasing the logit have an odds ratio higher than “one”; in those without effect, it equals “one”, and predictors decreasing the logit have an odds ratio lower than “one”.

3. Results

3.1. Study Limitations

This paper uses a quantitative research method, which facilitates the establishment of relationships between dependent variables (gender, age, and country) and independent variables (importance of FAW, trade-off between FAW and meat price, and perception of the compatriots’ positioning regarding these questions). The obtained results provide a cross-sectional picture of the situation, but do not necessarily represent or give an accurate explanation of the reality. The study has limitations regarding the sampling effort of the countries in the study. Despite the large sampling effort of around 1000 interviewees in each country, the diversity of cultures is difficult to entirely cover with a survey. In addition, the sampling strategy implemented by YouGov® is not purely random.

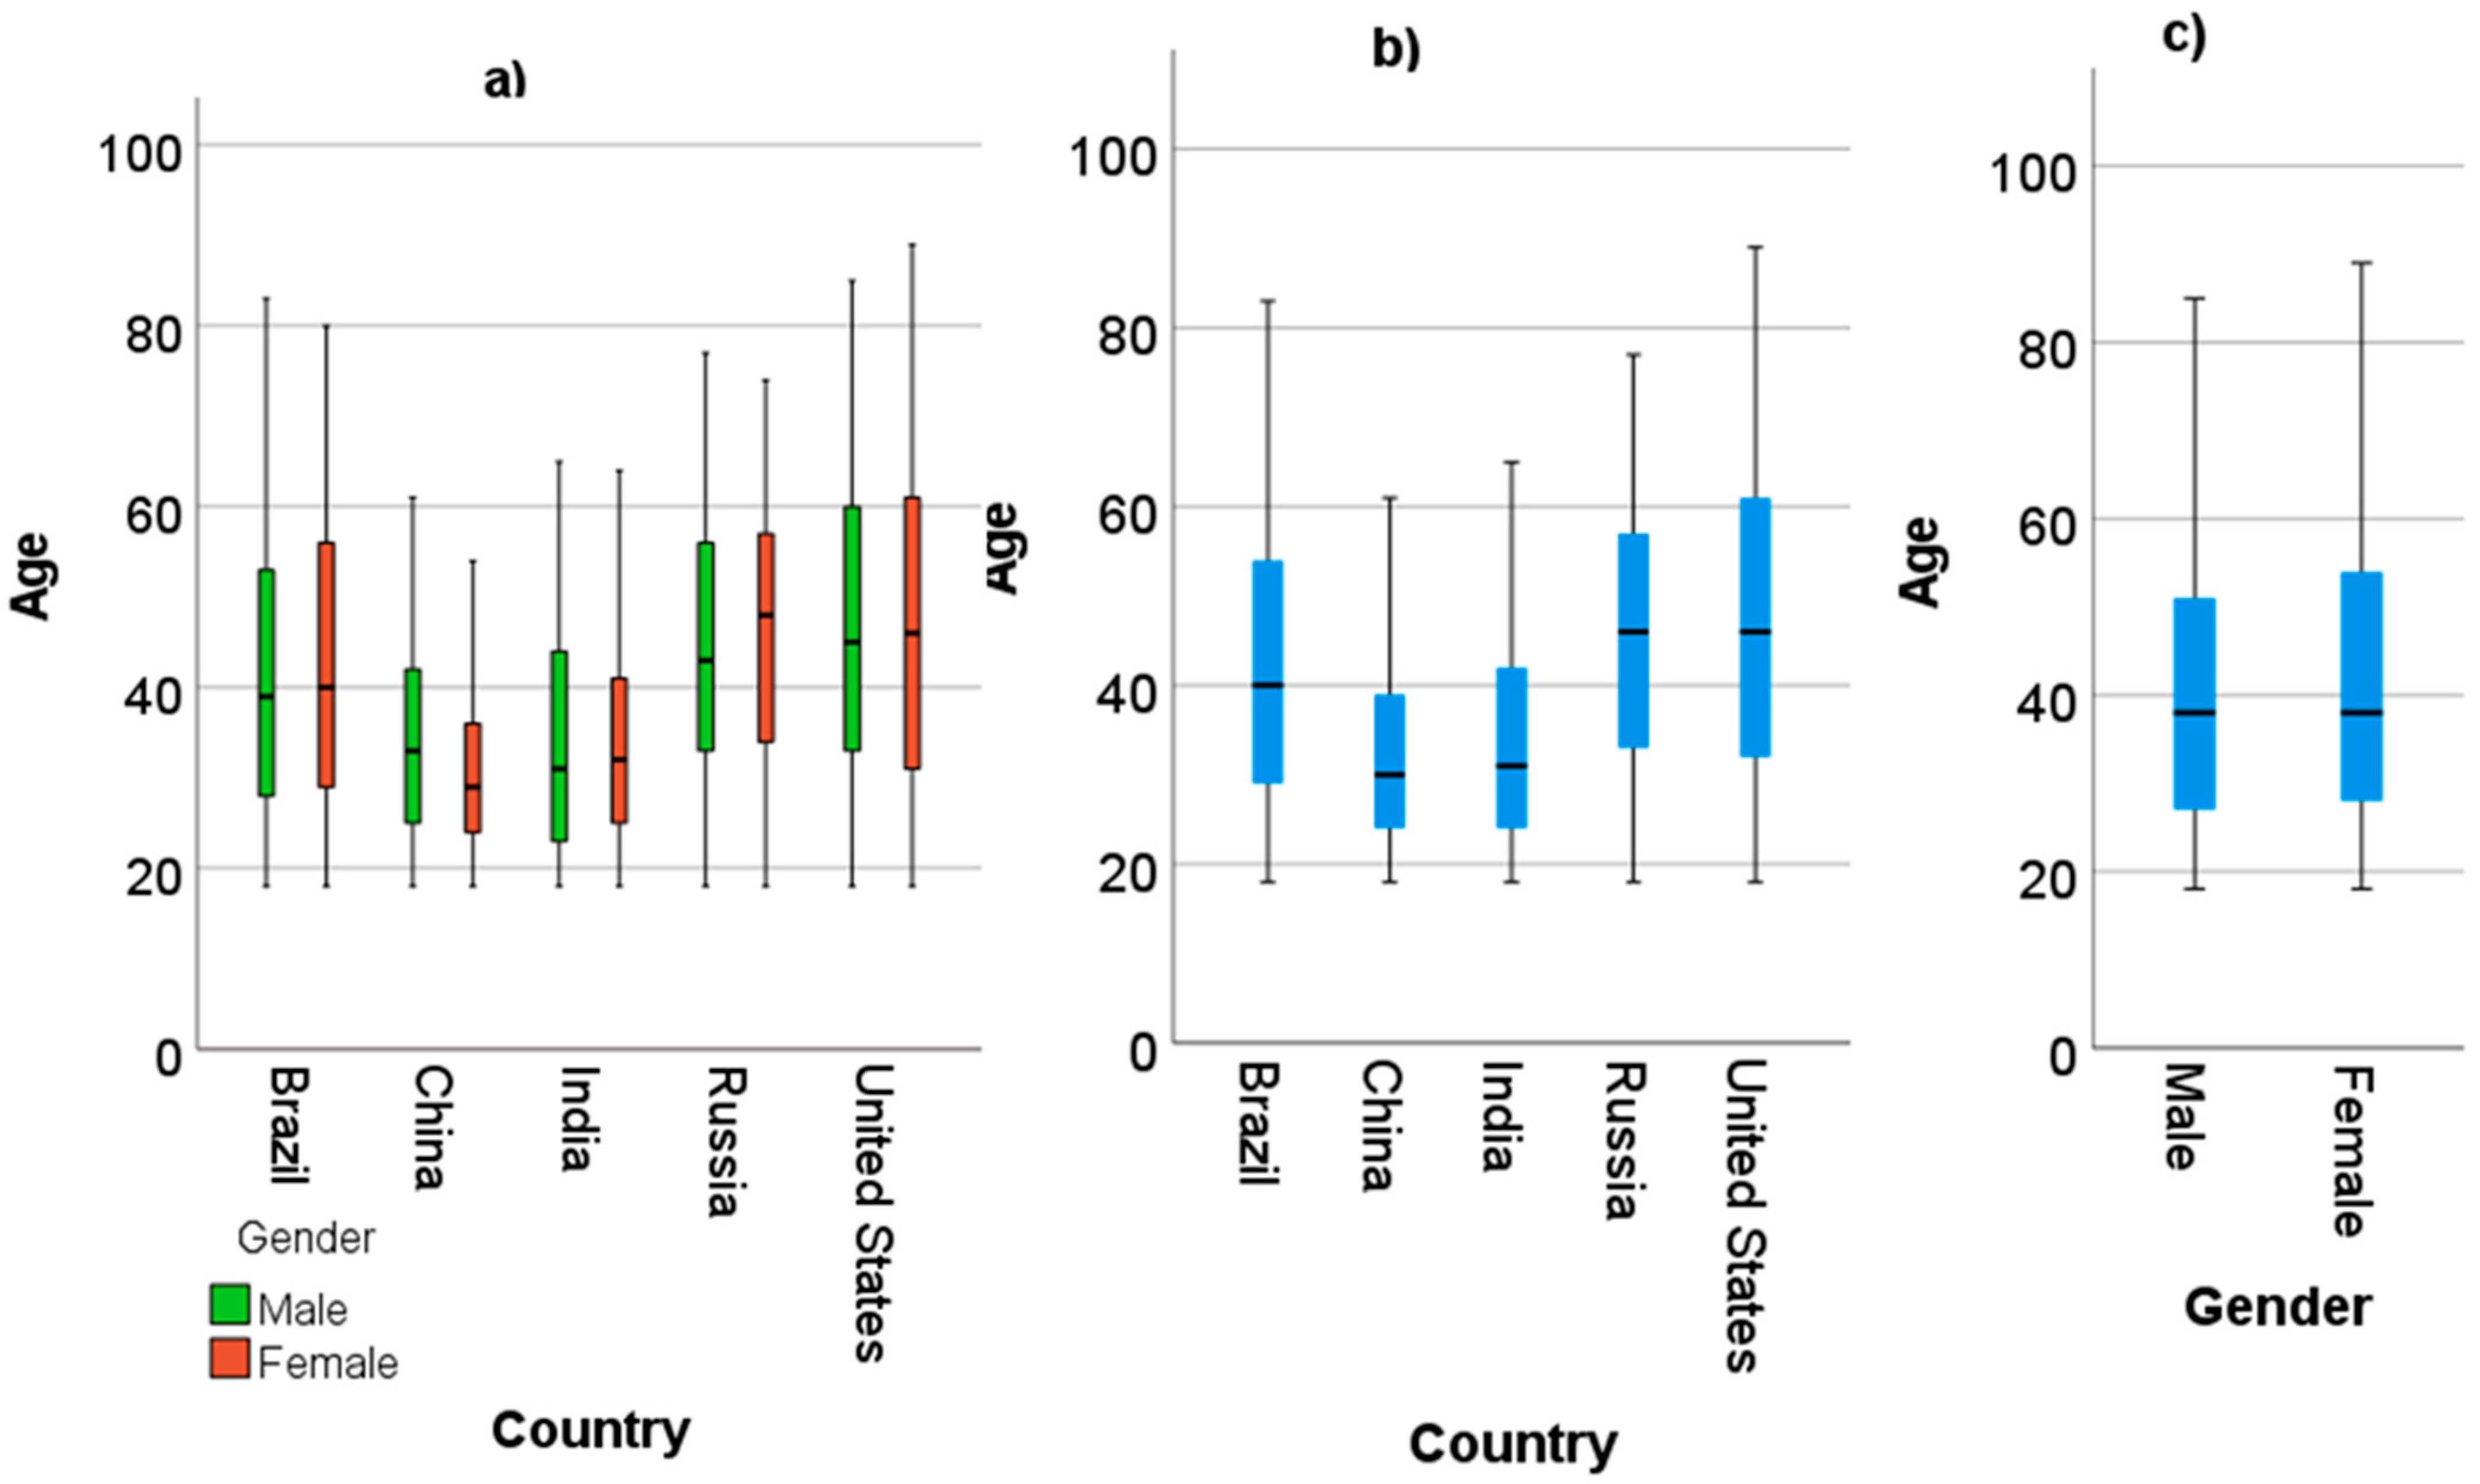
3.2. Descriptive Statistics

In total, N = 5172 persons were subject to analysis (China n = 966, Brazil n = 1027, Russia n = 1002, India n = 1004, and United States = 1173), with a gender distribution of n = 2586 males and n = 2586 females. The distribution of ages by country (Figure 1b) and gender (Figure 1c) shows that the numbers were well-balanced for gender, while for age, they were slightly skewed to younger ages in India and China. If consideration is given to the variables together, a slight skewing can be observed towards older ages for Chinese men. For the other countries, gender had a good balance (Figure 1a).

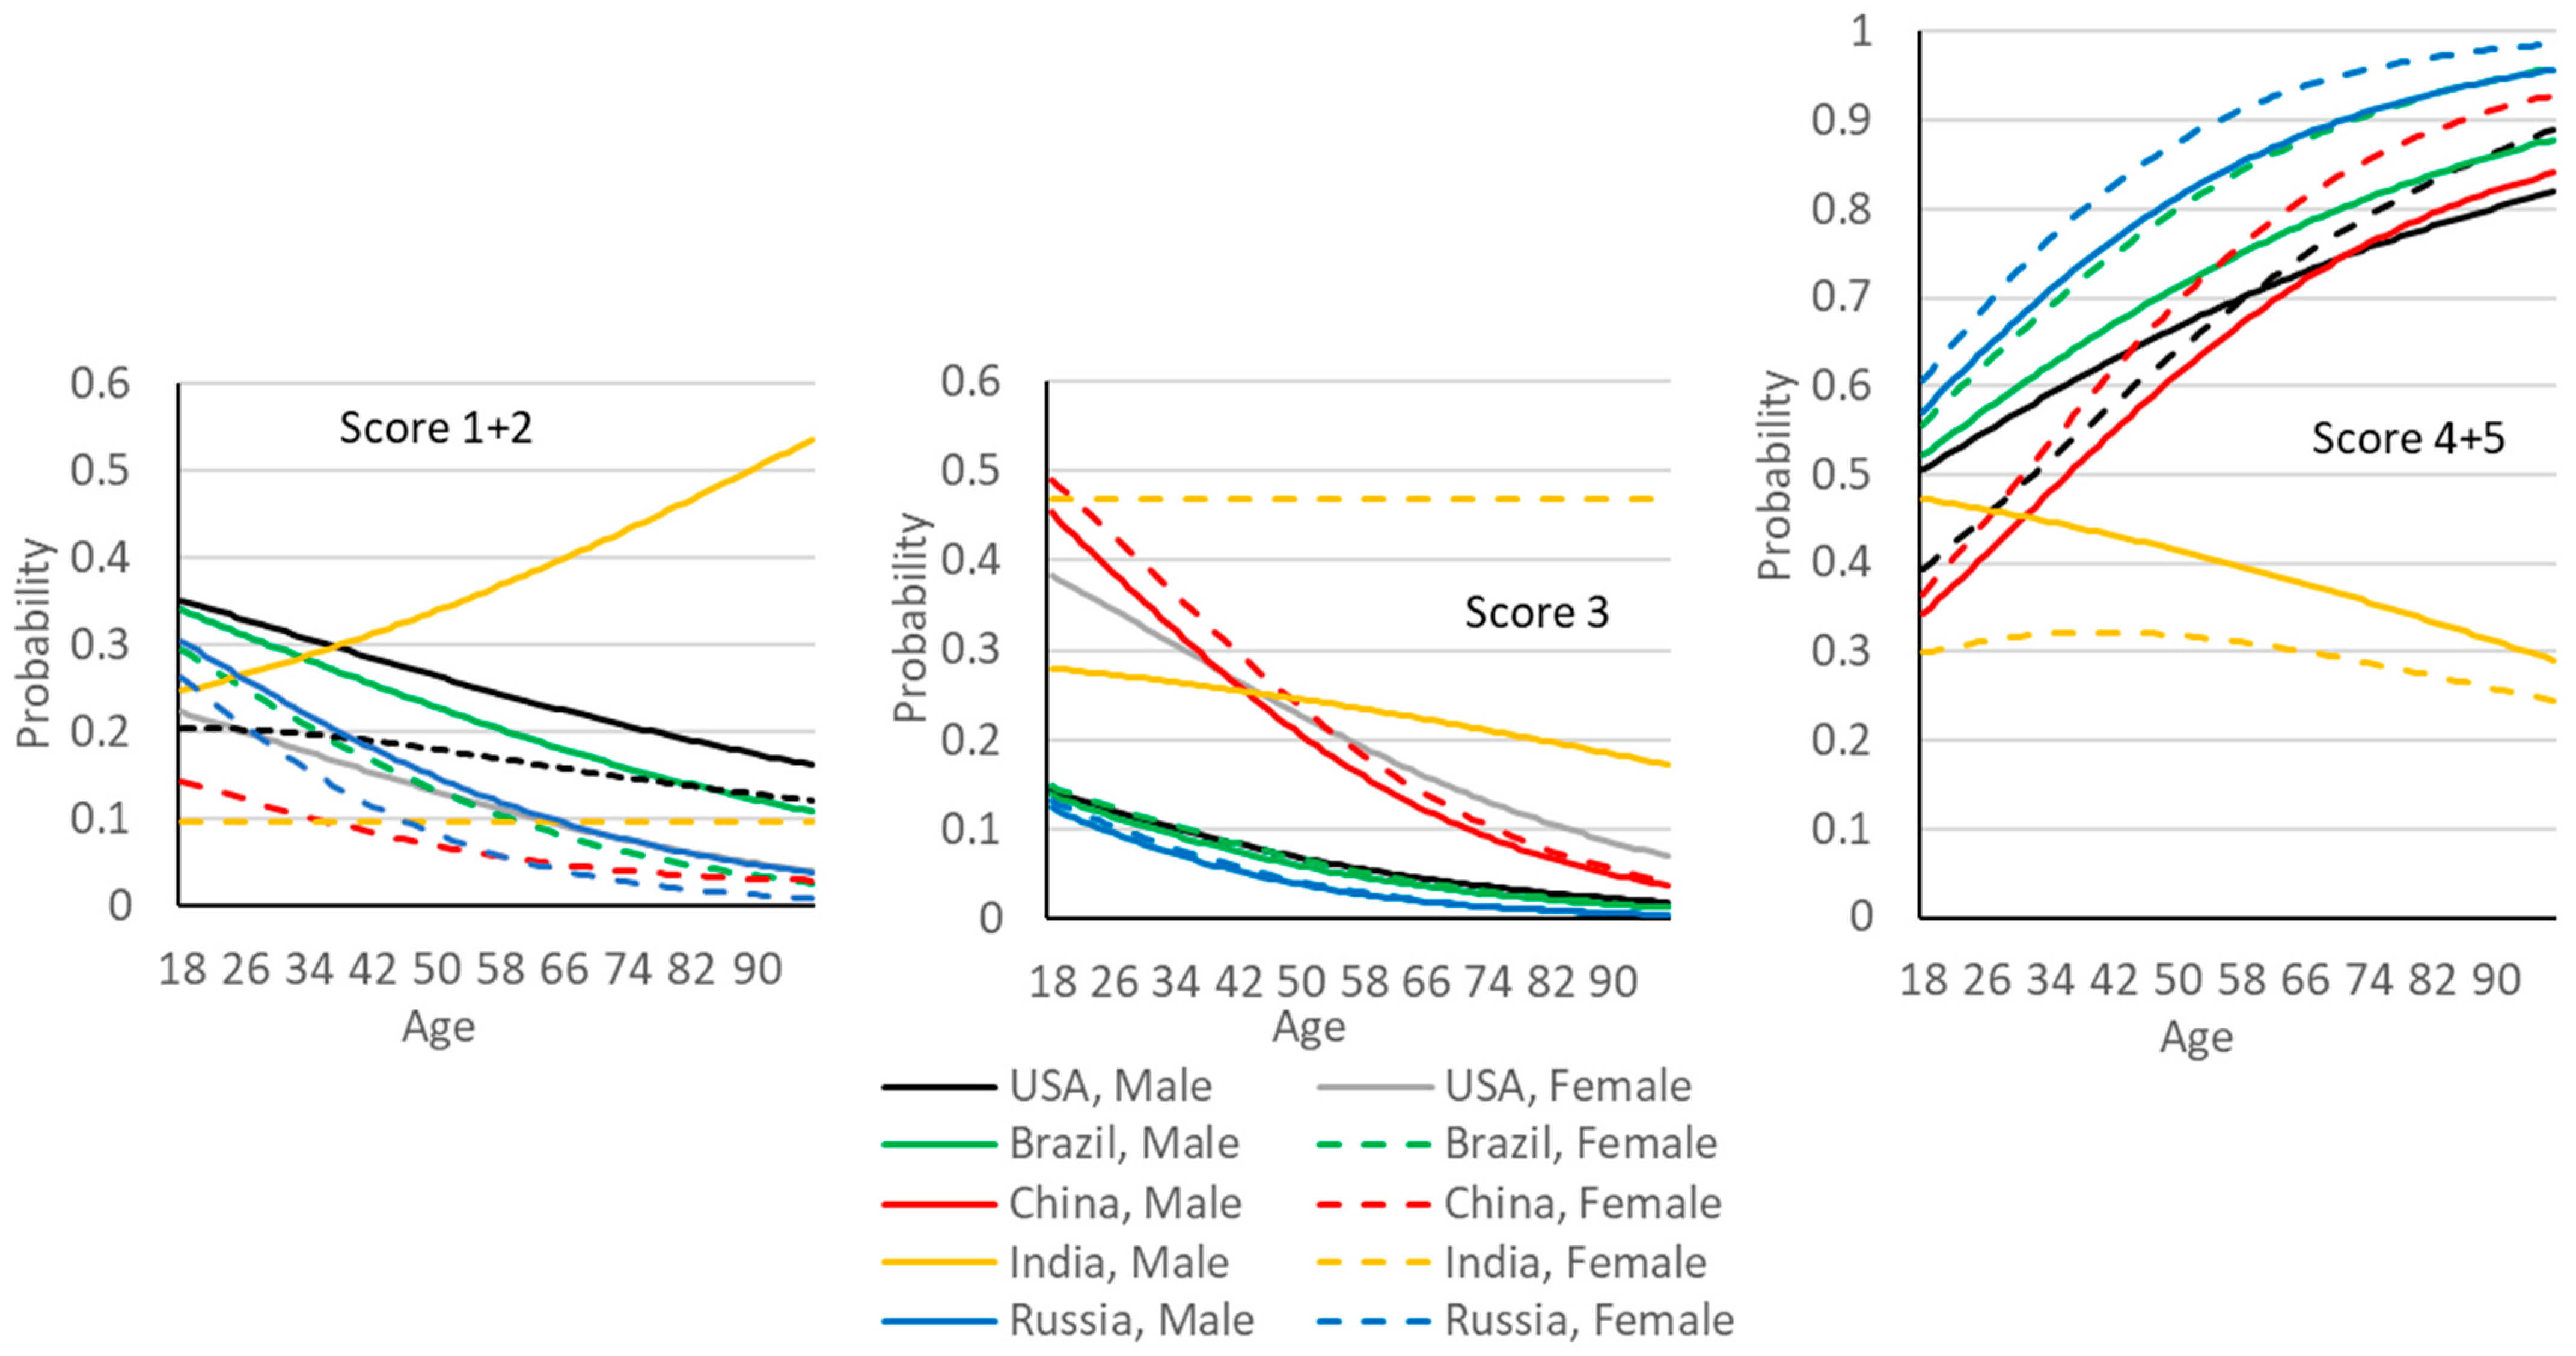
3.3. The Adjusted Models

The multinomial logistic models were successfully adjusted to the data. The main effects were tested together using a forward stepwise inclusion of interactions. The Box–Tidwell transformation test was not significant (p = 0.806) for the variable “Age”, confirming the linear relation between “Age” and “logit(Age)” to meet model assumption five. The correlations between the independent variables were exceptionally low (Table 1), and, therefore, the inexistence of multicollinearity meets assumption four.
The sections that follow address the adjusted models for each of the different statements analysed. Each of the sections shows the degree of adjustment and the parameter estimates of the models, as well as their graphic representations and interpretations.

3.3.1. It Is Important to Me That Animals Used for Food Are Well Cared for

For this statement, the model was found significant (p < 0.001), −2 log likelihood 4592, chi-square (4053, 44df), and AIC 4680. The significant parameters were (−2 log likelihood, chi-square, df, p-value): “Country” (4685, 93, 16, p < 0.001), “Gender” (4656, 64, 4, p < 0.001), and “Age × Country” (4708, 116, 20, p < 0.001). The parameterisation is given in Table 2.
The different coefficients in the scores for the different countries were all > 0, meaning that the odds of scoring values higher than those used as reference (1) were higher. China has a higher coefficient for score 3, meaning that these participants were more likely to answer a score of 3 to the statement than any other participants (higher degree of neutrality). These participants were also the only ones with a significant parameter for score 2, meaning that these were the participants more likely to answer score 2 for the statement. Hence, the main concern of Chinese consumers could be the quality of the food instead of FAW.
On the other hand, Brazilian participants had higher coefficients for scores 4 and 5, and were, therefore, more likely to answer the statements with higher scores.
Men had a negative coefficient for scores 4 and 5, meaning that this gender was less likely to answer with higher scores when compared to women. Age had positive scores for scores 4 and 5; therefore, the odds favoured these scores for older respondents. All of these aspects are comprehensively illustrated in Figure 2.
The country with higher levels of agreement and lower levels of both disagreement and neutrality was Brazil. The effect of age was noticed across all countries but India. Higher levels of agreement (and lower disagreement and neutrality) occurred as age advanced. The age effect was more pronounced in China and less so in Brazil. India was the only country without age effects. In all countries, women had higher levels of agreement and lower levels of both neutrality and disagreement than men did. Taking the USA as a reference, Brazil’s agreement with the statement was well above; India’s was below (except in younger ages); Russia had slightly lower levels of agreement; and China had lower levels of agreement in younger age groups, but higher in the older population.

3.3.2. The Typical Nationality Thinks It Is Important That Animals Used for Food Are Well Cared For

For this statement, the model was found to be significant (p < 0.001), by −2 log likelihood 5352, chi-square (2187, 64df), and AIC 5480. The significant parameters were the two-way interactions (−2 log likelihood, chi-square, df, p-value): “Country × Age” (5393, 40, 16, p < 0.001), “Gender × Age” (5363, 10, 4, p < 0.05), and “Country × Gender” (5584, 232, 40, p < 0.001). The parameterisation of the model is given in Table 3.
Only interactions were considered in this model. Relative to “Country × Age”, Brazil and Russia had higher odds for scores 4 and 5 and, therefore, a higher probability of agreement. Figure 3 comprehensively illustrates the model.
Most individuals have a positive perception of their compatriots’ attitudes towards FAW. Worse perceptions were observed in India. Men were more reticent and showed a higher perception of disagreement. Agreement increased in older people, and disagreement decreased. The exception was India, where a higher degree of disagreement was observed in older people.
In general, younger people were more neutral. India, overall, had a more neutral opinion, especially among women, but also among men of older ages. Brazilian, Russian, and American men had lower levels of neutrality. Agreement increased with age, with India being an exception.
Women had a higher perception of agreement in Russia, China, and Brazil; in India, the opposite was true. In the USA, the perception of agreement was higher in young men and older women, but increased with age in both genders.
Compared to the USA, the perception of agreement was higher in Russia and Brazil and lower in India. China was remarkably similar.
When comparing the national perception with the individual answers, the results were not much different. However, in India, there was a slight age effect, similar to that observed for other countries, with the exception of disagreement, where a tendency for an increase with age was observed. There was also a trend of decreasing neutrality, except for in Indian women, where an increase was observed. Consequently, the degree of agreement decreased for Indian women. In Brazil, the national perception decreased when compared with individual opinions, and in Russia, the national perception of agreement was higher. Brazil and Russia had higher levels of national perception of agreement; China, similar; and India, lower, when compared with the USA.

3.3.3. Low Meat Prices Are More Important than the Well-Being of Animals Used for Food

For this statement, the model was found to be significant (p < 0.001), −2 log likelihood 5350, chi-square (2214, 44df), and AIC 5438. The significant parameters were (−2 log likelihood, chi-square, df, p-value): “Age” (5370, 20, 4, p < 0.001) and the 2-way interaction “Country × Gender” (6273, 923, 40, p < 0.001). The parameterisation of the model is given in Table 4. Figure 4 comprehensively illustrates the model.
This statement was negatively framed in opposition to the first statement; and therefore, the expected levels of agreement/disagreement were the opposite of those observed for the first statement. Overall, this is exactly what can be observed. The gender effect was the opposite, and the age effect tended to be the opposite as well. Some minor differences, however, can be observed: China was the country with the highest degree of both agreement and neutrality, and therefore the lower degree of disagreement. None of the other countries was different from the USA, but Brazil and Russia showed higher levels of disagreement. Levels of agreement increased with age in India and China, especially in men.

3.3.4. The Typical Nationality Thinks That Low Meat Prices Are More Important than the Well-Being of Animals Used for Food

For this statement, the model was found to be significant (p < 0.001) by −2 log likelihood 5547, chi-square (1809, 60df), and AIC 6060. The parameters found to be significant were the 2-way interactions (−2 log likelihood, chi-square, df, p-value) “Country × Age” (5612, 64, 20, p < 0.001), and “Country × Gender” (5889, 342, 40, p < 0.001). The parameterisation of the model is given in Table 5. Figure 5 illustrates the model.
Interestingly, the national perceptions of this statement show some differences from individual opinions. In general, the levels of neutrality tended to decrease slightly, impacting the other scores. The level of agreement increased in younger ages for Brazilians, Russian men, Indians, and especially Americans. We, therefore, infer that individuals in these countries have a negative perception of their compatriots from an economical point of view. The Americans are those with the best pro-FAW perception of their compatriots, especially younger men. Brazilian women have similar perceptions to those of American women, but Brazilian men compare worse with the Americans. There were no age effects in the Chinese and Indian populations, which resulted in similar levels of agreement for older Indians and Americans. The Chinese were slightly below, but comparable with, the Brazilians for older respondents. The levels of neutrality were especially high for the Chinese.

4. Discussion

4.1. Gender Effect

Women have a higher level of pro-FAW attitudes than men. This gender effect is felt in all the questions, but there are exceptions: the Indian women’s perception about their compatriots for both questions, where an elevated level of neutrality was shown; and the Brazilian women’s perception of their compatriots for the question regarding low meat prices being more important than welfare.
Women are much more protective of animals than men [30]. Women are much more likely to be involved in animal advocacy and protection; more likely to hoard animals; and much less likely to hunt, fish, or engage in direct animal abuse [31,32]. When compared to men, women have a higher degree of perception of animal sentience [33]. The human animal has evolved with men and women having different societal roles. Men have been more involved in hunting and, therefore, evolved less emotionally and developed more utilitarian feelings towards animals; on the other hand, women have perceived animals as food sources, but have also evolved being socialised to care and nurture, therefore developing more moralistic feelings towards animals [34,35]. As this gender attitude difference is innate, it is without surprise that our study observed the reported differences between men and women. Even in Western societies, where women’s empowerment prevails, these same differences have been observed [36]. Worldwide and regardless of country or culture, these same gender-based differences have been identified [30].

4.2. Age Effect

For the first two statements focused on the individual and the national perception of the importance of FAW, we observed a tendency for agreement to increase with age. The last two statements focused on the individual and the national perceptions of the importance of low meat prices; as opposed to better FAW, agreement was more prevalent in younger age groups. In the individual perceptions, there was a slightly increasing tendency for disagreement across ages, with USA and Brazil, especially American males, to have higher slopes. In the national perception, the disagreement lines were flat except for the USA, Brazil, and Russian men, where increased disagreements were observed as age advanced. Low meat prices are, therefore, more important for younger ages, and overall pro-FAW attitudes increase with age.
These results, somehow, come as a surprise. The younger generations have grown up with advancements in animal rights, FAW claims, and legal recognition of animal sentience, and are normally associated with higher pro-animal attitudes [1,37] and consumer willingness to pay for better FAW standards [38]. The economic constraints faced by these younger generations [39,40] may have impacted these results. It is well known that younger generations are leading the move away from animal protein [41]; however, meat consumption is growing in the emerging BRIC economies [42,43,44,45], and even in Western societies such as the USA [46] and the OECD countries [45].
Interviewees in BRIC countries had the worst perception of their other compatriots from an economical point of view, as introduced in the Section 3. They showed a lower level of disagreement with low meat prices in opposition to higher FAW standards than what they perceived regarding their compatriots. This perception may drive the youth to richer meat diets, as there are several studies relating to perceived health with socio-economic status, showing that people with subjective lower incomes have a worse perception of their subjective health status [47]. Several studies have also concluded that other demographic variables (income, education) associated with wealth correlate positively with the consumers’ demand for better FAW standards [48]; and as these variables did not enter this study, there is no means to further comment on an eventual bias. In addition, an important aspect and eventual limitation of this study is that most of the studies reporting a negative association between age and pro-FAW attitudes were conducted in Europe and/or the USA, thus excluding emerging economies. It is exactly in these emerging economies that meat consumption is increasing, as the youth in these countries aim for Western living standards.

4.3. Country Effect

The USA showed relatively high levels of individual pro-FAW attitudes, but were surpassed, however, by the Brazilians and older Chinese. The Americans were between the countries with the worst perception of their fellow countrymen in relation to positive pro-FAW attitudes. The difficulties in passing Federal FAW legislation and the need for the companies to self-impose trading standards demanded by strong pro-FAW movements, as discussed by Mata and colleagues [11], may contribute to this perspective.
The consumption of meat in the USA is remarkably high in comparison to the other countries in this study (Table 6). The USA is also the country with the highest GDP per capita of the studied countries. Once most people in the USA feel economically comfortable in relation to food, we could expect a trade-off between FAW and meat price to favour FAW. This is, in fact, true; however, Brazilians and Russians (except the elderly) favour FAW even more. In fact, in the USA, younger men are among the least supportive of high meat prices to favour FAW, being only surpassed by the Chinese. The perception relative to compatriots is definitively very odd, and Americans perceive their compatriots as unsupportive of a trade-off for meat prices favouring FAW.
Our results tally those obtained by Neff and colleagues [49]; while studying the reduction in meat consumption in the USA, these authors found that two-thirds of the Americans would be willing to do so, but due to price and health reasons only. Environment and FAW were options for a reduction in meat consumption for only 12% of the population. Tonsor and Lusk [50] reported equivalent results, identifying price as a cause of major concern and animal welfare as a cause of minor concern in meat purchasing. Consumerism in the USA is still finding room for meat consumption expansion. The lobby of meat producers is very strong and exerts influence on the public via TV commercials. Lewis [51] refers to this influence in a study where he found that individuals more exposed to media content dissociated meat from its animal origin more often and ate more meat. It is predicted that despite the high consumption of meat per capita in the USA, demand will still be rising in the near future [50].
Brazil was the country in this study with the highest levels of individual pro-FAW attitudes. The perception of the importance of FAW, relative to compatriots, however, did not differentiate from the other countries in the study. In relation to the importance of low meat prices, the pro-FAW attitude also prevailed. The only difference in the latter was that the perception of compatriots’ attitudes was clearly above that of the other countries in this study, while individual perceptions did not differentiate. These results were corroborated by Magalhaes and colleagues [52], who reported welfare as one of the main confidence attributes for Brazilians when purchasing and consuming beef.
Despite being an emerging economy, Brazil is a nation where meat consumption levels are high (see Table 6 for comparison). The natural resources, especially farming potential, favour animal production; therefore, meat production has always been accessible. The crucial issues are related to the lack of hygiene in local butchers and free fairs selling uninspected meat, especially to consumers in rural areas with lower levels of education and purchasing power [53]. In urban areas, consumers tend to have higher levels of education and purchasing power and are also associated with higher levels of ethical concerns at the time of buying meat, which takes place preferably in supermarkets [53]. Therefore, according to the same authors, in rural areas, the main consumer concern was price, while in urban areas, FAW and forest sustainability were more often the consumers’ choice. The fact that the sample of the Brazilians was based on urban areas may reflect these results. Brazilians have a long tradition of eating meat; however, the consumption per capita has rapidly increased recently and Brazil is a main consumer of beef [54]. Brazil is the world’s second-largest producer of beef and is the fifth-largest exporter of live cattle, with China being a main destination [52].
Russia showed a slightly lower attitude towards FAW, especially in older respondents, with India scoring just below. However, the perception of their compatriots’ attitudes towards FAW was completely different. Russians had the most favourable perceived national attitude towards FAW, across all ages. Russians showed a higher level of disagreement with the statement favouring meat prices to the detriment of FAW. It was also the only country where the level of disagreement decreased with age. Therefore, in these findings, the youth behaved differently when compared to the other BRIC countries and the USA. The perception of compatriots’ attitudes also showed prominent levels of disagreement with the statement favouring low meat prices, only overtaken by Brazil. However, the agreement with low meat prices was remarkably high in older men.
The meat-eating patterns in Russia are above average. The consumption of meat and dairy was promoted in the Soviet era and prevails today. Only the economic crises from 1990 to 1995 assisted in a decrease, which quickly reverted thereafter [55]. The officially recommended meat intakes in Russia are remarkably high (70–75 kg/year) when compared with other emerging economies, such as China (18.3 to 36.5 kg/year) and Western societies such as the USA (62 kg/year) and Germany (31.3 kg/year) [56]. The meat market in Russia has been developing towards self-sufficiency in meat production [57].
India is the only country where, relative to the two first statements, the agreement did not increase with age. In the individual perceptions about the importance of FAW, there was no age effect. However, the perception of the compatriots showed a decrease with age for agreements with FAW importance. This same trend can be observed for the statements referring to higher importance of low meat prices than FAW. Age had almost no effect on disagreement; however, the agreement clearly increased with age. Relative to the perception of the compatriots’ attitudes, age effects are not observed. As discussed before, this was somehow the expected result across all countries; however, as explained, the opposite is the observed tendency.
Compared to the other countries in this study, Indians were the least supportive of FAW, and together with the Chinese, were the least supportive of an increase in meat prices to improve FAW. India is itself a multicultural nation, but with a predominantly Hindu culture. The Hindu culture praises vegetarianism, and while strict vegetarianism is still in the minority among Indians, the practice remains a societal ideal [58]. As a result, India is among the countries with lower levels of meat consumption per capita/per year (Table 6). However, an increase in consumption, especially of poultry but also including beef, has been observed, particularly in younger generations and lower castes [59]. Purchase power and the influence of Western culture have been identified as the main factors driving this shift [59]. As a result, meat animal farming and the meat processing and retailing industry have been growing considerably [60]. Indians, due to cultural and religious traditions, traditionally have a pro-FAW attitude, and this moulds their perception of the population’s attitudes towards animals, including FAW [44]. However, this study shows that Indians compare worse with the others relative to FAW.
The Chinese respondents showed elevated levels of neutrality towards FAW, especially in youth, which impacted their overall attitude. However, this is the country where the highest shift across ages was observed, with older individuals showing prominent levels of support for FAW. This is mainly due to a decrease in the levels of neutrality. Similar trends are observed with reference to the perception of the compatriots’ attitudes towards FAW. With reference to the statements of the importance of low meat prices, neutrality was, again, extremely high, and the country had extremely low levels of disagreement, therefore supporting low meat prices. The perception of their compatriots’ attitude showed similar trends.
Nutritional deprivation has been an important constraint in Chinese society throughout its history, especially in rural areas [61]. Especially from the 1980s, the emergence of the Chinese economy has tackled this issue. The growth in household income improved the living standards, with an impact on the nutritional status of the population [62]. Meat consumption has increased steadily, especially in rural areas, and dairy products have become an important part of the diet [56].

4.4. The BRIC Countries’ Role in International Trade

In the BRIC countries, culture and interests diverge despite the convergence of economic indicators [63]. The trade of food between these countries is also different; China is a leading food importer, but Brazil and Russia (not meat, but especially grain) are mainly exporters [63,64]. China’s food imports were USD 9.9 billion in 2001 and increased to USD 126 billion in 2018, representing 8.3% of the food trade in the world [65]. These authors identified China as the largest food importer from 19 countries, including Brazil and Russia. As such, China is not a major exporter of meat; therefore, poor FAW does not directly impact the economy. China is also a global leader in the production of animal protein (poultry, pork, dairy, and wildlife products) [66]; however, there is a deficit of consideration for farm animal welfare [67]. With its continued economic development, China’s growing middle class is placing greater emphasis on the importance of food safety and quality, especially after important scandals such as the deadly milk, the cooking oil cut with raw sewage, or the clenbuterol pork poisoning [65,68].
Brazil is a major exporter of meat; therefore, restrictions may be imposed if the products do not follow the FAW standards of the importing countries. In Brazil, the producers and the food industry are being encouraged to engage in animal welfare-enhancing practices, and to label their products with information on the husbandry system to reach out to concerned consumers [69]. This fact, according to the same authors, has a potential impact on the consumers’ attitudes towards FAW. In fact, as discussed before, Brazil is the country in this study with the highest levels of individual pro-FAW attitudes.
The European Union proposed animal welfare standards in the WTO forum back in 2000; however, India (and other countries) opposed these, as they opted to prioritise the alleviation of human hunger and poverty [70]. India stressed that countries should be left to set their own standards, rejecting a FAW labelling proposal.

5. Conclusions

Consumers’ attitudes and behaviours towards FAW varied immensely between the countries studied. This is a result of cultural and economic differences, but it is also a reflection of the different pace at which animal welfare science is progressing in different countries. Overall, these differences result in varying influences on the policymakers of the different countries. For fair global trade, however, the production standards cannot differ; otherwise, the trading competition rules become biased. Animal welfare standards, despite being beneficial for the quality of animal products, have a cost. Countries with more advanced FAW policies may impose importing embargoes to protect internal production and consumers. Trading barriers may be received reluctantly and perceived as protectionism. These, however, are legal under GATT article 20, which allows the imposition of trading barriers on the basis of ethical reasons. Therefore, the harmonization of standards in the WTO is desirable.

Author Contributions

Conceptualization, F.M.; methodology, F.M.; formal analysis, F.M.; investigation, F.M.; data curation, F.M.; writing—original draft preparation, F.M. and M.D.-S.; writing—review and editing, F.M., M.D.-S. and J.C.; visualization, F.M.; supervision, F.M.; project administration, F.M. All authors have read and agreed to the published version of the manuscript.

Funding

This research received no external funding.

Institutional Review Board Statement

The data in this study were collected by professionals from the company YouGov®, and the procedure respected the ethics involved with anonymity, data protection, and explaining to the interviewees the purpose of the procedure.

Informed Consent Statement

Informed consent was obtained from all subjects involved in the study.

Data Availability Statement

The data used in this study are available in the Open Science Framework repository: Anderson, J., 2018. BRIC dataset.sav [data set]. Faunalytics page in the Open Science Framework repository. Retrieved 12 March 2022 from https://osf.io/stbxc/.

Acknowledgments

To the Foundation for Science and Technology (FCT, Portugal) for financial support to the CISAS UIDB/05937/2020 and UIDP/05937/2020, including the contract of the first author. To the Charity Faunalytics (Olympia USA) for sharing the data and encouraging this research.

Conflicts of Interest

The authors declare no conflict of interest.

References

  1. Alonso, M.E.; González-Montaña, J.R.; Lomillos, J.M. Consumers’ concerns and perceptions of farm animal welfare. Animals 2020, 10, 385. [Google Scholar] [CrossRef] [PubMed] [Green Version]
  2. Kassis, G.; Bertrand, N.; Pecqueur, B. Rethinking the place of agricultural land preservation for the development of food systems in planning of peri-urban areas: Insights from two French municipalities. J. Rural Stud. 2021, 86, 366–375. [Google Scholar] [CrossRef]
  3. Buddle, E.A.; Bray, H.J.; Ankeny, R.A. “Of course we care!”: A qualitative exploration of Australian livestock producers’ understandings of farm animal welfare issues. J. Rural Stud. 2021, 83, 50–59. [Google Scholar] [CrossRef]
  4. Mata, F. A Framework for using epidemiology in animal welfare science. J. Appl. Anim. Welf. Sci. 2021. Advance online publication. [Google Scholar] [CrossRef]
  5. Vanhonacker, F.; Verbeke, W. Public and consumer policies for higher welfare food products: Challenges and opportunities. J. Agric. Environ. Ethics 2014, 27, 153–171. [Google Scholar] [CrossRef]
  6. Buller, H.; Blokhuis, H.; Jensen, P.; Keeling, L. Towards Farm Animal Welfare and Sustainability. Animals 2018, 8, 81. [Google Scholar] [CrossRef] [Green Version]
  7. Keeling, L.; Tunón, H.; Olmos Antillón, G.; Berg, C.; Jones, M.; Stuardo, L.; Swanson, J.; Wallenbeck, A.; Winckler, C.; Blokhuis, H. Animal welfare and the United Nations sustainable development goals. Front. Vet. Sci. 2019, 6, 336. [Google Scholar] [CrossRef]
  8. Olmos Antillón, G.; Tunón, H.; De Oliveira, D.; Jones, M.; Wallenbeck, A.; Swanson, J.; Blokhuis, H.; Keeling, L. Animal welfare and the united nations’ sustainable development goals—Broadening students’ perspectives. Sustainability 2021, 13, 3328. [Google Scholar] [CrossRef]
  9. Garcia, A.; McGlone, J.J. Animal welfare and the acknowledgment of cultural differences. Animals 2022, 12, 474. [Google Scholar] [CrossRef]
  10. Mata, F.; Jaeger, B.; Domingues, I. Perceptions of farm animal sentience and suffering: Evidence from the BRIC countries and the United States. Animals 2022, 12, 3416. [Google Scholar] [CrossRef]
  11. Mata, F.; Araujo, J.; Soares, L.; Cerqueira, J.L. Local people standings on existing farm animal welfare legislation in the BRIC countries and the USA. Comparison with Western European Legislation. J. Appl. Anim. Welf. Sci. 2022. Advance online publication. [Google Scholar] [CrossRef] [PubMed]
  12. Grethe, H. The economics of farm animal welfare. Annu. Rev. Resour. Econ. 2017, 9, 75–94. [Google Scholar] [CrossRef]
  13. Ren, Y.; Li, Z.; Wang, Y.; Zhang, T. Development and prospect of food security cooperation in the BRICS countries. Sustainability 2020, 12, 2125. [Google Scholar] [CrossRef] [Green Version]
  14. Brink, L.; Orden, D.; Datz, G. BRIC agricultural policies through a WTO lens. J. Agric. Econ. 2013, 64, 197–216. [Google Scholar] [CrossRef] [Green Version]
  15. Bracke, M. Animal Welfare in a Global Perspective—A Survey of Foreign Agricultural Services and Case Studies on Poultry, Aquaculture and Wildlife; Wageningen, U. R. Livestock Research: Lelystad, The Netherlands, 2009. [Google Scholar]
  16. OIE. OIE Global Animal Welfare Strategy; World Organization of Animal Health, Ed.; OIE: Paris, France, 2017. [Google Scholar]
  17. Gibson, T.F.; Jackson, E.L. The economics of animal welfare. Rev. Sci. Et Technol. Off. Int. Des Épizooties 2017, 36, 125–135. [Google Scholar] [CrossRef] [PubMed]
  18. Hobbs, J.E. Transaction costs and slaughter cattle procurement: Processors’ selection of supply channels. Agribus. Int. J. 1996, 12, 509–523. [Google Scholar] [CrossRef]
  19. Byrd, E.S.; Widmar, N.J.O.; Gramig, B.M. Presentation matters: Number of attributes presented impacts estimated preferences. Agribus. Int. J. 2018, 34, 377–389. [Google Scholar] [CrossRef]
  20. Poletto, R.; Hötzel, M.J. The Five Freedoms in the global animal agriculture market: Challenges and achievements as opportunities. Anim. Front. 2012, 2, 22–30. [Google Scholar] [CrossRef] [Green Version]
  21. Thorstensen, V.; Ferraz, L. The BRICS and the challenges of global economic governance. In Brasil nas Ondas do Mundo; Valente, I., Oliveira, I., Vasconcelos, A., Eds.; Universidade de Coimbra: Coimbra, Portugal, 2017; pp. 117–160. [Google Scholar]
  22. Altmann, B.; Anders, S.; Risius, A.; Mörlein, D. Information effects on consumer preferences for alternative animal feedstuffs. Food Policy 2022, 106, 102192. [Google Scholar] [CrossRef]
  23. Maslow, A. Motivation and Personality; Prabhat Prakashan: New Delhi, India, 1981. [Google Scholar]
  24. Anderson, J.; Tyler, L. Attitudes toward Farmed Animals in the BRIC Countries; Faunalytics: Olympia, WA, USA, 2018. [Google Scholar]
  25. Anderson, J. BRIC dataset.sav; Open Science Framework 2018. [dataset]. Available online: https://osf.io/qjp8k/ (accessed on 13 March 2022).
  26. Johnson, T. Approaches to equivalence in cross-cultural and cross-national survey research. In Cross-Cultural Survey Equivalence; Harkness, J., Ed.; Zentrum für Umfragen, Methoden und Analysen: Mannheim, Germany, 1998; Volume 3, pp. 1–40. [Google Scholar]
  27. Straus, M. Phenomenal Identity and Conceptual Equivalence of Measurement in Cross-National Comparative Research. J. Marriage Fam. 1969, 31, 233–239. [Google Scholar] [CrossRef]
  28. Smith, T. Improving Cross-national survey research by measuring the intensity of response categories. In GSS Cross-National Report, Issue CNR17 Improving Crossnational Survey Research by Measuring the Intensity of Response Categories; University of Chicago: Chicago, IL, USA, 1997. [Google Scholar]
  29. Anderson, J. Attitudes toward Farmed Animals in BRIC Countries: Pre-Registration, 2018; [project pre-registration]; Faunalytics: Olympia, WA, USA, 2018; Available online: https://osf.io/stbxc/ (accessed on 13 March 2022).
  30. Randler, C.; Adan, A.; Antofie, M.-M.; Arrona-Palacios, A.; Candido, M.; Boeve-de Pauw, J.; Demorhan, E.; Detsis, V.; Di Millia, L.; Fančovičová, J.; et al. Animal welfare attitudes: Effects of gender and diet in university samples from 22 countries. Animals 2021, 11, 1893. [Google Scholar] [CrossRef] [PubMed]
  31. Herzog, H. Gender differences in human–animal interactions: A Review. Anthrozoös 2007, 20, 7–21. [Google Scholar] [CrossRef] [Green Version]
  32. Kruse, C. Gender, views of nature, and support for animal rights. Soc. Anim. 1999, 7, 179–198. [Google Scholar] [CrossRef]
  33. Walker, J.; McGrath, N.; Nilsson, D.; Waran, N.; Phillips, C. The role of gender in public perception of whether animals can experience grief and other emotions. Anthrozoös 2014, 27, 251–266. [Google Scholar] [CrossRef]
  34. Herzog, H.; Betchart, N.; Pittman, R.B. Gender, sex role orientation, and attitudes toward animals. Anthrozoös 1991, 4, 184–191. [Google Scholar] [CrossRef]
  35. Knight, S.; Vrij, A.; Cherryman, J.; Nunkoosing, K. Attitudes towards animal use and belief in animal mind. Anthrozoös 2004, 17, 43–62. [Google Scholar] [CrossRef] [Green Version]
  36. Phillips, C.; Izmirli, S.; Aldavood, J.; Alonso, M.; Choe, B.; Hanlon, A.; Handziska, A.; Illman, G.; Keeling, L.; Kennedy, M.; et al. An international comparison of female and male students’ attitudes to the use of animals. Animals 2011, 1, 7–26. [Google Scholar] [CrossRef]
  37. Clark, B.; Stewart, G.; Panzone, L.; Kyriazakis, I.; Frewer, L. A systematic review of public attitudes, perceptions and behaviours towards production diseases associated with farm animal welfare. J. Agric. Environ. Ethics 2016, 29, 455–478. [Google Scholar] [CrossRef] [Green Version]
  38. Clark, B.; Stewart, G.; Panzone, L.; Kyriazakis, I.; Frewer, L.J. Citizens, consumers and farm animal welfare: A meta-analysis of willingness-to-pay studies. Food Policy 2017, 68, 112–127. [Google Scholar] [CrossRef] [Green Version]
  39. McDonald, N. Are millennials really the “go-nowhere” generation? J. Am. Plan. Assoc. 2015, 81, 90–103. [Google Scholar] [CrossRef]
  40. Milotay, N. Next Generation or Lost Generation? Children, Young People and the Pandemic; European Parliament: Strasbourg, France, 2020; Available online: https://www.europarl.europa.eu/RegData/etudes/BRIE/2020/659404/EPRS_BRI(2020)659404_EN.pdf (accessed on 12 November 2022).
  41. Mundy, P. (Ed.) Meat Atlas: Facts and Figures about the Animals We Eat, 1st ed.; Heinrich Böll Stiftung. Friends of the Earth Europe. Bund für Umwelt und Naturschutz: Berlin, Germany, 2021. [Google Scholar]
  42. Happer, C.; Wellesley, L. Meat consumption, behaviour and the media environment: A focus group analysis across four countries. Food Secur. 2019, 11, 123–139. [Google Scholar] [CrossRef] [Green Version]
  43. He, Y.; Yang, X.; Xia, J.; Zhao, L.; Yang, Y. Consumption of meat and dairy products in China: A review. Proc. Nutr. Soc. 2016, 75, 385–391. [Google Scholar] [CrossRef] [PubMed] [Green Version]
  44. Khara, T.; Riedy, C.; Ruby, M. A cross cultural meat paradox: A qualitative study of Australia and India. Appetite 2021, 164, 105227. [Google Scholar] [CrossRef] [PubMed]
  45. Whitton, C.; Bogueva, D.; Marinova, D.; Phillips, C. Are we approaching peak meat consumption? Analysis of meat consumption from 2000 to 2019 in 35 countries and its relationship to gross domestic product. Animals 2021, 11, 3466. [Google Scholar] [CrossRef] [PubMed]
  46. Hahn, E.; Gillogly, M.; Bradford, B. Children are unsuspecting meat eaters: An opportunity to address climate change. J. Environ. Psychol. 2021, 78, 101705. [Google Scholar] [CrossRef]
  47. Cialani, C.; Mortazavi, R. The effect of objective income and perceived economic resources on self-rated health. Int. J. Equity Health 2020, 19, 196. [Google Scholar] [CrossRef] [PubMed]
  48. Ritchie, H.; Roser, M. Meat and Dairy Production. Available online: https://ourworldindata.org/meat-production (accessed on 10 November 2022).
  49. Neff, R.; Edwards, D.; Palmer, A.; Ramsing, R.; Righter, A.; Wolfson, J. Reducing meat consumption in the USA: A nationally representative survey of attitudes and behaviours. Public Health Nutr. 2018, 21, 1835–1844. [Google Scholar] [CrossRef] [Green Version]
  50. Tonsor, G.T.; Lusk, J.L. US perspective: Meat demand outdoes meat avoidance. Meat Sci. 2022, 190, 108843. [Google Scholar] [CrossRef]
  51. Lewis, K.C. Meat Paradox: Media’s Role in Mitigating the Omnivore’s Dilemma. Master’s Thesis, University of Southern Mississippi, Hattiesburg, MI, USA, 2018. [Google Scholar]
  52. Magalhaes, D.; Maza, M.; Prado, I.; Fiorentini, G.; Kirinus, J.; Campo, M. An exploratory study of the purchase and consumption of beef: Geographical and cultural differences between Spain and Brazil. Foods 2022, 11, 129. [Google Scholar] [CrossRef]
  53. Dill, M.; Andrade, A.; Boito, B.; Araújo, M.; Morais, M.; Silva, T.; Barcellos, J. Concerns, attitudes, and opinions of meat buyers in Garanhuns, Pernambuco, Brazil. Rev. Bras. De Zootec. 2021, 50. [Google Scholar] [CrossRef]
  54. Gomes, R. The consumption of meat in Brazil: Between socio-cultural and nutritional values. DEMETRA Aliment. Nutr. Saúde 2013, 8, 425–437. [Google Scholar]
  55. Dellava, J.; Bulik, C.; Popkin, B. Price changes alone are not adequate to produce long-term dietary change. J. Nutr. 2010, 140, 1887–1891. [Google Scholar] [CrossRef] [PubMed] [Green Version]
  56. Burggraf, C.; Kuhn, L.; Zhao, Q.; Teuber, R.; Glauben, T. Nutrition transition in two emerging countries: A comparison between China and Russia. In Proceedings of the 29th International Conference of Agricultural Economists, Milan, Italy, 8–14 August 2015. [Google Scholar]
  57. Zolotareva, O.; Davletshina, L.; Antipova, D. Statistical analysis of structured data on the consumption of meat and meat products in Russia. In Proceedings of the First International Volga Region Conference on Economics, Humanities and Sports (FICEHS 2019), Kazan, Naberezhnye Chelny, Russia, 24–25 September 2019; Volume 114, pp. 88–91. [Google Scholar]
  58. Sen, C. Hinduism and food. In Encyclopedia of Food and Agricultural Ethics; Kaplan, D., Ed.; Springer Nature B.V.: Dordrecht, The Netherlands, 2014; pp. 1521–1527. [Google Scholar]
  59. Sathyamala, C. Meat-eating in India: Whose food, whose politics, and whose rights? Policy Futur. Educ. 2018, 17, 878–891. [Google Scholar] [CrossRef] [Green Version]
  60. Kumar, N.; Kapoor, S. Study of consumers’ behavior for non-vegetarian products in emerging market of India. J. Agribus. Dev. Emerg. Econ. 2014, 4, 59–77. [Google Scholar] [CrossRef]
  61. Du, S.; Wang, H.; Zhang, B.; Zhai, F.; Popkin, B. China in the period of transition from scarcity and extensive undernutrition to emerging nutrition-related non-communicable diseases, 1949–1992. Obes. Rev. 2014, 15 (Suppl. S1), 8–15. [Google Scholar] [CrossRef] [PubMed]
  62. Zhi-Ming, S. Chinese food consumption and nourishment in the latest 20 years. Resour. Sci. 2006, 28, 2–8. [Google Scholar]
  63. Zanetta, L.; Mucinhato, R.; Hakim, M.; Stedefeldt, E.; Cunha, D. What motivates consumer food safety perceptions and beliefs? A scoping review in BRICS Countries. Foods 2022, 11, 432. [Google Scholar] [CrossRef]
  64. Stuenkel, O. The BRICS and the Future of Global Order; Lexington Books: Lanham, MD, USA, 2020. [Google Scholar]
  65. Sun, D.; Liu, Y.; Grant, J.; Long, Y.; Wang, X.; Xie, C. Impact of food safety regulations on agricultural trade: Evidence from China’s import refusal data. Food Policy 2021, 105, 102185. [Google Scholar] [CrossRef]
  66. Liu, R.; Xing, L.; Zhou, G.; Zhang, W. What is meat in China? Anim. Front. 2017, 7, 53–56. [Google Scholar] [CrossRef] [Green Version]
  67. Carnovale, F.; Jin, X.; Arney, D.; Descovich, K.; Guo, W.; Shi, B.; Phillips, C. Chinese public attitudes towards, and knowledge of animal welfare. Animals 2021, 11, 855. [Google Scholar] [CrossRef]
  68. Liu, A.; Niyongira, R. Chinese consumers food purchasing behaviors and awareness of food safety. Food Control 2017, 79, 185–191. [Google Scholar] [CrossRef]
  69. Vargas-Bello-Pérez, E.; Miranda-de la Lama, G.; Teixeira, D.; Enríquez-Hidalgo, D.; Tadich, T.; Lensink, J. Farm animal welfare influences on markets and consumer attitudes in Latin America: The cases of Mexico, Chile and Brazil. J. Agric. Environ. Ethics 2017, 30, 697–713. [Google Scholar] [CrossRef]
  70. Hobbs, A.; Hobbs, J.; Isaac, G.; Kerr, W. Ethics, domestic food policy and trade law: Assessing the EU animal welfare proposal to the WTO. Food Policy 2002, 27, 437–454. [Google Scholar] [CrossRef]
Figure 1. Distribution of the variables: (a) age by gender and country, (b) age by country, and (c) age by gender.
Sustainability 15 03619 g001
Figure 2. Graphical representation of the multinomial logistic model fitted to the data. The scores 1 with 2 and 4 with 5 were aggregated. Probabilities associated with disagreement (scores 1+2), neither agree nor disagree (score 3), and agreement (scores 4+5) were given to the statement “it is important to me that animals used for food are well cared for”.
Sustainability 15 03619 g002
Figure 3. Graphical representation of the multinomial logistic model fitted to the data. The scores 1 with 2 and 4 with 5 are aggregated. Probabilities associated with disagreement (scores 1+2), neither agree nor disagree (score 3), and agreement (scores 4+5) given to the statement “the typical nationality thinks it is important that animals used for food are well cared for”.
Sustainability 15 03619 g003
Figure 4. Graphical representation of the multinomial logistic model, adjusted to the data. The scores 1 with 2 and 4 with 5 are aggregated. Probabilities associated with disagreement (scores 1+2), neither agree nor disagree (score 3), and agreement (scores 4+5) are given to the statement “Low meat prices are more important than the well-being of animals used for food”.
Sustainability 15 03619 g004
Figure 5. Graphical representation of the multinomial logistic model, adjusted to the data. The scores 1 with 2 and 4 with 5 are aggregated. Probabilities associated with disagreement (scores 1+2), neither agree nor disagree (score 3), and agreement (scores 4+5) are given to the statement “the typical nationality thinks that low meat prices are more important than the well-being of animals used for food”.
Sustainability 15 03619 g005
Table 1. Coefficients of correlations between the variables used in the models.
AgeGenderCountry
Age----------0.0200.244
Gender0.020----------0.035
Country0.2440.035----------
Table 2. Parameterisation of the multinomial logistic model, “it is important to me that animals used for food are well cared for”, adjusted to data.
ScoreParameterβexp(β)
3Country China2.131 **8.424
India1.193 **3.298
USA1.735 **5.668
Country × Age
Russia, Age0.036 *1.037
4Country Brazil2.030 *7.611
India1.828 ***6.222
USA1.472 **4.358
Gender Male−0.480 **0.619
Country × Age
China, Age0.05 *1.052
Russia, Age0.053 ***1.055
USA, Age0.037 **1.037
5Country Brazil2.355 **10.534
India1.311 ***3.710
USA1.334 *3.797
Gender Male−0.721 ***0.486
Country × Age
Brazil, Age0.045 *1.046
China, Age0.077 **1.080
Russia, Age0.055 ***1.056
USA, Age0.040 **1.041
The scores given to the statement “it is important to me that animals used for food are well cared for”, used as the dependent variable, are modelled as a function of the independent variables “Age”, “Country”, and “Gender”, together with their interactions. Only significant (p < 0.05) parameters are shown. Score 1 is used as reference in the model: * p < 0.05, ** p < 0.01, *** p < 0.001.
Table 3. Parameters of the multinomial logistic model, “the typical nationality thinks it is important that animals used for food are well cared for”, adjusted to data.
ScoreParameterβexp(β)
2Country × Gender
China, Male2.194 **8.970
China, Female3.607 ***36.857
Country × Age
China, Age−0.050 *0.951
Gender × Age
Male, Age0.021 *1.021
3Country × Gender
China, Male3.415 ***30.429
China, Female4.767 ***117.530
India, Male1.024 **2.784
India, Female2.264 ***9.624
USA, Female1.238 **3.450
Country × Age
China, Age−0.043 *0.958
Russia, Age0.034 *1.034
4Country × Gender
China, Male2.260 **9.588
China, Female3.674 ***39.413
India, Male1.310 ***3.708
India, Female2.069 ***7.914
Country × Age
Brazil, Age0.029 *1.029
Russia, Age0.039 **1.040
USA, Age0.029 **1.030
5Country × Age
Brazil, Age0.041 ***1.042
Russia, Age0.053 ***1.054
USA, Age0.034 **1.034
The scores given to the statement “the typical nationality thinks it is important that animals used for food are well cared for”, used as the dependent variable, are modelled by the independent variables “Country”, “Gender”, and “Age”, together with their interactions. Only significant (p < 0.05) parameters are shown. Score 1 was used as a reference in the model. * p < 0.05, ** p < 0.01, *** p < 0.001.
Table 4. Parameterisation of the multinomial logistic model, “low meat prices are more important than the well-being of animals used for food”, adjusted to data.
ScoreParameterβexp(β)
2Age−0.007 **0.993
Country × Gender
Brazil, Male0.341 *1.407
China, Male1.372 ***3.943
China, Female1.666 ***5.291
Russia, Male1.165 ***3.205
Russia, Female0.939 ***2.557
USA, Male0.817 ***2.264
USA, Female0.380 *1.462
3Age−0.012 ***0.988
Country × Gender
Brazil, Male0.352 *1.422
China, Male2.714 ***15.091
China, Female2.871 ***17.652
India, Male0.351 *1.420
India, Female0.330 *1.391
USA, Male1.344 ***3.836
USA, Female0.504 **1.655
4Country × Gender
Brazil, Male−0.696 ***0,499
Brazil, Female−1.299 ***0,273
China, Male1.405 ***4.074
China, Female1.163 ***3.198
India, Female−0.498 **0.608
USA, Female−1.503 ***0.223
5Country × Gender
Brazil, Male−1.468 ***0.230
Brazil, Female−2.115 ***0.121
India, Male−1.266 ***0.282
India, Female−1.328 ***0.265
Russia, Female−2.274 ***0.103
USA, Female−2.066 ***0.127
The scores given to the statement “low meat prices are more important than the well-being of animals used for food”, used as dependent variable, are modelled by “Gender”, “Age”, and “Country”, together with their interactions. Only significant (p < 0.05) parameters are shown. Score 1 is used as reference in the model; * p < 0.05, ** p < 0.01, *** p < 0.001.
Table 5. Parameterisation of the multinomial logistic model, “the typical nationality thinks that low meat prices are more important than the well-being of animals used for food”, adjusted to data.
ScoreParameterβexp(β)
2Country × Gender
Brazil, Male0.723 *2.061
China, Male1.468 *4.339
China, Female1.511 *4.533
Russia, Male1.411 **4.099
Russia, Female1.288 **3.413
3Country × Gender
Brazil, Male1.333 ***3.794
Brazil, Female1.206 ***3.340
China, Male2.570 ***13.064
China, Female2.907 ***18.311
India, Male1.189 ***3.284
India, Female1.441 ***4.225
Russia, Male1.797 ***6.034
Russia, Female1.630 ***5.105
USA, Male3.040 ***20.909
USA, Female2.664 ***14.360
Country × Age
Brazil, Age−0.017 *0.984
USA, Age−0.018 *0.982
4Country × Gender
Brazil, Male1.527 ***4.604
Brazil, Female1.555 ***4.734
China, Male1.267 *3.549
China, Female1.183 ***3.263
India, Female0.891 **2.438
Russia, Male2.273 ***9.705
Russia, Female1.869 ***6.481
USA, Male3.153 ***23.401
USA, Female2.470 ***31.130
Country × Age
Brazil, Age−0.022 ***0.978
Russia, Age−0.025 **0.976
USA, Age−0.023 **0.977
5Country × Gender
Brazil, Male0.930 **2.534
Brazil, Female0.885 *2.422
Russia, Male1.385 **3.994
USA, Male2.477 ***11.908
USA, Female1.654 ***5.226
Country × Age
Brazil, Age−0.020 **0.980
Russia, Age−0.026 *0.974
USA, Age−0.024 **0.976
The scores given to the statement “the typical nationality thinks that low meat prices are more important than the well-being of animals used for food”, used as dependent variable, are modelled by the independent variables “Gender”, “Age”, and “Country”, together with their interactions. Only significant (p < 0.05) parameters are shown. Score 1 is used as a reference in the model. * p < 0.05, ** p < 0.01, *** p < 0.001.
Table 6. Meat consumption and Gross Domestic Product (GDP) per capita in the BRIC countries and the USA. Data retrieved from [48].
CountryConsumption (kg)GDP ($)
USA124.160,110
Brazil99.8314,525
Russia76.6125,926
India3.786183
China60.5914,344
Consumption and GDP are per capita/year.
Disclaimer/Publisher’s Note: The statements, opinions and data contained in all publications are solely those of the individual author(s) and contributor(s) and not of MDPI and/or the editor(s). MDPI and/or the editor(s) disclaim responsibility for any injury to people or property resulting from any ideas, methods, instructions or products referred to in the content.

