Article

Baseflow Variation in Southern Taiwan Basin

Department of Resources Engineering, National Cheng Kung University, Tainan 701, Taiwan
*
Author to whom correspondence should be addressed.
Sustainability 2023, 15(4), 3600; https://doi.org/10.3390/su15043600
Submission received: 5 January 2023 / Revised: 9 February 2023 / Accepted: 12 February 2023 / Published: 15 February 2023

Abstract

:
Baseflow is among the most important components of streamflow. It is the main source of streamflow from groundwater systems in the dry season and also plays an important role as a water resource in the ecological environment and for human activities. In recent years, because of climate change, the number of dry season days in Taiwan has increased, and the wet season has been delayed, resulting in fewer rainy days and increased precipitation intensity. In addition, the spatial distribution of rainfall is uneven, and rivers are short and fast-flowing. Taiwan has become a country with abundant rainfall but insufficient water resources; therefore, the assessment of baseflow is important. This study selected eight basins with distinct wet and dry seasons in southern Taiwan as the study area. The baseflow characteristics and their relationships with climate features were assessed using time series analysis, baseflow attribution analysis, and wavelet analysis. The results showed that baseflow has an increasing trend; both precipitation and evapotranspiration have a significant positive correlation with baseflow, and the impact of precipitation is greater than that of evaporation. Sensitivity analysis showed that baseflow increases with increasing evaporation and precipitation; this behavior is related to the concentration of precipitation and evaporation in the wet season. Baseflow attribution analysis showed that the contribution of climate change to baseflow (75.0%) was larger than that of human activities (−2.9%), indicating that climate change was the main factor in the increase in baseflow. Wavelet analysis showed that both the El Niño–Southern Oscillation (ENSO) and Pacific Decadal Oscillation (PDO) are correlated with baseflow, where the PDO is more strongly correlated than the ENSO. The main timescales of the ENSO and PDO are a 4–8-year band and an 8-year band, respectively. The ENSO may have a timescale above the 8-year band, and the PDO exhibits periodic correlation changes at a 1-year band.

1. Introduction

Streamflow is often considered to consist of runoff and baseflow. Runoff is composed mainly of surface flow, whereas baseflow has many definitions. Baseflow has been identified as the water that maintains streamflow during low-flow periods and also the components in high-flow periods, which consist mainly of groundwater or other sources [1,2,3] or the streamflow components that respond slowly to precipitation and are associated with groundwater discharge [4,5,6]. Many recent studies have identified baseflow as the flow resulting from groundwater discharge, which is mainly composed of shallow, lateral, and deep groundwater and other delayed sources, such as lakes, wetlands, and reservoir storage [7,8,9,10,11], and changes gradually in the short- and long-terms [12,13]. Baseflow is not only a key source of basic streamflow but also plays an important role in groundwater systems [6,7,14]. In the dry season, most streamflow consists of baseflow, whereas in the wet season, precipitation is the main source of streamflow, and the proportion of baseflow is low. As baseflow accounts for most streamflow in the dry season, water resources for the ecological environment and human activities must be provided by baseflow during this period. In areas with long-term drought, the dependence on baseflow is higher [11,15,16,17,18].
Streamflow can be measured directly at streamflow stations, but it is difficult to measure baseflow directly. Thus, many methods have been proposed to separate baseflow from streamflow. These methods are usually divided into two types: tracer and non-tracer methods [19]. The former are based on groundwater and changes in surface water with different chemical characteristics; they are highly accurate but time-consuming and difficult to apply in some basins. To overcome these disadvantages, various non-tracer methods have been proposed. They include the graphical method [20], water balance method [21], and numerical simulation [22], and they have the advantages of versatility, simple operation, and high accuracy. Among them, numerical simulation is not only accurate but also easy to perform; methods include single-parameter digital filtering [23], recursive digital filtering [24], HYSEP [25], and PART [26], which are widely used in various hydrological analysis [8,10,27,28,29].
Baseflow is generated by groundwater or other delayed sources (lakes, wetlands, etc.); thus, baseflow is clearly affected by basin characteristics, climate change, and human activities. Many studies have shown a strong correlation between these factors and baseflow [7,15]. The interaction between these factors and baseflow, in addition to the impacts of climate change and intensified anthropogenic activities, has attracted increasing attention. Fan et al. [15] examined the baseflow variation in the Tarim River Basin of China from 1960 to 2007 and found that the increasing trend in baseflow was related to increased glacial melting upstream caused by rising temperatures. Ahiablame et al. [13] investigated the impacts of climate change and agricultural land changes on the variation in baseflow in the Missouri River Basin from 1950 to 2014 and observed that increased precipitation resulted in decreased baseflow. Li et al. [7] studied the baseflow trend in the Poyang Lake Basin of China from 1953 to 2014 and found that climate change had a greater effect on baseflow than land-use changes. Lucas et al. [28] investigated the reasons for streamflow reduction in the Sao Francisco River Basin in Brazil and found that 86% of the streamflow reduction was attributable to reduced baseflow; increased evaporation and the expansion of irrigated agriculture were also found to be factors in streamflow reduction. Ayers et al. [10] examined the baseflow trends in the Midwestern United States and observed that baseflow was more significantly correlated with climate change than with land use. In summary, the impacts of climate change and human activities on baseflow have become an important topic in hydrological research.
Southern Taiwan has a tropical monsoon climate. Precipitation is concentrated in spring and summer, including plum rain in May and June, typhoons from July to October, and the irregular southwest monsoon from May to August. These are the main sources of precipitation and water resources in Southern Taiwan. In autumn and winter, precipitation is low because the region is located on the leeward side of the Central Mountains, which block moisture from the northeast monsoon. For these reasons, Southern Taiwan has distinct wet and dry seasons, with a precipitation ratio of approximately 9:1 [30]. In addition to the strong temporal variation in precipitation, the spatial distribution, large variation in precipitation intensity, and steep terrain result in short, fast-flowing streams; thus, the limited water resources are more difficult to store. Rivers and reservoirs account for approximately 85% of Taiwan’s water resources, and groundwater accounts for the remaining 15% [31]. In recent years, the dry and wet seasons have become extreme. For example, an extreme drought in May 2021 caused reservoirs to dry up, resulting in a water resource crisis [32], and a subsequent extreme rainstorm caused flood disasters in many places in Taiwan. Because of the rapid intensification of global climate change and human activities, island countries such as Taiwan face an increasing shortage of water resources. To maintain a stable water supply from rivers in both the dry and wet seasons, it is important to understand the changes in baseflow caused by climate change and human activities. Therefore, the purposes of this study are as follows: (1) analyze the trend of long-term baseflow; (2) identify the controlling factors affecting baseflow; (3) quantify the contribution of human activities and climate changes to the baseflow variation between pre- and post-period; and (4) evaluate the linkages between baseflow and large-scale climate patterns, including the El Niño–Southern Oscillation (ENSO) and Pacific Decadal Oscillation (PDO) in Southern Taiwan. The results related to baseflow of this study are particularly meaningful for Southern Taiwan, where rainfall and streamflow are highly concentrated in a few months. The findings can enhance our understanding of the baseflow variation and related reasons and provide a basis for future water resource management, contributing to the establishment of hydrological policy references.

2. Materials and Methods

2.1. Study Area and Data Sources

Southern Taiwan was selected as the study area. The administrative regions include Chiayi City, Chiayi County, Tainan City, Kaohsiung City, and Pingtung County. Southern Taiwan is located in a tropical monsoon region and has a mean annual precipitation of approximately 2500 mm. The precipitation is concentrated in the wet season (May to October), which includes the plum rain season in May and June, the typhoon season from July to September, and the southwest monsoon in summer. Thus, the wet season has abundant precipitation. The dry season is from November to April. The northeast monsoon prevails during this period. Southern Taiwan is located on the leeward side of the Central Mountains, which block the entry of moisture, resulting in low precipitation. Therefore, the climate is characterized by rainy summers and dry winters. The wet and dry seasons account for approximately 90% and 10% of the precipitation in Southern Taiwan, respectively [33]. The study area covers all the major river basins in Southern Taiwan, which have a total area of approximately 10,002 km2. The main river basins from north to south are the Bazhang, Zengwen, Yanshui, Erren, Laonong, Ailiao, Donggang, and Linbian river basins.
This study collected precipitation, streamflow, and evaporation data for the Southern Taiwan Basin to evaluate their long-term trends. In addition, baseflow was separated from streamflow to identify the impacts of climate change and human activities on baseflow. The daily precipitation data and daily streamflow data were collected by the Water Resources Agency of the Ministry of Economic Affairs and a precipitation and streamflow station affiliated with the Taipower Company. Temporal coverage of data was different but highly overlapped in the eight river basins. The record period of precipitation and streamflow data were covered from 1980 to 2018, with a minimum length of 25 years (Donggang River Basin) to a maximum length of 39 years (Bazhang River Basin) in eight basins. This study considered that the above long-term data are sufficiently representative for the analysis of hydrological environment change. The source of the evaporation data was the Global Land Evaporation Amsterdam Model (GLEAM). Using the observed surface net radiation and temperature, GLEAM can calculate the potential evaporation and actual evaporation data on a regular 0.25° latitude/longitude grid with daily time resolution [34]. The GLEAM data had good analysis results in the same study area [35]. The spatial distributions of the streamflow and precipitation stations are shown in Figure 1. The basic data and analysis year of the Southern Taiwan Basin and the basin stations are shown in Table 1.
The ENSO and PDO index data were obtained from the NOAA Physical Sciences Laboratory. Its main objective is to improve the observation, understanding, and prediction of weather, hydrology, and extreme climate events and their impacts, including the precursors, prediction, and variation of the ENSO and PDO, as well as the impacts on the climate and ecosystems. The ocean–atmosphere interaction directly affects the weather and long-term climate conditions. The combined action of El Niño and La Niña is known as the ENSO, a cyclical change in sea surface temperature (SST) in the equatorial Pacific. Above-normal and below-normal SST affect the global air pressure system, wind direction, and precipitation, and thus weather patterns worldwide. The PDO is a long-term climate cycle similar to the ENSO that affects climate in the Pacific region [36]. In contrast to the ENSO, the PDO has positive and negative values according to the SST anomalies in the Northeast Pacific and tropical Pacific. When the SST in the North Pacific is abnormally cold and the Pacific coast is abnormally warm, the sea level pressure in the North Pacific is lower than the mean value, and the PDO is positive, and vice versa. The ENSO and PDO indices provide monthly index data, and indices for each streamflow and precipitation station in the analysis years were selected.

2.2. Methodology

Precipitation, streamflow, and evaporation data were collected, and streamflow was separated from baseflow to identify baseflow and runoff. Precipitation, streamflow and baseflow variables at daily time steps were converted into annual time steps for time series analysis, including Mann–Kendall trend analysis [37,38], Theil–Sen estimation analysis [39,40], Mann–Whitney–Pettit analysis [41], and partial correlation analysis [42]. In addition, attribution analysis of the impacts of climate change and human activities on baseflow was conducted. For this purpose, sensitivity analysis [43,44], multiple linear regression (MLR) analysis [45,46], and the Budyko hypothesis [47,48,49] were used, and the results of these three methods were compared. Finally, wavelet analysis was used to investigate the periodic changes in baseflow and correlations between baseflow and large-scale climate patterns (the ENSO and PDO).

2.2.1. Baseflow Separation

A single-parameter digital filter [23] was used to estimate the baseflow. The streamflow signal was divided into high- and low-frequency components, which represent runoff and baseflow, respectively. Then, the baseflow was separated from the daily streamflow hydrograph. The formula is as follows:
q t = α q t 1 + 1 + α 2   ( Q t Q t 1 ) ,   Q b t = Q t q t
where Q b t is the filtered baseflow at day t, q t is the filtered runoff at day t, Q t is the streamflow at day t, and α is the filter parameter and set as 0.925 suggested by [9,50].
The baseflow index (BFI) is an important indicator for evaluating the characteristics of baseflow. It is defined as the ratio of baseflow to total streamflow; thus, it is sensitive to climate change and geographical characteristics [51]. The formula is as follows:
  BFI = t 2 t 1 Q b ( t ) dt t 2 t 1 Q ( t ) dt
where t 1 and t 2 are the start and end times of a period of time, respectively. Q b ( t ) and Q ( t ) are the baseflow and total streamflow during a period of time, respectively. High BFI (>0.7) and low BFI (<0.4) indicate a high proportion and a low proportion of baseflow, respectively [52].

2.2.2. Partial Correlation Analysis

The relationship between two continuous variables may be disturbed by the third variable. Partial correlation analysis can infer whether there is a direct, indirect or spurious relationship between the remaining two variables by removing the influence of the third variable [42]. In order to remove the influence caused by the third variable, the net relationship between the two variables can be observed through partial correlation analysis. Therefore, partial correlation analysis was used to investigate the relationship between the hydrometeorological variables. The equation is as follows:
r 12 , 3 = r 12 r 13 × r 23 1 r 13   2 × 1 r 23   2
where r 12 , 3 is the correlation between the first and second variable that are removed from the third variable, r 12 , r 13 and r 23 are the correlation between the first and second variable, the first and third variable, and the second and third variable, respectively.

2.2.3. Baseflow Attribution Analysis

Sensitivity Analysis

This study used the least-squares estimated elasticity approach to calculate the sensitivity of baseflow to climate factors. The elasticity parameter was proposed by Schaake [43] and used to estimate the impact of climate change on streamflow [44] and baseflow [9]. The climate elasticity coefficient of baseflow ( ε ) is defined as the change in baseflow divided by the change in climate variables (precipitation and evaporation in this study); it is expresses as [9]:
ε = Δ R / R Δ X / X
where R is baseflow and X is the climate variable (precipitation or evaporation).
Zheng et al. [44] derived the estimated climate elasticity coefficient to overcome the problem related to small sample numbers; it is expressed as:
Δ R i / R ¯ = ε × Δ X i / X ¯
where the elasticity coefficient ε can be regarded as a linear regression coefficient between Δ X i / X ¯ and Δ R i / R ¯ . Δ X i and Δ R i are differences of annual climate variables and the baseflow in year i with respect to the long-term average of climate variables ( X ¯ ) and baseflow ( R ¯ ), respectively. Therefore, Δ X i and Δ R i are equal to X i X ¯ and R i R ¯ , respectively. The elasticity coefficient of the baseflow can be estimated using the least-squares estimated elasticity, which is expressed as
ε = X ¯ R ¯ Σ ( X i X ¯ ) ( R i R ¯ ) Σ ( X i X ¯ ) 2 = ρ X , R · C R C X
where ρ R , X is the correlation coefficient between the baseflow and climate variables, and C R and C X are the coefficients of variation of the baseflow and climate variables, respectively.

Multiple Linear Regression Analysis

This study assessed the impacts of climate change and human activities on baseflow using MLR analysis [45,46]. The climate variables and baseflow time series were divided into pre- and post-periods according to change point analysis. The regression equation of baseflow, precipitation, and evaporation in the pre-period can be expressed as
R pre = aP pre + bE pre + c
where R pre , P pre , and E pre are the annual mean baseflow, precipitation, and evaporation in the pre-period, respectively; a and b are the regression coefficients, and c is the intercept. This study assumed that only changing precipitation and evaporation and maintaining the same regression coefficients and intercept could reconstruct the post-period annual mean baseflow that was only affected by climate change. The coefficients a, b and c obtained from Equation (7) and the mean values of precipitation and evaporation in the post-period are used to reconstruct the annual mean baseflow in the post-period ( R rec ) only affected by climate change and can be expressed as:
R rec = aP post + bE post + c
where P post and E post are the annual mean precipitation and evaporation in the post-period, respectively. Therefore, the change in baseflow caused by human activities was calculated as the difference between the observed baseflow affected by both climate change and human activities ( R post ) and the reconstructed baseflow only affected by climate change ( R rec ) [46].
Δ R baseflow human = R rec R post
The change in baseflow caused by climate change was calculated as the difference between the total change in baseflow ( Δ R baseflow total ) and the change in baseflow caused by human activities ( Δ R baseflow human ):
Δ R baseflow climate = Δ R baseflow total Δ R baseflow human
where Δ R baseflow human and Δ R baseflow climate are the changes in baseflow caused by human activities and climate change, respectively. Δ R baseflow total is the total change in baseflow.

Budyko Hypothesis

This study used the Budyko hypothesis, which is widely used in hydrological research [47,48,49,53,54] to analyze the change in baseflow. The basin hydrological cycle is affected by climate change and changes in the basin characteristics (such as vegetation changes and construction) [55]. The Budyko hypothesis can assess the hydrological cycle considering the effects of these factors. A previous study investigated the relationship between the baseflow and basin characteristics [4]. The Budyko hypothesis consists of nonparametric [47,49] and single-parameter equations [48,54,56,57], where the parameter n in the single-parameter equation represents basin characteristics that are difficult to quantify in the hydrological cycle. In this study, n represents the change in human activities; it is expressed by four single-parameter equations, as shown in Table 2.
In the attribution analysis, the changes in baseflow caused by precipitation, evaporation, and human activities in the pre- and post-periods were calculated using the change point analysis results, sensitivity, and parameter n in the Budyko hypothesis. These changes can be determined using the elasticity coefficients ( ε P , ε E 0 ε n ) [18,58]:
Δ R baseflow P = ε P R pre P Δ P
Δ R baseflow E 0 = ε E 0 R pre E 0 Δ E 0
Δ R baseflow n = ε n R pre n Δ n
where Δ R baseflow P , Δ R baseflow E 0 , and Δ R baseflow n are the changes in baseflow caused by precipitation, evaporation, and human activities, respectively. P, E 0 , and R pre are the precipitation, evaporation, and baseflow in the pre-period, respectively. Δ P , Δ E 0 , and Δ n are the changes in precipitation, evaporation, and human activities between the pre- and post-periods, respectively. The change in baseflow caused by climate change, Δ R baseflow climate , is the sum of the changes in baseflow caused by precipitation and potential evaporation:
Δ R baseflow climate = Δ R baseflow P + Δ R baseflow E 0
Finally, attribution analyses were conducted using sensitivity analysis, MLR analysis, and the parameter n in the Budyko hypothesis. The change in baseflow caused by human activities in the sensitivity analysis is the total change in baseflow minus the change in baseflow caused by climate change:
Δ R baseflow human = Δ R baseflow total Δ R baseflow climate
The parameter n in the Budyko hypothesis represents the human activities in the basin. Therefore, the total change in baseflow, Δ R baseflow total , can be expressed as
Δ R baseflow total = Δ R baseflow n + Δ R baseflow climate
The contributions of climate change and human activities to the change in baseflow can be expressed as
C C = Δ R baseflow climate | Δ R baseflow climate | + | Δ R baseflow human | × 100 %
C H = Δ R baseflow human | Δ R baseflow climate | + | Δ R baseflow human | × 100 %
where C C and C H represent the contributions of climate change and human activities to the change in baseflow, respectively.

2.2.4. Wavelet Analysis

Wavelet coherence analysis (WTC) evaluates the relationship between baseflow and climate characteristics. WTC mainly determines the time period between two signals and the mutual intensity between the two time series [59]. In addition, WTC can also analyze the phase relationship and the change in correlation between the two signals. The WTC of two time series x(t) and y(t) is defined as the wavelet squared correlation R t 2 ( s ) :
R t 2 ( s ) = | S ( s 1 W t   xy ( s ) ) | 2 S ( s 1 | W t   x ( s ) | ) 2 × S ( s 1 | W t   y ( s ) | ) 2
where W t   x and W t   y are the continuous wavelet transform (CWT) of x t and y t , respectively. W t   xy is the cross wavelet spectrum, S is the smoothing unit, and s is the circular deviation. The phase between the two signals is shown as an arrow in the wavelet energy image.

3. Results and Discussion

3.1. Hydrological Variation Analysis

Streamflow and baseflow were separated by digital filtering, and the variations in streamflow and baseflow over time at eight stations in the Southern Taiwan Basin are presented. The annual average streamflow and baseflow trends were analyzed by Mann–Kendall trend analysis, and the trend slopes were estimated by Theil–Sen estimation. The results are shown in Figure 2.
The annual average precipitation in the Southern Taiwan Basin is 2203 (mm/year); the annual average precipitation increase is 22 (mm/year), and the precipitation showed an insignificant (p > 0.05) increasing trend at all stations. The annual average streamflow is 2230 (mm/year), and the annual average streamflow increase is 21 (mm/year). Streamflow showed an increasing trend at all stations except Chungtechou, with significant (p < 0.05) trends at Chukou and Santimen. The annual average baseflow is 1190 (mm/year), and the annual average baseflow increase is 14 (mm/year). The variation in baseflow is similar to that in streamflow, and the baseflow showed an increasing trend at all stations except Chungtechou, which showed an insignificant decreasing trend. Significant (p < 0.05) trends were observed at Chukou, Hsinshih, Santimen, Chaochou, and Hsinpei (Table 3). Previous studies noted that if the change in baseflow is larger than streamflow and exhibits significant variation in the long term, the baseflow is sensitive to changes in natural or human activities in the basin [8].
This study also considered the annual variation in BFI at each station, as shown in Figure 3. The average BFI in the Southern Taiwan Basin is 0.52, but it varies over a large range, with the highest BFI at Laonong station (0.70) and the lowest at Tsochen station (0.32). No stations have a high BFI value (BFI > 0.7). Tsochen and Chungtechou have low BFIs (BFI < 0.4), and the streamflow at other stations is a combination of baseflow and runoff. Overall, the main sources of streamflow in the Southern Taiwan Basin vary with location.
The analysis shows that baseflow exhibited a significant increasing trend after 2000. In addition, the baseflow change and its range before and after the change point were examined. The results are shown in Table 4. All stations except Chungtechou show an increasing trend after the change point, where the smallest change (19.5%) appeared at Tsochen, and the largest (66.5%) appeared at Laonong. The change points of the stations are clustered around 2000, indicating that baseflow shows a significant increasing trend after approximately 2000. Trend analysis shows that the baseflow and streamflow also have increasing trends, indicating that baseflow was significantly affected by natural or human activities during the study period. Overall, the baseflow and BFI at most stations change considerably with time, and the baseflow has a significant increasing trend.

3.2. Partial Correlation Analysis

Partial correlation analysis was used to examine the correlation between hydrometeorological variables and identify controlling factors for streamflow, baseflow, and BFI. The potential climate controlling factors include precipitation and evaporation in this study. The results are shown in Table 5. Each station shows a significant positive correlation between precipitation and evaporation, and precipitation, evaporation, and streamflow have a significant positive correlation, where the correlation between precipitation and streamflow is greater than that between evaporation and streamflow. Regarding the partial correlations, when evaporation is ignored, precipitation and streamflow show a significant positive correlation at all stations, whereas the correlation between evaporation and streamflow is insignificant when the effect of precipitation is ignored, except at Santimen. Overall, precipitation has a greater effect on streamflow than evaporation.
Baseflow has a significant positive correlation with precipitation, and it shows a significant positive correlation with evaporation only at some stations. Regarding the partial correlations, when the effect of evaporation is ignored, precipitation and baseflow show a significant positive correlation at all stations. By contrast, evaporation and baseflow have an insignificant positive correlation when the effect of precipitation is ignored, except at Santimen and Hsinshih, and Chungtechou and Chaochou show an insignificant negative correlation. Overall, precipitation has a greater effect on baseflow than evaporation.
The BFI is negatively correlated with precipitation at all stations except Laonong and Hsinpei, and it is positively correlated with evaporation at all stations except Chungtechou and Chukou. Regarding the partial correlation, precipitation and BFI are negatively correlated when the effect of evaporation is ignored at all stations except Hsinpei. By contrast, evaporation and BFI are positively correlated when the effect of precipitation is ignored, except at Chungtechou and Chukou stations.
Precipitation and evaporation have a significant positive correlation with streamflow and baseflow. The reason for the positive correlation between evaporation and streamflow (or baseflow) was that precipitation and evaporation have a similar pattern (high in summer and low in winter), and the range of precipitation variability is greater than evaporation within a year. Although higher evaporation reduces streamflow (or baseflow) in summer, a large amount of precipitation compensates for the aforementioned reduction. This observation is related to the obvious dry and wet seasons in Southern Taiwan, where both precipitation and evaporation are concentrated in the wet season. Correlation analysis revealed a significant positive correlation between the climate variables and baseflow. Streamflow and baseflow are most abundant in the wet season; therefore, precipitation and evaporation have a significant positive correlation with streamflow and baseflow. However, partial correlation analysis revealed that precipitation has a more significant effect on streamflow and baseflow than evaporation, indicating that precipitation is the main factor controlling streamflow and baseflow. Because precipitation increases streamflow and baseflow, a certain time is needed for precipitation infiltration to produce baseflow; thus, the increase in streamflow is greater than that in baseflow, resulting in a negative correlation between BFI and precipitation. Evaporation decreases streamflow, including baseflow, but the evaporation of surface runoff is greater than that of baseflow, resulting in a positive correlation between BFI and evaporation. Overall, partial correlation analysis showed that when precipitation has an increasing trend (Table 2), it has a significant positive correlation with baseflow (Table 5), resulting in an increasing trend in baseflow. In contrast, evaporation has an insignificant correlation with baseflow, indicating that precipitation is the main factor controlling baseflow in the Southern Taiwan Basin.

3.3. Attribution Analysis of Baseflow

3.3.1. Sensitivity Analysis

Sensitivity analysis was used to investigated the sensitivity of the baseflow to precipitation, evaporation, and human activities. The results are shown in Table 6. Taking Santimen station as an example, for every 1% increase in precipitation (evaporation), the baseflow increases by 1.18% (2.63%). The mean sensitivities of the baseflow to precipitation and evaporation are 1.03 and 1.87, respectively. The baseflow is more sensitive to evaporation than to precipitation, and increases in precipitation and evaporation significantly affect baseflow, consistent with the results of the partial correlation analysis. The n values in the Budyko hypothesis are negative at all stations except Wang and Tang [54] at Chukou, Tsochen, Hsinshih, Laonong, Santimen, and Hsinpei stations, indicating that increasing human activities reduces the baseflow. Overall, evaporation has the greatest impact on baseflow, followed by precipitation and human activities.

3.3.2. Analysis of n Values in Budyko Hypothesis

The study period was divided into pre- and post-periods according to the baseflow change point, and the n values in the pre- and post-periods were compared. The results are shown in Figure 4. The n values at all stations increased significantly after the change point, except those reported by Zhang et al. [57] at Santimen and Laonong stations, which did not change significantly. These results indicate that human activities tend to increase after the change point. The mean n value of Fu [56] is the largest (n = 4.51), and the smallest is that of Wang and Tang [54] (n = 0.78); in addition, Chaochou station has the largest n value among all the stations. The parameter n and the percentage of the basin area affected by human activities are positively correlated, which greatly affects the characteristics of the basin and hydrological environment [55]. The possible reasons for changes in basin characteristics, including land-use changes and surface water consumption, are reflected by the parameter n. Under the same climate conditions, the water demand increases with increasing n [60]. The analysis in this study shows that the affected basin area in Southern Taiwan has increased over the past 40 years. Under the increasing trend in human activities, the baseflow still shows an increasing trend (Table 3), indicating that climate change has a greater effect than human activities. This conclusion will be discussed in terms of the attribution analysis in Section 3.3.3.
Table 6. Sensitivity of climatic variables to baseflow.
StationsPrecipitationEvaporationBudyko Hypothesis n Value
Fu [56]Zhang et al. [57]Choudhury [48]Wang and Tang [54]
Chukou0.961.420.01−0.29−0.010.35
Tsochen1.082.14−0.25−0.44−0.180.19
Hsinshih1.242.97−0.02−0.23−0.030.65
Laonong1.12.59−0.19−0.43−0.160.89
Chungtechou1.030.92−0.40−0.37−0.33−0.10
Santimen1.182.63−0.07−0.39−0.070.68
Chaochou0.810.83−0.18−0.27−0.17−0.18
Hsinpei0.851.440.08−0.170.060.31
Figure 4. Variation of n values estimated by four Budyko hypotheses [48,54,56,57].
Sustainability 15 03600 g004

3.3.3. Attribution Analysis of Baseflow Change

Figure 5 shows the results of sensitivity analysis, MLR analysis, and the Budyko hypothesis in terms of the attribution of baseflow changes in the Southern Taiwan Basin. Climate change increases baseflow by 75.0%, and human activities decreases it by −2.9%, indicating that climate change has a greater effect on baseflow than human activities. Climate change results in increased baseflow because of increased precipitation (Table 3), and increases in human activities result in decreased baseflow, but this contribution is insignificant compared with that of climate change. Human activities show an increasing trend at Chungtechou and Chaochou stations after the change point, according to the area of registered land data provided by the Statistical Yearbook of the Interior [61], published by the Ministry of the Interior. A possible reason for the increase in baseflow is increases in forest land and urbanized areas. Urbanization increases the area of the impervious layer and decreases groundwater recharge, resulting in increased surface runoff and decreased baseflow. However, the increase in forest land area contributes to the infiltration of precipitation and enhances groundwater flow, which strongly affects baseflow [62].
The results of the analysis based on the Budyko hypothesis are consistent across all the stations, whereas the results of the elastic and MLR methods vary considerably between stations. Although many previous studies have used the elastic and MLR methods to assess the relative contributions of climate change and human activities to hydrological change [18,46,63,64,65], some studies have indicated that inaccurate evaporation data may result in large errors [60,66]. In addition, the MLR method is more suitable for large-scale basins [67,68] and thus may not be applicable to smaller basins such as the Southern Taiwan Basin.
Many studies have discussed the impacts of climate change and human activities on hydrological change, mainly in arid and semi-arid regions [18,58,65,69,70]. Because these regions are located inland and have less precipitation, the impact of climate change on the hydrological environment is small, and thus the ecological environment and human daily water use depend strongly on rivers. To ensure sufficient water resources, many water conservancy projects have been implemented to maintain the required water supply, including water for agricultural irrigation and domestic water use. These projects caused significant changes in the local hydrology [71,72,73]; consequently, human activities have had a greater impact on hydrology than climate change. This study considered a region in the coastal area of the Western Pacific Ocean with a tropical monsoon climate, where water vapor easily enters Southern Taiwan, resulting in high precipitation that significantly affects the hydrological cycle. Therefore, climate change has a greater effect on the Southern Taiwan Basin than human activities, as shown in Figure 5.
The analysis shows that climate change has a greater effect on baseflow than human activities and is the main factor in the increase in baseflow. The reason is that the intensification of climate change in recent years has resulted in increases in precipitation and the frequency of heavy rainfall, which increased the amount of rainfall infiltration and thus the baseflow. Increased human activities resulted in decreased baseflow, mainly because of urbanization, water conservancy projects, and decreased forest land area. Overall, the baseflow variation is more consistent with the pattern of climate change since human activities have relatively less influence on baseflow.
Figure 5. Attribution analysis of baseflow changes with sensitivity analysis [44], Budyko hypothesis [48,54,56,57] and MLR analysis.
Sustainability 15 03600 g005

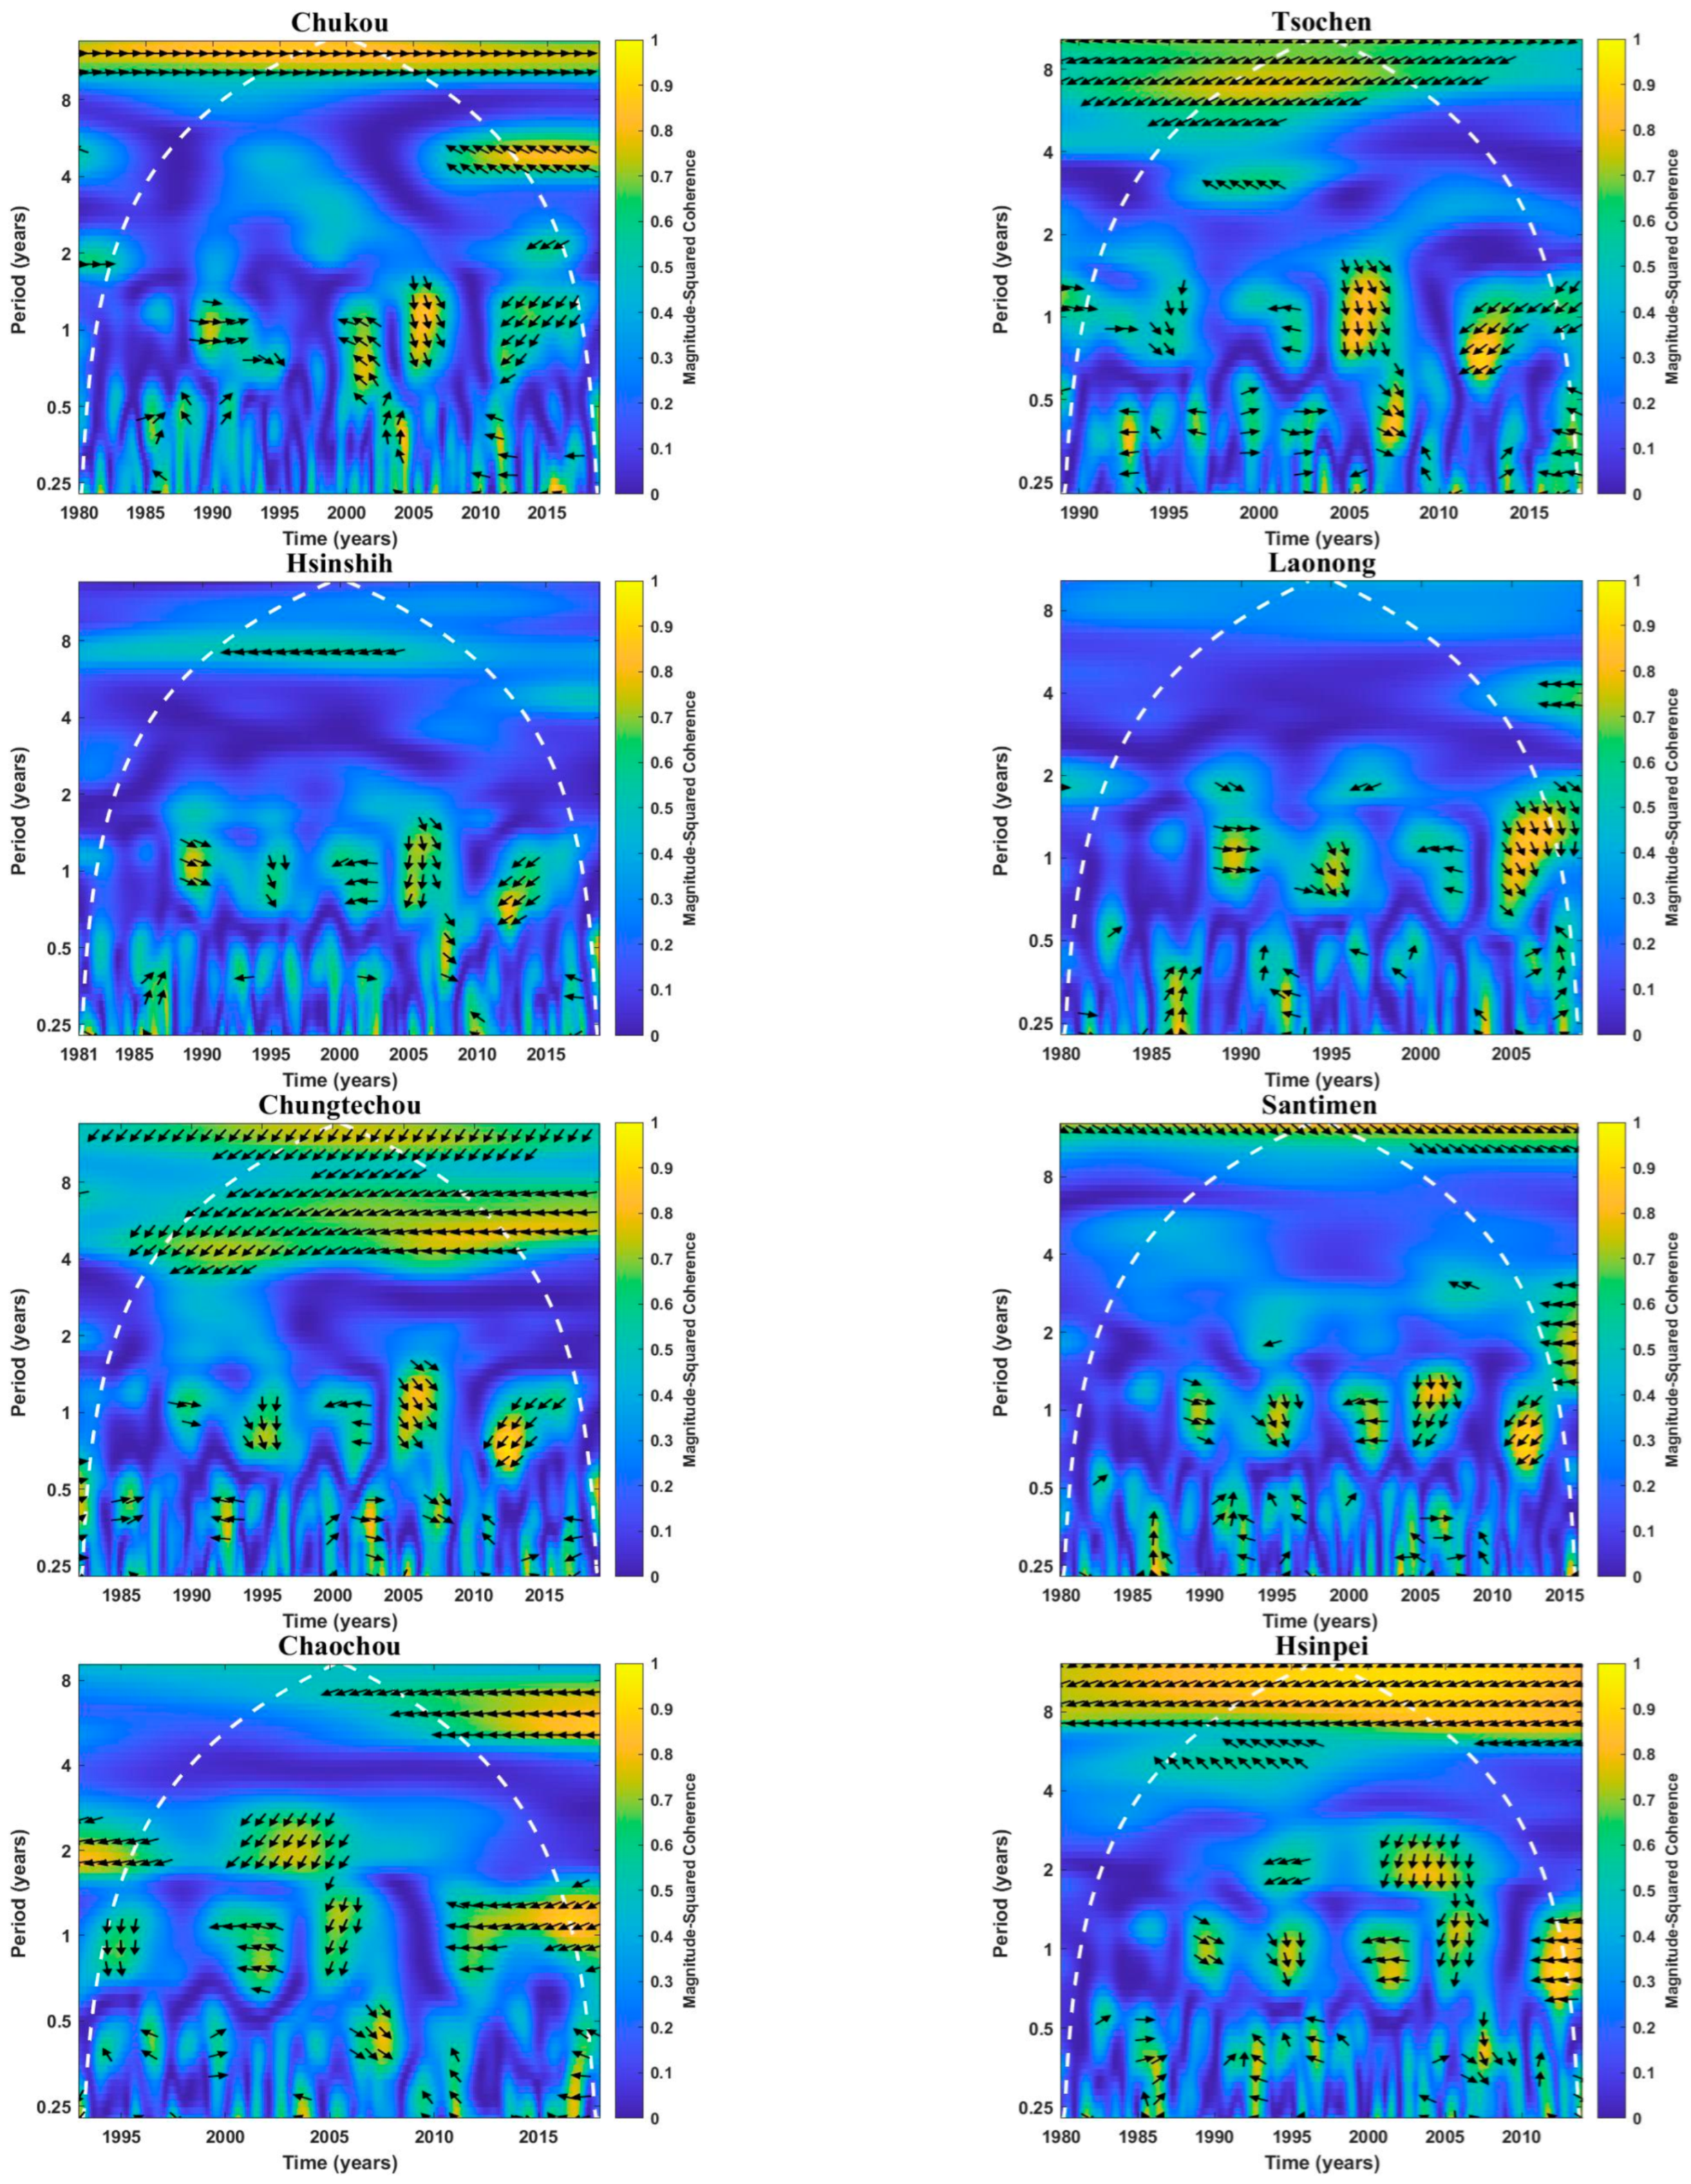
3.4. Wavelet Coherence of Baseflow and ENSO

This study considered the effects of large-scale climate patterns on baseflow. The ENSO index and baseflow were analyzed by wavelet analysis, and the temporal correlation between the ENSO and baseflow signals was observed. The wavelet coherence between the ENSO and baseflow is shown in Figure 6. The baseflow correlated with the ENSO at the 2–4-year band at Hsinshih, Santimen, Tsochen, and Chaochou stations, specifically, with Hsinshih and Santimen around 1980 and Tsochen and Chaochou around 2010. The baseflow correlated with the ENSO at the 4–8-year band at Tsochen, Chungtechou, Santimen, Chaochou, and Hsinpei stations, and the stations, except for Chungtechou, exhibiting moderate coherence in some years. The baseflow correlated with the ENSO at a band above 8 years at the Chukou, Chungtechou, Santimen, Chaochou, and Hsinpei stations, and the stations exhibit high coherence in some years, except for Chukou and Hsinpei. Higher time bands may appear at some stations, but because of the short study period, their phase angles cannot be observed.
The phase angle between the ENSO and baseflow indicates a negative phase (left-pointing arrow, where the phase angle is located at [ π / 2 , π ] and [ π , π / 2 ] ), except for Chukou station; that is, when the ENSO index is positive, the baseflow in Southern Taiwan is lower. An angle of ± π / 2 indicates that the lead–lag between the ENSO and baseflow is larger. In addition, the correlations at all stations below the 1-year band are more complex; because the ENSO index and baseflow are monthly data, the correlation will exhibit a periodic change at the 1-year band. Overall, the baseflow in Southern Taiwan Basin is affected by the ENSO at two poles. The periodicity of the stations greatly affected by the ENSO is mainly at the 4–8-year band, and a correlation may exist above the 8-year band.

3.5. Wavelet Coherence of Baseflow and PDO

The wavelet coherence between the PDO and baseflow is shown in Figure 7. The baseflow correlated with the PDO at the 2-year band at Chaochou and Hsinpei stations from 2000 to 2005; correlated with the PDO at the 4–8-year band at Chukou, Tsochen, Hsinshih, Chungtechou, and Chaochou stations. The stations are significantly correlated in some years, except for Tsochen and Chungtechou stations, and the Chukou and Chaochou stations are correlated after 2005. The baseflow correlated with the PDO above the 8-year band at Chukou, Tsochen, Chungtechou, Santimen, and Hsinpei stations, which are moderately or very significantly correlated throughout the study period. In addition, all stations show a periodic change in correlation at the 1-year band.
The phase angles of the PDO and baseflow are similar to those of the ENSO and baseflow, and they show negative phases, except at Chukou station. The baseflow is more strongly correlated with the PDO than with the ENSO, indicating that the PDO has a greater effect on baseflow than the ENSO. However, their impacts on baseflow are similar. The ENSO and PDO are large-scale climate patterns in the Pacific Ocean and are closely related. A change in the PDO may result in an SST anomaly and a change in the relationship with the ENSO [74]. The PDO is associated with SST fluctuation similar to that of the ENSO in the Pacific, which is more prominent in temperate regions, especially in the North Pacific [75,76]. When the ENSO and PDO are in phase, the correlation with the ENSO around the Pacific increases [77]. In this study, the PDO shows a more significant negative correlation with baseflow than the ENSO. This phenomenon was also reported by Li et al. [78], who discussed the impact of the PDO on climate change throughout East Asia. Some studies have also shown that climate characteristics in the low-latitude Pacific are more strongly correlated with the PDO than with the ENSO [79], resulting in changes in the circulation in this area; these results are consistent with those of this study. Gonsamo et al. [80] reported that the PDO was in a positive phase from 1980 to 2000 and entered a negative phase in early 2000. The PDO has a period of approximately 20–30 years; therefore, before 2030, the SST in the equatorial Eastern Pacific will be high and form an anticyclonic wind field near the Philippine Sea. Taiwan is located on the northwest side of the wind field, and the enhanced southwest wind brings moisture into Taiwan and increases precipitation [81], consistent with the baseflow increase after 2000 in this study (Table 4). However, the anticyclonic wind field is unfavorable to typhoon development and thus decreases the precipitation resulting from typhoons in Taiwan. Therefore, the impact of the PDO on precipitation in Taiwan should be studied further.
In addition, because the ENSO and PDO have different periods, they affect the baseflow at different times. Because the study period is short, the analysis of the effects of these two climate patterns on baseflow cannot reveal the phase relationship above the 8-year band, and thus it is difficult to analyze the correlation on longer time scales. Overall, the ENSO and PDO have similar effects on baseflow in Southern Taiwan, but the PDO has a stronger effect on baseflow than the ENSO. The former is at the 4–8-year band, and the latter is at the 8-year band, with a periodic correlation change at the 1-year band.

3.6. Uncertainty Analysis

The significance of long-term baseflow trend analysis was implemented by the Mann–Kendall test without considering the serial correlation in this study. Positive (negative) serial correlation overestimates (underestimates) the significance of the trend if serial correlation is not taken into account [82,83]. Therefore, this study may overestimate the significance of the trend since the hydrometeorological variables are often in positive serial correlation. The number of basins with a significant upward trend may be reduced after serial correlation is taken into account. However, the change in results do not have much effect on the final conclusion. The more accurate trend analysis can be obtained by using the pre-whitening Mann–Kendall analysis [82,83] in the future study.
The MLR analysis, sensitivity analysis, and Budyko hypothesis (four equations) were used to quantify the relative contributions of climate change and human activities to baseflow variations. Although most basins in this study consistently showed that climate change contributes more than human activities, the quantized results of different methods still showed considerable variation. The reasons for the uncertainty include different considerations of climate change factors, indirect assessments of human activities, and complex interactions among factors driving baseflow variation. Actual evaporation was regarded as the factor affecting the baseflow caused by climate change in the MLR analysis, while the sensitivity analysis and Budyko hypothesis regarded potential evaporation as the factor affecting the baseflow caused by climate change. Therefore, different climate factors that were considered may cause different results. Another related reason resulted from the difficulty of quantifying human activities and the lack of relevant data. The contributions of climate change are often assessed first, and then the remaining changes are regarded as caused by human activities in attribution analysis, Therefore, the contribution of human activities depends on climate change, and the results do not necessarily reflect real human activities. The factors of climate change and human activities are not completely independent; for example, both human activities and climate change will affect vegetation. However, vegetation was regarded as human activities in this study because vegetation is neither precipitation nor evapotranspiration. Therefore, complex interactions lead to uncertainty in the results of the attribution analysis.

4. Conclusions

This study investigated the variation in baseflow in the main Southern Taiwan Basin through: (1) analyzing the trend of long-term baseflow using the Mann–Kendall test and Sen’s slope; (2) identifying the controlling factors affecting baseflow using partial correlation; (3) quantifying the contribution of human activities and climate changes to the baseflow variation using sensitivity analysis, MLR analysis and Budyko hypothesis; and (4) evaluating the coherence between baseflow and large-scale climate patterns using wavelet analysis. The results showed that streamflow and baseflow exhibited a significant increasing trend in the Southern Taiwan Basin. The BFI results show that the baseflow has a smaller effect on streamflow variation than runoff but cannot be ignored. Correlation analysis showed that precipitation and evapotranspiration have similar correlations with baseflow because they are both concentrated in the wet season. In addition, partial correlation analysis showed that the correlation between baseflow and precipitation is much stronger than that between baseflow and evaporation, indicating that precipitation is the main climate variable controlling baseflow in the Southern Taiwan Basin. Baseflow attribution analysis showed that climate change has a much greater effect on baseflow (+75.0%) than human activities (−2.9%), indicating that baseflow is affected mainly by climate change. Climate change increases baseflow because of increased precipitation, and human activities decrease baseflow because of increased urbanization and decreased forest land area. The human activities had relatively less influence on baseflow and the baseflow variation is more consistent with the pattern of climate variation. Wavelet analysis showed that baseflow is correlated with the ENSO at the 4–8-year band and with the PDO at the 8-year band, and the periodic correlation changes at the 1-year band. Baseflow is more strongly affected by the PDO than by the ENSO, and moisture resulting from the anticyclone generated by the negative phase of the PDO after 2000 was consistent with the change points of baseflow. In addition, the phase angles of the ENSO and PDO indicate negative relationships; that is, when the ENSO or PDO is in the positive phase, baseflow decreases, and vice versa. This study clarify the changes in and periodicity of baseflow with time and the relationship between climate characteristics and baseflow. The results are helpful for understanding the baseflow variation trend and possible mechanisms, as well as providing a reference for water resource management in Southern Taiwan, where precipitation and streamflow are highly uneven within a year.

Author Contributions

Conceptualization, H.-Y.C. and Y.-H.H.; methodology, H.-Y.C.; formal analysis, Y.-H.H. and C.-C.H.; writing—original draft preparation, H.-Y.C. and Y.-H.H.; writing—review and editing, H.-F.Y.; supervision, H.-F.Y. All authors have read and agreed to the published version of the manuscript.

Funding

This research received no external funding.

Institutional Review Board Statement

Not applicable.

Informed Consent Statement

Not applicable.

Data Availability Statement

Precipitation and streamflow data were accessible online at https://gweb.wra.gov.tw/wrhygis/ (accessed on 1 July 2021); Evaporation data was accessible online at https://www.gleam.eu/ (accessed on 14 October 2021).

Conflicts of Interest

The authors declare no conflict of interest.

References

  1. Hodgkins, G.A.; Dudley, R.W. Historical summer base flow and stormflow trends for New England rivers. Water Resour. Res. 2011, 47. [Google Scholar] [CrossRef]
  2. Miller, M.P.; Susong, D.D.; Shope, C.L.; Heilweil, V.M.; Stolp, B.J. Continuous estimation of baseflow in snowmelt-dominated streams and rivers in the Upper Colorado River Basin: A chemical hydrograph separation approach. Water Resour. Res. 2014, 50, 6986–6999. [Google Scholar] [CrossRef]
  3. Ficklin, D.L.; Robeson, S.M.; Knouft, J.H. Impacts of recent climate change on trends in baseflow and stormflow in United States watersheds. Geophys. Res. Lett. 2016, 43, 5079–5088. [Google Scholar] [CrossRef]
  4. Price, K. Effects of watershed topography, soils, land use, and climate on baseflow hydrology in humid regions: A review. Prog. Phys. Geogr. Earth Environ. 2011, 35, 465–492. [Google Scholar] [CrossRef]
  5. Raffensperger, J.P.; Baker, A.C.; Blomquist, J.D.; Hopple, J.A. Optimal Hydrograph Separation Using a Recursive Digital Filter Constrained by Chemical Mass Balance, with Application to Selected Chesapeake Bay Watersheds (no. 2017-5034); US Geological Survey: Reston, VA, USA, 2017. [Google Scholar]
  6. Sun, W.; Song, X.; Zhang, Y.; Chiew, F.; Post, D.; Zheng, H.; Song, S. Coal Mining Impacts on Baseflow Detected Using Paired Catchments. Water Resour. Res. 2020, 56, e2019WR025770. [Google Scholar] [CrossRef]
  7. Li, Y.; Zhang, Q. Historical and predicted variations of baseflow in China’s Poyang Lake catchment. River Res. Appl. 2018, 34, 1286–1297. [Google Scholar] [CrossRef]
  8. Rumsey, C.A.; Miller, M.P.; Sexstone, G.A. Relating hydroclimatic change to streamflow, baseflow, and hydrologic partitioning in the Upper Rio Grande Basin, 1980 to 2015. J. Hydrol. 2020, 584, 124715. [Google Scholar] [CrossRef]
  9. Tan, X.; Liu, B.; Tan, X. Global changes in baseflow under the impacts of changing climate and vegetation. Water Resour. Res. 2020, 56, e2020WR027349. [Google Scholar] [CrossRef]
  10. Ayers, J.R.; Villarini, G.; Schilling, K.; Jones, C. On the statistical attribution of changes in monthly baseflow across the U.S. Midwest. J. Hydrol. 2021, 592, 125551. [Google Scholar] [CrossRef]
  11. Cheng, Q.; Zhong, F.; Wang, P. Baseflow dynamics and multivariate analysis using bivariate and multiple wavelet coherence in an alpine endorheic river basin (Northwest China). Sci. Total. Environ. 2021, 772, 145013. [Google Scholar] [CrossRef]
  12. Rumsey, C.A.; Miller, M.P.; Schwarz, G.E.; Hirsch, R.M.; Susong, D.D. The role of baseflow in dissolved solids delivery to streams in the Upper Colorado River Basin. Hydrol. Process. 2017, 31, 4705–4718. [Google Scholar] [CrossRef]
  13. Ahiablame, L.; Sheshukov, A.Y.; Rahmani, V.; Moriasi, D. Annual baseflow variations as influenced by climate variability and agricultural land use change in the Missouri River Basin. J. Hydrol. 2017, 551, 188–202. [Google Scholar] [CrossRef] [Green Version]
  14. Zhang, J.; Song, J.; Cheng, L.; Zheng, H.; Wang, Y.; Huai, B.; Sun, W.; Qi, S.; Zhao, P.; Wang, Y.; et al. Baseflow estimation for catchments in the Loess Plateau, China. J. Environ. Manag. 2019, 233, 264–270. [Google Scholar] [CrossRef]
  15. Fan, Y.; Chen, Y.; Liu, Y.; Li, W. Variation of baseflows in the headstreams of the Tarim River Basin during 1960–2007. J. Hydrol. 2013, 487, 98–108. [Google Scholar] [CrossRef]
  16. Gan, R.; Sun, L.; Luo, Y. Baseflow characteristics in alpine rivers—A multi-catchment analysis in Northwest China. J. Mt. Sci. 2015, 12, 614–625. [Google Scholar] [CrossRef]
  17. Rezaei, A.; Gurdak, J.J. Large-scale climate variability controls on climate, vegetation coverage, lake and groundwater storage in the Lake Urmia watershed using SSA and wavelet analysis. Sci. Total. Environ. 2020, 724, 138273. [Google Scholar] [CrossRef]
  18. Li, H.; Wang, W.; Fu, J.; Chen, Z.; Ning, Z.; Liu, Y. Quantifying the relative contribution of climate variability and human activities impacts on baseflow dynamics in the Tarim River Basin, Northwest China. J. Hydrol. Reg. Stud. 2021, 36, 100853. [Google Scholar] [CrossRef]
  19. Gonzales, A.L.; Nonner, J.; Heijkers, J.; Uhlenbrook, S. Comparison of different base flow separation methods in a lowland catchment. Hydrol. Earth Syst. Sci. 2009, 13, 2055–2068. [Google Scholar] [CrossRef] [Green Version]
  20. Kinkela, K.; Pearce, L.J. Assessment of baseflow seasonality and application to design flood events in southwest Western Australia. Australas. J. Water Resour. 2014, 18, 27–38. [Google Scholar] [CrossRef]
  21. Szilagyi, J.; Harvey, F.E.; Ayers, J.F. Regional Estimation of Base Recharge to Ground Water Using Water Balance and a Base-Flow Index. Groundwater 2003, 41, 504–513. [Google Scholar] [CrossRef]
  22. Collischonn, W.; Fan, F.M. Defining parameters for Eckhardt’s digital baseflow filter. Hydrol. Process. 2013, 27, 2614–2622. [Google Scholar] [CrossRef]
  23. Lyne, V.; Hollick, M. Stochastic time-variable rainfall-runoff modelling. In Institute of Engineers Australia National Conference; Institute of Engineers Australia: Barton, Australia, 1979; Volume 79, pp. 89–93. [Google Scholar]
  24. Eckhardt, K. A comparison of baseflow indices, which were calculated with seven different baseflow separation methods. J. Hydrol. 2008, 352, 168–173. [Google Scholar] [CrossRef]
  25. Sloto, R.A.; Crouse, M.Y. HYSEP: A computer program for streamflow hydrograph separation and analysis. Water-Resour. Investig. Rep. 1996, 96, 4040. [Google Scholar]
  26. Rutledge, A.T. Computer Programs for Describing the Recession of Ground-Water Discharge and for Estimating Mean Ground-Water Recharge and Discharge From Streamflow Records: Update (No. 98); US Department of the Interior; US Geological Survey: Reston, VA, USA, 1998. [Google Scholar]
  27. Techamahasaranont, J.; Shrestha, S.; Babel, M.S.; Shrestha, R.P.; Jourdain, D. Spatial and temporal variation in the trends of hydrological response of forested watersheds in Thailand. Environ. Earth Sci. 2017, 76, 430. [Google Scholar] [CrossRef]
  28. Lucas, M.; Kublik, N.; Rodrigues, D.; Neto, A.M.; Almagro, A.; Melo, D.; Zipper, S.; Oliveira, P. Significant Baseflow Reduction in the Sao Francisco River Basin. Water 2020, 13, 2. [Google Scholar] [CrossRef]
  29. Hu, C.; Zhao, D.; Jian, S. Baseflow estimation in typical catchments in the Yellow River Basin, China. Water Supply 2021, 21, 648–667. [Google Scholar] [CrossRef]
  30. Water Resource Agency. Hydrology Annual Report; Water Resource Agency, MOEA: Taipei, Taiwan, 2020. [Google Scholar]
  31. Taiwan Waterworks Statistical Annual Report, Taiwan Waterworks Statistical Annual Report; Taiwan Water Corporation: Taipei, Taiwan, 2020.
  32. Huang, S.-H.; Mahmud, K.; Chen, C.-J. Meaningful Trend in Climate Time Series: A Discussion Based on Linear and Smoothing Techniques for Drought Analysis in Taiwan. Atmosphere 2022, 13, 444. [Google Scholar] [CrossRef]
  33. Yeh, H.; Huang, C. Evaluation of basin storage–discharge sensitivity in Taiwan using low-flow recession analysis. Hydrol. Process. 2019, 33, 1434–1447. [Google Scholar] [CrossRef]
  34. Martens, B.; Gonzalez Miralles, D.; Lievens, H.; Van Der Schalie, R.; De Jeu, R.A.M.; Fernández-Prieto, D.; Beck, H.E.; Dorigo, W.A.; Verhoest, N.E.C. GLEAM v3: Satellite-based land evaporation and root-zone soil moisture. Geosci. Model Dev. 2017, 10, 1903–1925. [Google Scholar] [CrossRef] [Green Version]
  35. Tsao, J.; Lee, C.-H.; Yeh, H.-F. Attribution of Streamflow Variations in Southern Taiwan. Water 2020, 12, 2465. [Google Scholar] [CrossRef]
  36. Mantua, N.J.; Hare, S.R.; Zhang, Y.; Wallace, J.M.; Francis, R.C. A Pacific interdecadal climate oscillation with impacts on salmon production. Bull. Am. Meteorol. Soc. 1997, 78, 1069–1080. [Google Scholar] [CrossRef]
  37. Mann, H.B. Nonparametric tests against trend. Econometrica. J. Econom. Soc. 1945, 13, 245–259. [Google Scholar] [CrossRef]
  38. Kendall, M.G. Rank Correlation Methods; Richard Griffin & Co.: Glasgow, Scotland, 1948. [Google Scholar] [CrossRef]
  39. Sen, P.K. Estimates of the regression coefficient based on Kendall’s tau. J. Am. Stat. Assoc. 1968, 63, 1379–1389. [Google Scholar] [CrossRef]
  40. Theil, H. A rank-invariant method of linear and polynomial regression analysis. In Henri Theil’s Contributions to Economics and Econometrics; Springer: Dordrecht, The Netherlands, 1992. [Google Scholar]
  41. Pettitt, A.N. A non-parametric approach to the change-point problem. J. R. Stat. Soc. Ser. C 1979, 28, 126–135. [Google Scholar] [CrossRef]
  42. Baba, K.; Shibata, R.; Sibuya, M. Partial correlation and conditional correlation as measures of conditional independence. Aust. N. Z. J. Stat. 2004, 46, 657–664. [Google Scholar] [CrossRef]
  43. Schaake, J.C. From climate to flow. In Climate Change and US Water Resources; John Wiley: New York, UY, USA, 1990; pp. 177–206. [Google Scholar]
  44. Zheng, H.; Zhang, L.; Zhu, R.; Liu, C.; Sato, Y.; Fukushima, Y. Responses of streamflow to climate and land surface change in the headwaters of the Yellow River Basin. Water Resour. Res. 2009, 45. [Google Scholar] [CrossRef]
  45. Kim, J.H.; Jackson, R.B. A Global Analysis of Groundwater Recharge for Vegetation, Climate, and Soils. Vadose Zone J. 2012, 11, vzj2011.0021RA. [Google Scholar] [CrossRef] [Green Version]
  46. Sharifi, A.; Mirabbasi, R.; Nasr-Esfahani, M.A.; Haghighi, A.T.; Nafchi, R.F. Quantifying the impacts of anthropogenic changes and climate variability on runoff changes in central plateau of Iran using nine methods. J. Hydrol. 2021, 603, 127045. [Google Scholar] [CrossRef]
  47. Budyko, M.I. Climate and Life; Academic Press: Cambridge, MA, USA, 1974. [Google Scholar]
  48. Choudhury, B. Evaluation of an empirical equation for annual evaporation using field observations and results from a biophysical model. J. Hydrol. 1999, 216, 99–110. [Google Scholar] [CrossRef]
  49. Schreiber, P. Über die Beziehungen zwischen dem Niederschlag und der Wasserführung der Flüsse in Mitteleuropa. Z. Meteorol. 1904, 21, 441–452. (In German) [Google Scholar]
  50. Nathan, R.J.; McMahon, T.A. Evaluation of automated techniques for base flow and recession analyses. Water Resour. Res. 1990, 26, 1465–1473. [Google Scholar] [CrossRef]
  51. Longobardi, A.; Villani, P. Baseflow index regionalization analysis in a mediterranean area and data scarcity context: Role of the catchment permeability index. J. Hydrol. 2008, 355, 63–75. [Google Scholar] [CrossRef]
  52. Sawicz, K.; Wagener, T.; Sivapalan, M.; Troch, P.A.; Carrillo, G. Catchment classification: Empirical analysis of hydrologic similarity based on catchment function in the eastern USA. Hydrol. Earth Syst. Sci. 2011, 15, 2895–2911. [Google Scholar] [CrossRef] [Green Version]
  53. Yang, H.; Yang, D.; Lei, Z.; Sun, F. New analytical derivation of the mean annual water-energy balance equation. Water Resour. Res. 2008, 44, 893–897. [Google Scholar] [CrossRef]
  54. Wang, D.; Tang, Y. A one-parameter Budyko model for water balance captures emergent behavior in darwinian hydrologic models. Geophys. Res. Lett. 2014, 41, 4569–4577. [Google Scholar] [CrossRef] [Green Version]
  55. Liang, W.; Bai, D.; Wang, F.; Fu, B.; Yan, J.; Wang, S.; Yang, Y.; Long, D.; Feng, M. Quantifying the impacts of climate change and ecological restoration on streamflow changes based on a Budyko hydrological model in China’s Loess Plateau. Water Resour. Res. 2015, 51, 6500–6519. [Google Scholar] [CrossRef]
  56. Fu, B.P. On the calculation of the evaporation from land surface. Chin. J. Atmos. Sci. 1981, 1, 002. (In Chinese) [Google Scholar]
  57. Zhang, L.; Dawes, W.R.; Walker, G.R. Response of mean annual evapotranspiration to vegetation changes at catchment scale. Water Resour. Res. 2001, 37, 701–708. [Google Scholar] [CrossRef]
  58. Mo, C.; Ruan, Y.; Xiao, X.; Lan, H.; Jin, J. Impact of climate change and human activities on the baseflow in a typical karst basin, Southwest China. Ecol. Indic. 2021, 126, 107628. [Google Scholar] [CrossRef]
  59. Grinsted, A.; Moore, J.C.; Jevrejeva, S. Application of the cross wavelet transform and wavelet coherence to geophysical time series. Nonlinear Process. Geophys. 2004, 11, 561–566. [Google Scholar] [CrossRef]
  60. Xu, X.; Yang, D.; Yang, H.; Lei, H. Attribution analysis based on the Budyko hypothesis for detecting the dominant cause of runoff decline in Haihe basin. J. Hydrol. 2014, 510, 530–540. [Google Scholar] [CrossRef]
  61. Statistical Yearbook of Interior. In The Annual Report of Internal Affairs Statistics E-Book in 108 Year; Statistics Department of the Ministry of the Interior: Taipei, Taiwan, 2019.
  62. Chen, L.Q.; Liu, C.M.; Li, F.D. Review on basic flow researches. Progr. Geogr. 2006, 13, 1–15. (In Chinese) [Google Scholar]
  63. Zhao, G.; Tian, P.; Mu, X.; Jiao, J.; Wang, F.; Gao, P. Quantifying the impact of climate variability and human activities on streamflow in the middle reaches of the Yellow River basin, China. J. Hydrol. 2014, 519, 387–398. [Google Scholar] [CrossRef]
  64. Wu, J.; Miao, C.; Zhang, X.; Yang, T.; Duan, Q. Detecting the quantitative hydrological response to changes in climate and human activities. Sci. Total Environ. 2017, 586, 328–337. [Google Scholar] [CrossRef]
  65. Wu, J.; Miao, C.; Duan, Q.; Lei, X.; Li, X.; Li, H. Dynamics and Attributions of Baseflow in the Semiarid Loess Plateau. J. Geophys. Res. Atmos. 2019, 124, 3684–3701. [Google Scholar] [CrossRef]
  66. Li, Z.; Liu, W.; Zhang, J.; Zheng, F.-L. Impacts of land use change and climate variability on hydrology in an agricultural catchment on the Loess Plateau of China. J. Hydrol. 2009, 377, 35–42. [Google Scholar] [CrossRef]
  67. Miao, C.; Ni, J.; Borthwick, A.G.; Yang, L. A preliminary estimate of human and natural contributions to the changes in water discharge and sediment load in the Yellow River. Glob. Planet. Chang. 2011, 76, 196–205. [Google Scholar] [CrossRef] [Green Version]
  68. Kong, D.; Miao, C.; Wu, J.; Duan, Q. Impact assessment of climate change and human activities on net runoff in the Yellow River Basin from 1951 to 2012. Ecol. Eng. 2016, 91, 566–573. [Google Scholar] [CrossRef]
  69. Xie, Z.; Mu, X.; Gao, P.; Wu, C.; Qiu, D. Impacts of Climate and Anthropogenic Activities on Streamflow Regimes in the Beiluo River, China. Water 2021, 13, 2892. [Google Scholar] [CrossRef]
  70. Mu, Z.; Liu, G.; Lin, S.; Fan, J.; Qin, T.; Li, Y.; Cheng, Y.; Zhou, B. Base Flow Variation and Attribution Analysis Based on the Budyko Theory in the Weihe River Basin. Water 2022, 14, 334. [Google Scholar] [CrossRef]
  71. Wang, D.; Cai, X. Comparative study of climate and human impacts on seasonal baseflow in urban and agricultural watersheds. Geophys. Res. Lett. 2010, 37. [Google Scholar] [CrossRef]
  72. Yang, Q.; Li, Z.; Han, Y.; Gao, H. Responses of Baseflow to Ecological Construction and Climate Change in Different Geomorphological Types in The Middle Yellow River, China. Water 2020, 12, 304. [Google Scholar] [CrossRef] [Green Version]
  73. Aboelnour, M.; Gitau, M.W.; Engel, B.A. A Comparison of Streamflow and Baseflow Responses to Land-Use Change and the Variation in Climate Parameters Using SWAT. Water 2020, 12, 191. [Google Scholar] [CrossRef]
  74. Duan, W.; Song, L.; Li, Y.; Mao, J. Modulation of PDO on the predictability of the interannual variability of early summer rainfall over south China. J. Geophys. Res. Atmos. 2013, 118, 13008–13021. [Google Scholar] [CrossRef]
  75. Han, W.; Meehl, G.A.; Hu, A.; Alexander, M.A.; Yamagata, T.; Yuan, D.; Ishii, M.; Pegion, P.; Zheng, J.; Hamlington, B.D.; et al. Intensification of decadal and multi-decadal sea level variability in the western tropical Pacific during recent decades. Clim. Dyn. 2013, 43, 1357–1379. [Google Scholar] [CrossRef]
  76. Meehl, G.A.; Hu, A. Megadroughts in the Indian Monsoon Region and Southwest North America and a Mechanism for Associated Multidecadal Pacific Sea Surface Temperature Anomalies. J. Clim. 2006, 19, 1605–1623. [Google Scholar] [CrossRef]
  77. Yeh, S.-W.; Cai, W.; Min, S.-K.; McPhaden, M.J.; Dommenget, D.; Dewitte, B.; Collins, M.; Ashok, K.; An, S.-I.; Yim, B.-Y.; et al. ENSO Atmospheric Teleconnections and Their Response to Greenhouse Gas Forcing. Rev. Geophys. 2018, 56, 185–206. [Google Scholar] [CrossRef] [Green Version]
  78. Li, H.; Dai, A.; Zhou, T.; Lu, J. Responses of East Asian summer monsoon to historical SST and atmospheric forcing during 1950–2000. Clim. Dyn. 2010, 34, 501–514. [Google Scholar] [CrossRef] [Green Version]
  79. Wu, C.-R. Interannual modulation of the Pacific Decadal Oscillation (PDO) on the low-latitude western North Pacific. Prog. Oceanogr. 2013, 110, 49–58. [Google Scholar] [CrossRef]
  80. Gonsamo, A.; Chen, J.M.; Lombardozzi, D. Global vegetation productivity response to climatic oscillations during the satellite era. Glob. Chang. Biol. 2016, 22, 3414–3426. [Google Scholar] [CrossRef] [PubMed]
  81. Hung, C.-W.; Hsu, H.-H.; Lu, M.-M. Decadal oscillation of spring rain in northern Taiwan. Geophys. Res. Lett. 2004, 31. [Google Scholar] [CrossRef] [Green Version]
  82. Yue, S.; Wang, C.Y. Applicability of prewhitening to eliminate the influence of serial correlation on the Mann-Kendall test. Water Resour. Res. 2002, 38, 4-1–4-7. [Google Scholar] [CrossRef]
  83. Yue, S.; Pilon, P.; Phinney, B.; Cavadias, G. The influence of autocorrelation on the ability to detect trend in hydrological series. Hydrol. Process. 2002, 16, 1807–1829. [Google Scholar] [CrossRef]
Figure 1. Spatial distribution of river streamflow and precipitation stations in Southern Taiwan Basin.
Sustainability 15 03600 g001
Figure 2. Variation trends of streamflow, baseflow, and precipitation.
Sustainability 15 03600 g002
Figure 3. Variation trend of baseflow and BFI.
Sustainability 15 03600 g003
Figure 6. Wavelet coherence of baseflow and ENSO. The direction of the arrow (left/right) represents the phase relationship (negative/positive) between the two time series, which varies between π and −π angles. The direction of the arrow (up/down) represents the lead-lag between the two time series. The white dotted curve represents the 5% significance level.
Sustainability 15 03600 g006
Figure 7. Wavelet coherence of baseflow and PDO. The direction of the arrow (left/right) represents the phase relationship (negative/positive) between the two time series, which varies between π and −π angles. The direction of the arrow (up/down) represents the lead–lag between the two time series. The white dotted curve represents the 5% significance level.
Sustainability 15 03600 g007
Table 1. Information on Southern Taiwan Basin.
BasinBasin Area (km2)Mean Streamflow (mm/year)Mean Precipitation (mm/year)Study YearStreamflow StationPrecipitation Station
StationTWD67_XTWD67_YStationTWD67_XTWD67_Y
Bazhang River408.12539.23394.61980~2018Chukou208,946.82,593,107Dahushan210,373.72,597,161
Zengwen River121.31705.42056.31989~2017Tsochen185,724.92,552,024Tsochen188,9472,550,518
Yanshui River81214362040.71981~2018Hsinshih175,074.32,551,130Hutoupi181,234.82,547,490
Laonong River146.52406.83277.51980~2008Laoning215,2702,549,901Tengzhi (2)224,1052,551,973
Erren River139.61864.92208.51982~2018Chungtechou183,721.82,530,866Gutingkeng188,079.12,532,743
Ailiao River309.92629.92990.61980~2015Santimen212,975.32,512,663Santimen213,138.62,512,242
Donggang River175.32789.32230.71993~2017Chaochou202,2422,496,785Chaochou202,683.62,492,808.8
Linbian River83.22465.72428.31980~2013Hsinpei202,878.92,484,988Nanhan211,948.62,481,928
Table 2. Single-parameter equations of Budyko hypothesis.
ModelFormula
Fu [56] E P = 1 + E 0 P ( 1 + ( E 0 P ) n ) 1 / n (11)
Choudhury [48] E P = ( 1 + n E 0 P ) / ( 1 + n E 0 P + ( E 0 P ) 1 ) (12)
Zhang et al. [57] E P = 1 / ( 1 + ( E 0 P ) n ) 1 / n (13)
Wang and Tang [54] E P = 1 + E 0 P ( 1 + E 0 P ) 2 4 n ( 2 n ) E 0 P 2 n ( 2 n ) (14)
where E is the actual evaporation, P is the precipitation, and E 0 is the potential evaporation.
Table 3. Analysis of baseflow, streamflow, and precipitation trends.
StationStudy YearMK-Test (Z)Sen’s Slope β (mm/year)
StreamflowBaseflowPrecipitationStreamflowBaseflowPrecipitation
Chukou1980~20182.49 *2.78 *1.8927.5317.5423.62
Tsochen1989~20170.380.490.582.082.179.28
Hsinshih1981~20181.842.09 *1.4518.198.7516.00
Laonong1980~20081.221.331.2923.6119.1038.66
Chungtechou1982~2018−0.04−1.111.03−0.61−3.6913.15
Santimen1980~20152.22 *2.14 *1.6542.159.7118.12
Chaochou1993~20171.542.20 *0.7732.3031.8033.71
Hsinpei1980~20131.573.32 *1.8325.7123.9023.00
* The test has significant level (p < 0.05). A positive sign indicates an upward trend; a negative sign indicates a downward trend.
Table 4. Variation of baseflow before and after change point.
StationPeriod *Baseflow (mm/year)Change (mm/year)Change Rate (%)
Chukou1980~20031258.47586.6246.6%
2004~20181845.09
Tsochen1989~2003471.4392.0119.5%
2004~2017563.44
Hsinshih1981~1995427.36227.8953.3%
1996~2018655.25
Laonong1980~20021483.87986.266.5%
2003~20082470.07
Chungtechou1982~1999689.27−82.56−12.0%
2000~2018606.71
Santimen1980~19951107.96648.9358.6%
1996~20151756.89
Chaochou1993~20081705.84426.1225.0%
2009~20172131.96
Hsinpei1980~1994954.78606.3863.5%
1995~20131561.16
* Bold is the change point year.
Table 5. Result of partial correlation analysis.
VariablesCorrelation and Partial CorrelationChukouTsochenHsinshihLaoningChungtechouSantimenChaochouHsinpei
PCorrelation E0.528 **0.544 **0.513 **0.584 **0.487 **0.388 *0.2960.297
StreamflowCorrelation P0.720 **0.852 **0.893 **0.912 **0.860 **0.708 **0.832 **0.677 **
Correlation E0.497 **0.417 *0.563 **0.585 **0.386 *0.550 **0.1690.194
Partial correlation P0.621 **0.819 **0.852 **0.867 **0.834 **0.643 **0.831 **0.662 **
Partial correlation E0.198−0.1050.2710.155−0.0740.423 *−0.146−0.01
BaseflowCorrelation P0.583 **0.660 **0.808 **0.861 **0.762*0.602 **0.754 **0.673 **
Correlation E0.386 *0.3630.613 **0.618 **0.2240.524 **0.2150.338
Partial correlation P0.484 **0.592 **0.728 **0.784 **0.767 **0.508 **0.740 **0.637 **
Partial correlation E0.1130.0050.393 *0.278−0.260.395 *−0.0130.196
BFICorrelation P−0.361 *−0.142−0.335 *0.003−0.34−0.119−0.230.114
Correlation E−0.310.0530.1550.331−0.350 *0.1390.0490.359 *
Partial correlation P−0.245−0.204−0.489 **−0.249−0.207−0.19−0.2560.008
Partial correlation E−0.1510.1570.404 *0.406 *−0.2250.2030.1250.343
* Significant at the level of p < 0.05; ** significant at the level of p < 0.01.
Disclaimer/Publisher’s Note: The statements, opinions and data contained in all publications are solely those of the individual author(s) and contributor(s) and not of MDPI and/or the editor(s). MDPI and/or the editor(s) disclaim responsibility for any injury to people or property resulting from any ideas, methods, instructions or products referred to in the content.

