Article

Parametric Analysis and Multi-Objective Optimization of Pentamode Metamaterial

1
Hubei Key Laboratory of Advanced Technology of Automotive Components, Wuhan University of Technology, Wuhan 430070, China
2
Hubei Collaborative Innovation Center for Automotive Components Technology, Wuhan University of Technology, Wuhan 430070, China
*
Author to whom correspondence should be addressed.
Sustainability 2023, 15(4), 3421; https://doi.org/10.3390/su15043421
Submission received: 6 January 2023 / Revised: 3 February 2023 / Accepted: 6 February 2023 / Published: 13 February 2023

Abstract

:
Pentamode metamaterial (PM) has enormous application potential in the design of lightweight bodies with superior vibration and noise-reduction performance. To offer systematic insights into the investigation of PMs, this paper studies the various effects (i.e., unit cell arrangement, material, and geometry) on bandgap properties through the finite element method (FEM). With regards to the influences of unit cell arrangements on bandgap properties, the results show that the PM with triangular cell arrangement (PMT) possesses better bandgap properties than the others. The effects of material and geometry on bandgap properties are then explored thoroughly. In light of the spring-mass system theory, the regulation mechanism of bandgap properties is discussed. Multi-objective optimization is conducted to further enhance the bandgap properties of PMT. Based on the Latin hypercube design and double-points infilling, a high-accuracy Kriging model, which represents the relationship between the phononic bandgap (PBG), single mode phononic bandgap (SPBG), double-cone width, and node radius, is established to seek the Pareto optimal solution sets, using the non-dominated sorting genetic algorithm (NSGA-II). A fitness function is then employed to obtain the final compromise solution. The PBG and total bandgap of PMT are widened approximately 2.2 and 0.27 times, respectively, while the SPBG is narrowed by about 0.51 times. The research offers important understanding for the investigation of PM with superior acoustic regulation capacity.

1. Introduction

Pentamode metamaterial (PM), characterized by the periodic arrangement of unit cells [1,2,3], has promising application prospects in the design of lightweight bodies, with excellent vibration and noise reduction attributed to its outstanding acoustic regulation capability [4,5,6]. In recent years, considerable literature has recognized the importance of PMs for the extensive range of scientific and industrial processes [7,8,9]. PMs are types of degenerate elastic solids with zero shear rigidity and adjustable anisotropy, and were first theoretically developed by Milton and Cherkaev in 1995 [10]. A material can be considered as PM if it only has one non-zero eigenvalue in the equivalent elastic properties of six-dimensional stress space. In addition, the shear modulus G of PMs is several orders of magnitude smaller than its bulk modulus B, and the ratio of shear modulus G to bulk modulus B is significantly larger than that of the natural material, allowing PMs to draw out the mechanical properties of traditional fluid on the whole. With these excellent features, PMs are considered to have important potential applications in noise and vibration reduction [6,11].
Based on the dimension of research, PMs can be divided into two categories: two-dimensional (2D) and three-dimensional (3D). The relationship between 2D PMs and 3D PMs is that the former is the 2D equivalent of the latter. Furthermore, 2D PMs are relatively easy to manufacture and apply compared to 3D PMs, making them one of the most widely PMs applied and studied. To promote the engineering application of PM, the ideal point connection of traditional PMs is replaced with a finite connection area, which makes it feasible to construct physical PMs using micro-nano processing technology [12], 3D printing technology [13], and detection technology [14]. Considerable research has subsequently been carried out on the engineering applications of 2D PMs. For example, Norris et al. [15] designed the invisible cloak with PMs by transformation or change-of-variables and determined that the invisible cloak constructed can achieve perfect cloaking. Li et al. [16] calculated the band structures of 2D PMs with arbitrary primitive cells to verify the existence of pentamode bands where only compressional waves exist, and analyzed the effect of the geometry parameters of primitive cells on the mechanical properties. Layman et al. [17] developed a novel 2D PM formed by an oblique honeycomb lattice, and realized the adjustment of customizable anisotropic properties of 2D PMs. Aravantinos-Zafiris et al. [18] first presented a class of PMs with layer-by-layer rod structure characteristics, and systematically explored the relationship between the mechanical properties of unit cells and acoustic performance. With these excellent properties and ability to control acoustics, 2D PMs have been widely applied in various fields, such as manipulating acoustic wavefronts [19,20,21] and underwater acoustic carpet cloaks [22,23].
The acoustic properties of PMs are closely related to their phononic bandgap (PBG). It is widely believed that the generation of PBG originates from two mechanisms, including Bragg scattering [24] and local resonance [25]. The PBG of PMs with Bragg scattering characteristics tends to open in the high-frequency interval where the acoustic wavelength is similar to its lattice constant [26,27]. It indicates that the PM based on the Bragg scattering mechanism has a limited application range due to its large structural size. To solve the problem of the PBG of Bragg PMs only residing in high-frequency regions, the PM originating the local resonance mechanism is proposed [28,29,30]. The unit cell of PMs with local resonance properties is composed of two materials: the double-cone area hard material and the soft material of the node region. Liu et al. [31] designed a locally resonant crystal fabricated by wrapping the hard matrix with soft rubber, and gained the PBG in the low-frequency range where acoustic wavelengths are much larger than their lattice constant. Huang et al. [32] realized the ultra-low frequency single-mode phononic bandgap (SPBG) in PMs by merely replacing the component material, going from aluminum to rubber. Specifically, this moves down the center frequency of SPBG nearly 600 times. Additionally, Cai et al. [33] presented a method of tuning the PBG of locally resonant PMs and explored the approximation relationship between the lower frequency characteristic of PBG and geometry.
Several theories on the tuning method of PMs’ PBG properties have been proposed, of which the equivalent spring-mass theory has been confirmed reliable [28,33,34,35,36]. Each unit cell of the locally resonant crystal of PMs comprises double-cone and node regions. The double-cone region is made of hard material to offer mass for the spring-mass system and the node region is made of soft material to provide elasticity. By inference, the method, which changes the location and proportion of hard and soft materials, is determined effective in improving bandgap properties. Considerable literature has attempted to improve the bandgap properties of PMs by adjusting geometric and material parameters [37,38,39]. For example, Li et al. [40] proposed composite PMs with hexagonal unit cells to prove the existence of bandgaps only possessing compressional modes, and analyzed the effects of geometric dimensions and material on bandgap properties. Wang et al. [41] explored the relationships among the geometry parameters of PMs, bulk modulus, and shear modulus, then calculated the band structure of the PMs proposed. Cai et al. [42] investigated the mechanical and acoustic properties of PMs with various structural parameters, and determined the relationship between bulk modulus and density. In addition, the method, which changed the symmetry of the unit cell of PMs, was used by Cai et al. [43] to enhance bandgap properties. For instance, the 3D PMs with asymmetric double-cone elements showed a better figure of merit than their symmetric counterpart. Extensive research has shown that the means of adjusting the geometric and material parameters of PMs is effective for improving bandgap properties. However, few studies have explored the influences of unit cell arrangement, geometry, and material on bandgap properties in any systematic way. It may not be appropriate to compare the results from different literature to identify the influences of unit cell arrangement, material, and geometry on bandgap properties due to the use of fairly different materials, geometry sizes, and boundary conditions.
The specific objective of this study is to address the knowledge gap described above and to offer comprehensive insight into the investigation of PMs. The tunable mechanism and bandgap method are first introduced to provide a theoretical basis. Subsequently, the PMs with distinct unit cell arrangements (i.e., triangular, square, and hexagonal) are established to determine the better unit cell arrangement form in terms of bandgap properties. Then the relationships of material, geometry parameter, and bandgap properties are disclosed based on the PMs with a better unit cell arrangement form. Finally, multi-objective optimization is conducted to further improve the bandgap properties of PMs.

2. Locally Resonant Double-Cone PMs

2.1. The Formation Mechanism of Bandgap

Unlike the Bragg scattering PBGs, the PBGs of PMs with locally resonant characteristics are formed by coupling the low-frequency resonance of unit cells as well as elastic waves in the matrix. The traditional PM unit cell, as shown in Figure 1a, is made of a single material. However, the locally resonant PMs (Figure 1b) are made with combined material to realize the control of low-frequency acoustics [36,42]. The term ‘PM’ will refer to the locally resonant PMs in a subsequent post. Additionally, the ideal point connection of conventional PMs is replaced with a finite area connection to enhance its stability. The PM with node connection is shown in Figure 1c. Each locally resonant PM unit cell consists of combined material. In other words, its double-cone and node regions are made of hard and soft materials, respectively. Figure 1c,d show the structural representation and corresponding analogous models of PMs in the PBG frequency range, respectively. Obviously, significant deformation is observed in the node region, while only slight deformation is viewed in the double-cone region. Therefore, the PMs whose locally resonant unit cell is located in the PBG frequency range are equivalent to the spring-mass system. The double-cone and node regions of PMs are treated as a mass block and a spring to offer mass and elasticity for the spring-mass system, respectively.
Figure 1e displays the simplified model of the locally resonant unit cell. Note that the matrix refers to the remaining PMs. When the vibration is propagated to the matrix in the form of elastic waves, the force F is produced to act on the matrix. Meanwhile, the force F begins to push the matrix to the right. The inertia of the mass block simultaneously yields a reacting force, with the matrix moving under the combined effect of force F and reacting force F′. When the natural frequency of the locally resonant unit cell is similar to the frequency of external vibration, resonance occurs in the PMs. However, the situation is reversed if the natural frequency of the locally resonant unit cell and external force is identical. Under the condition of antiresonance, external vibration is completely absorbed, since the combined force acting on the matrix is zero. Thus, the external vibration is limited to propagate in the PMs, with the bandgap opened at this moment.

2.2. The Regulation Method of Bandgap

Based on the spring-mass system originating from the locally resonant unit cell in the frequency range of the PBG, it is clear that the node region of PMs offers elasticity because of its deformation, and the double-cone provides mass due to its high hardness. Therefore, the frequency interval and bandwidth of the PBG can be tuned by adjusting the location and proportion of double-cone and node regions. The upper and low-frequency edges of the PBG are related to the deformation of soft material as well as the mass of hard material. Thus, it is inferred that the location and bandwidth of the PBG can be changed by adjusting the equivalent stiffness of soft material as well as the equivalent mass of hard material. Based on the investigations performed by Cai et al. [33,43], the approximate relationships among the PBG upper and low-frequency edges, material, and geometry parameters can be expressed as shown below:
{ f l 1 k 1 m 1 f t 1 k 2 ( m 1 + m 2 ) m 1 m 2
and the equivalent mass m1 and m2 can be represented as:
{ m 1 = m h + α 1 m s m 2 = α 2 m s 0 α 1 1 ,       0 α 2 1    
where fl1 and ft1 are the low and upper frequency edges of PBG, respectively. k1 and k2 are the equivalent stiffnesses of soft material corresponding to the lower and upper frequency edges of PBG, respectively. m1 and m2 are the equivalent mass determined by the mass of hard and soft materials, respectively. mh and ms are the mass of hard and soft materials, respectively. α1 and α2 are the deformation coefficients of hard and soft materials in the state of antiresonance, respectively.

3. Modeling Description

3.1. Geometrical Configuration

To analyze the effect of unit cell arrangement on the bandgap, PMs with distinct unit cell arrangements are required. According to Equation (1), the PM bandgap moves to the high-frequency region if the double-cone array number is too large, which decreases the PM’s engineering application value because of its huge size for controlling low-frequency acoustics. However, the PM’s structural stability is poor when its double-cone array number is too small. Therefore, the double-cone array numbers are set to three, four, and six in this case. The PM unit cells with hexagonal unit cell arrangement (PMH) was selected as the baseline. Then, the unit cells of PMs with triangular and square unit cell arrangements, as shown in Figure 2b,c, were established by decreasing the double-cone array numbers, respectively. Subsequently, the smallest unit cells, including triangular, square, and hexagonal unit cells, were treated as minimum structure units to construct the corresponding PM. Figure 2c–e show the PMH, PM with square unit cell arrangement (PMS), and PM with triangular unit cell arrangement (PMT), respectively. The PMH, PMS, and PMT were built by periodically arranging the smallest corresponding unit cells, respectively. The lattice constant a, node radius r, and double-cone width D of PMH, PMS, and PMT were set as the same: a = 16 mm, r = 0.3 mm, and D = 3 mm.

3.2. Finite Element Model

To analyze the PM’s bandgap properties, its band structure was obtained using COMSOL Multiphysics software according to the Bloch theorem [44,45]. Based on the formation mechanism of the bandgap, a type of hard material was applied in the double-cone region to supply mass for locally phononic crystal, and a type of soft material was adopted in the node region to offer elasticity. Therefore, the titanium alloy with density ρ = 4510 kg/m3, Young’s modulus E = 110 GPa, and Poisson’s ratio μ = 0.34 was selected as the hard material because of its high hardness, and the rubber with density ρ = 1300 kg/m3, Young’s modulus E = 1 MPa, and Poisson’s ratio μ = 0.47 was chosen as the soft material due to its excellent elasticity. The PBG and SPBG of PMs could be gained by analyzing their band structure. Specifically, the frequency range with no energy band was known as the PBG, while the frequency range with only one energy band was considered the SPBG.

4. The Bandgap Properties of PMs with Various Unit Cell Arrangements

4.1. The Indicators of Bandgap Properties

In this section, a parametric investigation is performed to explore the influences of unit cell arrangements on bandgap properties. To begin with, the indicators of bandgap properties are necessary, to evaluate the PM’s acoustic regulation ability. Thus, several evaluation indexes are proposed for the subsequent investigation, such as PBG, SPBG, and total bandgap. The specific indicators comprise the upper frequency edges (ft1), the low-frequency edge (fl1), and the bandwidth (Abw1) of PBG; the upper frequency edges (ft2), the low-frequency edge (fl2), and the bandwidth (Abw2) of SPBG; and the total bandwidth of PBG and SPBG (Atotal).

4.2. The Bandgap Properties of PMHs

Figure 3a shows the band structure of PMH. Obviously, there is a block area and a gray region. The block region, which has no energy bands within its frequency range, is the PBG suppressing all acoustic propagation. However, the gray region is known as the SPBG because there is only one energy band. The upper and low-frequency edges and absolute bandwidth of PBG are 720.3 Hz, 706.9 Hz, and 13.4 Hz, respectively, and those of SPBG are 310.4 Hz, 41.9 Hz, and 268.5 Hz, respectively. For the purposes of exploring the PBG generation mechanism, the labeled points E and F, whose relevant frequencies are 689.8 Hz and 712.3 Hz, respectively, are selected to analyze their modes. Figure 3b,c display the modes of points E and F, respectively. It is obvious that the node region of the unit cell labeled E experiences torsional vibration, while its double-cone area hardly generates any vibration. Therefore, the PBG is not opened at point E because it is difficult to couple the lengthy wave of the double-cone region with the vibration of the node region. The translational motion of the node region is observed in the mode of point F. It is important to note that the double-cone region is translated under the action of node region motion. At the same time, the PBG of PMH is opened owing to the coupling between the lengthy wave of the double-cone region and the vibration of the node region. Additionally, the PBG’s bandwidth is small and can be further increased. Furthermore, to verify the PMH’s capability of preventing acoustic propagation within the frequency range of PBG, the simulation model, as shown in Figure 3d, is constructed, of which the block structure and gray region are PMH and waters, respectively. In the sound solid coupling module of COMSOL, all the boundaries are defined as plane radiation to limit reflections from the boundaries. The acoustic transmission loss (TL), which indicates the difference between the acoustics before and after passing through PMH, is adopted as the evaluation indicator. The plane wave with a frequency of 300–800 Hz is injected from the left side of the waters. The result of TL is illustrated in Figure 3e; it is obvious that TL reaches a peak value of approximately 708.6 Hz, which determines that PMH can limit the acoustic propagation in the frequency range of PBG.
The SPBG of PMH contains just one energy band, indicating that the PMH only permits acoustic propagation with the frequency of SPBG. To analyze the generation mechanism of SPBG, the labeled points A, B, C, and D, as shown in Figure 3a, are adopted to analyze their modes. The modes of labeled points A, B, C, and D are shown in Figure 4a–d, respectively. Obviously, the directions of the wave vector in labeled points A and B are perpendicular, and the vibration direction in point A is horizontal, while that of point B is vertical. Thus, based on the relationship between the vibration and direction of wave vector, points C and D correspond to the shear wave and compressional wave, respectively. This is to say, only the compressional wave can propagate in the frequency range of SPBG. It means that the PMH can be considered a complex fluid with a solid form at this time. Furthermore, for exploring the SPBG properties of PMH and analyzing the matching degree of PMH with fluids, the simulation model, which comprises PMH and waters, is established in Figure 4e. The boundaries of the SPBG simulation model are in accordance with that of the PBG simulation model (Figure 3d), limiting acoustic reflections from them. The sound solid coupling module of COMSOL is adopted to study the sound pressure distributions (SPD) of the simulation model with and without PMH, respectively. The incident wave with a frequency of 250 Hz is applied to the left edge of the simulation model, and then comes out from the right edge. The acoustic speed in waters is set as 1500 m/s. Figure 4g,h show the results of SPD, respectively. Clearly, the SPD of the simulation model with PMH is in line with that of the simulation model without PMH; it determines that the PMH in the frequency range of SPBG is well matched with the fluids.

4.3. The Bandgap Properties of PMS and PMT

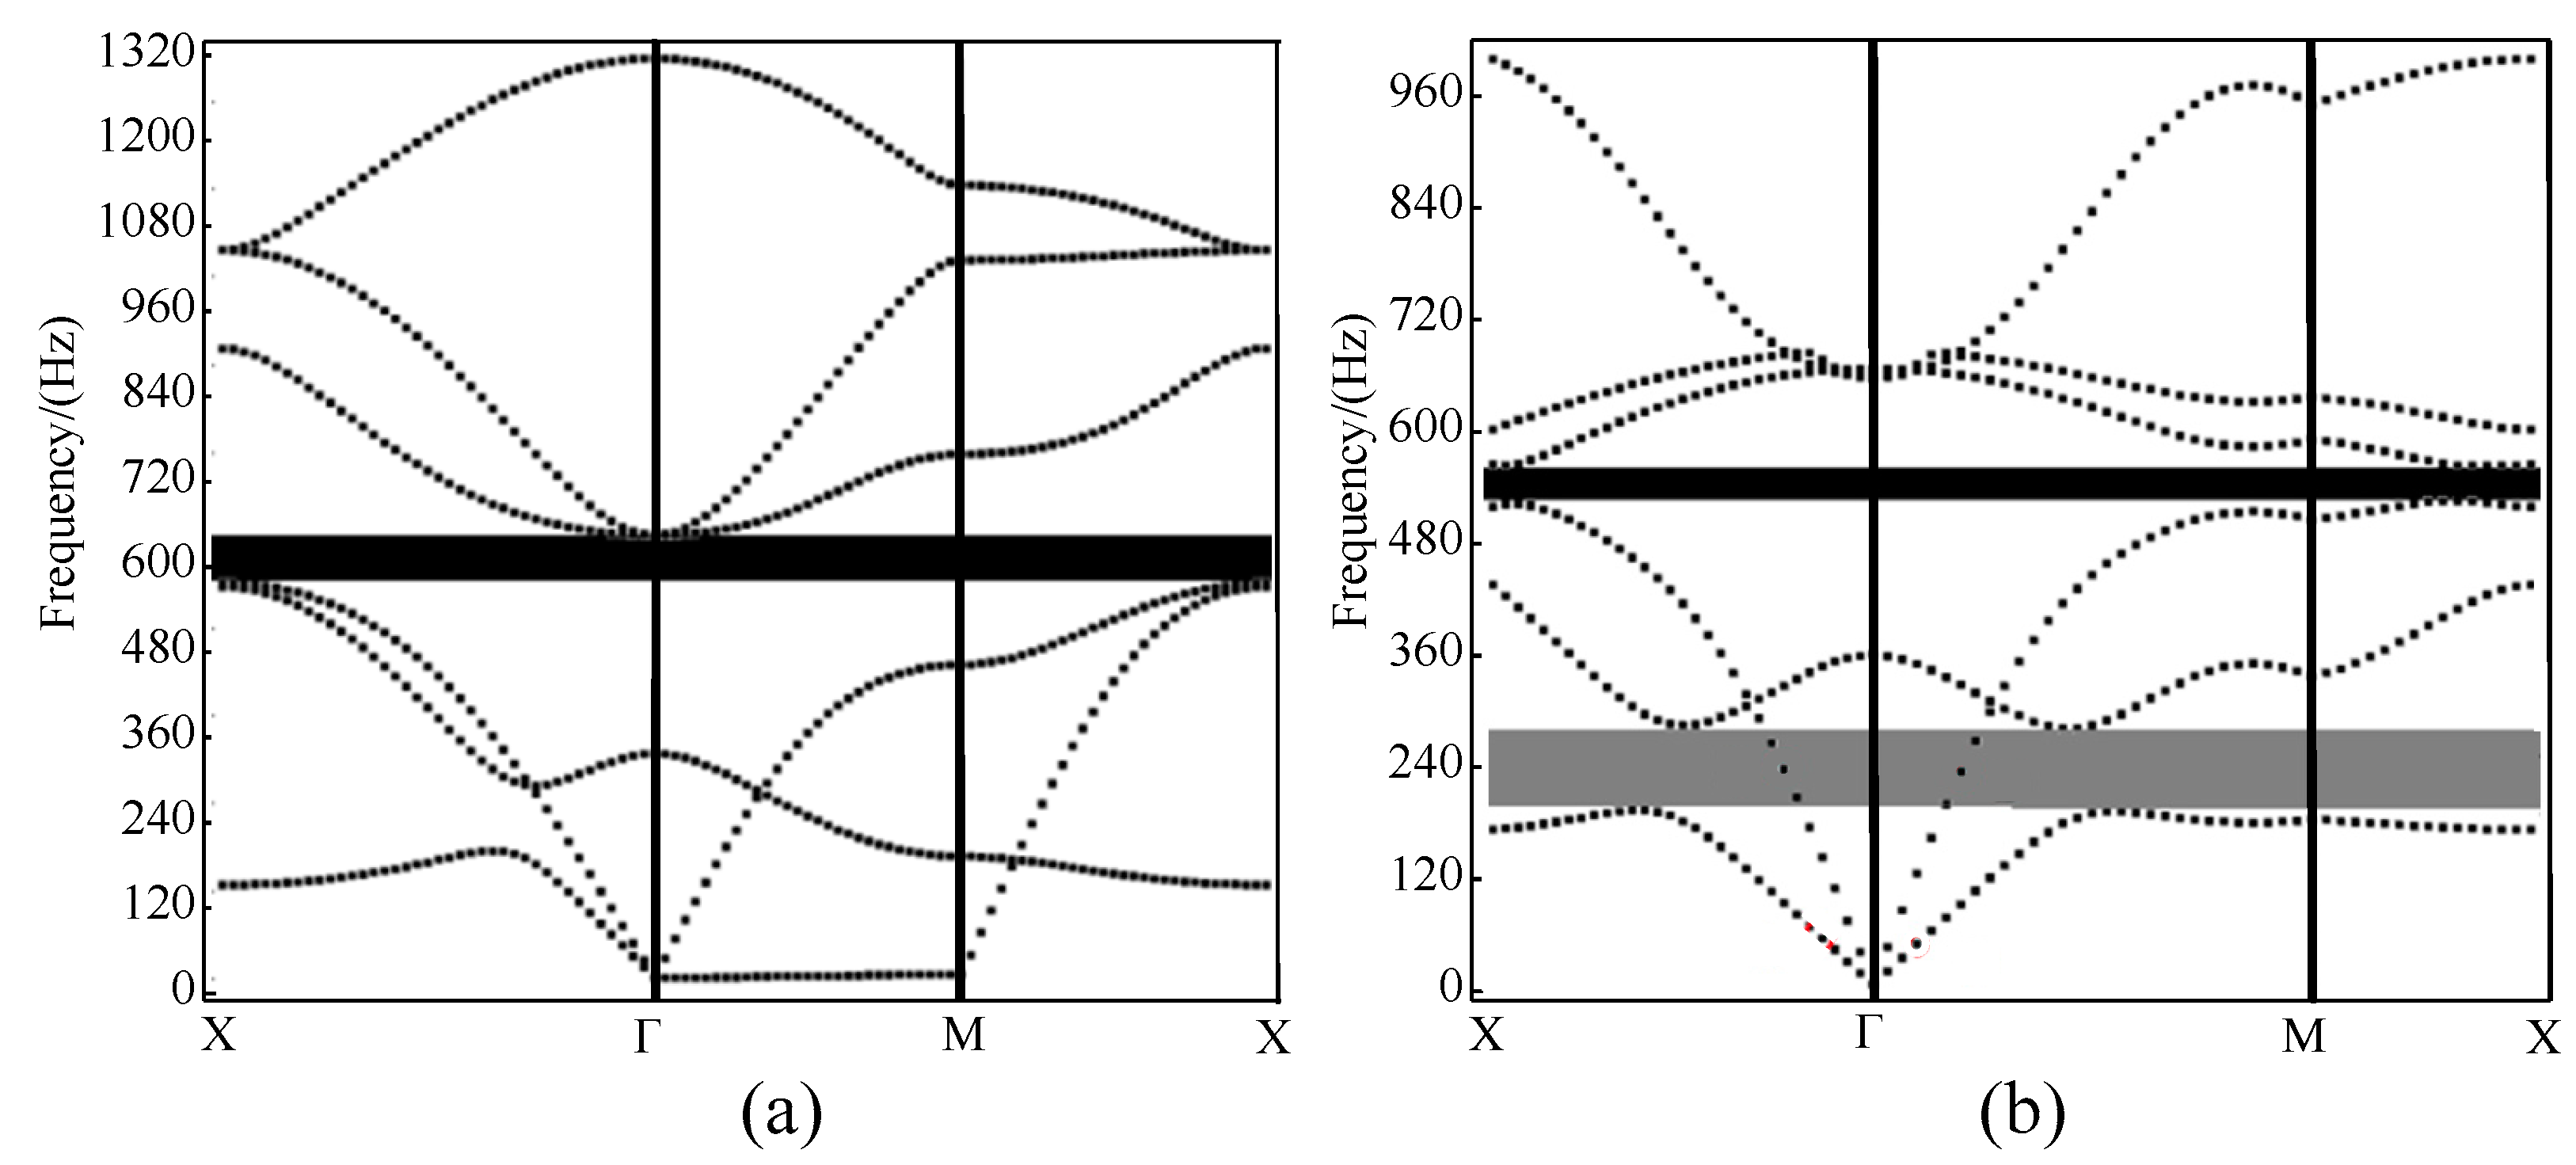
Figure 5a,b display the band structures of PMS and PMT gained by COMSOL Multiphysics, respectively. Note that there is no gray region (SPBG) in the band structure of PMS, which indicates that the decreased double-cone number causes the disappearance of SPBG. In terms of PMS bandgap properties, the upper and low-frequency edges and the absolute bandwidth of PBG are 650.0 Hz, 584.7 Hz, and 65.3 Hz, respectively. Concerning the bandgap properties of PMT, the upper and low-frequency edges and the absolute bandwidth of PBG are 562.8 Hz, 526.1 Hz, and 36.7 Hz, respectively, and those of SPBG are 278.2 Hz, 199.6 Hz, and 78.6 Hz, respectively.

4.4. Comparison of the Bandgap Properties of PMs with Distinct Unit Cell Arrangements

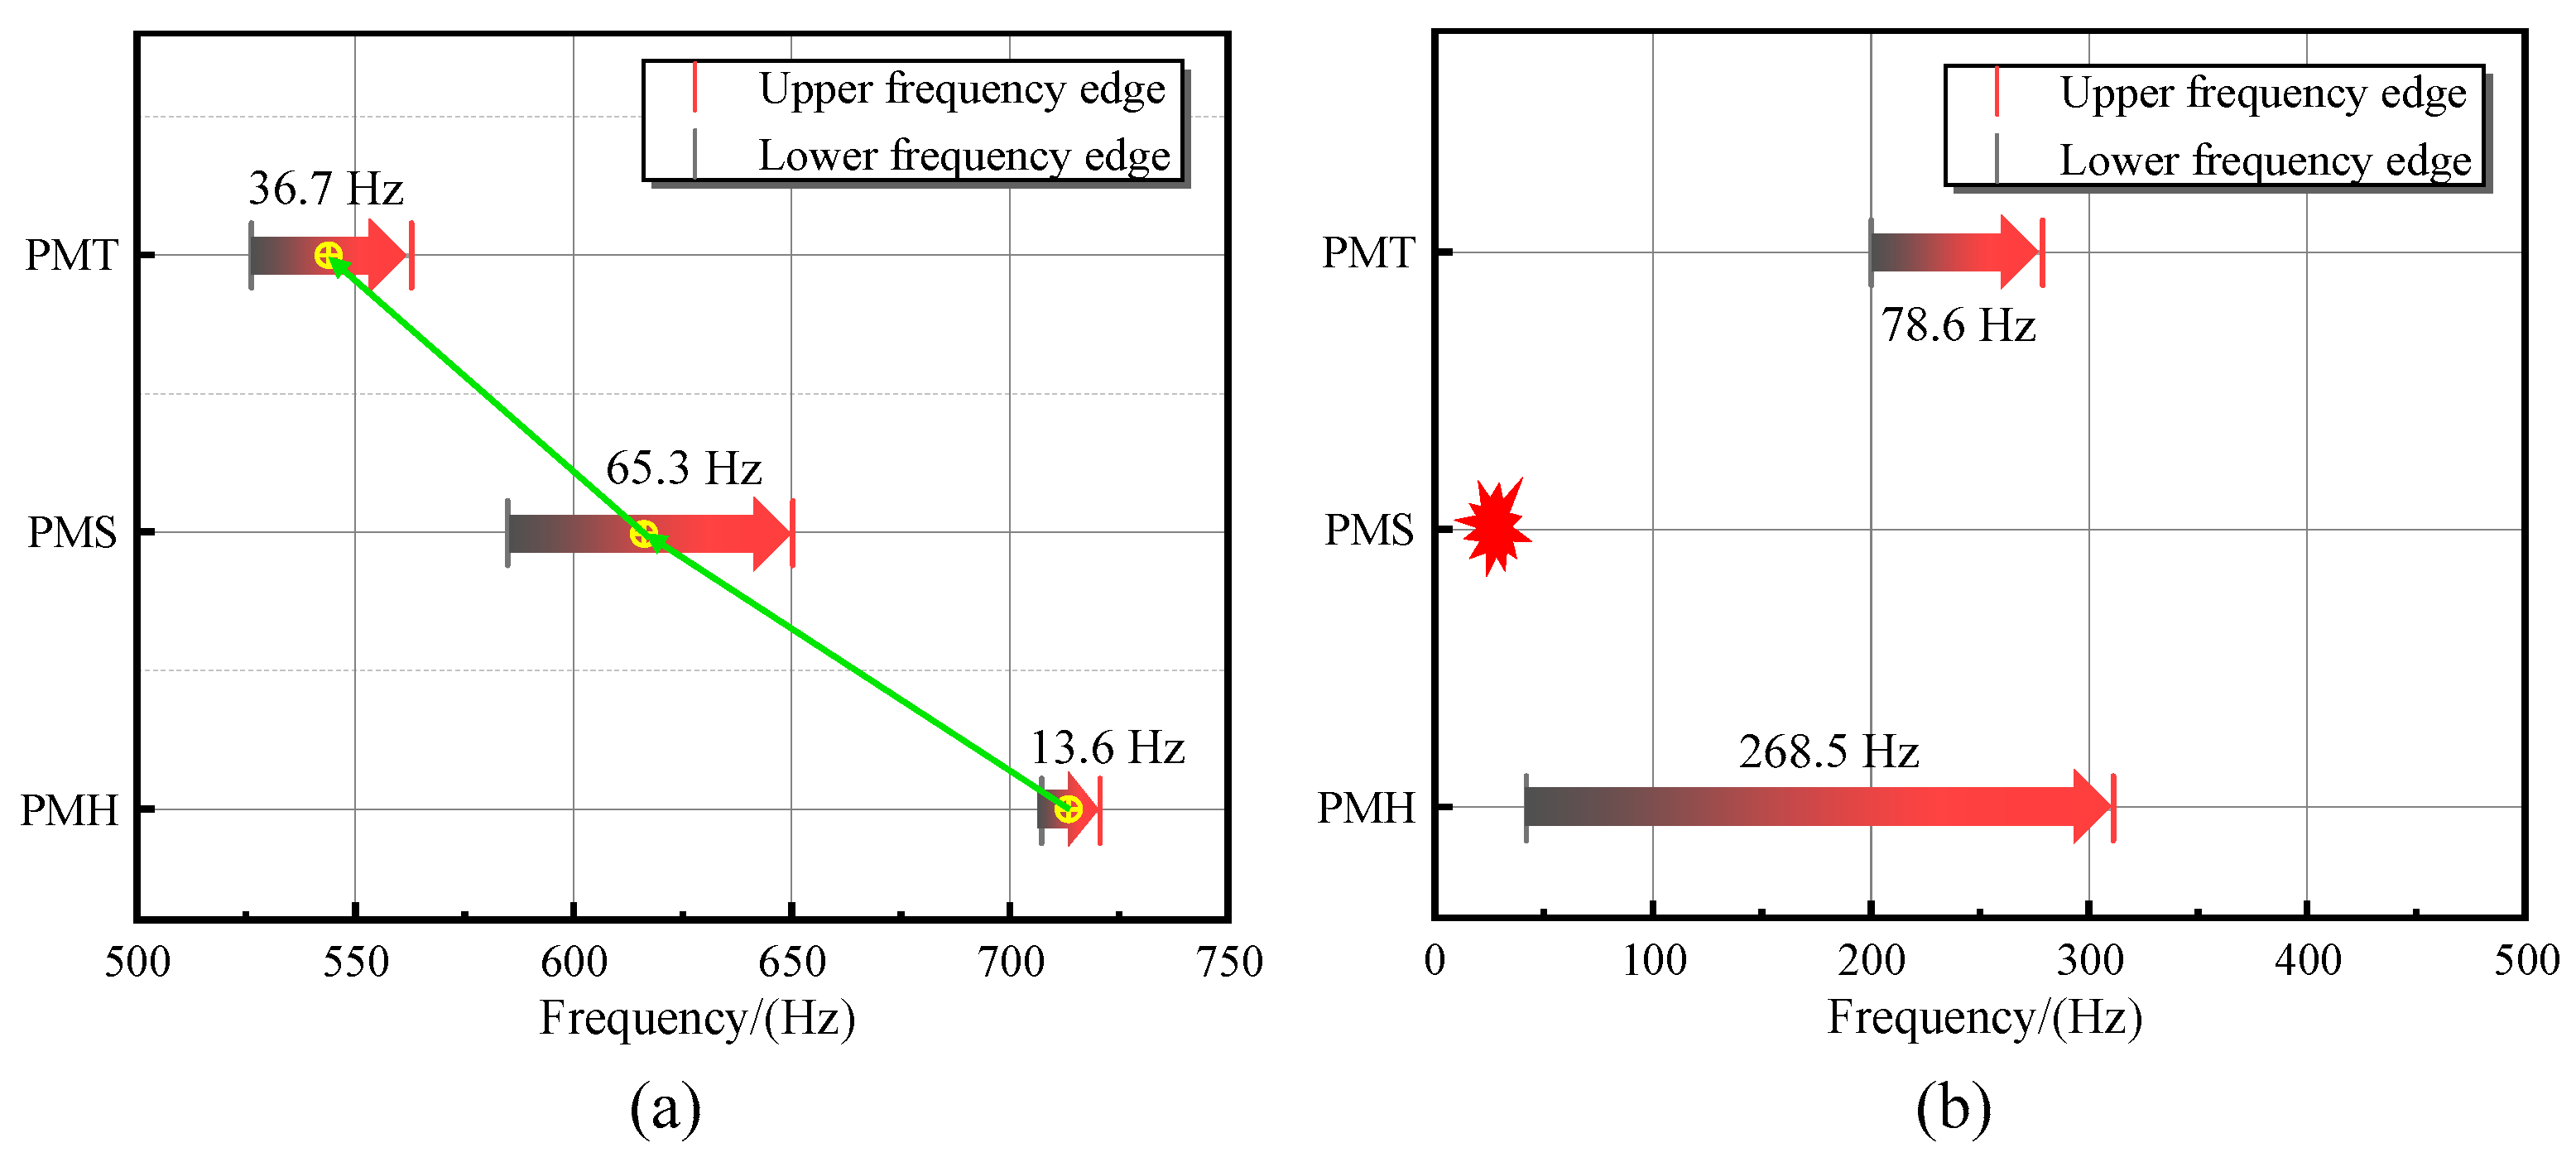
To explore the influences of unit cell arrangement on bandgap properties, this section compares the bandgap properties of PMT, PMS, and PMH. The PBG characteristics of PMH, PMS, and PMT are presented in Figure 6a. It is obvious that the unit cell arrangement of PMs has a significant effect on PBG. In other words, the PBG of PMs moves gradually to the low-frequency region with the double-cone decrease. The PMS bandwidth of PBG is the greatest among the three, which suggests that the PMS possesses better PBG characteristics than PMS and PMT. The bandwidth of PBG is increased from 13.6 Hz to 65.3 Hz if the double-cone number is decreased from six to four. Surprisingly, the situation is reversed if the double-cone number is continuously decreased from four to three. In this case, the bandwidth of PBG declines again, from 65.3 Hz to 36.7 Hz.
The SPBG characteristics of PMH, PMS, and PMT are shown in Figure 6b. It is obvious that the PMS loses SPBG properties, which indicates that the double-cone decrease from six to four has an unfavorable effect on the SPBG of PM. From the view of the SPBG bandwidth, the bandwidths of PMH and PMT are 268.5 Hz and 78.6 Hz, respectively, and the bandwidth of PMH is greater than that of PMT, implying that the PMH has better SPBG characteristics among the three. However, the PBG of PMT bandwidth is larger than that of PMH, and the PBG of PMH locates the high-frequency region compared to PMT. Therefore, the PMT is selected as the research object for the following parts. The reasons leading to the change in bandgap properties are analyzed in the discussion section.

5. The Bandgap Properties of PM with Different Material and Geometry Parameters

As described in Section 2, the stiffness and mass of the double-cone and node regions have a significant influence on bandgap properties. It is inferred that the bandgap properties of PM can be improved by changing the material and geometry parameters of the double-cone and node regions. Therefore, the component material (i.e., density, Poisson’s ratio, and Young’s modulus) and geometry parameters (double-cone width D and node radius r) are considered as factors to explore their effects on bandgap properties.

5.1. The Bandgap Properties of PMH with Various Material Parameters

5.1.1. The Bandgap Properties of PMH with Different Density

To explore the effects of the double-cone region’s density on bandgap properties, the density is changed separately under the condition that other parameters (i.e., material and geometry) remain unchanged. The value of density ranges from 3710 to 5310 and the interval value is 300. The variations of PBG and SPBG are illustrated in Figure 7a; it is clear that PBG and SPBG move to a low-frequency region from a high-frequency region with the increase of density, and the movement trend of PBG is greater than that of SPBG. When the density is increased from 3710 kg/m3 to 5310 kg/m3, the upper and low-frequency edges of PBG steeply decline from 627 Hz and 586 Hz to 524 Hz and 490 Hz, respectively, and those of SPBG drop from 293 Hz and 197 Hz to 245 Hz and 164 Hz, respectively. Meanwhile, the bandwidths of PBG and SPBG descend from 41 Hz and 96 Hz to 34 Hz and 81 Hz, respectively, which indicates that the increase in the double-cone region density has a negative influence on bandwidth.

5.1.2. The Bandgap Properties of PMH with Different Poisson’s Ratio

To discover the influence of Poisson’s ratio of node region on bandgap properties, the Poisson’s ratio of node region is changed separately. The Poisson’s ratio of node region range is set as 0.1–0.5 and the interval value is defined as 0.1. Figure 7b shows the relationships among PBG, SPBG, and the Poisson’s ratio of node region; the upper frequency edge of PBG firstly increases, then decreases, when the Poisson’s ratio is between 0.1 and 0.5. The low-frequency edge of PBG is increased with an increasing Poisson’s ratio of node region; this increasing trend is gradually strengthened. Moreover, Figure 7b reveals that the Poisson’s ratio of node region has a limited influence on the location and bandwidth of SPBG. Specifically, the upper and low-frequency edges of SPBG are firstly decreased and then increased with an increasing Poisson’s ratio of node region. Surprisingly, the PMH has the same upper and low-frequency edges when the Poisson’s ratio of node region is 0.2 and 0.3, respectively.

5.1.3. The Bandgap Properties of PMH with Different Young’s Modulus

The investigation that explores the effects of the Young’s modulus of node region on PBG and SPBG is examined in detail. The Young’s modulus of node region is adjusted individually while keeping other parameters constant. Specifically, the Young’s modulus of node region is changed from 0.4 GPa to 1.4 GPa, and the interval value is 0.1. Figure 7c presents the PBG and SPBG trend with the increased Young’s modulus of node region. It is apparent that the PBG and SPBG move to the high-frequency region. In addition, the increasing tendency of the upper frequency edge of PBG is more than that of the low-frequency edge, which causes the bandwidth of PBG to increase from 29 Hz to 44 Hz. In terms of the SPBG, the effect of the Young’s modulus of node region on the PBG is less than that on the SPBG. The PBG trend is greater than that of the SPBG with an increasing Young’s modulus of node region. Furthermore, clearly shown in this figure is that the growing trend of the upper frequency edge of SPBG is significantly higher than that of the low-frequency edge, indicating that the SPBG bandwidth rises similarly.

5.2. The Bandgap Properties of PMH with Different Geometry Parameters

5.2.1. The Bandgap Properties of PMH with Different Double-Cone Width

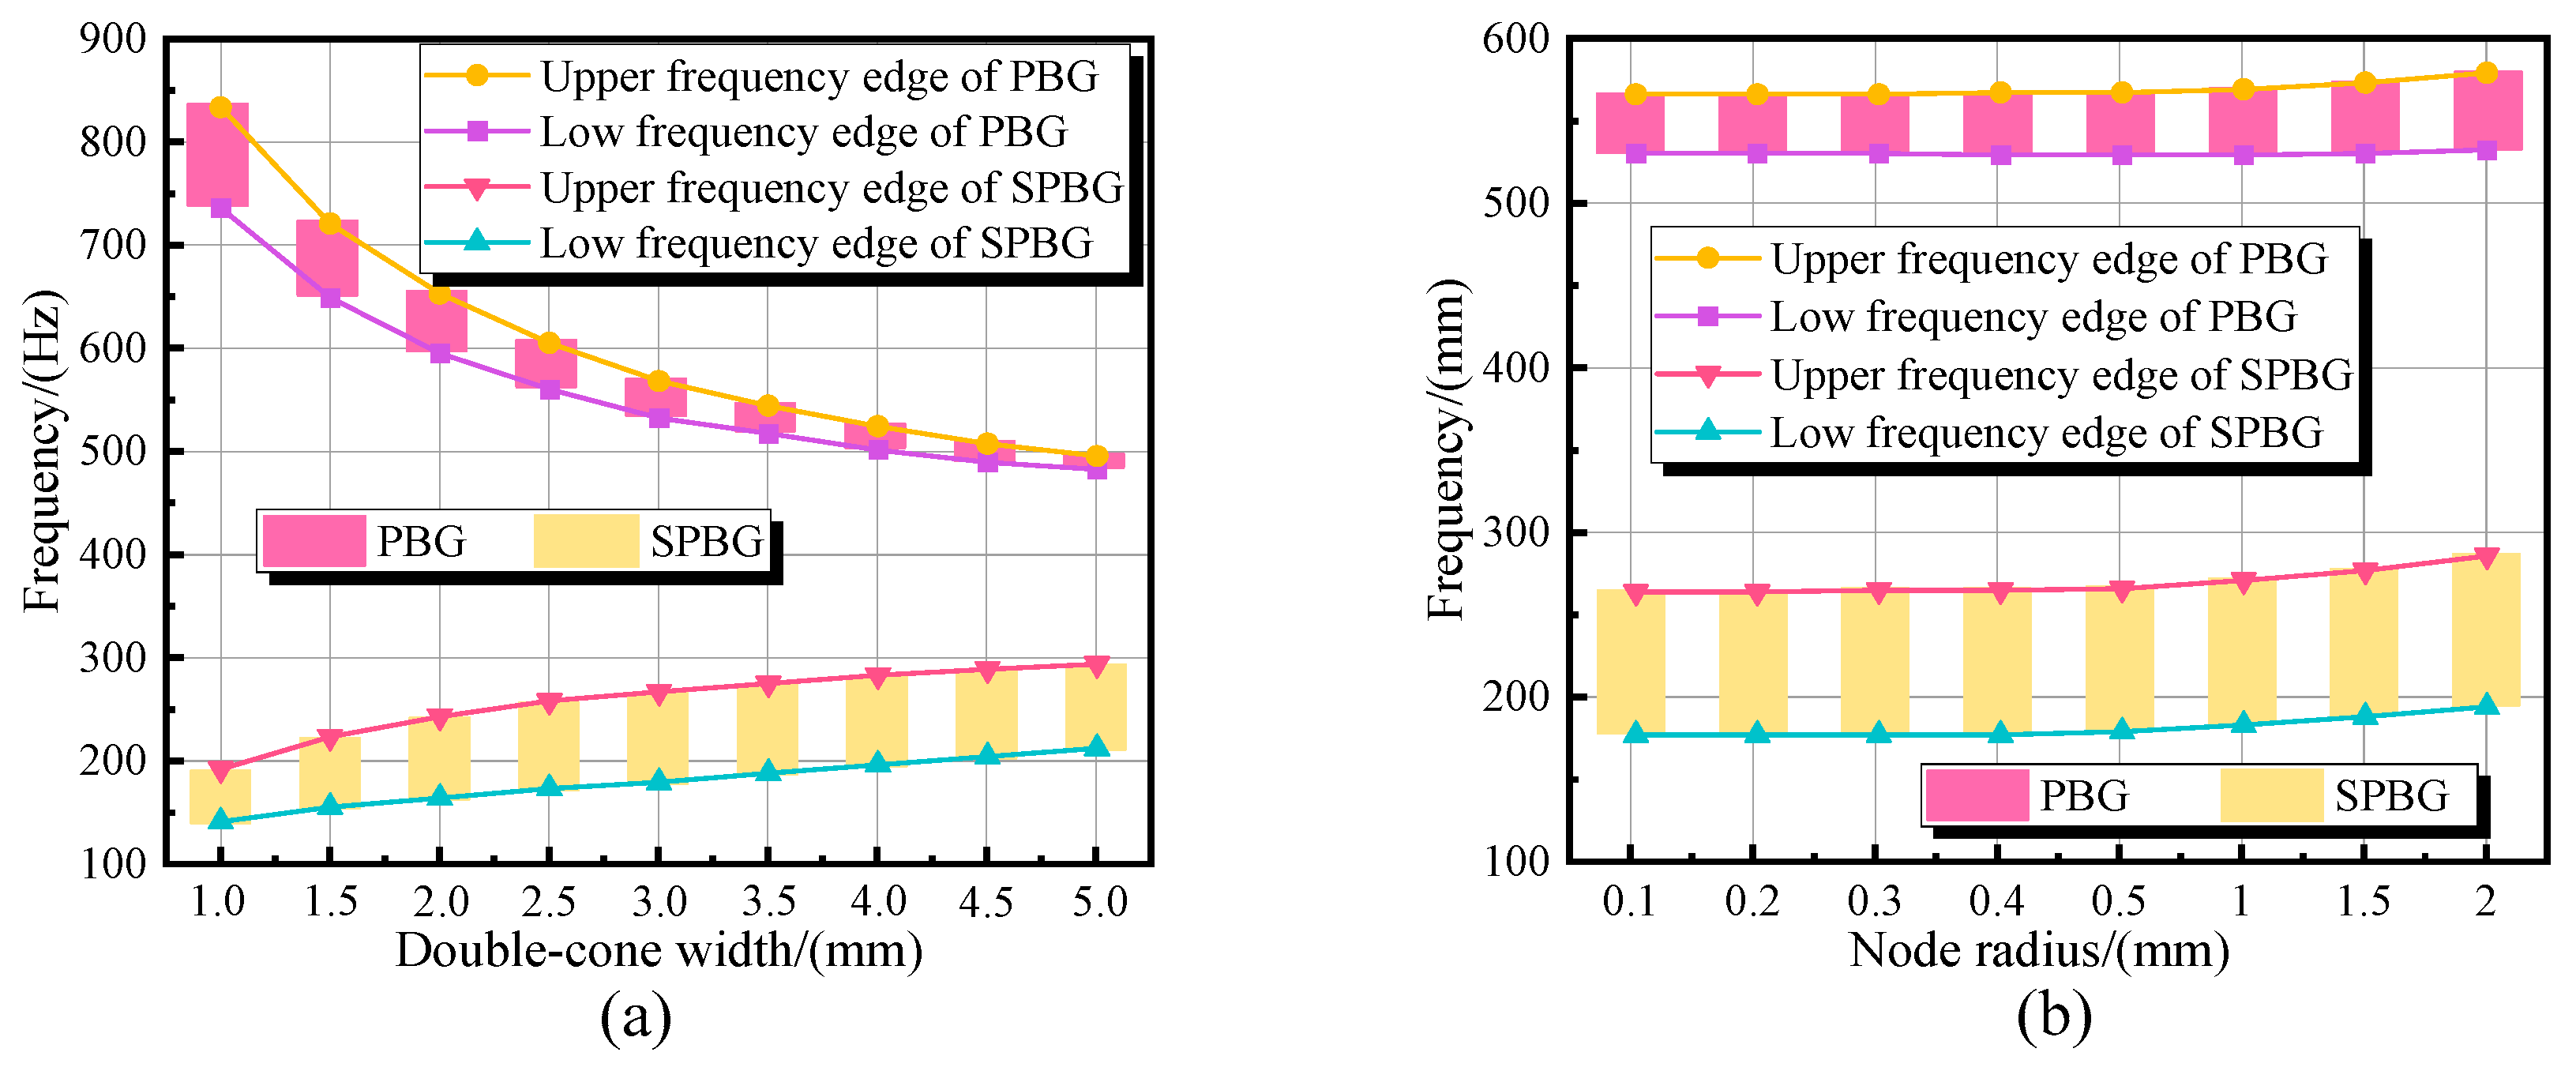
To look into the effects of double-cone width D on bandgap properties, the value of double-cone width ranges from 1.0 to 5.0 when other parameters remain unchanged, and the double-cone width is taken every 0.5 mm. Figure 8a displays the relationship between double-cone width and PBG; what is striking in this graph is the rapid drop in the bandwidth of PBG. The effect of double-cone width on PBG is more significant than that on SPBG. Specifically, the upper and low-frequency edges of PBG decrease when the double-cone width is increased, and the decreasing trend is gradually weakened. Note that the descending trend of the upper frequency edge of PBG is greater than that of the low-frequency edge, inducing the bandwidth of PBG to rapidly decline from 99 Hz to 13 Hz. Furthermore, the PBG of PMT is shifted to the low-frequency region from the high-frequency region with increasing double-cone width. Regarding the effects of double-cone width on SPBG, when double-cone width is increased from 1.0 mm to 5.0 mm, the PBG gradually moves to a high-frequency region and the bandwidth of PBG steadily rises from 51 Hz to 82 Hz.

5.2.2. The Bandgap Properties of PMH with Different Node Radius

The method used in the previous section is similarly adopted to explore the relationship between node radius and bandgap properties. The node radius value ranges from 0.1 to 2.0, while the interval is 0.1 mm between 0.1 mm and 0.5 mm and changes to 0.5 mm in the space of 0.5 mm–2.0 mm. The reason for the different node radius intervals is due to the node radius’ marginal effect on bandgap properties. Thus, the node radius interval is increased between 0.5 mm and 2.0 mm to emphasize the trend of bandgap properties. Figure 8b shows the trend of bandgap properties with the node radius; it is obvious that the node radius has slight effects on PBG and SPBG. In terms of PBG, the increased node radius in an interval of 0.1 mm–0.5 mm has little influence on PBG, while the effect is gradually notable when the node radius reaches 0.5 mm. Interestingly, the increasing tendency of the upper frequency edge of PBG is greater than that of the low-frequency edge, which makes its bandwidth increase from 37 Hz to 47 Hz. The node radius has a similar effect on PBG as on SPBG in terms of the bandgap trend. However, there is a different point at which the upper and low-frequency edges of SPBG have the same increasing trend, which can result in the stabilization of bandwidth.

6. Discussion

6.1. The Effects of Unit Cell Arrangements on Bandgap Properties

The bandgap properties of PMs with distinct unit cell arrangements (i.e., hexagonal, square, and triangular) are presented in Figure 6. Clearly, the PM unit cell arrangement significantly affects SPBG and PBG. When the double-cone number is increased from three to six, the PBG of PMs shifts to the high-frequency region. A possible explanation for this phenomenon is that the upper and low-frequency edges of PBG corresponding to equivalent stiffnesses rise as a result of increasing the double-cone array number. In addition, the bandwidth of PBG first rises and then drops when increasing the double-cone array number. The reason for this is not clear but might be related to the inconsistent increasing trend of upper and low-frequency edges based on Equation (1). Concerning the influences of unit cell arrangement on SPBG, the PM loses SPBG properties if the double-cone array number is four, while the SPBG reappears in the PM when the double-cone array number continuously declines to three. In general, it seems that the decrease of the double-cone array number is advantageous for the improvement of PBG, yet is unfavorable for the enhancement of SPBG. The double-cone array number can be decreased when designers are inclined to excellent PBG. Otherwise, the PM with lower double-cone can be selected if designers prefer the SPBG properties.

6.2. The Effects of Component Material on Bandgap Properties

The relationships among the double-cone region density, Poisson’s ratio and Young’s modulus of node region, and bandgap properties are displayed in Figure 7. In terms of the effects of density in the double-cone region on PBG, the upper and low-frequency edges of PBG decline when the density in the double-cone region increases. Based on the bandgap regulation method described previously, these results are likely to be related to the increased equivalent mass in the double-cone region. Additionally, it is almost the same for the decreasing trend of the upper and low-frequency edges of PBG. According to Equation (1), the reason behind this phenomenon is that the difference between (m1 + m2)/(m1m2) and 1/m1 is little due to the small size of the node radius. As far as the effects of density in the node region on SPBG is concerned, the SPBG gradually moves to the low-frequency region when increasing the density in the node region. Thus, the material with lower density can be selected when designers are inclined toward low-frequency SPBG.
The effects of the Poisson’s ratio in the double-cone region on bandgap properties are shown in Figure 7b. What stands out in the figure is that the upper frequency edge of PBG is almost constant when the Poisson’s ratio in the double-cone region is increased, while the low-frequency edge is significantly increased. It is somewhat surprising that the Poisson’s ratio in the double-cone region has a complex effect on PBG; the reason behind these results should be interpreted with caution. A further study with greater focus on the effect of the Poisson’s ratio on bandgap properties is therefore suggested. In respect of the effects of the Poisson’s ratio in the double-cone region on SPBG, the Poisson’s ratio has a limited effect on SPBG. Therefore, it is useless to adjust the SPBG characteristic of PMH by changing the Poisson’s ratio in the double-cone region.
Figure 7c exhibits the variation of bandgap properties of PMH with different Young’s modulus in double-cone regions. Obviously, with the increase of Young’s modulus in the double-cone region, the upper and low-frequency edges of PBG gradually rise, and the bandwidth of PBG increases simultaneously. The phenomenon, in which the increasing trend of the upper frequency edge of PBG is greater than that of the low frequency edge, can be explained by the value of (m1 + m2)/(m1m2) outweighing that of 1/m1 when the equivalent mass of node and double-cone regions are small. Thus, the upper frequency edge of PBG is improved faster than its lower frequency edge on the basis of the same Young’s modulus enhancement. Thus, it is beneficial to increase the Young’s modulus in the double-cone region to raise the bandwidth of PBG. With respect to the relationship between PBG and Young’s modulus in the double-cone region, with the increase of Young’s modulus, the SPBG moves to the high-frequency region, with its bandwidth meanwhile magnified.

6.3. The Effects of Geometry Parameter on Bandgap Properties

The trend of PMH bandgap properties with different double-cone widths is displayed in Figure 8a. Clearly, with the increase of double-cone width, the PBG shifts to the low-frequency region. A possible reason for this phenomenon is that, with increasing double-cone width, the upper and low-frequency edges of PBG decline due to the increased equivalent mass of the double-cone region based on Equation (1). In addition, the bandwidth of PBG is decreased since the decreasing trend of the PBG upper frequency edge is less than that of the low-frequency edge. The reason behind this result is that the value of (m1 + m2)/(m1m2) is greater than that of 1/m1. From the view of the effects of double-cone width on SPBG, the increasing tendency of upper and low-frequency edges is gradually weakened when double-cone width reaches 3.5 mm. The relationship between bandgap properties and node radius is shown in Figure 8b; it is clear that the node radius has a limited effect on PBG and SPBG. The result is likely to be related to the slight change of equivalent mass and stiffness in the node region based on the regulation method of bandgap properties.

7. Optimization Methodology

7.1. Definition of Optimization Problem

As has been shown previously, the bandgap properties of PMT are determined to be better than those of the PMS and PMH. Thus, the PMT is selected as the research object of multi-objective optimization. Due to the manufacturing material of PM being only selected or synthesized from existing material in nature, the enhancement of PM bandgap properties should rely on the adjustment of geometry parameters. Moreover, to further improve the bandgap properties of PMH, the double-cone width and node radius, which have been confirmed to possess a certain effect on bandgap properties, are set as design variables, and the bandwidths of PBG and SPBG are defined as optimization objectives to perform multi-objective optimization. In addition, it should be noted that the wider PBG and SPBG indicate better bandgap properties in this part. The optimization problem of PMT can be defined as follows:
{ M a x                           { A b w 1 ,     A b w 2 } s . t .                               { 0.8   mm D 4.0   mm 0.1   mm   r   0.9   mm

7.2. The overall Process of Optimization

The optimization process of PMT is shown in Figure 9. Obviously, the design variables and optimization objective are defined at the beginning. Then the nine initial sample points are selected by the Latin hypercube sample method. Soon afterward, the PBG and SPBG of the nine sample points selected are obtained using COMSOL. The Kriging model, which induces the surrogate model representing the relationship among the double-cone width, node radius, and the bandwidths of PBG and SPBG, is constructed according to the nine initial sample points and corresponding response value, then the optimal solution is found using the NSGA-II algorithm. Subsequently, a convergence check is conducted to analyze the accuracy of the Kriging model built. The Pareto solution is determined if the convergence check is satisfied. Alternatively, new sample points are introduced by double-points infilling to dynamically update the Kriging model established until the convergence check is passed. That is to say, the sampling point adopted is dynamically updated in the construction process of the Kriging model. Note that the described optimization process can quickly and effectively obtain the optimization solution of PMT. More importantly, the introduction of the double-points infilling method can decrease the dependence on the initial sample points.

7.3. The Construction of Kriging Model

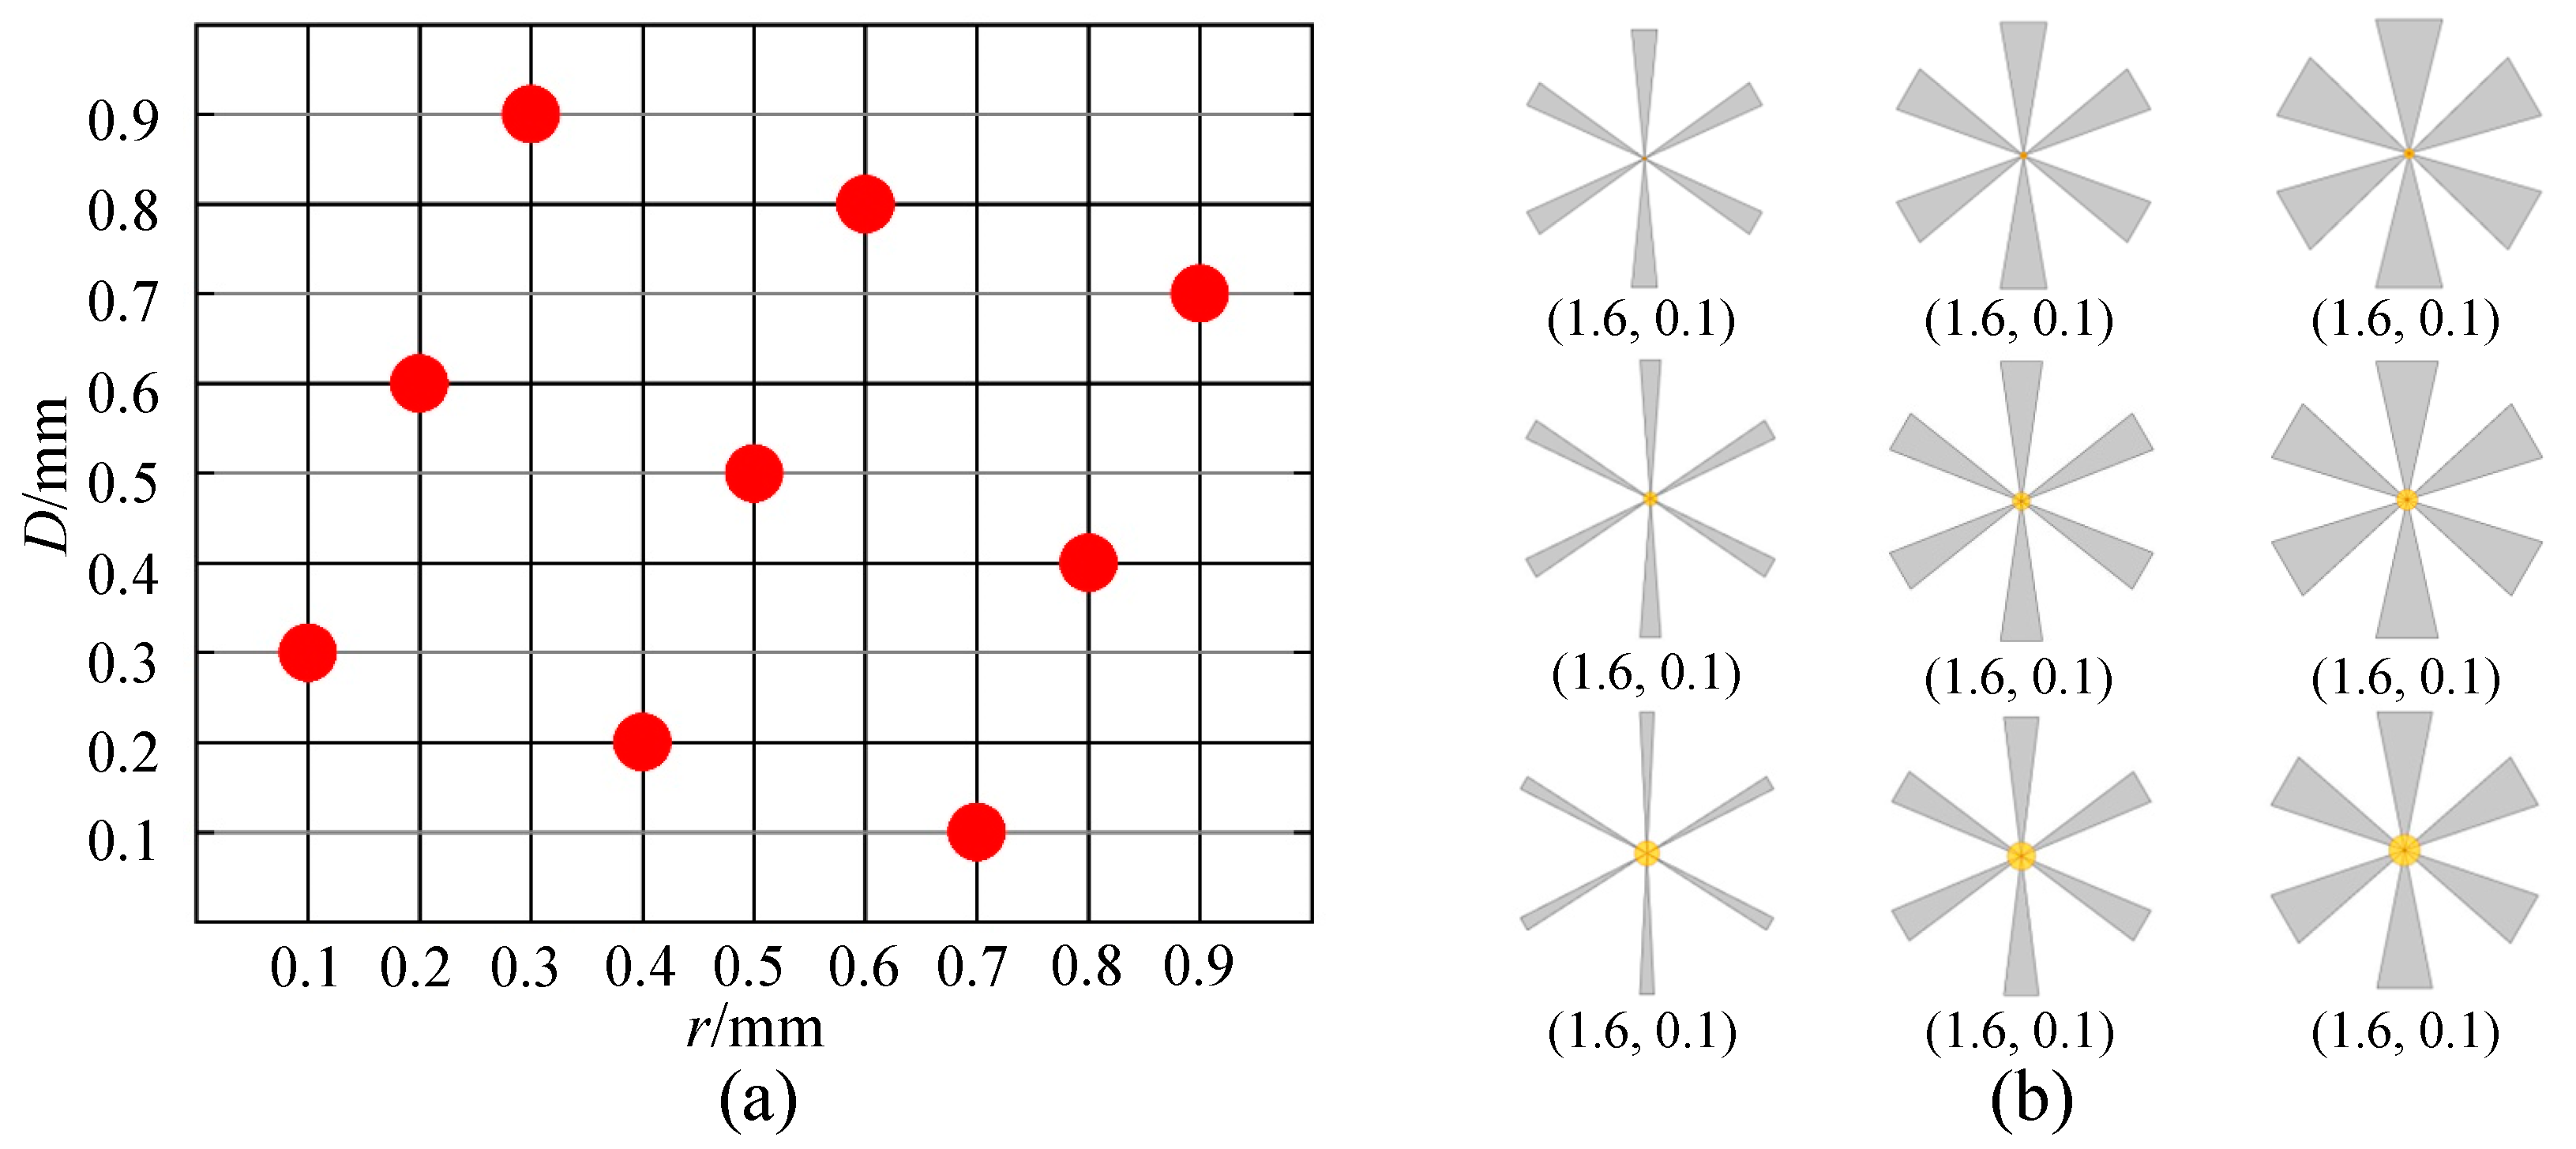
The Kriging model, which has higher predictive accuracy in solving high nonlinearity problems compared to other surrogate models [46], is adopted to deal with the optimization problem of PMT. Furthermore, it is convenient for analyzing the space-filling qualities since the response value and corresponding error are offered at the same time. Additionally, the high dependence of the conventional Kriging model on the initial sample points selected is solved using the double-points infilling method. Figure 10a,b show the nine initial sample points and corresponding unit cell structure, respectively; note that these initial sample points exhibit outstanding space-filling qualities. The Kriging model is then established according to the nine initial sample points’ corresponding response values.
It is necessary to determine the evaluating indicator for a convergence check. Thus, the correlation coefficient R2 and maximum absolute error MAX are employed to examine the predictive accuracy of the Kriging model built; their respective expressions are as follows:
R 2 = i = 1 k ( y ^ i y ¯ ) 2 i = 1 k ( y i y ¯ ) 2
M A X = max | y i y ^ i |
Here, yi and y ^ i are the response and predictive values of i at the sample point, respectively; y ¯ is the mean value of the response value correspondingly to all sample points; and k is the sum number of all sample points. The bigger the R2 and the smaller the MAX, the better predictive accuracy of Kriging obtained. In this investigation, the convergence check of the Kriging model constructed based on the nine original sampling points is not met. Thus, the double-points infilling criteria are adopted to add some new sampling points for improving the Kriging model’s predictive accuracy. When the difference between the new sampling point added and optimal sampling points is small (Equation (6)), the new sampling points are no longer added. The optimal problem is convergence after three iterations and five dynamically adding points in this case. Thus, 14 sampling points, including nine original sampling points and five new sampling points added, are employed.
x i + 1 x i x i ε , i = 1 , 2 , , n
Here, xi+1 is the new sampling point added in i+1 iteration and xi is the optimal sampling point of i iteration; note that the ||xi|| is non-zero. ε is a threshold, and is determined as 5 × 10⁻³. Table 1 shows the R2 and MAX of the Kriging model; it is clear that the R2 is bigger than 0.99, and the MAX is less than 0.1. Therefore, the Kriging model established in this investigation exhibits excellent predictive accuracy, whereafter, it is adopted to gain Pareto-optimal sets according to the NSGA-II algorithm, which provides a wide and meaningful space for the multi-objective optimization of PMT.

7.4. Optimization Results

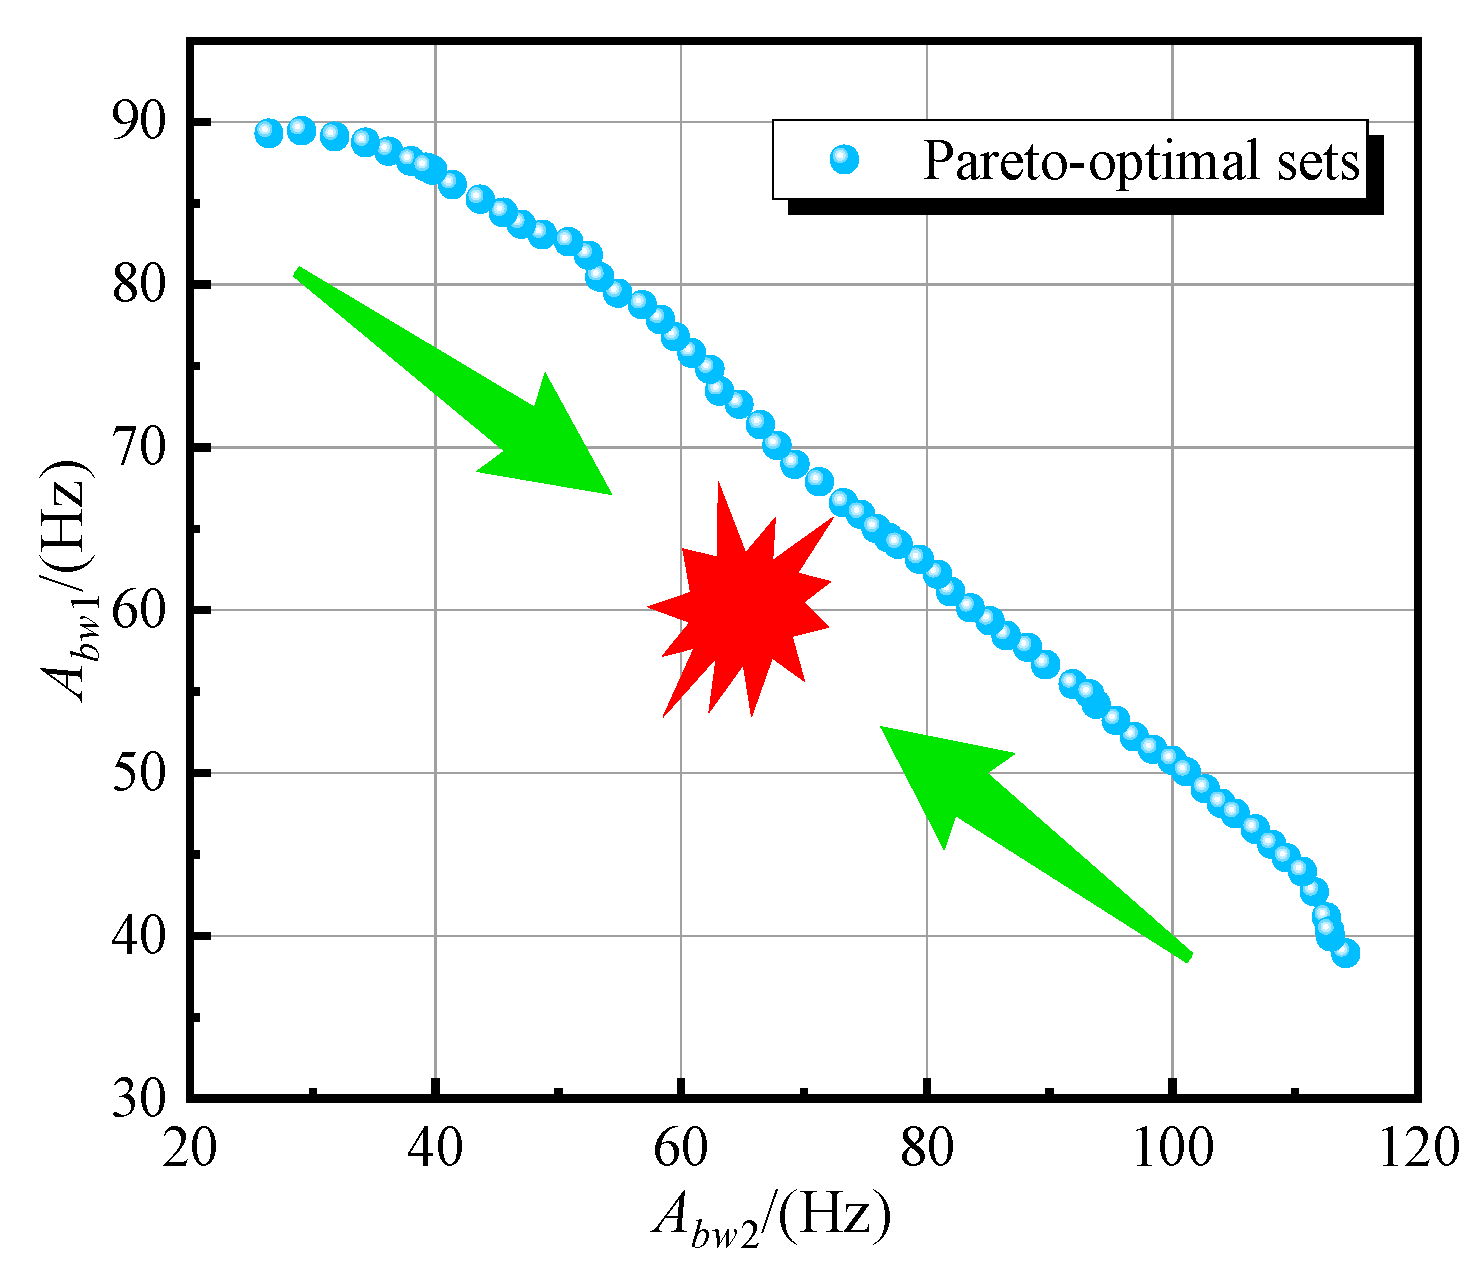
As shown in Figure 11, a conflicting relationship exists between the simultaneously widened PBG and SPBG. Therefore, the bandwidths of PBG and SPBG are not increased at once. If designers prefer the SPBG characteristics, the points locating the upper-left region of Pareto-optimal sets can be chosen. If not, the lower-right area is applied to gain better PBG properties. Furthermore, to reduce the number of objective indexes, the fitness function C (Equation (7)) is adopted in this case. A point with the highest fitness value C is considered the optimal point. Then its corresponding finite element model is constructed and solved in COMSOL. Table 2 demonstrates the comparison of initial, optimized values, and verification values of PMT; it is obvious that the PBG and total bandgap are broadened by approximately 2.2 and 0.27 times, respectively. However, the SPBG is narrowed by about 0.51 times.
C = A bw 1 ( D , r ) + A bw 2 ( D , r )

8. Conclusions

This study set out to systematically explore the effects of distinct factors, such as unit cell arrangement, component material, and geometry parameters, on bandgap properties. The PMs with various unit cell arrangements, including hexagonal, square, and triangular, are firstly constructed, and the PMT is determined to possess better bandgap properties than others. Then, the relationships between the component material, geometry parameters, and bandgap properties of PMT are disclosed, respectively. Finally, multi-objective optimization is performed to further improve the bandgap properties of PMT. Some important conclusions can be drawn as follows:
  • The unit cell arrangement has a significant effect on bandgap properties. Increasing the double-cone array number from three to four to six gradually moves the PBG of PM to the high-frequency region. Meanwhile, its bandwidth rises by about 3.8 and 1.7 times, respectively. Another interesting finding is that the PMS loses SPBG characteristics when its double-cone array number increases from three to four.
  • The density of double-cone region as well as Poisson’s ratio and Young’s modulus of node regions have an important influence on bandgap properties. The relationship between the PBG and SPBG of PMT and the double-cone region density is that the former shifts to the low-frequency region as the latter increases. However, the reverse is the relationship between the PBG and SPBG of PMT and Young’s modulus of node region. The bandwidth of PBG descends with the increase of Poisson’s ratio in node region.
  • The double-cone width has a momentous effect on bandgap properties, while the influence of node radius on bandgap properties is slight. With the increase of double-cone width, the PBG moves to the low-frequency region, and its bandwidth is reduced. At the same time, the SPBG shifts to the high-frequency region.
  • The bandgap properties of optimized PMT are improved compared to the initial PMT; in other words, the bandwidths of PBG and total bandgap are increased by nearly 2.2 and 0.27 times, respectively. However, the SPBG is narrowed by about 0.51 times. The research provides a systematic understanding for developing PM with excellent bandgap properties.

Author Contributions

Conceptualization, Z.Z. and F.X.; methodology, Y.P. and X.N.; software, Y.P. and Z.Z.; validation, Z.Z., C.Z. and X.N.; formal analysis, C.Z. and T.F.; investigation, Z.Z. and Y.P.; resources, F.X.; data curation, Z.Z. and T.F.; writing—original draft preparation, Z.Z.; writing—review and editing, F.X. and Y.P.; visualization, Z.Z. and X.N.; supervision, F.X.; project administration, F.X.; funding acquisition, F.X. All authors have read and agreed to the published version of the manuscript.

Funding

This research was funded by the National Natural Science Foundation of China (51975438, U1564202) and the 111 Project (B17034).

Institutional Review Board Statement

Not applicable.

Informed Consent Statement

Not applicable.

Data Availability Statement

Publicly available testing data available in this publication.

Conflicts of Interest

The authors declare no conflict of interest.

References

  1. Kadic, M.; Bueckmann, T.; Stenger, N.; Thiel, M.; Wegener, M. On the practicability of pentamode mechanical metamaterials. Appl. Phys. Lett. 2012, 100, 191901. [Google Scholar] [CrossRef]
  2. Xiao, S.; Ma, G.; Li, Y.; Yang, Z.; Sheng, P. Active control of membrane-type acoustic metamaterial by electric field. Appl. Phys. Lett. 2015, 106, 091904. [Google Scholar] [CrossRef]
  3. Barchiesi, E.; Spagnuolo, M.; Placidi, L. Mechanical metamaterials: A state of the art. Math. Mech. Solids 2019, 24, 212–234. [Google Scholar] [CrossRef]
  4. Kadic, M.; Bueckmann, T.; Schittny, R.; Wegener, M. On anisotropic versions of three-dimensional pentamode metamaterials. New J. Phys. 2013, 15, 023029. [Google Scholar] [CrossRef]
  5. Cai, C.; Guo, R.; Wang, X.; Sun, F.; Wang, Z.; Xu, Z. Effect of anisotropy on phononic band structure and figure of merit of pentamode metamaterials. J. Appl. Phys. 2020, 127, 124903. [Google Scholar] [CrossRef]
  6. Zhao, A.; Zhao, Z.; Zhang, X.; Cai, X.; Wang, L.; Wu, T.; Chen, H. Design and experimental verification of a water-like pentamode material. Appl. Phys. Lett. 2017, 110, 011907. [Google Scholar] [CrossRef]
  7. Quadrelli, D.E.; Cazzulani, G.; La Riviera, S.; Braghin, F. Acoustic scattering reduction of elliptical targets via pentamode near-cloaking based on transformation acoustics in elliptic coordinates. J. Sound Vib. 2021, 512, 116396. [Google Scholar] [CrossRef]
  8. Wu, L.; Wang, Y.; Chuang, K.; Wu, F.; Wang, Q.; Lin, W.; Jiang, H. A brief review of dynamic mechanical metamaterials for mechanical energy manipulation. Mater. Today 2021, 44, 168–193. [Google Scholar] [CrossRef]
  9. Casablanca, O.; Ventura, G.; Garescì, F.; Azzerboni, B.; Chiaia, B.; Chiappini, M.; Finocchio, G. Seismic isolation of buildings using composite foundations based on metamaterials. J. Appl. Phys. 2018, 123, 174903. [Google Scholar] [CrossRef]
  10. Milton, G.W.; Cherkaev, A.V. Which Elasticity Tensors are Realizable? J. Eng. Mater. Technol. 1995, 117, 483–493. [Google Scholar] [CrossRef]
  11. Fraternali, F.; Amendola, A.; Benzoni, G. Innovative Seismic Isolation Devices Based on Lattice Materials: A Review. Ing. Sismica 2018, 35, 93–113. [Google Scholar]
  12. Mohammadi, K.; Movahhedy, M.R.; Shishkovsky, I.; Hedayati, R. Hybrid anisotropic pentamode mechanical metamaterial produced by additive manufacturing technique. Appl. Phys. Lett. 2020, 117, 061901. [Google Scholar] [CrossRef]
  13. Cushing, C.W.; Kelsten, M.J.; Su, X.; Wilson, P.S.; Haberman, M.R.; Norris, A.N. Design and characterization of a three-dimensional anisotropic additively manufactured pentamode materiala). J. Acoust. Soc. Am. 2022, 151, 168–179. [Google Scholar] [CrossRef] [PubMed]
  14. Reid, A.; Marshall, M.; Kabra, S.; Minniti, T.; Kockelmann, W.; Connolley, T.; James, A.; Marrow, T.J.; Mostafavi, M. Application of neutron imaging to detect and quantify fatigue cracking. Int. J. Mech. Sci. 2019, 159, 182–194. [Google Scholar] [CrossRef]
  15. Norris, A.N. Acoustic cloaking theory. Proc. R. Soc. A-Math. Phys. Eng. Sci. 2008, 464, 2411–2434. [Google Scholar] [CrossRef]
  16. Li, Q.; Wu, K.; Zhang, M. Theoretical study of two-dimensional pentamode metamaterials with arbitrary primitive cells. Optoelectron. Adv. Mater.-Rapid Commun. 2022, 16, 380–387. [Google Scholar]
  17. Layman, C.N.; Naify, C.J.; Martin, T.P.; Calvo, D.C.; Orris, G.J. Highly Anisotropic Elements for Acoustic Pentamode Applications. Phys. Rev. Lett. 2013, 111, 024302. [Google Scholar] [CrossRef]
  18. Aravantinos-Zafiris, N.; Sigalas, M.M.; Economou, E.N. Elastodynamic behavior of the three dimensional layer-by-layer metamaterial structure. J. Appl. Phys. 2014, 116, 133503. [Google Scholar] [CrossRef]
  19. Liu, Y.; Li, Y.-F.; Liu, X.-Z. Manipulation of acoustic wavefront by transmissive metasurface based on pentamode metamaterials. Chin. Phys. B 2019, 28, 024301. [Google Scholar] [CrossRef]
  20. Sun, Z.; Jia, H.; Chen, Y.; Wang, Z.; Yang, J. Design of an underwater acoustic bend by pentamode metafluid. J. Acoust. Soc. Am. 2018, 143, 1029–1034. [Google Scholar] [CrossRef] [PubMed]
  21. Oudich, M.; Gerard, N.J.R.K.; Deng, Y.; Jing, Y. Tailoring Structure-Borne Sound through Bandgap Engineering in Phononic Crystals and Metamaterials: A Comprehensive Review. Adv. Funct. Mater. 2022, 33, 2206309. [Google Scholar] [CrossRef]
  22. Bueckmann, T.; Thiel, M.; Kadic, M.; Schittny, R.; Wegener, M. An elasto-mechanical unfeelability cloak made of pentamode metamaterials. Nat. Commun. 2014, 5, 4130. [Google Scholar] [CrossRef] [Green Version]
  23. Quadrelli, D.E.; Casieri, M.A.; Cazzulani, G.; La Riviera, S.; Braghin, F. Experimental validation of a broadband pentamode elliptical-shaped cloak for underwater acoustics. Extrem. Mech. Lett. 2021, 49, 101526. [Google Scholar] [CrossRef]
  24. Kushwaha, M.S.; Halevi, P.; Dobrzynski, L.; Djafari-Rouhani, B. Acoustic band structure of periodic elastic composites. Phys. Rev. Lett. 1993, 71, 2022–2025. [Google Scholar] [CrossRef]
  25. Yuan, L.; Huang, X.-Y.; Liu, Z.-Y.; Zhang, F.; Zhu, X.-L.; Yu, J.-Y.; Ji, X.; Xu, Y.-P.; Li, G.; Li, C.; et al. A single mutation in the prM protein of Zika virus contributes to fetal microcephaly. Science 2017, 358, 933–936. [Google Scholar] [CrossRef]
  26. Wu, F.G.; Hou, Z.L.; Liu, Z.Y.; Liu, Y.Y. Point defect states in two-dimensional phononic crystals. Phys. Lett. A 2001, 292, 198–202. [Google Scholar] [CrossRef]
  27. Hou, Z.L.; Wu, F.G.; Liu, Y.Y. Acoustic wave propagating in one-dimensional Fibonacci binary composite systems. Phys. B-Condens. Matter 2004, 344, 391–397. [Google Scholar] [CrossRef]
  28. Wang, Z.; Chu, Y.; Cai, C.; Liu, G.; Wang, M.R. Composite pentamode metamaterials with low frequency locally resonant characteristics. J. Appl. Phys. 2017, 122, 025114. [Google Scholar] [CrossRef]
  29. Sheeja, K.L.; Sahu, P.K.; Behera, S.K.; Dakhli, N. Compact Pentamode, Tri-band Metamaterial Antenna for Wireless Applications. In Proceedings of the IEEE International Symposium on Antennas and Propagation, Chicago, IL, USA, 8–14 July 2012. [Google Scholar]
  30. Smith, J.D. Application of the method of asymptotic homogenization to an acoustic metafluid. Proc. R. Soc. A-Math. Phys. Eng. Sci. 2011, 467, 3318–3331. [Google Scholar] [CrossRef]
  31. Liu, Z.Y.; Zhang, X.X.; Mao, Y.W.; Zhu, Y.Y.; Yang, Z.Y.; Chan, C.T.; Sheng, P. Locally resonant sonic materials. Science 2000, 289, 1734–1736. [Google Scholar] [CrossRef]
  32. Huang, Y.; Zhang, X. Pentamode metamaterials with ultra-low-frequency single-mode band gap based on constituent materials. J. Phys. -Condens. Matter 2021, 33, 185703. [Google Scholar] [CrossRef] [PubMed]
  33. Cai, C.; Han, C.; Wu, J.; Wang, Z.; Zhang, Q. Tuning method of phononic band gaps of locally resonant pentamode metamaterials. J. Phys. D-Appl. Phys. 2019, 52, 045601. [Google Scholar] [CrossRef]
  34. Cai, C.; Wang, X.; Wang, Q.; Li, M.; He, G.; Wang, Z.; Qin, Y. Design and optimization of three-dimensional composite multilayer cylindrical pentamode metamaterials for controlling low frequency acoustic waves. Sci. Rep. 2022, 12, 5594. [Google Scholar] [CrossRef] [PubMed]
  35. Cai, C.-X.; Chen, S.-G.; Wang, X.-M.; Liang, J.-Y.; Wang, Z.-H. Phononic band structure and figure of merit of three-dimensional anisotropic asymmetric double-cone pentamode metamaterials. Acta Phys. Sin. 2020, 69, 364. [Google Scholar] [CrossRef]
  36. Huang, Y.; Zhang, X.; Zhang, L.; Cai, C. Theoretical verification of three-dimensional manufacturable pentamode metamaterial microstructure. J. Phys.-Condens. Matter 2021, 33, 485702. [Google Scholar] [CrossRef] [PubMed]
  37. Krushynska, A.O.; Galich, P.; Bosia, F.; Pugno, N.M.; Rudykh, S. Hybrid metamaterials combining pentamode lattices and phononic plates. Appl. Phys. Lett. 2018, 113, 201901. [Google Scholar] [CrossRef]
  38. Kumar, B.; Banerjee, A.; Manna, B. Effect of finite mass on phononic band structure of face centered pentamodal lattice. Mech. Res. Commun. 2022, 124, 103933. [Google Scholar] [CrossRef]
  39. Scandrett, C.L.; Boisvert, J.E.; Howarth, T.R. Broadband optimization of a pentamode-layered spherical acoustic waveguide. Wave Motion 2011, 48, 505–514. [Google Scholar] [CrossRef]
  40. Li, Q.; Zhang, M.Q. Composite hexagonal pentamode acoustic metamaterials with tailored properties. J. Phys.-Condens. Matter 2020, 32, 475701. [Google Scholar] [CrossRef] [PubMed]
  41. Wang, G.; Jin, L.; Zhang, L.; Xu, Z. Phonon band structures of the three dimensional latticed pentamode metamaterials. Aip Adv. 2017, 7, 025309. [Google Scholar] [CrossRef]
  42. Cai, X.; Wang, L.; Zhao, Z.G.; Zhao, A.G.; Zhang, X.D.; Wu, T.; Chen, H. The mechanical and acoustic properties of two-dimensional pentamode metamaterials with different structural parameters. Appl. Phys. Lett. 2016, 109, 131904. [Google Scholar] [CrossRef]
  43. Cai, C.X.; Wang, Z.H.; Li, Q.W.; Xu, Z.; Tian, X.G. Pentamode metamaterials with asymmetric double-cone elements. J. Phys. D-Appl. Phys. 2015, 48, 175103. [Google Scholar] [CrossRef]
  44. Liu, L.; Hussein, M.I. Wave Motion in Periodic Flexural Beams and Characterization of the Transition Between Bragg Scattering and Local Resonance. J. Appl. Mech.-Trans. Asme 2012, 79, 011003. [Google Scholar] [CrossRef]
  45. Lu, Z.-Q.; Zhao, L.; Ding, H.; Chen, L.-Q. A dual-functional metamaterial for integrated vibration isolation and energy harvesting. J. Sound Vib. 2021, 509, 116251. [Google Scholar] [CrossRef]
  46. Quan, N.; Yin, J.; Ng, S.H.; Lee, L.H. Simulation optimization via kriging: A sequential search using expected improvement with computing budget constraints. Iie Trans. 2013, 45, 763–780. [Google Scholar] [CrossRef]
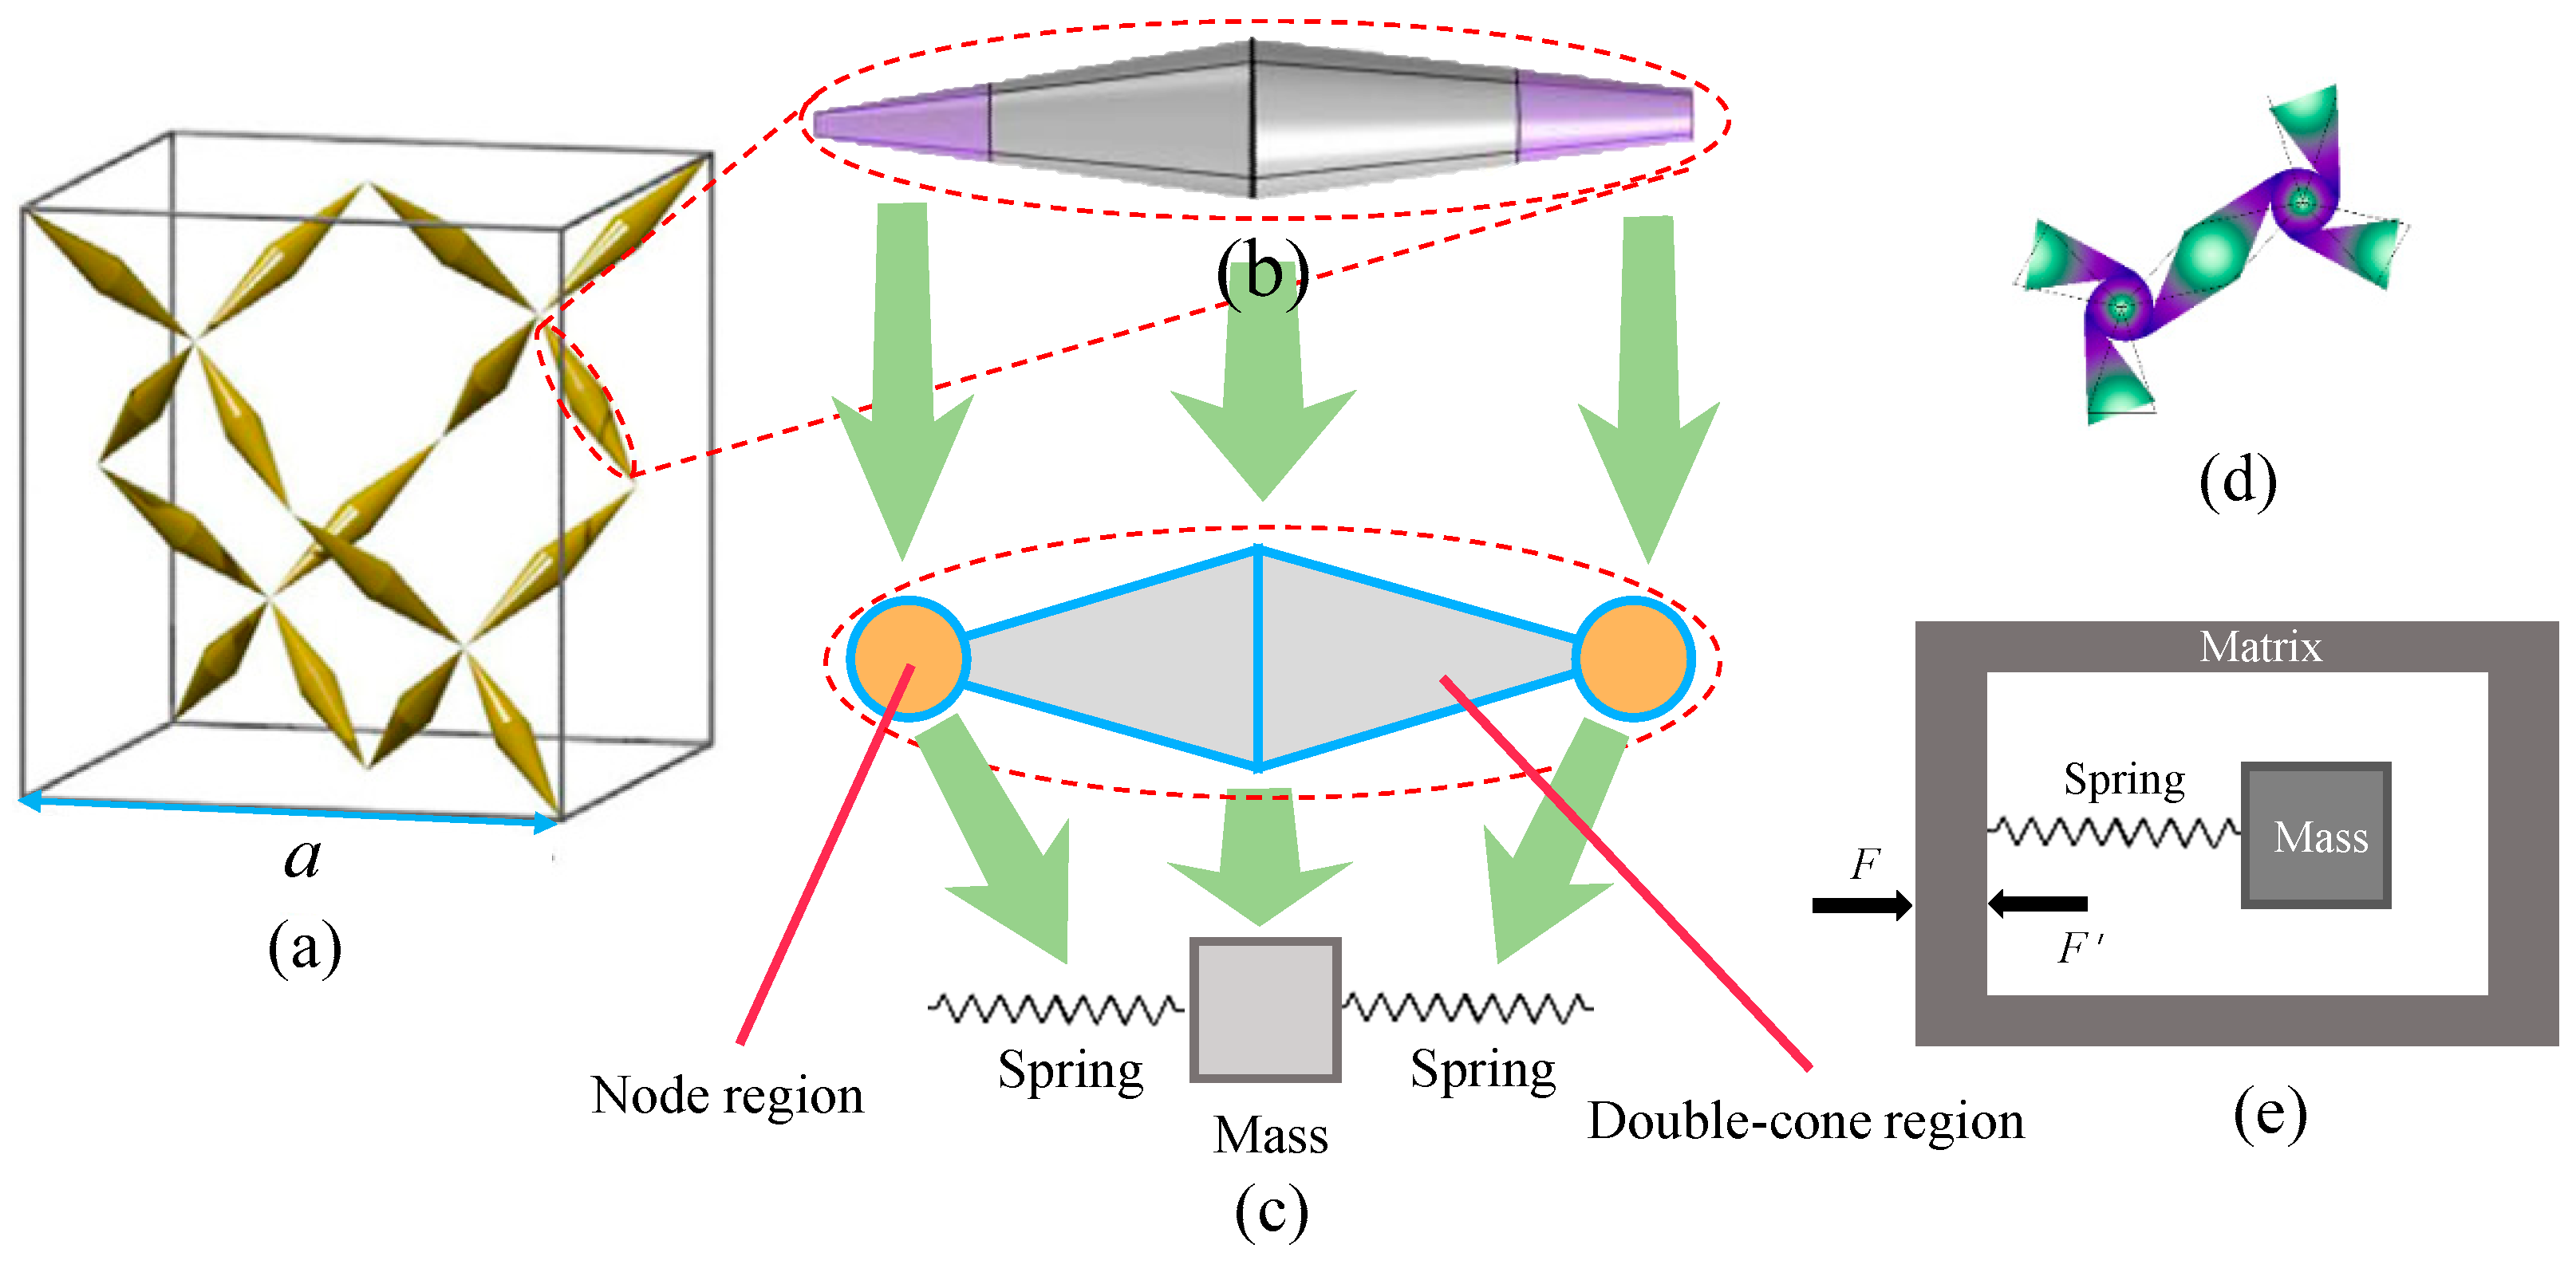
Figure 1. The microstructure and unit cell of PM, (a) The microstructure of PM, (b) The unit cell of PM, (c) The equivalent spring-mass model, (d) The mode of PM, (e) The simplified model of PM.
Sustainability 15 03421 g001
Figure 2. PM with various unit cell arrangements, (a) The unit cell of PMH, (b) The unit cell of PMS, (c) The unit cell of PMT, (d) PMH, (e) PMS, (f) PMT.
Sustainability 15 03421 g002
Figure 3. Band structures and modes of PMHs, (a) Band structure, (b) The mode of E, (c) The mode of F, (d) The simulation model of PBG, (e) The diagram of TL.
Sustainability 15 03421 g003
Figure 4. The modes of labeled points A, B, C, and D as well as the SPBG properties of PMH, (a) The mode of A, (b) The mode of B, (c) The mode of C, (d) The mode of D, (e) The simulation model of SPBG, (f) The partial picture of the simulation model, (g) SPD in waters, (h) SPD in the waters with PMH.
Sustainability 15 03421 g004
Figure 5. The band structures of PMS and PMT; (a) The band structure of PMS; (b) The band structure of PMT.
Sustainability 15 03421 g005
Figure 6. The bandgap properties of PMS and PMT; (a) PBG; (b) SPBG.
Sustainability 15 03421 g006
Figure 7. The effects of density, Poisson’s ratio, and Young’s modulus on bandgap properties; (a) The effects of double-cone region density on bandgap properties; (b) The effects of Poisson’s ratio of node region on bandgap properties; (c) The effects of Young’s modulus of node region on bandgap properties.
Sustainability 15 03421 g007
Figure 8. The effects of double-cone width and node radius on bandgap properties; (a) The effects of double-cone width on bandgap properties, (b) The effects of node radius on bandgap properties.
Sustainability 15 03421 g008
Figure 9. The overall process of the optimization problem for PMT.
Sustainability 15 03421 g009
Figure 10. Sample points and corresponding finite element model. (a) Sample points, (b) Finite element model.
Sustainability 15 03421 g010
Figure 11. Pareto-optimal sets of bandgap properties for PMT.
Sustainability 15 03421 g011
Table 1. The correlation coefficient R2 and maximum absolute error MAX of the Kriging model.
Responseθ1(D)θ2(r)R2MAX
Abw11.23740.00400.994220.03993
Abw21.00040.00650.992340.04548
Table 2. Comparison of optimized results.
VariablesInitial ValuesOptimized ValuesVerification Values
D(mm)30.80.8
r(mm)0.30.10.1
Abw1 (Hz)34.55111.41111.26
Abw2 (Hz)87.3243.2043.19
Atotal (Hz)121.87154.61154.45
Disclaimer/Publisher’s Note: The statements, opinions and data contained in all publications are solely those of the individual author(s) and contributor(s) and not of MDPI and/or the editor(s). MDPI and/or the editor(s) disclaim responsibility for any injury to people or property resulting from any ideas, methods, instructions or products referred to in the content.