Article

Impact of Foreign Direct Investment on Green Innovation: Evidence from China’s Provincial Panel Data

1
School of Business, Hangzhou City University, Hangzhou 310015, China
2
School of Public Affairs, Zhejiang University, Hangzhou 310058, China
*
Author to whom correspondence should be addressed.
Sustainability 2023, 15(4), 3318; https://doi.org/10.3390/su15043318
Submission received: 5 January 2023 / Revised: 1 February 2023 / Accepted: 6 February 2023 / Published: 10 February 2023

Abstract

:
The last couple of decades have witnessed growing interest in the academic literature in the conciliation of finance and sustainable development. Foreign direct investment (FDI) faces increasing pressure from both host and home country towards adoptinsg sustainable approaches. Such solutions can be green innovation (GI) for climate change, environmental risks, green processes and products that allow tracking the carbon footprint, as well as many other green technologies. Based on the macro-level data of 31 provinces in China from 2003 to 2020, this paper employed policy environment (PE) and marketization level (ML) as moderating variables to further investigate the impact of FDI on GI. Our results show the following: (1) FDI has a significant positive and dynamic evolution feature of diminishing marginal efficiency on GI. (2) The heterogeneity analysis of regional regression shows that FDI significantly increases GI in the eastern and western regions. In contrast, FDI in the central region inhibits GI but not significantly. (3) Both PE and ML can positively moderate the impact of FDI on GI. Furthermore, our empirical results of the robustness test of 2SLS and GMM are highly consistent with the main test. The conclusions of this paper provide policy implications for local governments to fully and effectively utilize foreign capital for green innovation activities.

1. Introduction

With the accelerated pace of China’s integration into economic globalization as well as the deepening participation in trade and investment integration, China has attracted a large amount of foreign direct investment (FDI) in last couple of decades. High-level opening up is an effective path to promote economical development, while FDI has always been the main approach and measurement of that (Liu et al., 2014; Jiang et al., 2021) [1,2]. China Commerce Ministry Statistics (CCMS) reports that China’s utilization of FDI amounted to USD 144.369 billion with more than 1,041,630 FDI projects signed in 2020; both are ranked second in the world. However, rapid urban growth also triggered a series of environmental issues, such as carbon emission and air pollution (Wang et al., 2019; Liu et al., 2023) [3,4]. In addition, the huge inflow of foreign capital accompanied by environmental pollution and resource depletion seriously restricts the high-quality development of the local economy (Singhania and Saini 2021; Zhang and Zhou, 2016) [5,6]. Just as the “pollution paradise” hypothesis (Walter and Ugelow, 1979) [7] indicated, developed countries implement stricter environmental regulations than developing countries, resulting in the transfer of polluting industries among them. That would further exacerbate the environmental pollution in developing countries (Sarkodie and Strezov, 2019) [8]. On the other hand, Growth Theory (Feldman, 1999) [9] suggests that FDI is a critical factor in promoting technological progress as well as an important motivation of innovation for local enterprises. In view of this dual effect of FDI on green development and technological progress, green innovation (GI) may alleviate environmental pollution by creating the spatial transfer of highly pollution-intensive industries (Zheng et al., 2022) [10], so green innovation is becoming an essential support for global technological competition which may lead to a new round of industrial revolution. However, can FDI promote China’s green innovation? And how does FDI assist China to carry out more green innovation activities? Scholars have not yet reached a consensus on the above two issues. Thus, exploring the relationship between FDI and GI has practical significance for the government to provide a reasonable decision-making basis for the effective introduction of FDI inflow.
The remaining study structure is as follows: Section 2 analyzes the existing literature, while Section 3 develops our hypotheses. Section 4 focuses on the data sources and main methodological techniques to explain key variables. Section 5 reveals the empirical findings, validating them with several robustness tests. Finally, Section 6 provides the conclusions and policy implications of the overall study.

2. Literature Review

Research on green innovation originated in the 1990s, mainly referring to green and environmentally friendly technology. Braun et al. (1997) [11] took the lead in proposing the concept of green innovation, defining it as a technology that reduces energy resource consumption, reduces environmental pollution, and improves production efficiency, while the general term is used for process and product. So far, the academic community has not reached a unified understanding of the definition of green innovation. James (1997) [12] defined green innovation as new technologies, processes, and products that can significantly reduce the environmental impact and enable individuals and enterprises to realize value-added. Horbach et al. (2012) [13] proposed that green innovation refers to the innovative behavior of products, production processes, marketing methods, and organizational structures that can significantly alleviate environmental problems. More recently, Yi et al. (2019) [14] believed that green innovation is essentially a knowledge-creation process that integrates multiple disciplines and reconstructs a series of knowledge elements. In general, green innovation is critical for China to promote green industrial transformation and high-quality development in the new era.
Many scholars have revealed the influencing factors or motivations of green innovation, mainly at the macro-social and micro-enterprise levels. At the macro-social level, some scholars have conducted research on foreign investment, environmental policy, government subsidy, and industrial agglomeration. Eskeland (2003) [15] found that transnational investment is conducive to improving enterprises’ green innovation ability. Gong et al. (2017) [16] indicated that outward foreign direct investment (OFDI) could promote the efficiency of green industrial innovation via three mechanisms: agglomeration scale economical effect, agglomeration structure lightening effect, and agglomeration resource allocation effect. Li and Zhang (2016), Song and Han (2022), and Liu et al. (2021) [17,18,19] found that there are regional differences and a spillover effect in international R&D investment in China’s green technology innovation, which has a significant role in promoting green technology innovation in the eastern and central regions. The studies of Cary and Shadbegian (2003), Kneller and Manderson (2012), and Luo et al., (2021) [20,21,22] suggested that environmental regulation would increase the pressure on enterprises to reduce pollution and emissions, resulting in an increase in production and operating costs, thereby reducing profits and affecting green innovation activities. Even if environmental regulation may increase the pollution cost of enterprises, these regulations can still achieve innovative compensation and stimulate green innovation activities if properly designed [23]. Szücs (2018) [24] found that government subsidies can provide direct financial support for corporate green innovation activities, thus reducing corporate R&D investment costs and stimulating the enthusiasm of green innovation. Research by Bontoux et al. (2016) demonstrated that the government’s policy framework to support environmental sustainability plays a powerful role in supporting resource efficiency and green ecological innovation [25]. From the perspective of regional industrial agglomeration, Castaldi et al. (2015) [26] pointed out that the green innovation activities of enterprises often occur under better R&D investment and knowledge spillover circumstances. However, Bischi et al. (2003) [27] illustrated that excessive competition offsets the innovation advantages of industrial agglomeration, and it is difficult to bring continuous improvement to green innovation. At the micro-enterprise level, some scholars also researched the enterprise’s external factors and competitive advantages. Pang et al. (2019) [28] found that the external relationship network of enterprises can significantly impact green innovation. Chen et al. (2006) [29] found that the performance of green innovation and process are positively correlated with the competitive advantage of enterprises.
With the in-depth promotion of “bringing in” and “going out” strategies, China has become a developing country attracting the most foreign direct investment in the world for many years, and that has made a significant impact on China’s green innovation (Dai et al., 2021) [30]. The Chinese government has repeatedly mentioned the promotion of domestic green innovation through “bringing in,” because FDI can bring more funds, advanced technology, and management experience (Feng et al., 2019; Zhang et al., 2020) [31,32]. At present, scholars mainly have three different views on the spillover effect of FDI. Firstly, FDI has a positive spillover effect on the host country (Chen and Zhou, 2022) [33]. Kokko (1994) [34] suggested that once foreign firms enter a new market to train local workers and managers, providing technical assistance to local suppliers and customers, the technology and productivity of local firms would increase rapidly. Moreover, the competitive pressure imposed by foreign companies may further force local companies to operate more efficiently and introduce more technologies. Secondly, FDI has a negative spillover effect on the host country. Sasidharan and Kathuria (2010) [35] found that FDI would seize the local market share, hinder the growth of local industries, and intensify competition among local enterprises. Under the pressure of the high risk of external capital, local enterprises would rather choose to acquire knowledge from outside than carry out independent R&D investment, which ultimately inhibits the technological innovation activities of the host country. Thirdly, there is no spillover effect of FDI on the host country. The research of Aitken and Harrison (1999) [36] pointed out that since most technology from foreign companies has been completely captured by joint ventures, the impact of FDI on domestic companies is quite small.
In general, existing studies have conducted in-depth discussions around the spillover effects of FDI on the host country’s technology. However, research on the relationship between FDI and GI is more concerned with the theoretical path; few studies have expanded to the empirical level to verify the existence of the impact mechanism of FDI on GI. There are two main deficiencies in the existing literature on the impact mechanism between FDI and GI. First, existing research focuses more on the national level or case study, which fails to fully measure the differentiation characteristics among regions. Second, previous literature mainly focuses on the theoretical perspective of the investment motivation of FDI as well as possible paths to green innovation activities; few studies have reached the empirical level to verify the impact of FDI on GI in consideration of the regulatory role of external macro factors. Our study contributes towards existing literature by verifying the threshold effect and heterogeneity characteristics from the perspective of the spatial dynamic evolution of GI, by introducing moderators of policy environment (PE) and market level (ML) into the model to fill the gap between national and regional levels. Moreover, it is undoubtedly of great theoretical and practical significance to carry out differentiated FDI activities in promoting green innovation-driven strategy. Our findings have more policy recommendations to implement the “development of green and low-carbon industries” proposed by the 20th National Congress of Communist Party of China (NCCPC) as well as guidelines for the provincial governments by regions to improve the green policy system.

3. Theoretical Hypothesis

From the perspective of Resource-Based Theory, resource heterogeneity can be realized via diverse approaches to sustainability that support inimitability (Ashby et al., 2012; Pagel and Shevchenko, 2014) [37,38], and the FDI activities of enterprises from developing countries bring more competitive advantages and resources (Pang, 2019) [39]. First of all, when foreign companies face strict environmental regulations in their own countries, they have to adopt clean energy and develop advanced green low-carbon production technologies. Therefore, FDI not only provides investment, but also provides incentives and opportunities to adopt new green technologies, therefore improving environmental awareness (Birdsall and Wheeler, 1993) [40]. Secondly, foreign-funded enterprises often implement uniform and strict environmental standards; these international environmental standards can promote the development of environmental protection technology in the host country (Eskeland and Harrison 2003) [41]. That would squeeze out the low efficiency and high consuming local enterprises, stimulate the enthusiasm of local enterprises to carry out green technology activities, and improve the environmental quality of developing countries (Mert and Caglar 2020) [42]. Finally, China is in the critical stage of transforming its development mode accompanied by issues of rising labor costs, increasing resources and environmental constraints. The inflow of FDI has promoted domestic resources to technology-intensive, low-pollution, and high value-added industries. That can improve green production efficiency and give more impetus on shifting to a new stage of high-quality development. Given this, this paper proposes hypothesis H1.
Hypothesis 1 (H1):
Foreign direct investment has a positive impact on green innovation.
According to Resource Dependence Theory, the external resource from policy environment (PE) plays an important role in guiding and driving the green innovation of enterprises; these resources can create a more stable market environment for enterprises (Getz 2002) [43]. In order to obtain more competitive advantages and resources, enterprises will continue to accelerate green transformation, develop green products, and fulfill environmental responsibilities with a more positive attitude. Autant et al. (2013) [44] adopted local knowledge spillover effects to explore the impact of European regional innovation policy. Their results emphasized the path of regional innovation policy to support the generation of knowledge and learning, indicating that policymakers should focus on local and regional characteristics to carry out regional innovation policy. In view of Signal Theory, Lerner (1999) [45] found that the government’s intervention in the innovative activities of enterprises through subsidies will be passed on to private investors as a signal of a favorable investing environment. This helps enterprises to become labeled as recognized by the government, which is beneficial for them to obtain the required innovation resources and improve innovation performance. Bai et al. (2019) demonstrated that government R&D subsidies increased energy-intensive enterprises’ green innovation by 107.3% and 54.1% on trend and performance, respectively [46]. Enterprises can effectively use government subsidies to develop green and low-carbon production technologies, and to increase the enthusiasm for green innovation (Fazzari and Petersen 1988) [47]. Williams and Brian (2021) [48] also found that a preferential tax policy environment can effectively reduce the cost of innovation, alleviate the pressure of expensive financing, and encourage enterprises to invest in green innovation. Low taxes and more subsidies can reduce the financing constraints on enterprises, especially under an imperfect capital market where the cost of external financing is relatively high. Meanwhile, Zhou et al. (2002) [49] indicated that FDI inflows are capable of leaving an impact on Chinese government policy that essentially emphasizes foreign direct investment, resulting in a nonlinear dependence between policy environment and FDI in China. Better policy environment enables enterprises to achieve the optimal condition from foreign investment, thereby avoiding those financing constraints on green innovation. Based on the analysis above, we propose hypothesis H2.
Hypothesis 2 (H2):
Policy environment plays a positive moderating role between FDI and GI.
On the basis of Neoclassical Growth Theory, Tuzun and Kalemci (2017) [50] found that FDI and human capital resource provide a strong push to regional economic growth. A higher level of marketization indicates a higher resource allocation efficiency (Zhang et al. 2013) [51], which is conducive to FDI technology spillovers (Cole and Fredriksson, 2009; Hu et al., 2021) [52,53]. Marketization can further boost the capital allocation effectiveness from financial markets as well as encourage fair competition among financial institutions. That can benefit enterprises by lowering the cost of green financing and igniting the motivation of cutting-edge green technologies (Callon 2016) [54]. Those administrative interventions and the inadequate protection of property rights can reduce the distortion of the market, reduce the competition from foreign-funded enterprises, and provide a more market-friendly environment. Based on that, we propose hypothesis H3.
Hypothesis 3 (H3):
Marketization level plays a positive moderating role between FDI and GI.

4. Model Setting and Data Source

4.1. Model Setting

Based on the panel data of 31 provinces, municipalities, and autonomous regions in China from 2003 to 2020, this paper aims to quantitatively examine the impact of FDI on green innovation. The benchmark regression model (1) is as follows:
lnGIit = β0 + β1lnFDIit + β2lnXit + ηi + γt + εit
On the basis of verifying the relationship between FDI and green innovation, this paper further examines the moderating effect of government policy and marketization level. The moderating effect model (2) and (3) was constructed:
lnGIit = β0 + β1lnFDIit + β2lnPEit + β3lnPEit × lnFDIit + β4lnXit + ηi + γt + εit
lnGIit = β0 + β1lnFDIit + β2lnMLit + β3lnMLit × lnFDIit + β4lnXit + ηi + γt + εit
Among them, the subscript i indicates the province, t indicates the year, ηi represents the province fixed effect, γt represents the year fixed effects, and εit represents the error term. The explained variable of GI indicates the green innovation of the province. The explanatory variable of FDI indicates the foreign direct investment of the province. X indicates control variables including foreign capital dependence (FCD), outward foreign direct investment (OFDI), economic development level (EDL), opening-up level (OUL), human capital level (HCL), R&D investment level (RIL), and urbanization level (URL). PE represents the policy environment and ML represents the marketization level, where the cross term of lnPEit × lnFDIit and lnMLit × lnFDIit represents the moderating impact and is our major concern.

4.1.1. Explained Variables

Referring to the practice of Li and Zheng (2016) [55], this paper employs the number of authorized green patents as a substitute variable for green innovation (GI); data are acquired from Chinese Research Data Services (CNRDS).

4.1.2. Explanatory Variables

The amount of regional foreign direct investment is adopted to measure foreign direct investment (FDI); data are collected from China Stock Market & Accounting Research (CSMAR).

4.1.3. Moderating Variables

In line with the method of Yang and Wei (2021) [56], this paper uses principal component evaluation to calculate the comprehensive score from the dimension of government intervention and corporate tax burden, to estimate the policy environment (PE) of 31 provinces in China, where government intervention is measured by the proportion of local fiscal expenditure in local GDP, and corporate tax burden is measured by the ratio of total taxes and surcharges to profits of main business. We obtained the data from National Bureau of Statistics of China (NBSC).
Drawing on the research of Peng and Chen (2015); Wang et al. (2020) [57,58], we employ the comprehensive marketization scores from National Economic Research Institute (NERI) to measure the marketization level (ML).

4.1.4. Control Variables

Referring to the previous research of [15,16,17,18,19], this paper introduces the following control variables into our models: (1) Foreign capital dependence (FCD). The higher the dependence on foreign capital, the more unfavorable it is to enhance the green innovation of the host country. (2) Outward foreign direct investment (OFDI). Outward foreign direct investment affects the green technology innovation of the home country. (3) Economic development level (EDL). Usually, the higher the level of economic development, the more resources can be obtained to invest in green innovation activities. (4) Opening-up level (OUL). A high level of opening up is conducive to attracting green investment from overseas enterprises. (5) Human capital level (HCL). The improvement of human capital will promote the output of innovation. (6) R&D investment level (RIL). Generally speaking, the more R&D investment there is, the more green innovation vitality will be found in the region. (7) Urbanization level (URL). The improvement of the urbanization level can promote the accumulation of innovative resources such as human capital and material capital, and has a positive effect on green innovation ability. These data can be acquired from National Bureau of Statistics of China (NBSC), China Stock Market & Accounting Research (CSMAR), and China Science and Technology Statistical Yearbook (CSTSY). All variable definitions are shown in Table 1 below.

5. Empirical and Spatial Analysis

5.1. Benchmark Regression

Our research objectives are 31 provinces, municipalities, and autonomous regions in China from 2003 to 2020; all continuous variables are trimmed by 1% and 99% to reduce the impact of outlier fluctuations on the results. The descriptive statistics of variables are shown in Table 2.
The Hausman test result of Prob > chi2 is “0.0000” which rejects the null hypothesis, so we choose the fixed effect (FE) model for benchmark regression. Subsequently, the benchmark regression is carried out and the results are shown in Table 3. Column (1) reports the estimation results of FDI on GI without control variables. The results demonstrate that the coefficient of the variable lnFDI is significantly positive at the 1% level, which is in line with expectations, indicating that FDI has a significant impact in promoting green innovation (Luo et al. 2021) [22]. Column (2) imports all control variables, and the coefficient of lnFDI is still significantly positive at the 1% level, where the parameter estimates the difference between 0.080 and 1.122 of FDI and may be due to the omitted variable bias. It can be seen from the benchmark regression that FDI has a positive and stable impact on GI, so the hypothesis H1 is confirmed.

5.2. Dynamic Evolution and Spatial Heterogeneity

Figure 1a,b describes the linear relationship between FDI and GI in 2003 and 2020, respectively. From the distribution of province-level scatter plots, it can be preliminarily estimated that the increase in FDI has been beneficial for the promotion of GI in each province (Song and Han, 2022) [18]. In addition, from the vertical view, the overall level of GI in each province continued to increase from 2003 to 2020, so we make more regional and spatial estimations to examine the dynamic evolution of GI at the provincial level. From the horizontal view, the overall FDI did not show enough difference while the FDI ranking of these regions changed greatly, so we further analyze the spatial heterogeneity of GI.

5.2.1. Dynamic Evolution of GI

Referring to the practice of Wang et al. (2020); Dai et al. (2021) [30,57], China’s provincial-level administrative regions can be divided into three categories which are the eastern, central, and western regions. In order to accurately capture the dynamic evolution of GI from both the national level and regional level, the kernel density curves of the GI of the whole country and the three major regions in 2003, 2008, 2014, and 2020 are shown in Figure 1. Based on that, we further have drawn the spatial distribution maps of the GI of each province and city from 2003 to 2020 which is displayed in Figure 2; therefore, the evolution characteristics of GI can be summarized.
From Figure 2a, both the distribution center and change interval of the whole country illustrate a trend of moving to the right, and the height of the main peak demonstrates an evolution process from sharply decreasing to slightly rising. The width of the curve in-creases first and then narrows slightly, indicating that the overall GI of China continued to increase during the observation period, and the absolute difference increases first and then narrows to a certain extent. Figure 2b–d describe the dynamic evolution trend of GI in eastern, central and western China. From the view of the distribution position, the curve centers and change intervals of all three regions also show a right-shifting trend, indicating that the GI of all regions is generally rising during the observation period. From the perspective of the distribution pattern, the height of the main peak in the eastern region displays a trend from sharply decreasing to slightly rising, and the width of the curve becomes larger as the years go by, indicating that the absolute difference in the eastern region tends to be expanded. The height of the main peak in the central region has experienced an evolution process of sharp decline to obvious recovery, and the width of the curve increases first and then decreases, indicating that the absolute difference in the central region also tends to be expanded. The height of the main peak in the western region demonstrates a trend from decreasing to rising, and the width of the curve becomes narrower, indicating the absolute difference in the western region has a gradual diminution tendency. Overall, the kernel density estimation of the whole country and the three major regions reflect the regional differences within the evolution of GI, and our results are in line with Song and Han (2022); Liu et al. (2021) [18,19].
We further discuss the method of Geographic Information Science (GIS) in supporting sustainable regional development and exploring novel applications and possibilities of spatio-temporal techniques in sustainable development. Figure 3 shows that during the research period, the improvement of GI in the eastern region is faster than in the central and western regions. In 2003, the GI of all provinces was generally lower than 5.2, and only Liaoning, Shandong, Jiangsu, Zhejiang, Hubei, and Guangdong were relatively high, with index values between 5.2 and 6.6. In 2008, the green innovation levels of the eastern coastal provinces such as Liaoning, Shandong, Jiangsu, Zhejiang, and Guangdong remained at the top, with index values between 6.6 and 7.9, while the GI of most central provinces also improved in comparison with 2003. In 2014, the level of green innovation in Jiangsu and Guangdong increased significantly, followed by Shandong, Zhejiang, Anhui, Henan, Hubei, and Sichuan, while the GI in western provinces such as Xinjiang and Qinghai was still relatively low. In addition to Jiangsu and Guangdong, the GI of Zhejiang and Shandong begins to enter the first echelon by 2020, with an index value exceeding 9.2, while the green innovation level of most central provinces in China remains at 7.9.

5.2.2. Heterogeneity Analysis

Based on the regional division of eastern, western, and central regions above, we adopt the heterogeneity analysis of Song and Han (2022); Liu et al. (2021) [18,19] to explore the regional differences of FDI on GI. In Table 4, the coefficient of lnFDI of the eastern region is significantly positive at the 1% level, the coefficient of lnFDI of the central region is negative but not significant, and the coefficient of lnFDI of the western region is significantly positive at the 5% level. FDI can significantly promote GI in the eastern and western regions, but has an inhibitory effect on GI in the central region, and this inhibitory effect is not significant. Therefore, there is regional heterogeneity within the impact of FDI on GI in China. This heterogeneity may stem from the imbalance of geographical resources, economic development, and policy inclination. Moreover, given the huge differences among provinces in terms of foreign investment rate, economic development level, human capital level, urbanization rate, opening-up level, the R&D investment rate would increase this imbalanced situation, which in turn would lead to this heterogenous mechanism of FDI on GI in various regions of China.

5.3. Threshold Effect

The above empirical results show that FDI can significantly promote GI, but this impact tends to be variable based on the diversity of FDI activities (Song and Han 2022) [18]. Due to the diversity of FDI activities, economically developed regions are more able to absorb the advanced green technology brought by FDI, so FDI would positively impact GI among these regions. As for underdeveloped regions, weak economic foundation and single industrial structures have led to less capacity for introducing advanced green products in the early stage of FDI activities (Liu et al., 2021) [19]. That may cause a spillover effect between FDI and GI, affecting or even hindering the improvement of GI in undeveloped regions (Dai et al., 2021) [30]. Furthermore, with the deepening of FDI activities and the establishment of China’s environmental regulations, the entry of polluting foreign enterprises is increasingly restricted, causing FDI inflow become more green and clean [40], and this fact also implies that the promotion of FDI on GI has a “threshold feature.” In order to further investigate the threshold effect of FDI on GI, this paper draws on the threshold model proposed by Hansen [59] to construct a single threshold measurement shown in model (4):
lnGIit = β0 + β1lnFDIit × I(lnFDIit ≤γ) + β2lnFDIit × I(lnFDIit >γ) + β3lnXit + εit
Referring to the research of Ersin et al. (2022) [60], we adopt the bootstrap replications method to explore the double and triple threshold effect. In the threshold model, the threshold value of γ is used to test the existence of the threshold effect and the authenticity of the estimated value. I(..) represents the indicative function, and the value in parentheses is 1 when meeting the conditions in parentheses; otherwise it is 0. Considering the multiple thresholds effect, model (4) can be further extended to model (5) as follows:
lnGIit = β0 + β1lnFDIit × I(lnFDIit ≤ γ1) + β2lnFDIit × I(lnFDIit > γ1) + β3lnXit + … +βnlnFDIit × I(lnFDIit ≤ γn) + βn + 1lnFDIit × I(lnFDIit > γn) + εit
In Table 5, only the single-threshold effect passed the significance test at the 10% level; therefore, we select the single-threshold model for econometric analysis. The estimated threshold value of 10.415 and its corresponding 95% level confidence interval indicate that the threshold recognition effect is significant. Meanwhile, 10.415 is within the 95% level confidence interval, so the threshold effect of FDI in our model is valid.
Based on the threshold estimation of FDI, our regression results of the threshold model are shown in Table 6. Both coefficients of FDI are positive and significant at the 1% level; the estimation results of the threshold model are highly consistent with the main model. The coefficient of FDI > 10.415 is smaller than FDI ≤ 10.415 indicating that the positive impact of FDI on GI is weakened within this threshold range. Overall, FDI has a significant positive dynamic evolution feature with diminishing marginal efficiency on GI, so hypotheses H2 is further confirmed.

5.4. Analysis of Moderating Effects

In order to further verify the impact mechanism of FDI on GI, we introduce policy environment (PE) and marketization level (ML) into the benchmark regression model, where the intersections of lnPE × lnFDI and lnML × lnFDI are our main concerns. Mode (1) and (2) of Table 7 report the moderating effect of PE and ML based on the benchmark model, while the value of R2 of the model (1–3) reflects a strong linear correlation between FDI and GI. Furthermore, both coefficients of the intersection of lnPE × lnFDI and lnML × lnFDI are significant and positive, indicating that FDI will play a more significant role in promoting GI under better policy environment and higher marketization level. Thus, our hypotheses H2 and H3 are confirmed.

5.5. Robustness Test of 2SLS and GMM

A higher level of provincial green innovation may lead to more foreign capital inflows, which cause two-way causal relationship between FDI and GI. Considering more endogenous issues such as omitted variables, this paper takes FDI by 1-period lag as an instrumental variable to examine the robustness of the main test while referring to Li and Liu (2012); Li et al. (2020) [61,62]. As shown in Table 8, both 2SLS and GMM regression results in column (1) and (2) show that FDI significantly affects GI, indicating this promotion effect is robust and stable. Meanwhile, the direction and significance of the moderating effect in the robustness test of PE and ML have mostly adhered to that of the main model, which strongly supports the research hypotheses 2 and 3. Our endogenous analysis results also revealed that the moderating role and significance of PE within the relationship between FDI and GI is more reliable than ML by 2SLS regression.

6. Conclusions and Policy Implications

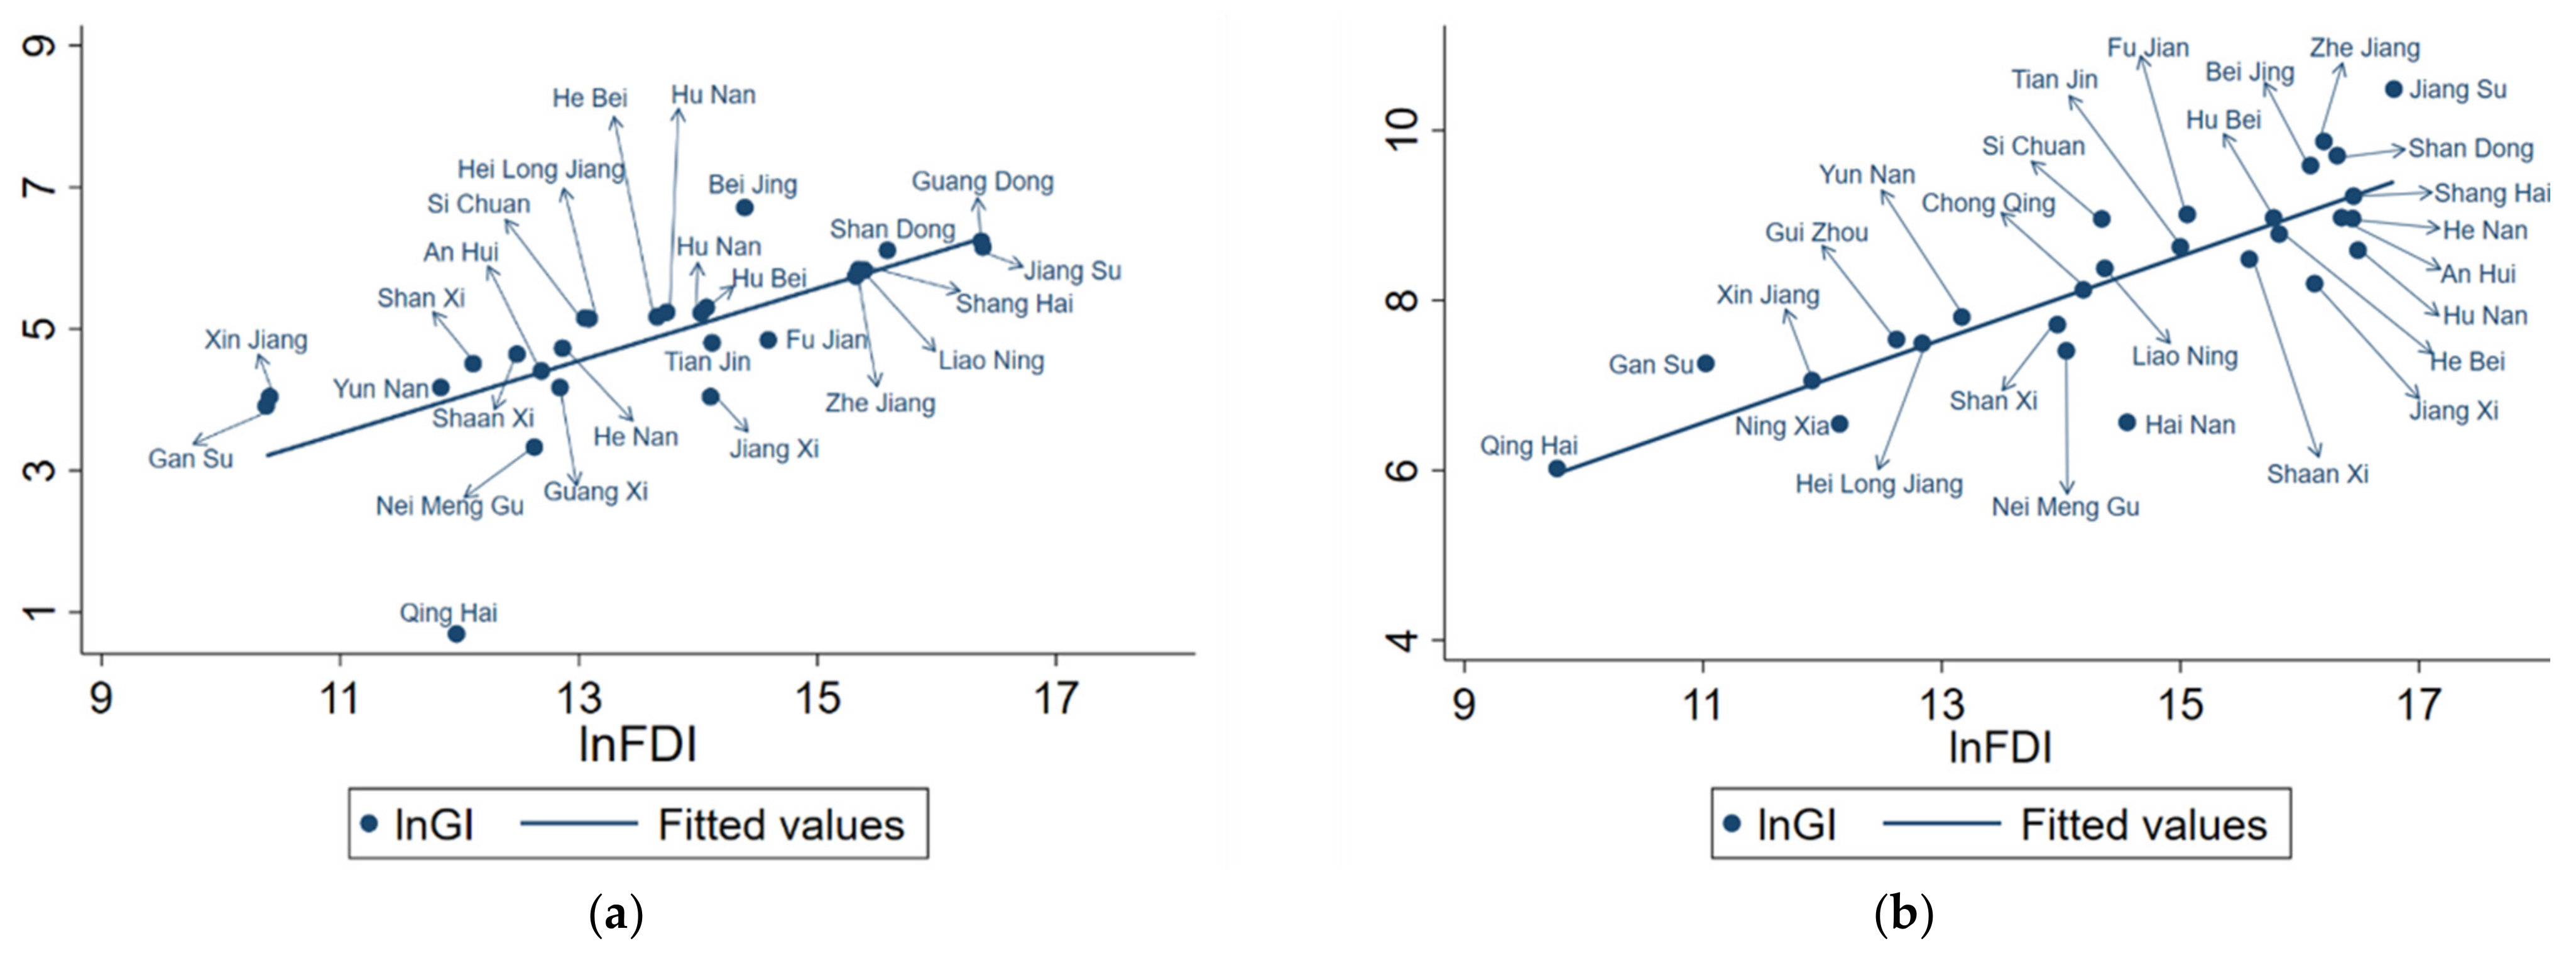
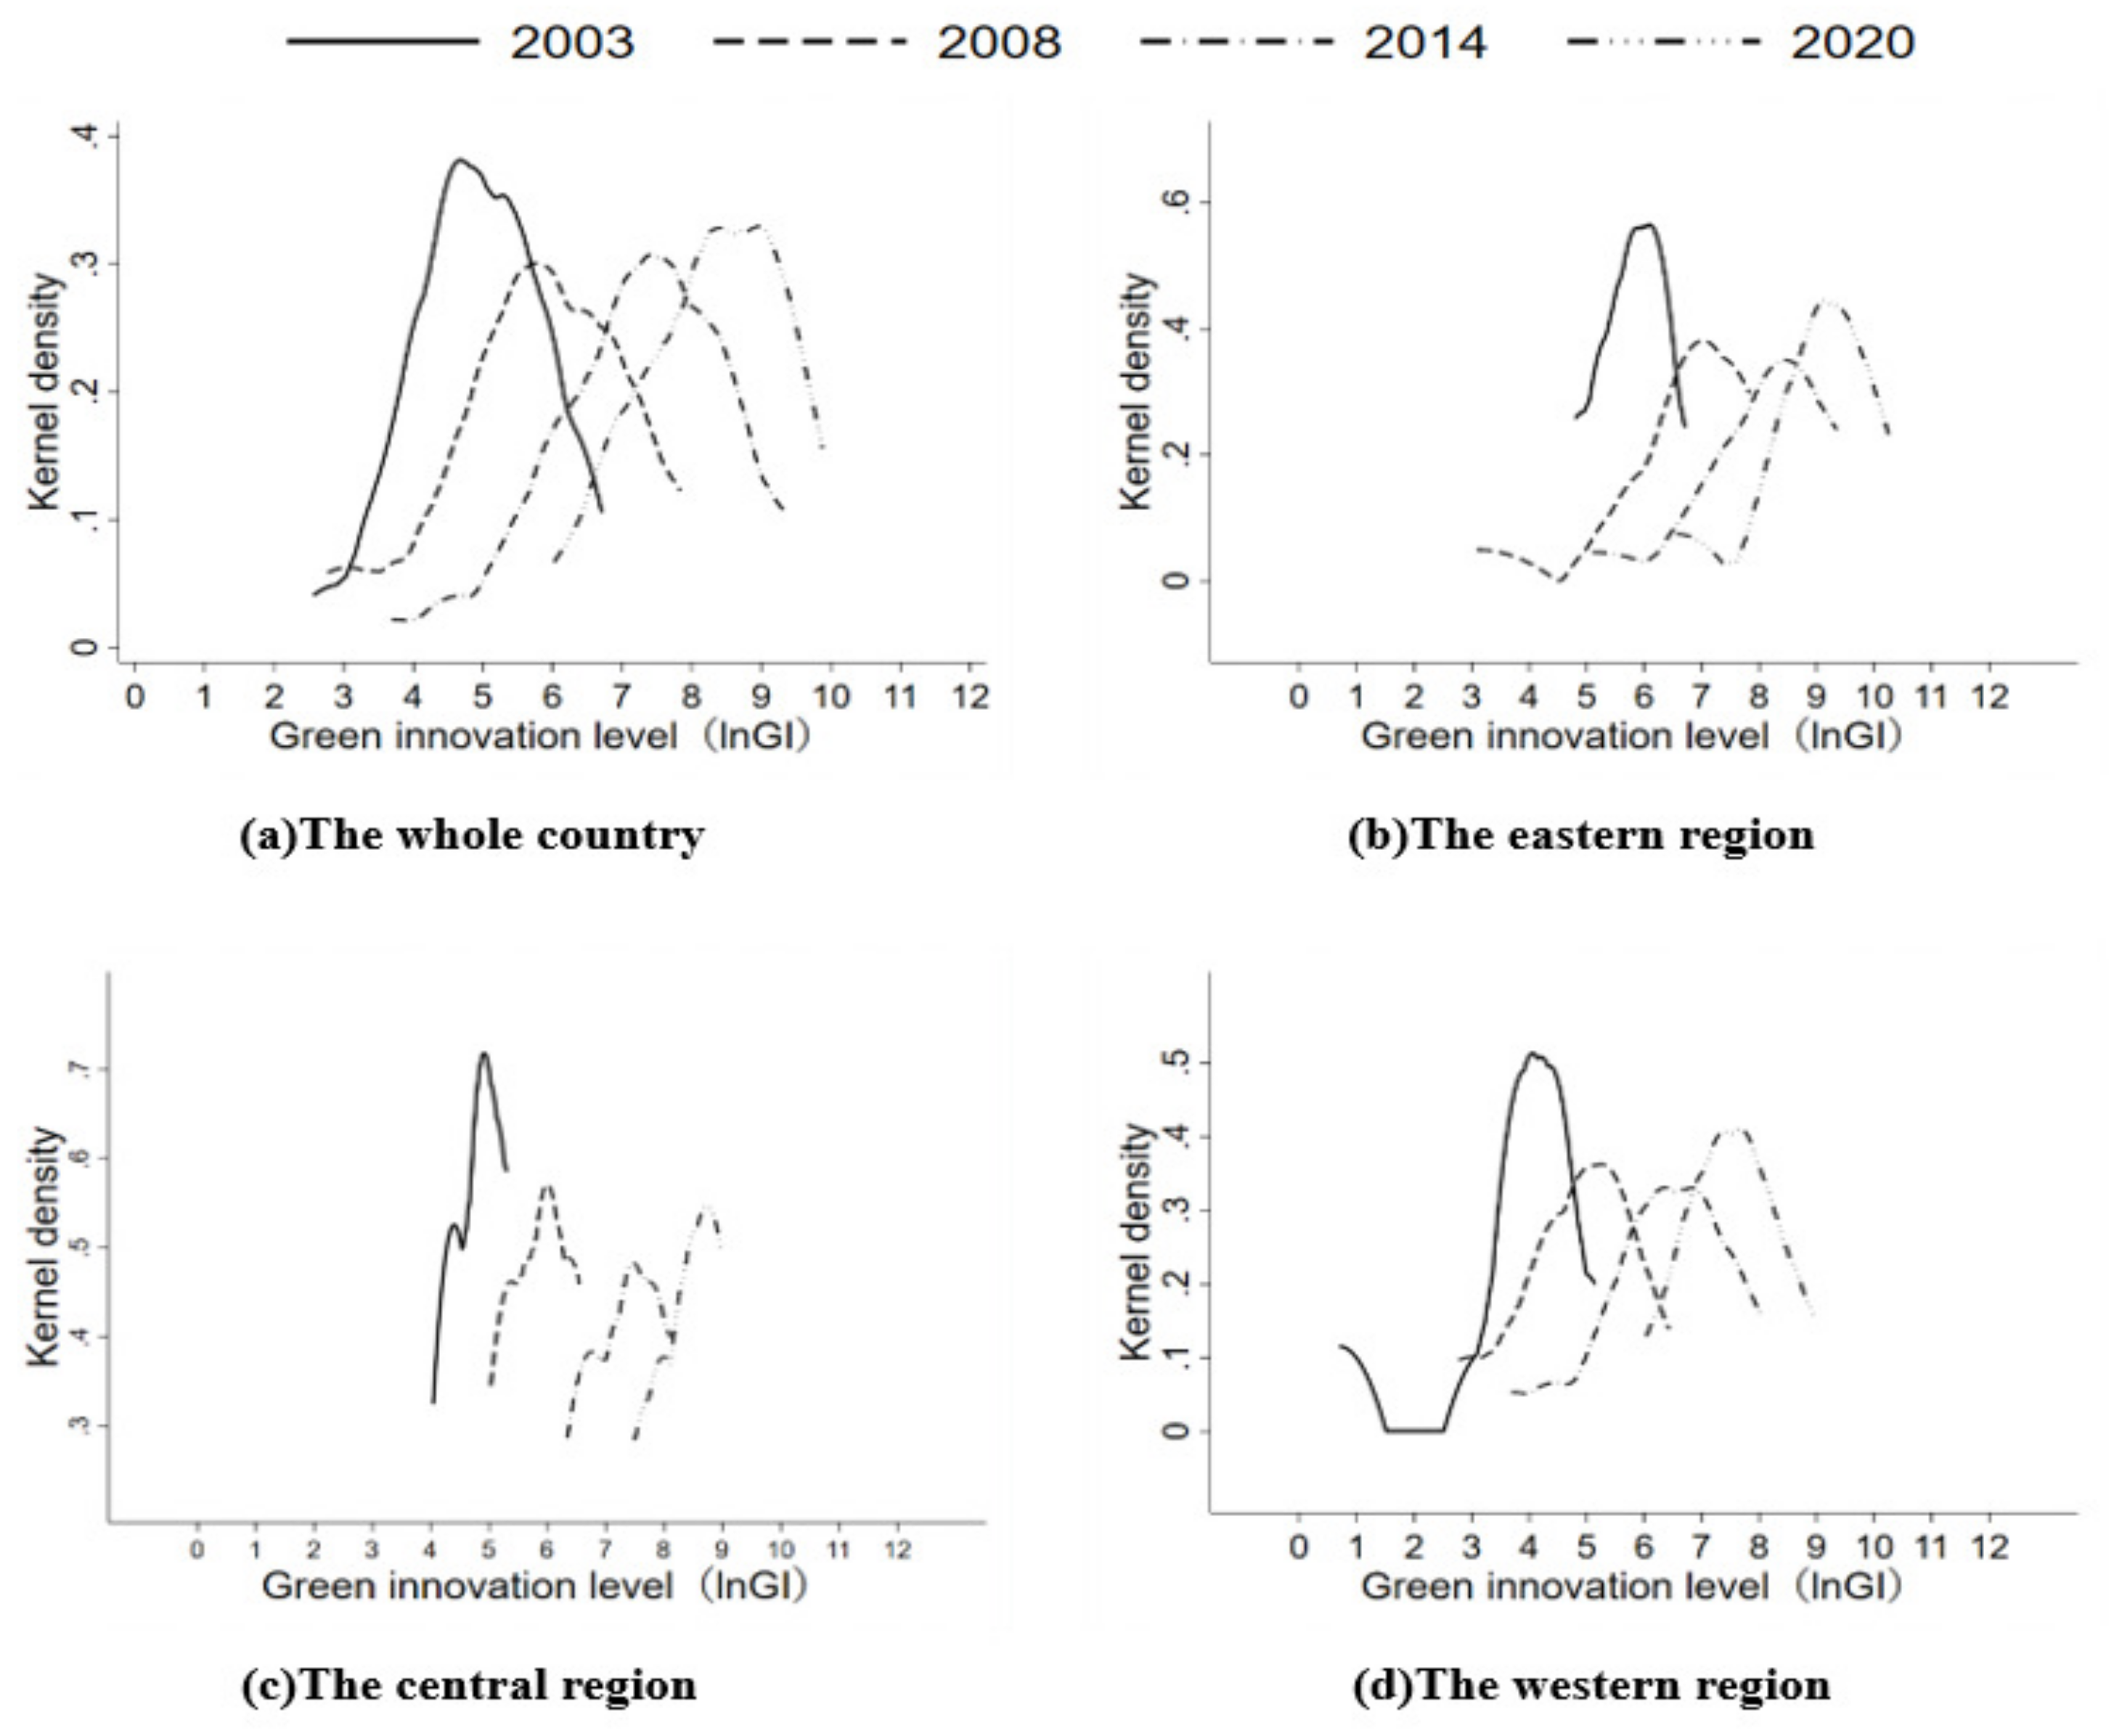
This paper examines the impact of FDI on GI from both theoretical and empirical levels by using the macro-level data of 31 provinces and cities in China from 2003 to 2020. We use the scatter plot to conduct a preliminary analysis of the relationship between FDI and GI. Kernel density estimation and the spatial distribution map are introduced to investigate the dynamics distribution characteristics of GI from both national and regional levels. Meanwhile, we discuss the moderating effects and heterogeneity analysis to investigate the impact mechanism of FDI on GI, as well as construct 2SLS and GMM regression to test the estimation reliability of empirical results. Furthermore, we adopt the threshold model to examine the threshold effect of FDI on GI. Our results show the following: (1) FDI has a significant positive and dynamic evolution feature of diminishing marginal efficiency on GI in China during the study period. (2) The heterogeneity analysis of regional regression implies that FDI significantly increases GI in the eastern and western regions. In contrast, FDI in the central region inhibits GI but not significantly. (3) Both PE and ML can positively moderate the impact of FDI on GI.
The above conclusions are mainly related to the following policy implications: (1) China should give priority to the impact on environmental quality while introducing foreign capital, paying more attention to green foreign capital as well as gathering domestic green innovation resources. That would promote the transformation of domestic resources into green and low-carbon industries. (2) The central government should improve the regional balance on low-carbon and green development, encourage local companies to actively absorb more advanced green technologies from FDI, and provide greater support for green foreign capital on promoting green innovation activities in eastern and western regions. The provincial governments in central regions also need to pay more attention to green policy to strengthen the investment environment, maximize the innovation knowledge spillover effect of FDI, and stimulate the enthusiasm of local companies for green innovation, thereby narrowing the gap among regions. (3) China’s government should adjust from industry entry barriers to green marketization mechanisms, especially to protect the green innovation activities of foreign-funded enterprises and to create better policy environment for those enterprises to conduct green R&D activities, technology diffusion, and fair competition.
Since green innovation can stimulate the transformation and upgrading of local enterprises to green production, many governments have formulated incentive policies such as issuing green bonds, reducing government intervention, and reducing green taxes. Meanwhile, green transformation is not limited to the introduction and operation of FDI; organizations may need to integrate their external investments with sustainability goals, and their decisions must be data-driven. Addressing the significance of integrating sustainability strategies into digital transformation roadmaps entails thinking beyond profit and placing social and environmental considerations on the same footing with financial objectives. Future research is encouraged to focus on the effectiveness of these behaviors by more quantitative methods.

Author Contributions

Conceptualization, F.G. and L.C.; methodology, L.C.; software, F.G.; validation, L.H.; formal analysis, L.C.; writing—original draft preparation, F.G.; writing—review and editing, L.C.; visualization, L.C.; supervision, L.C.; project administration, L.H.; funding acquisition, L.H. All authors have read and agreed to the published version of the manuscript.

Funding

This work was supported by the Soft Science Research Program of Zhejiang Province (2023C35005).

Institutional Review Board Statement

Not applicable.

Informed Consent Statement

Not applicable.

Data Availability Statement

Not applicable.

Conflicts of Interest

The authors declare no conflict of interest.

References

  1. Liu, X.B.; Luo, Y.; Qiu, Z.G.; Zhang, R. FDI and economic development: Evidence from China’s regional growth. Emerg. Mark. Financ. Trade 2014, 50, 87–106. [Google Scholar] [CrossRef]
  2. Jiang, X.C.; Shen, J.H.; Lee, C.C.; Chen, C. Supply-side structural reform and dynamic capital structure adjustment: Evidence from Chinese-listed firms. Pac.-Basin Financ. J. 2021, 65, 101482. [Google Scholar] [CrossRef]
  3. Wang, K.L.; Miao, Z.; Zhao, M.S.; Miao, C.-L.; Wang, Q.-W. China’s provincial total-factor air pollution emission efficiency evaluation, dynamic evolution and influencing factors. Ecol. Indic. 2019, 107, 105578. [Google Scholar] [CrossRef]
  4. Liu, K.; Xue, Y.T.; Chen, Z.F.; Miao, C.L.; Wang, Q.W. The spatiotemporal evolution and influencing factors of urban green innovation in China. Sci. Total Environ. 2023, 857, 159426. [Google Scholar] [CrossRef] [PubMed]
  5. Singhania, M.; Sanni, N. Demystifying pollution haven hypothesis: Role of FDI. J. Bus. Res. 2021, 123, 516–528. [Google Scholar] [CrossRef]
  6. Zhang, C.G.; Zhou, X.X. Does foreign direct investment lead to lower CO2 emissions? Evidence from a regional analysis in China. Renew. Sustain. Energy Rev. 2016, 58, 943–951. [Google Scholar] [CrossRef]
  7. Walter, I.; Ugelow, J.L. Environmental policies in developing countries. Ambio 1979, 8, 102–109. [Google Scholar]
  8. Sarkodie, S.A.; Strezov, V. Effect of foreign direct investments, economic development and energy consumption on greenhouse gas emissions in developing countries. Sci. Total Environ. 2019, 646, 862–871. [Google Scholar] [CrossRef]
  9. Feldman, M.P. The new economics of innovation, spillovers and agglomera-tion: Areview of empirical studies. Econ. Innov. New Technol. 1999, 8, 5–25. [Google Scholar] [CrossRef]
  10. Braun, E.; Wield, D. Regulation as a means for the social control of technology. Technol. Anal. Strateg. Manag. 1994, 6, 259–272. [Google Scholar] [CrossRef]
  11. Zheng, J.Z.; Khurram, M.U.; Chen, L.F. Can green innovation affect ESG ratings and financial performance? evidence from Chinese GEM listed companies. Sustainability 2022, 14, 8677. [Google Scholar] [CrossRef]
  12. James, P. The sustainability circle: A new tool for product development and design. J. Sustain. Prod. Des. 1997, 2, 52–57. [Google Scholar]
  13. Horbach, J.; Rennings, K. Environmental innovation and employment dynamics in different technology fields-an analysis based on the German Community Innovation Survey 2009. J. Clean. Prod. 2012, 57, 158–165. [Google Scholar] [CrossRef]
  14. Yi, M.; Fang, X.; Wen, L.; Guang, F.; Zhang, Y. The heterogeneous effects of different environmental policy instruments on green technology innovation. Int. J. Environ. Res. Public Health 2019, 16, 4660. [Google Scholar] [CrossRef]
  15. Hu, B.; Yuan, K.; Niu, T.Y.; Zhang, L.; Guan, Y. Study on the spatial and temporal evolution patterns of green innovation efficiency and driving factors in three major urban agglomerations in China—Based on the perspective of economic geography. Sustainability 2022, 14, 9239. [Google Scholar] [CrossRef]
  16. Gong, X.S.; Li, M.J.; Zhang, H.Z. Does OFDI improve China’s industrial green innovation efficiency—An empirical study based on the effect of agglomeration economy. Int. Trade Issues 2017, 11, 127–137. [Google Scholar] [CrossRef]
  17. Li, G.X.; Zhang, W. Research on international capital and trade channels of green technology innovation under environmental regulations. Sci. Technol. Manag. Res. 2016, 36, 15–20. [Google Scholar]
  18. Song, W.F.; Han, X.F. The bilateral effects of foreign direct investment on green innovation efficiency: Evidence from 30 Chinese provinces. Energy 2022, 261, 125332. [Google Scholar] [CrossRef]
  19. Liu, L.Y.; Zhao, Z.Z.; Su, B.; Ng, T.S.; Zhang, M.; Qi, L. Structural breakpoints in the relationship between outward foreign direct investment and green innovation: An empirical study in China. Energy Econ. 2021, 103, 105578. [Google Scholar] [CrossRef]
  20. Gray, W.B.; Shadbegian, R.J. Plant vintage, technology, and environmental regulation. J. Environ. Econ. Manag. 2003, 46, 384–402. [Google Scholar] [CrossRef]
  21. Knellerr, R.; Manderson, E. Environmental regulations and innovation activity in UK manufacturing industries. Resour. Energy Econ. 2012, 34, 211–235. [Google Scholar] [CrossRef]
  22. Luo, Y.S.; Salman, M.; Lu, Z.N. Heterogeneous impacts of environmental regulations and foreign direct investment on green innovation across different regions in China. Sci. Total Environ. 2020, 759, 143744. [Google Scholar] [CrossRef] [PubMed]
  23. Porter, M.E. America’s green strategy. Entific Am. 1991, 264, 193–246. [Google Scholar]
  24. Szücs, F. Research subsidiaries, industry-university cooperation and innovation. Res. Policy 2018, 47, 1256–1266. [Google Scholar] [CrossRef]
  25. Bontoux, L.; Bengtsson, D. Using scenarios to assess policy mixes for resource efficiency and eco-innovation in different fiscal policy frameworks. Sustainability 2016, 8, 309. [Google Scholar] [CrossRef]
  26. Castaldi, C.; Frenken, K.; Los, B. Related variety, unrelated variety and technological breakthroughs: An analysis of US state-level patenting. Reg. Stud. 2015, 49, 767–781. [Google Scholar] [CrossRef]
  27. Bischi, G.-I.; Dawid, H.; Kopel, M. Spillover effects and the evolution of firm clusters. J. Econ. Behav. Organ. 2003, 50, 47–75. [Google Scholar] [CrossRef]
  28. Pang, J.; Jin, S.M.; Zhu, P.Y. The impact of external network relationships on green technology innovation: Promotion or inhibition. Sci. Technol. Prog. Countermeas. 2019, 36, 1–10. [Google Scholar]
  29. Chen, Y.S.; Lai, S.B.; Wen, C.T. The influence of green innovation performance on corporate advantage in Taiwan. Bus. Ethics 2006, 67, 331–339. [Google Scholar] [CrossRef]
  30. Dai, L.H.; Mu, X.R.; Lee, C.C.; Liu, W. The impact of outward foreign direct investment on green innovation: The threshold effect of environmental regulation. Environ. Sci. Pollut. Res. 2021, 28, 34868–34884. [Google Scholar] [CrossRef]
  31. Feng, Y.C.; Wang, X.H.; Du, W.C.; Wu, H.; Wang, J. Effects of environmental regulation and FDI on urban innovation in China: A spatial Durbin econometric analysis. J. Clean. Prod. 2019, 235, 210–224. [Google Scholar] [CrossRef]
  32. Zhang, Y.M.; Xing, C.; Wang, Y. Does green innovation mitigate financing constraints? Evidence from China’s private enterprises. J. Clean. Prod. 2020, 264, 121698. [Google Scholar] [CrossRef]
  33. Chen, J.Y.; Zhou, Z. The effects of FDI on innovative entrepreneurship: A regional-level study. Technol. Forecast. Soc. Chang. 2022, 186, 122159. [Google Scholar] [CrossRef]
  34. Kokko, A. Technology, market characteristics and spillovers. J. Dev. Econ. 1994, 43, 279–293. [Google Scholar] [CrossRef]
  35. Sasidharan, S.; Kathuria, V. Foreign direct investment and R&D: Substitutes or complements—A case of Indian manufacturing after 1991 reforms. World Dev. 2010, 39, 1226–1239. [Google Scholar]
  36. Aitken, B.J.; Harrison, A.E. Do Domestic firms benefit from direct foreign investment? Evidence from Venezuela. Am. Econ. Rev. 1999, 89, 605–618. [Google Scholar] [CrossRef]
  37. Ashby, A.; Leat, M.; Hudson-Smith, M. Making Connections: A Review of Supply Chain Management and Sustainability Literature. Supply Chain Management. Int. J. 2012, 17, 497–516. [Google Scholar]
  38. Pagel, M.; Shevchenko, A. Why research in sustainable supply chain management should have no future. J. Supply Chain Manag. 2014, 50, 44–55. [Google Scholar] [CrossRef]
  39. Pang, L.X.; Guan, J.C.; Gao, F. Research on international technology knowledge spillover effect and its influencing factors. Manag. Rev. 2019, 31, 83–91. [Google Scholar]
  40. Birdsall, N.; Wheeler, D. Trade policy and industrial pollution in Latin America: Where are the pollution havens? J. Environ. Dev. 1993, 2, 137–149. [Google Scholar] [CrossRef]
  41. Eskeland, G.S.; Harrison, A.E. Moving to greener pastures? Multinationals and the pollution haven hypothesis. J. Dev. Econ. 2003, 70, 1–23. [Google Scholar] [CrossRef]
  42. Mert, M.; Caglar, A.E. Testing pollution haven and pollution halo hypotheses for Turkey: A new perspective. Environ. Sci. Pollut. Res. 2020, 27, 32933–32943. [Google Scholar] [CrossRef] [PubMed]
  43. Getz, K.A. Public affairs and political strategy: Theoretical foundations. J. Public Aff. 2002, 1, 305–329. [Google Scholar] [CrossRef]
  44. Autant-bernard, C.; Fadairo, M.; Massard, N. Knowledge diffusion and innovation policies within the European regions: Challenges based on recent empirical evidence. Res. Policy 2013, 42, 196–210. [Google Scholar] [CrossRef]
  45. Lerner, J. The Government as venture capitalist: The Long-run impact of the SBIR program. J. Bus. 1999, 72, 285–318. [Google Scholar] [CrossRef]
  46. Bai, Y.; Song, Y.; Jiao, J.L.; Yang, R. The impacts of government R&D subsidies on green innovation: Evidence from Chinese energy-intensive firms. J. Clean. Prod. 2019, 233, 819–829. [Google Scholar]
  47. Fazzari, S.M.; Petersen, B.C. Financing constraints and corporate investment. Brook. Pap. Econ. Act. 1988, 19, 141–206. [Google Scholar] [CrossRef]
  48. Williams, B.; Brian, M. Real effects of financial reporting on innovation: Evidence from tax law and accounting standards. Account. Rev. 2021, 96, 397–425. [Google Scholar] [CrossRef]
  49. Zhou, D.; Li, S.; David, K.T. The Impact of FDI on the Productivity of Domestic Firms: The Case of China. Int. Bus. Rev. 2002, 11, 465–484. [Google Scholar] [CrossRef]
  50. Tuzun, I.K.; Kalemci, R.A. Workplace deviance and human resource management relations: A case study of Turkish hotel employees. J. Hum. Resour. Hosp. Tour. 2017, 17, 137–153. [Google Scholar] [CrossRef]
  51. Zhang, P.; Chen, W.M.; Li, Y.N. Foreign direct investment, marketization and environmental pollution—An empirical study based on China’s interprovincial panel data from 1998 to 2009. Int. Trade Issues 2013, 6, 88–97. [Google Scholar] [CrossRef]
  52. Cole, M.A.; Fredriksson, P.G. Institutionalized pollution havens. Ecol. Econ. 2009, 68, 1239–1256. [Google Scholar] [CrossRef]
  53. Hu, H.; Wang, H.; Zhao, S.; Xi, X.; Li, L.; Shi, X.; Lu, Y.; Yu, J.; Liu, X.; Li, J.; et al. Threshold Effect of Foreign Direct Investment and Carbon Emissions Performance from the Perspective of Marketization Level: Implications for the Green Economy. Front. Psychol. 2021, 12, 708749. [Google Scholar] [CrossRef] [PubMed]
  54. Callon, M. Revisiting marketization: From interface-markets to market-agencements. Consum. Mark. Cult. 2016, 19, 17–37. [Google Scholar] [CrossRef]
  55. Li, W.J.; Zheng, M.N. Substantive innovation or strategic innovation?—The impact of macro industrial policy on micro enterprise innovation. Econ. Res. 2016, 51, 60–73. [Google Scholar]
  56. Yang, R.F.; Wei, Q.Q. Research on the impact of business environment on urban innovation capability—An empirical test based on the mediating effect. World Res. 2021, 10, 35–43. [Google Scholar] [CrossRef]
  57. Peng, J.; Chen, H.Q. Internal control, marketization level and corporate social responsibility. Mod. Financ. Econ. 2015, 35, 43–54. [Google Scholar] [CrossRef]
  58. Wang, M.M.; Lian, S.; Li, H.Y. Two-way FDI, intellectual property protection and green patent output in China—An empirical analysis based on interprovincial panel data. J. Syst. Manag. 2020, 29, 1136–1149. [Google Scholar]
  59. Hansen, B.E. Threshold effects in non-dynamic panels: Estimation, testing, and inference. J. Econ. 1999, 93, 345–368. [Google Scholar] [CrossRef]
  60. Ersin, O.; Ustabas, A.; Acar, T. The Nonlinear Effects of High Technology Exports, R&D and Patents on Economic Growth: A Panel Threshold Approach to 35 OECD Countries. Rom. J. Econ. Forecast. 2022, 25, 26–44. [Google Scholar]
  61. Li, M.; Liu, S. Regional differences and threshold effect of reverse technology spillovers from foreign direct investment—Threshold regression analysis based on China’s provincial panel data. Manag. World 2012, 1, 21–32. [Google Scholar] [CrossRef]
  62. Li, M.X.; Zhu, Y.F.; Yu, D.S. The impact of China’s outward foreign direct investment on industrial structure regulation. Asia Pac. Econ. 2020, 3, 85–94. [Google Scholar] [CrossRef]
Figure 1. (a) linear relationship between FDI and GI in 2003; (b) linear relationship between FDI and GI in 2020.
Sustainability 15 03318 g001
Figure 2. Kernel Density Estimation of National and Regional Green Innovation. Annotations: The three major regions refer to the eastern, central and western regions of China, which are consistent with the regional classifications of China National Bureau of Statistics (CNBS). Among them, 11 provinces of the eastern region include Beijing, Tianjin, Hebei, Liaoning, Shanghai, Jiangsu, Zhejiang, Fujian, Shandong, Guangdong, and Hainan; 8 provinces of the central region include Shanxi, Jilin, Heilongjiang, Anhui, Jiangxi, Henan, Hubei, and Hunan Provinces; 12 provinces of the western region include Inner Mongolia, Guangxi, Chongqing, Sichuan, Guizhou, Yunnan, Tibet, Shaanxi, Gansu, Qinghai, Ningxia, and Xinjiang.
Sustainability 15 03318 g002
Figure 3. Spatial distribution of green innovation in various provinces and cities across China.
Sustainability 15 03318 g003
Table 1. Variable definitions.
TypeVariableSymbolMeasurementSources
Explained variableGreen innovationlnGISum of authorized green invention patents and authorized green utility model patentsCNRDS Database
Explanatory variable Foreign direct investmentlnFDIForeign direct investment inflowNBSC Database
Moderator variablesPolicy environmentlnPECalculated by government intervention and corporate tax burden using principal component evaluationCSMAR Database
Marketization levellnMLComprehensive marketization scoresNERI Database
Control variableForeign capital dependencelnFCDProportion of foreign direct investment in GDPCSMAR Database
Outward foreign direct investmentlnOFDIOutward foreign direct investment flowCSMAR Database
Economic development levellnEDLPer capital GDPCSMAR Database
Opening-up levellnOULProportion of total import and export in GDPCSMAR Database
Human capital levellnHCLPer capital years of educationNBSC Database
R&D investment levellnRILProportion of R&D expenditure in GDPCSTSY Database
Urbanization levellnURLProportion of urban population in total populationNBSC Database
Table 2. Descriptive statistics.
SymbolNAverageSDMinMax
lnGI5236.6721.6542.5659.879
lnFDI52314.3611.66910.06716.707
lnPE5230.0190.68−1.6395.138
lnML5231.9670.2710.9052.479
lnFCD523−4.1611.085−7.444−2.255
lnOFDI52311.9732.3185.96116.132
lnEDL5231.1740.721−0.4382.603
lnOUL523−1.6570.959−4.0010.477
lnHCL5232.1660.1111.9122.497
lnRIL523−4.3910.639−5.975−2.885
lnURL523−0.6550.261−1.246−0.113
Table 3. Regression results of the benchmark model.
VariableslnGI
(1)(2)
lnFDI0.080 ***1.122 ***
(3.46)(8.48)
lnFCD −1.082 ***
(−8.39)
lnOFDI 0.046 ***
(3.89)
lnEDL −0.861 ***
(−6.89)
lnOUL −0.090 **
(−2.23)
lnHCL 2.508 ***
(5.28)
lnRIL 0.370 ***
(5.93)
lnURL 1.399 ***
(6.67)
Constant3.677 ***−17.280 ***
(11.79)(−6.97)
Province fixYesYes
Year fixYesYes
Adjusted R20.9560.943
Obs523523
Annotations: *** and ** and represent significance at 1% and 5% levels, respectively. The T value is in parentheses.
Table 4. Heterogeneity analysis of FDI on GI by region.
VariableslnGI
(1)(2)(3)
Eastern RegionCentral RegionWestern Region
lnFDI1.650 ***−0.0060.419 **
(7.05)(−0.01)(2.44)
lnFCD−1.682 ***0.047−0.372 **
(−7.15)(0.07)(−2.24)
lnOFDI0.0270.0240.060 ***
(1.51)(1.02)(3.20)
lnEDL−1.134 ***0.664−0.415 **
(−6.42)(1.02)(−2.16)
lnOUL−0.349 ***0.064−0.044
(−3.14)(0.60)(−0.91)
lnHCL4.261 ***2.535 **0.810
(5.89)(2.57)(1.17)
lnRIL0.733 ***0.418 *−0.107
(6.50)(1.92)(−1.16)
lnURL1.565 ***1.844 ***0.605
(5.17)(2.99)(1.13)
Constant−28.788 ***3.688−4.937
(−6.44)(0.29)(−1.50)
Province fixYesYesYes
Year fixYesYesYes
Adjusted R20.9850.9730.974
Obs193140190
Annotations: ***, **, and * represent significance at 1%, 5%, and 10% levels, respectively. The T value is in parentheses.
Table 5. Threshold estimation of FDI.
Threshold VariableThreshold NumberF-Statisticp-ValueThreshold Estimate95% Level Confidence Intervals10%5%1%
lnFDISingle threshold26.09 *0.06510.415[10.409, 10.560]23.90927.15437.168
Double threshold25.740.13012.627[12.577, 12.686]31.14239.69454.801
Triple threshold11.730.55011.867[11.843, 13.655]32.35544.30060.594
Annotations: * represents significance at 10% level, respectively.
Table 6. Regression results for a single threshold model.
VariablesCoefficient Estimatest-Valuep-Value
lnFDI ≤ 10.4151.725 ***12.630.000
lnFDI > 10.4151.691 ***12.400.000
lnFCD−1.695 ***−12.950.000
lnOFDI0.044 ***2.880.004
lnEDL−0.749 ***−4.880.000
lnOUL−0.285 ***−5.120.000
lnHCL2.787 ***5.670.000
lnRIL0.355 ***4.550.000
lnURL1.732 ***7.150.000
Constant−28.268 ***−11.510.000
Annotations: *** represents significance at 1% level, respectively.
Table 7. Regression results of the moderating model.
VariableslnGI
(1)(2)
lnFDI1.077 ***1.017 ***
(8.16)(7.37)
lnML −0.691 *
(−1.67)
lnML × lnFDI 0.090 ***
(2.99)
lnPE−0.246
(−1.49)
lnPE × lnFDI0.022 **
(2.53)
lnFCD−1.033 ***−1.166 ***
(−7.96)(−9.17)
lnOFDI0.042 ***0.044 ***
(3.58)(3.80)
lnEDL−0.888 ***−0.985 ***
(−7.10)(−7.90)
lnOUL−0.092 **−0.121 ***
(−2.25)(−2.99)
lnHCL2.388 ***2.725 ***
(5.03)(5.83)
lnRIL0.335 ***0.387 ***
(5.37)(6.15)
lnURL1.362 ***1.459 ***
(6.43)(6.84)
Constant−16.406 ***−17.435 ***
(−6.66)(−6.89)
Province fixYesYes
Year fixYesYes
Adjusted R20.9720.973
Obs523523
Annotations: ***, **, and * represent significance at 1%, 5%, and 10% levels, respectively. The T value is in parentheses.
Table 8. Robustness estimation results of 2SLS and GMM regression.
VariablesBenchmark ModelModerating Model
2SLSGMM2SLSGMM
(1)(2)(3)(4)(5)(6)
L.GI 0.743 *** 0.767 ***0.708 ***
(13.41) (10.94)(8.54)
lnFDI1.122 ***0.227 ***0.654 ***0.652 ***0.191 ***0.274 *
(4.23)(3.37)(3.84)(3.58)(4.29)(1.81)
lnPE −0.303 −0.332
(−0.88) (−0.75)
lnPE × lnFDI 0.013 * 0.194 **
(1.82) (2.07)
lnML −0.750 −1.017
(−0.75) (−1.06)
lnML × lnFDI 0.317 ** 0.594 **
(2.24) (2.43)
ControlsYesYesYesYesYesYes
AR (1) 0.000 0.0000.000
AR (2) 0.308 0.2650.387
Sargan 1.000 1.0001.000
Obs492492492492492492
Annotations: ***, ** and * represent significance at 1%, 5%, and 10% levels, respectively.
Disclaimer/Publisher’s Note: The statements, opinions and data contained in all publications are solely those of the individual author(s) and contributor(s) and not of MDPI and/or the editor(s). MDPI and/or the editor(s) disclaim responsibility for any injury to people or property resulting from any ideas, methods, instructions or products referred to in the content.

