Abstract
The present study shows the opportunity of using biofilm in the hydrolysis step of food waste (FW) to increase biogas production. Therefore, screened biofilm-producing microorganisms were adopted to facilitate the biodegradation of organic compounds (OCs) and enhance the volume of biogas production. The biofilm-producing microorganisms were first immobilized on a granular activated carbon (GAC) surface, and the optimum values of immobilization time, mass of the GAC surface, and size of the microbial inoculums were found using the statistical methods of one-factor-at-a-time (OFAT) and the response surface methodology (RSM) using a face-centered central composite design (FCCCD). Based on the results, 48 h of incubation, 8 g of GAC, and 1 mL of inoculum were the optimum conditions when shaken at 37 °C and 150 rpm. Different biofilm amounts (328 mg, 492 mg, 656 mg, 820 mg, and 984 mg) were used in hydrolysis flasks operated in batch mode to increase the degradation of the OCs. The optimal level of the hydrolysis degradation was on day 3 and at 328 mg of biofilm; the total solid (TS) content was decreased from 115 gL−1 to 79 gL−1 (31%), and the TCOD was decreased from 85.33 gL−1 to 54.50 gL−1 (36%).
1. Introduction
Municipal wastes are massively generated around the world, and their generation rates need to be taken into consideration for continuous improvement in the world’s municipal solid waste (MSW) management. It is fully realized that waste valorization studies are needed, and many researchers are highly interested in this area. Some have studied the valorization of animal manures and their use as diverse biofuels and energies, such as biotenanol, biodiesel, biogas, pyrolytic products, heat, and electricity, e.g., Jung et al. [1].
However, FW accounts for the largest amount of municipal waste after paper, as reported by Tian et al. [2] and Edwiges et al. [3]. The management of FW continues to be a major challenge due to the uncontrolled discharge of considerable amounts produced mostly by hotels, restaurants, families, canteens, companies, kitchens, and so on, as reported by Ferdes et al. [4] and Salamat et al. [5]. Currently, municipal FW is sent for incineration and to landfill plants for final disposal, but these processes have serious problems, which include increases in waste disposal costs, the leachate problem that causes groundwater pollution, and rises in toxic and greenhouse gas emissions, as reported by Slorach et al. [6] and Zhang et al. [7]. On the other hand, renewable energy demands have increased due to the growing concerns about climate change, the reliance on energy imports, and the insufficiency of fossil fuels, as shown by Heiker et al. [8]. Hence, biogas technology offers a very attractive way to use some categories of biomass to meet partial energy needs and ensure the appropriate functioning of biogas plants. Biogas can offer several benefits to users by bringing about the conservation of resources and protection of the environment, as reported by Angelidaki et al. [9]. In addition, a variety of technologies are available for biogas purification and utilization, and, among them, dry reforming can be used as an effective alternative for biogas valorization, as shown by Gao et al. [10] and Jung et al. [11]. This is because dry reforming can convert the following two important greenhouse gases to biogas: methane and carbon dioxide into syngas. At the same time, a rising number of researchers are looking into ways to use biogas, including both conventional methods, such as producing heat and electricity, and novel ones, such as converting biogas to hydrogen and liquid fuels, e.g., Charisiou et al. [12].
Nonetheless, anaerobic digestion (AD) is a process that generates methane, which is an energy carrier. It can contribute to the sustainable management of municipal solid waste and promote the minimization of large amounts of domestic FW by turning it into biogas energy, as reported by Khadka et al. [13] and Obileke et al. [14]. The AD process is generally composed of the following four steps: hydrolysis, acidogenesis, acetogenesis, and methanogenesis. The use of food waste for biogas production is indeed quite problematic in terms of the hydrolysis step, also known as the pretreatment step, which is generally considered a rate-limiting step for the overall AD, as reported by most researchers, e.g., Vijayakumar et al. [15]. According to several studies, e.g., Liu et al. [16], Caroca et al. [17], Veluchamy et al. [18], and Carrere et al. [19], hydrolysis is a slow step because of the decomposition, solubilization, and enzymatic degradation of the organic matter (OM) contained in FW. They also noted that low biodegradability could result in undesirable outcomes, such as a long retention time, low methane production, and process instability.
However, bacterial biofilms are structures composed of extracellular polymeric substances and bacterial species that stick to surfaces in colonies. The biofilms are mainly composed of water, which allows the bacteria to colonize solid surfaces, resulting in biofilm formation. The reason why living microorganisms are used as part of a biofilm is that microbe communities are usually more resilient to stress and can contribute to the more efficient degradation of organic substrates and higher methane yields from biogas. Karagiannidis and Perkoulidis [20] and Langer et al. [21] studied the formation of biofilms along with the anaerobic digestion of organic waste at high and low loading rates. They noticed that at a high loading rate, the biofilm came into existence in the form of a continuous layer, whereas at small organic microcolonies, the biofilms instead developed as an extended biofilm layer, and the biofilm carrier was not totally enclosed by the biofilm layer. In contrast, the biofilm carriers were completely covered at the high loading rate. They have concluded that biofilms can improve the digestion of organic waste and result in an increase in biogas. The addition of biofilm carriers to biogas reactors can be a potential approach to enhancing biogas production from food waste by enhancing the digestion of FW in the hydrolysis step, as reported by Mehdaoui et al. [22] and Alam et al. [23]. This can be explained by the fact that the bacteria involved in biogas reactors could attach to the biofilm carrier and enhance the digestion of organic waste, as reported by Langer et al. [21,22,23,24]. Biofilm-mediated anaerobic digestion is mostly used in wastewater treatments as found in dairy industry wastewater and industrial wastewater treatments, as reported by Karadag et al. [25]. In addition, the biofilm technology for the enhancement of biogas production from palm oil mill effluent (POME) was also conducted by Fazil et al. [26].
Hence, this study aims to use biofilm-producing bacteria in hydrolysis by immobilizing them on granular activated carbon (GAC). For that, prepared biofilm-producing microbial strains were first collected, inoculated, and immobilized on the GAC surface. The mass of the GAC surface that gave the best result for the immobilization of the biofilm based on biomass weight was chosen to evaluate the hydrolysis process of FW. The evaluation of hydrolysis with the immobilized biofilm was studied based on the total solid (TS) content, volatile solid (VS) content, total chemical organic demand (TCOD), and soluble chemical organic demand (sCOD).
2. Materials and Methods
2.1. Selection of Potential Biofilm-Producing Microbial Strains for Immobilization
Fazil et al. [26] isolated 120 bacterial strains, of which 60 were collected from palm oil mill effluent (POME), 30 were collected from palm kernel cake (PKC), and 30 were collected from food compost. Thus, these strains were screened to see the ability of the bacteria to produce biofilm. Among these 120 strains, only 33 showed biofilm production, and only 11 of them demonstrated significant amounts of biofilm, which was produced at an OD wavelength of 595 nm (>0.01) when stained with crystal violet in a microtiter plate.
Additionally, the bacterial strains were isolated and their hydrolytic enzyme secretion was tested. Based on a hydrolysis enzyme assay test, all strains were unable to secrete the protease enzyme. The biofilm produced was also characterized. In the hydrolysis enzyme assay test, all strains were unable to secrete the protease enzyme. A total of four strains showed positive results for the cellulase, amylase, and lipase enzymes, allowing them to be tested as single strain bacteria as well as mixed with other isolated bacteria for future research on effective hydrolysis towards enhanced biogas production. The mixture of the four strains from POME and food waste that showed the best results when screened for biofilm formation and with the hydrolysis enzyme assay was used for further experiments. Since the production of biofilms is better in mixed cultures than in a single culture, these four mixed strains were used for the pretreatment of food waste.
2.2. Food Waste Sample Collection and Preparation
The main raw material used in this study was domestic food waste collected from different canteens at the International Islamic University of Malaysia (IIUM), Gombak Campus, Kuala Lumpur. The mixed FW (approximately 20 kg), composed of 10 kg of cooked rice only, 4 kg of leftovers, 3 kg of cooked meat, and 2.3 kg of peels and vegetables, was kept in a container at 4 °C for 6 months in order to avoid any degradation of the microorganisms. Prior to its use for the experiments, the FW was processed as described by Yadav et al. [27] and Zhang et al. [28] using a shredding machine to shred the FW into big pieces, as described by Ikpe et al. [29]. The sample was then blended with a blender to decrease the particle size of the substrate and facilitate the degradation of the FW by the microorganisms. While blending, the FW was diluted with 10% (w/v) distilled water to liquefy and form a FW slurry. This means that 1000 mL (1L) of distilled water was utilized to blend 1kg of collected FW and sludge with a concentration of 1 kgL−1. Total solid (TS), total volatile solid (TVS), total chemical oxygen demand (TCOD), soluble COD (SCOD), pH, and moisture content (MC) measurements were carried out based on standard methods, according to Ahmadi et al. [30] and Jamali et al. [31]. The food waste moisture content determination was performed by weighting the evaporated dish and the considered grams (100 g) of sample with a balance, and W1 was noted as the initial weight. Thus, the dish with the sample was dried at a temperature range of 103 °C to 105 °C in an oven for about 24 h. The dish with the sample was then cooled in a desiccator and weighted, and W2 was noted as the oven-dried weight, as described by El-Mashad et al. [32]. Total solids is the measurement of all solids present, whether suspended or dissolved, or, in other words, it is considered as the residue remaining upon evaporation, as reported by Abbassi-Guendouz et al. [33]. TCOD is used to estimate the oxygen demand of organic matter when it is subjected to oxidation by a strong chemical oxidant in food waste. Therefore, the TCOD of the food waste was measured using the Hach® DR5000 spectrophotometer UV–Vis. The soluble COD was measured similarly to the COD measurement, but the difference is that for SCOD, the sample was filtered with a 0.45 μm APHA syringe filter [34]. Before any of the experiments, the stored food waste sample was sterilized for each experiment.
2.3. Media Culture and Inoculation of Biofilm-Producing Bacteria
The microorganisms used in this study were collected from an environmental biotechnology lab at the International Islamic University of Malaysia (IIUM). The obtained four bacterial strains were isolated, screened, and characterized as potential biofilm-producing microorganisms. The mixture of these four strains was used for further experiments, where they were first cultivated in a liquid medium using a conical flask, as described by Langer et al. [21], Fazil et al. [26], and Yadav et al. [27]. Once the four strains were chosen and cultured, a mixture of these strains with a fixed concentration of 0.1 OD was prepared and used for an immobilization experiment. Therefore, it is important to find the optimum time for high amounts of bacteria attached to the GAC and GAC mass that can form more biomass.
2.4. Immobilization of Biofilm on Granular Activated Carbon (GAC)
2.4.1. Immobilization Solution Preparation
The GAC mass was first washed with distilled water to clean the GAC and the small GAC particles, which can be removed by the Luria-Bertan (LB) broth, and this could lead to an error in the mass weight. After that, the washed GAC was dried overnight in an oven at 103–105 °C to remove any moisture. LB broth was prepared and sterilized with an autoclave at 121 °C for 15 min, and an overnight culture of the four strains was prepared by incubating it in a shaker at 37 °C and 150 rpm. After 16 h of incubation, each inoculum was fixed at an optical density (OD) of 0.1 at 620 nm, as bacterial immobilization is efficient between 0.9 and 0.1 OD, and a mixture of the fixed biofilm-producing bacteria with the same ratio (25% of each strain used) was prepared. The LB broth was prepared as a control, as described by Jamali et al. [31] and Wu et al. [35].
Measurement of attached biofilm on GAC
Certain techniques are used to characterize biofilm growth and measure the total amount of biofilm, such as CFU enumeration, observation of biofilm development using CLSM (confocal laser scanning microscopy), and dry weight measurements. In this study, the dry weight method was used to calculate the total cell biomass adhered to the GAC, and scanning electron microscopy (SEM) was also used to characterize the development of the biofilm and find the best immobilization time of the biofilm. First, the weight of the dry filter before the filtration was measured. The biofilm immobilized on the GAC was filtered through filter paper (Whatman #1, with a particle retention capacity of 11 μm), which was dried at 105 °C. After reweighing, it turned out that the weight of the filter with the biofilm was 0.028 g. The difference between these two numbers was used to calculate the dry weight of the bacterial cells. From there, a tea strainer with a small pore size (1 mm) was used to filter and measure the immobilized activated carbon. The GAC with the biofilm was transferred into a weighed aluminum dish, and it was dried at 105 °C in an oven for 2 h. The weight of the dried biomass (immobilized biofilm) was recorded after it was cooled in a desiccator. The weight of the biomass (immobilized biofilm) was based on the TSS method, as described by Jamali et al. [31] and Wu et al. [35].
Immobilization time determination by one-factor-at-a-time (OFAT)
Among the significant immobilization factors, there is a time when the immobilization of a biofilm producer is efficient. Therefore, different conditions of time and amount of GAC mass were used per experiment to find the optimum time and mass of GAC that could give the highest mass of biofilm. For that, the evolution of the attached biofilm amount was followed every 24 h for 3 days by adding 2 g of the prepared GAC into a 250 mL conical flask containing 100 mL of LB broth and 1 mL of inoculum fixed at 0.1 OD. The solution was incubated in a shaker where the temperature and rpm were set at 37 °C and 150 rpm, respectively. The best immobilization time was based on the highest weight of the immobilized biomass on the GAC recorded after 24 h, 48 h, and 72 h.
Scanning electron microscopy (SEM) for biofilm immobilization
It is important to observe the immobilization of biofilm-producing bacteria on GAC using microscopic methods (Fazil et al. [26]; Jamali et al. [31]). Several studies suggest the use of scanning electron microscopy to observe the characteristics of the biofilms on GAC, such as the morphology of biofilms immobilized on a GAC surface. For that, a SEM JEOL JSM-6300F, from a Japanese manufacturer (JEOL Ltd.), with a magnification range of 15× to 200,000× and a resolution of 5 nanometers was used to obtain various images of the biofilm with the colonized GAC. The sample was prepared prior to using the SEM machine, as described by Jamali et al. [31] and Gong et al. [36]. The morphologies, such as surface properties, pore structures of GAC, and matrix of the cells when immobilized for 24 h each over three days, were evaluated by SEM. The controls prepared with 3 g, 5 g, and 8 g of GAC with no biofilm-producing bacteria were incubated for 24, 48, and 72 h as well. Thus, a few masses of GAC were taken from 6 different tubes containing GAC with immobilized biofilm and without immobilized biofilm incubated at 24, 48, and 72 h. Thus, the preparation was composed of the following two steps: fixation and dehydration.
- Fixation: After the immobilization process, the GAC surfaces were taken and washed with distilled water in order to remove any unattached bacteria, and then the sample was transferred to an Eppendorf tube and 1 mL of (2.5%) glutaraldehyde was added in order to fix well the attached biofilm. The sample was stored at 4 °C overnight.
- Dehydration: The sample was collected and then dehydrated with a series of ethanol concentrations (30%, 50%, 70%, 80%, 90%, and 100%). The dehydration with 100% ethanol was repeated three times with ten min of retention for each time, while the other percentages were only performed once with ten minutes of retention.
- The control GAC without biofilm was prepared using the same procedure as the GAC with biofilm. The samples were scanned at different magnifications (1000 and 1500).
2.4.2. Optimization of GAC Mass and Inoculum Volume by Design of Experiment
Once the best immobilization time was found by OFAT, the design of experiment (DOE) was used to find the best condition of GAC mass and inoculum volume that could be used later for hydrolysis of the FW sludge. For that, another experiment with the same procedure for the immobilization time was conducted with runs considering three different volumes of inoculum ratios (1, 3, and 5 v/v) and three different masses of GAC (2 g, 5 g, and 8 g). Thus, the type of DOE used was the response surface method (RSM) using FCCCD in the full experiment, in which the mass of immobilized biomass is the response, as shown in Table 1. The inoculums of the considered volumes were transferred into flasks by adding different measured masses of the considered GAC. Then, the flask with the biofilm-producing bacteria and the mass of GAC were incubated in the shaker flask, where the temperature and agitation were set at 37 °C and 150 rpm, respectively. The incubation time was optimized based on the best immobilization time found in the first experiment.

Table 1.
Optimization conditions of biofilm immobilization on GAC.
After the best conditions of the immobilization process were found by choosing the highest formed biomass, the food waste hydrolysis experiment started with the addition of the active biofilm that had been formed onto the flask containing the food sample. The hydrolysis experiment was run for 5 days, and the analysis was performed every day. After finding the best time to achieve high amounts of immobilized biofilm on the surface using the OFAT optimization method, an experimental design by the FCCCD under the response surface methodology (RSM) method was used to evaluate the effects of GAC mass and inoculum volume on the immobilization process of the biofilm. FCCCD was principally used to find the highest biomass dry weight in mg/g of GAC that represents the weight of the attached biofilm on the surface in a more economical way. Thus, the parameters studied and the number of runs performed are presented in Table 2.
Table 2.
Experimental data of the selected parameters by FCCCD.
2.5. Pretreatment of Food Waste with Immobilized Biofilm
2.5.1. Hydrolysis Process
The process of hydrolysis assists in the biodegradation of organic macromolecules into smaller components, which, consequently, can be used by acidogenic bacteria and facilitate the methanogenesis step. However, it has been mentioned earlier that hydrolysis remains a rate-limiting step in the biological processes of anaerobic digestion. To overcome this rate limit, FW hydrolysis was investigated using immobilized biofilm in a hydrolysis reactor and analyzing the hydrolysis reactor parameters, including total solids (TSs), volatile solids (VSs), total oxygen chemical demand (TCOD), and soluble COD. This is because biofilms segregate enzymes that are able to convert carbohydrates, lipids, and protein into sugar, long-chain fatty acids, and amino acids, respectively, as explained by Li et al. [37]. After enzymatic cleavage, the products of hydrolysis are able to diffuse through the cell membranes of acidogenic microorganisms and facilitate the biodegradation of OCs. Therefore, it is important to add enzymes that can enhance hydrolysis and facilitate the degradation of complex carbohydrates. In this study, the effect of the biofilm amounts and biodegradation time on the hydrolysis of FW was examined to estimate the feasibility of using biofilm in the hydrolysis process for the pretreatment of food waste and find the optimum amount of biofilm and biodegradation time for the hydrolysis process. For that, the biofilm was immobilized on a GAC surface for two days of incubation, and the hydrolysis was started after the biofilm was immobilized by adding active GAC with the immobilized biofilm into 100 mL of the prepared FW sludge in a flask of 100 mL, as described by Kiran et al. [38]. The amount of GAC mass and the volume of inoculum added were based on the highest weight of biomass found as the best condition in the immobilization process.
2.5.2. Hydrolysis Activity Study by OFAT
The efficiency of the hydrolysis process was assessed by measuring and comparing the total COD and soluble COD over time, as well as the TSs, TVSs, and dissolved solids (TDSs). Time is another important parameter for hydrolysis, which represents the period in which the collected FW with immobilized biofilm has been hydrolyzed. The effect of biofilm amount was studied to find out the optimum amount of biofilm and the optimum time that can give the best conditions for hydrolysis of the collected food waste. For that, the following amounts of biofilm were attached to different masses on the GAC were used: 328 mg, 492 mg, 656 mg, 820 mg, and 984 mg of biofilm. For each gram of GAC, the TSs and VSs were measured every day for five days, and the changes are represented in Figure 1a,b, respectively.
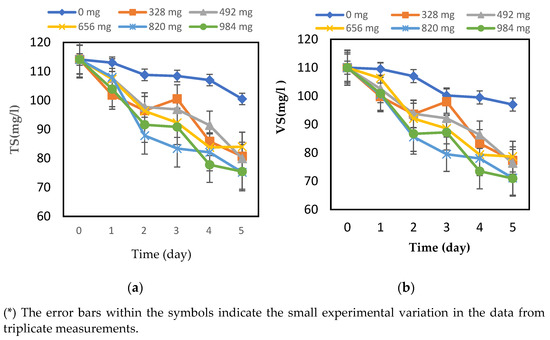
Figure 1.
Changes in (a) TSs and (b) VSs of food waste hydrolysis with different amounts of biofilm and digestion times at T = 35 ± 2 °C.
2.6. Statistical Analysis
All of the experiments were performed at least three times, and the results were provided as means with 95% uncertainties (Student test). The statistical analysis program XLSTAT was used to perform the statistical calculations. The Design Expert software (version 11.1.2.0) was used to model, optimize the data, and conduct statistical design experimental runs.
3. Results and Discussion
3.1. Characteristics of Solid and Sludge Food Waste
The prepared sludge and the original FW collected were analyzed to characterize the considered food waste and show the quality of using food waste as a good substrate for anaerobic digestion. The TSs, VSs, TDS, MC, TCOD, sCOD, and pH were analyzed. The results of these analyses are presented in Table 3. The average total solid (TS) content was 36.7% (17.2 g/L) in the original waste and around 10% (14.1 gL−1) in the diluted sample (sludge), which shows that the collected FW was a high solid waste and dilution is essential to perform anaerobic digestion, as reported by Wichitsathian et al. [39].
Table 3.
Characteristics of the collected food waste.
From the analysis, it can be seen that the collected FW has a high moisture content with about 72.5% of water, and this shows the difficulty of FW treatments with incineration, landfilling, and aerobic compost. As a result, AD is a good approach for this type of restaurant FW that contains a higher moisture content. Furthermore, the prepared sludge has a VS/TS value greater than 90% (0.99), which shows a high fraction of OCs, which is considered to be suitable for AD as it favors anaerobic conversion, as reported by Nagao et al. [40]. The total COD in the food sludge was 83,550.0 mg/L, and the soluble COD was 6890 mg/L. From the high quantity of TCOD, it is observable that the FW has high amounts of carbon that need to be oxidized by oxygen to convert them into carbon dioxide. The soluble to total COD ratio of the waste is indeed low and indicates that the FW has a lot of polymeric material that needs to be hydrolyzed/solubilized to be converted to biogas. The pH of the prepared FW was very low due to the considerable amount of acidified or stored food residues and the degradation of volatile fatty acids, as reported by Hallaji et al. [41].
3.2. Immobilization of Biofilm Producer on GAC
3.2.1. Determination of Best Time of Bacteria Immobilization by One-Factor-at-a-Time (OFAT) Method
The cell biomass adhered to the GAC was measured to quantify the total solids (TSs) to ensure that all bacteria grown on the surface were removed and to measure the biofilm attached to the surface (Figure 2). From the changes in the TS content, which is the biomass weight measurement, the considered shaking times (24 h, 48 h, and 72 h) have different amounts of biofilm attached to the GAC. A total of 10 mgg−1 of biofilm was attached after shaking the immobilization solution for 24 h; 72 mg/g of biofilm was immobilized on the GAC carrier after 48 h; 38 mgg−1 of biomass was formed after 72 h of shaking. According to Jamali et al. [31], the biomass weight differences are due to the mechanical stability of the biofilms produced on the activated carbon at different shaking times, which promotes microbial adhesion. From the time variations, at 48 h of incubation, there was a significant increase in the weight of the biomass produced, from 10 mgg−1 of GAC to 72 mg/g of GAC. A high peak is observed, representing a high number of bacteria attached to the GAC carrier and forming a potential biofilm. After 72 h, the weight of the biomass decreased sharply, reaching 38 mgg−1 of GAC due to the detachment of the bacteria from the GAC surface when incubated for 72 h. Based on the observations from the results, day 2 (48 h) of incubation was chosen as the best time for the immobilization of the biofilm.
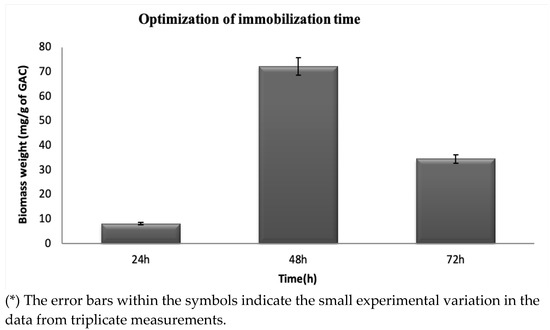
Figure 2.
Effect of time on the immobilization of biofilm-producing bacteria at a temperature of 37 °C, 150 rpm, and pH of 7.
Nie et al. [42] have examined the immobilization time in biofilm immobilization studies on the supporting materials corncob, PUF, and wood chips and found that the best incubation time of the immobilization solution was within the range of 48 to 54 h. The different masses of the considered supporting materials in their study were as follows: 0.3, 0.5, 0.8, 1 g, and 1.2 g with 100 mL of immobilization medium. They noticed that the greater amount of immobilized biomass on the supporting materials corresponds to 0.1 OD at a wavelength of 600 nm. From the above results, it is observable that the formation of biofilm on the surface of the GAC had successfully developed, and the surface porosity of the GAC eased the attachment and formation of a stable biofilm.
3.2.2. Immobilized Biofilm Characterization by Scanning Electron Microscopy (SEM)
The images from SEM are shown in Figure 3. The images were taken with different magnifications (×1000 and ×1500), but in order to see the pore structures clearly and the surfaces of the activated carbon after the biofilm formation, a magnification of 1500 was used. The GAC pores in Figure 3A,C,E are showing developing biofilm microcolony formations on the GAC, but the shapes of the bacteria were difficult to distinguish because the bacterial cells were covered with a layer of EPS. However, the pores of the GAC controls (images B, D, and F) were not shaded; thus, the pores were observable and the surfaces of activated carbon were uncovered. The occupation was high on image C, and the pores were covered almost completely compared to the control (D), which had big, uncovered pores. Image C (incubation at 48 h) was the one that showed a high biomass weight when the biomass weight was calculated. Therefore, the colonization of the biofilms on the GAC surface was very low at 24 h and moderate at 72 h of incubation. SEM has led to the conclusion that the development of microcolonies clearly occurred on the second and third days of culture compared to the first day. Therefore, the colonization of the biofilms on the GAC surface was very low at 24 h and moderate at 72 h of incubation. This is because the biofilm is formed on the carrier for a maximum concentration with a certain reaction time and a maximum immobilization capacity, and after that it may reduce due to limiting growth and growth inhibition in the cultures. Therefore, on day 3, the biofilm was reduced.
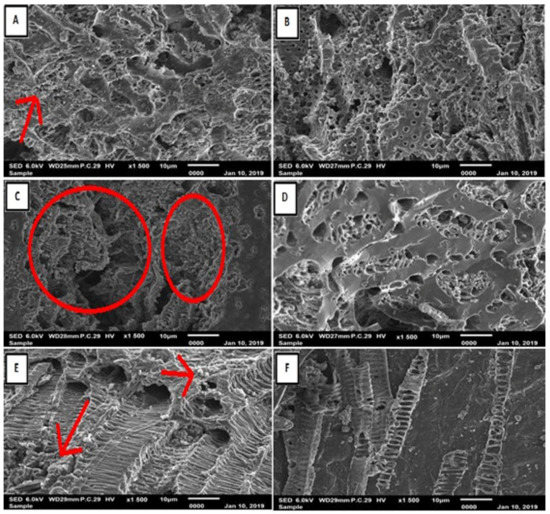
Figure 3.
SEM images of a developing biofilm on GAC; (A) biofilm at 24 h and (B) no biofilm at 24 h; (C) biofilm at 48 h and (D) no biofilm at 48 h; (E) biofilm at 72 h and (F) no biofilm at 72 h with T = 37 °C; Bouh et al. [43].
Gibert et al. [44] studied the characteristics of biofilm development on granular activated carbon used for drinking water production and noticed that a SEM study showed an abundant growth of biofilms in craters and sheltered areas on the GAC surface. Johnravindar et al. [45] supplemented granular activated carbon for enhanced methane production in anaerobic co-digestion of post-consumer substrates and demonstrated that the supplementation of GAC is an efficient method for the enhancement of biogas production from post-consumer wastes. Using scanning electron microscopy, they noticed the formation of biofilms with the supplementation of GAC. Therefore, their results elucidate that GAC evidently enriched the hydrolysis and acetogenesis activities. It also enhanced the electron transfer efficiency for methanogenesis, which significantly improved the production of methane.
3.3. Determination of Optimum GAC Mass and Inoculum Volume by Face-Centered Central Composite Design (FCCCD)
Thirteen experimental runs were generated, where the highest biomass dry weight observed was 82 mgg−1 and the lowest biomass dry weight was 15 mgg−1, which shows the wider variation of the responses on the evaluation of the experimental conditions. The quadratic polynomial equation was applied to provide the relationship between the immobilized biofilm and the biomass dry weight in mg/g of GAC and the inoculum volume, as shown in the following equation:
where A and B are the factors considered, the mass of GAC and the inoculum volume, respectively. This equation, which is written in terms of coded factors, can be used to predict the responses for different levels of each factor. By default, the high levels of the factors are coded as +1, and the low levels of the factors are coded as −1. The coded equation is useful for identifying the relative impact of the factors by comparing the factor coefficients. An analysis of variance (ANOVA) was used to check the efficiency of the quadratic model used, and the result of the ANOVA is shown in Table 4. The model’s F-value of 16.43 implies that the model is significant. There is only a 0.10% chance that an F-value this large could occur due to noise. The values of “Prob > F” of less than 0.0500 indicate that the model terms are significant. In this case, A and A2 are significant model terms. Values greater than 0.1000 indicate that the model terms are not significant, but this model was significant, and there was no need to subject it to R-squared evaluation or use model reduction for the improvement of the model. The “Adeq Precision” is used to measure the signal-to-noise ratio, with a desired ratio greater than 4. For this model, the ratio was 7.521, which indicated an adequate signal. This model can be used to navigate the design space. Moreover, the correlation between the experiment data and the predicted value is considered better when the value of the coefficient of determination (R2) is close to one. In the considered model, the R2 and adjusted R2 were 0.93 and 0.87, respectively, which shows a high degree of correlation between the actual and predicted values, and this model can explain the experimental variability. Additionally, adequate precision was used for the measurement of the signal-to-noise ratio, which indicates the quality of the model with a value greater than 4. In this model, the ratio was 12.07, which revealed that this model can be used to navigate the design space. To investigate the effects of inoculum volume and mass of GAC on the immobilization of the biofilm-producing bacteria, a 3D response plot (a) and a surface contour plot were plotted, as depicted in Figure 4. Based on these graphs, the more the mass of the GAC increases, the more the dry weight of the biomass increases, which explains why the biofilm found more surface to attach itself to when the mass of the GAC improved. The maximum biomass dry weight of 82 mg/g GAC was achieved at 8 g of GAC, which is the highest graph considered in this experiment. On the other hand, the volume of the biofilm-producing bacteria inoculum does not have much effect on the biofilm, as the value of the biomass dry weight is quite similar when the inoculum volume is 1 mL and when it is 5 mL. Therefore, the graphs represent that the mass of GAC is shown to have a significant effect on the immobilization of the biofilm compared to the volume of the biofilm-producing bacteria inoculum. Moreover, it was noticed that if the mass of GAC increased, the biomass dry weight could increase, resulting in a higher biofilm attachment when there is more surface to immobilize on.
Biomass dry weight = + 46.82489 − 12.45547 ∗ A − 9.91526 ∗ B − 1.37417 ∗ A ∗ B + 2.56502 ∗ A2 + 2.25629 ∗ B2
Table 4.
ANOVA for immobilization optimization by FCCCD.
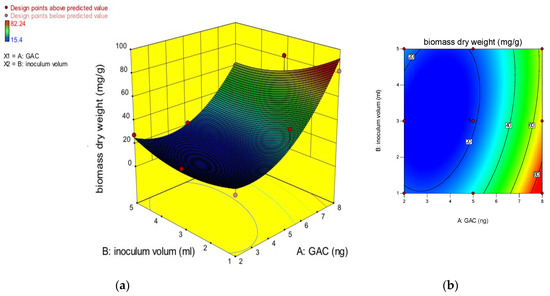
Figure 4.
3D response surface curve (a) and contour plot of the interaction (b) effect between inoculum volumes and GAC masses.
3.4. Pretreatment of Food Waste with Immobilized Biofilm
3.4.1. Changes in Total Solids and Volatile Solids
Based on Figure 1a, the TS content was initially 114.1 g/L before the digestion of each flask containing a different amount of biofilm, and after the digestion on day 5, it decreased to 100.5 g/L, 80.7 g/L, 80.0 g/L, 84.0 g/L, 75.2 g/L, and 75.5 g/L for the 328 mg, 492 mg, 656 mg, 820 mg, and 984 mg of the biofilm amounts, respectively. From Figure 2, the VS content was 110 g/L before the hydrolysis, and it was decreased to 105.6 g/L, 77.3 g/L, 76.3 g/L, 71.1 g/L, and 71.0 g/L for the 328 mg, 492 mg, 656 mg, 820 mg, and 984 mg of the biofilm amounts, respectively, during the considered period. Therefore, Deepanraj et al. [46] studied the influence of TS concentration of food waste on biogas production in an anaerobic batch digester by considering different TS concentrations of the FW. The characteristics of the FW used were determined before and after the digestion. For the substrate with a TS content of 12.5% (125 g/L) and a VS content of 119.5 g/L before digestion, the TS and VS contents were found to have decreased to 94.2 g/L and 83.78 g/L, respectively. For the FW with a TS concentration of 100 g/L and a VS concentration of 95.4 g/L, the TS and VS concentrations were reduced to 68.13 g/L and 59.64 g/L, respectively. As a result, the biofilms have tried to increase the degradation of organic compounds based on the TS and VS concentrations. Concerning the optimum amount of biofilm, it is observed that the biofilm amount had no effect on the organic compounds as the different amounts of biofilm gave TS and VS values that were close to each other. This means that even small amounts of biofilm can help to degrade organic compounds and improve the hydrolysis of FW. On the other hand, a control with 0 mg of biofilm, which means FW with no attached biofilm, was also studied to see the effect of the biofilm on FW hydrolysis. From the TS and VS values of the control, it is obvious that there was no decrease and no degradation of OCs in the hydrolysis.
In addition, in their preliminary work, Yavini et al. [47] and Orhorhoro et al. [48] have figured out that the increase in the TS value brings about a drop in the water volume, which consequently reduces the level of microbial activity and, thus, decreases the biogas yield. Orhorhoro et al. [48] concluded that the biogas production was reduced due to the increase in the percentage of the total solids above.
3.4.2. Changes in Total Chemical Oxygen Demand
In this study, the COD content was used to determine the disintegration degree of the organic matters in hydrolysis and methanogenesis reactors to follow the evolution of organic compounds in the hydrolysis flasks over time. The values of COD can help determine how many organic compounds exist in AD. This study attempts to reduce the concentration of TCOD in the hydrolysis and methanogenesis reactors using immobilized biofilm. Examining the TCOD can help the TCOD result, as represented in Figure 5, for the considered amounts of biofilm and times. From the results, the TCOD of each flask (328 mg, 492 mg, 656 mg, 820 mg, and 984 mg) has decreased from day 1 to day 5. There was a sharp decrease from day 0 to day 1, but from day 1 to day 5, the decrease was moderately stable. The TCOD was found to be decreasing due to the degradation of organic matter, and this shows the effect of the biofilm on the degradation of the organic compounds by FW hydrolysis. However, the TCOD of the control decreased very slightly over time, while the TCOD of the first was almost similar throughout the remaining days. This slight decline shows that the food waste was hydrolyzed, but the degradation of the organic compounds was not significant as the control flask was devoid of biofilm. Additionally, the differences between the control flask and other controls have illustrated the effect of biofilm on the hydrolysis of FW. Hence, the differences in the TCOD between the biofilm amounts were not very significant, but the TCOD of 328 mg was the smallest compared to the other biofilm amounts. This can indicate that the biofilm attached to the 328 mg has more degraded organic matter from the food waste in the hydrolysis process, and 328 mg can be chosen as the optimum biofilm amount. It is also economically advantageous to use a reasonable amount of carrier (GAC) compared to the biofilm amounts of 820 mg or 984 mg. The observation of the maximum COD reduction at 328 mg can be explained by the availability of the surface GAC area. The surface porosity of the GAC eased the sludge’s attachment to the carrier surface and the removal of the TCOD from the flask. Additionally, to observe the optimum time for the organic compounds to be degraded by the biofilm, the soluble SCOD was also measured by the OFAT process, where 328 mg of biofilm were chosen as the optimum biofilm amount based on the TCOD analysis. Fung et al. [49] have noticed that the biodegradability of FW was characterized by a decrease in the TCOD value, as found in this experiment.
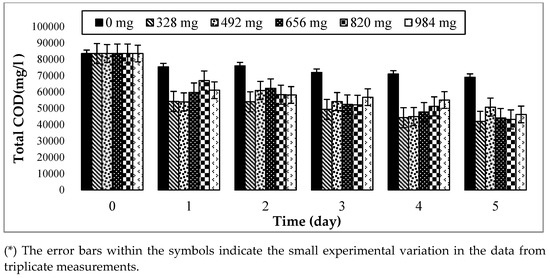
Figure 5.
Changes in the total COD of food waste hydrolysis with different amounts of biofilm and digestion times at T = 35 ± 2 °C and 150 rpm.
3.4.3. Changes in Soluble COD of One-Factor-at-a-Time
For a more detailed explanation of the digestion of organic compounds in a biological pretreatment, it has also become crucial to assess the soluble COD. As a result, the soluble COD was evaluated, and Figure 6 shows the variations. The data show that the SCOD increased with time, including in the control (hydrolyzed without an immobilized biofilm), indicating that the solubilization was not specifically related to the pretreatment. In terms of hydrolysis time, day 3 had the most solubilized organic waste. The highest degradation of organic matter corresponds to the highest soluble portion of the COD, according to Donoso-Bravo et al. [50]. From day 0 to day 3, the soluble COD increased, and from day 3 to day 5, it significantly dropped. The SCOD change graph makes it obvious that day three is the best day to hydrolyze food waste and that the prolonged hydrolysis time may have been caused by the high polymer and organic matter contents of the collected food waste. It is important to note that the rate of organic compound decomposition increases as the COD becomes more soluble and the TCOD decreases.
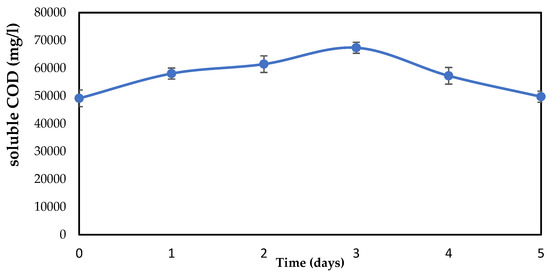
Figure 6.
Soluble chemical oxygen demand (sCOD) content during food waste hydrolysis by one-factor-at-a-time.
4. Conclusions
The findings of this study revealed the importance of using immobilized biofilm in the hydrolysis pretreatment of FW and showed the opportunity of using anaerobic digestion-mediated biofilms. The results revealed that the best immobilization time of the biofilm-producing bacteria was at 48 h of incubation based on the OFAT method, and the optimum mass of GAC was 8 g and 1 mL for inoculum volume based on the FCCCD method. The evaluation of some quantitative parameters, such as TSs, VSs, TDS, TCOD, and SCOD, was examined by OFAT to find the optimum biofilm amount and time for hydrolysis. From the analysis of these parameters, it was obvious that the biofilm has helped to increase the biodegradation of the organic compounds contained in the food waste. This was demonstrated by the fact that the TS, VS, and TCOD contents decreased, as did the SCOD. From these experiments, the biodegradation was maximal at the biofilm amount of 328 mg and on day 3. Therefore, this research provides a sustainable approach for the biodegradation of organic matter by the action of biofilm-producing bacteria. This case study can provide essential information for industrial, academic, and municipal entities that are interested in a significant pretreatment method for food waste for the production of biogas. Further studies on the anaerobic digestion of food waste hydrolyzed with immobilized biofilm are recommended.
Author Contributions
Conceptualization, F.M.A.-L.; Methodology, A.M.A., M.A.Z. and M.S.J.; Software, A.M.A., M.A.Z. and M.S.J.; Validation, J.M.; Formal analysis, A.M.A. and M.S.J.; Investigation, F.M.A.-L.; Resources, F.M.A.-L.; Data curation, A.M.A., M.A.Z. and M.S.J.; Writing—original draft, A.M.A.; Writing—review & editing, F.M.A.-L. and T.A.; Visualization, M.A.Z., J.M. and T.A.; Supervision, F.M.A.-L.; Funding acquisition, F.M.A.-L. All authors have read and agreed to the published version of the manuscript.
Funding
This research received no external funding.
Data Availability Statement
Data is contained within the article.
Conflicts of Interest
The authors declare no conflict of interest.
List of Abbreviations
| MSW | Municipal Solid Waste |
| FW | Food Waste |
| AD | Anaerobic Digestion |
| POME | Palm Oil Mill Effluent |
| GAC | Granular Activated Carbon |
| TCOD | Total Chemical Organic Demand |
| sCOD | Soluble Chemical Organic Demand |
| TS | Total Solid |
| TVS | Total Volatile Solid |
| SEM | Scanning Electron Microscopic |
| OFAT | One factor-at-a-time |
| ANNOVA | Analysis of Variance |
References
- Jung, S.; Shetti, N.P.; Reddy, K.R.; Nadagouda, M.N.; Park, Y.K.; Aminabhavi, T.M.; Kwon, E.E. Synthesis of different biofuels from livestock waste materials and their potential as sustainable feedstocks—A review. Energy Convers. Manag. 2021, 236, 114038. [Google Scholar] [CrossRef]
- Tian, H.; Wang, X.; Lim, E.Y.; Lee, J.T.; Ee, A.W.; Zhang, J.; Tong, Y.W. Life cycle assessment of food waste to energy and resources: Centralized and decentralized anaerobic digestion with different downstream biogas utilization. Renew. Sustain. Energy Rev. 2021, 150, 111489. [Google Scholar] [CrossRef]
- Edwiges, T.; Frare, L.; Mayer, B.; Lins, L.; Mi Triolo, J.; Flotats, X.; de Mendonça Costa, M.S.S. Influence of chemical composition on biochemical methane potential of fruit and vegetable waste. Waste Manag. 2018, 71, 618–625. [Google Scholar] [CrossRef] [PubMed]
- Ferdeș, M.; Zăbavă, B.Ș.; Paraschiv, G.; Ionescu, M.; Dincă, M.N.; Moiceanu, G. Food Waste Management for Biogas Production in the Context of Sustainable Development. Energies 2022, 15, 6268. [Google Scholar] [CrossRef]
- Salama, W.; Abdelsalam, E. Impact of hotel guests’ trends to recycle food waste to obtain bioenergy. Sustainability 2021, 13, 3094. [Google Scholar] [CrossRef]
- Slorach, P.C.; Jeswani, H.K.; Cuéllar-Franca, R.; Azapagic, A. Environmental sustainability of anaerobic digestion of household food waste. J. Environ. Manag. 2019, 236, 798–814. [Google Scholar] [CrossRef]
- Zhang, H.; Liu, G.; Xue, L.; Zuo, J.; Chen, T.; Vuppaladadiyam, A.; Duan, H. Anaerobic digestion based waste-to-energy technologies can halve the climate impact of China’s fast-growing food waste by 2040. J. Clean. Prod. 2020, 277, 123490. [Google Scholar] [CrossRef]
- Heiker, M.; Kraume, M.; Mertins, A.; Wawer, T.; Rosenberger, S. Biogas plants in renewable energy systems—A systematic review of modeling approaches of biogas production. Appl. Sci. 2021, 11, 3361. [Google Scholar] [CrossRef]
- Angelidaki, I.; Treu, L.; Tsapekos, P.; Luo, G.; Campanaro, S.; Wenzel, H.; Kougias, P.G. Biogas upgrading and utilization: Current status and perspectives. Biotechnol. Adv. 2018, 36, 452–466. [Google Scholar] [CrossRef]
- Gao, Y.; Jiang, J.; Meng, Y.; Yan, F.; Aihemaiti, A. A review of recent developments in hydrogen production via biogas dry reforming. Energy Convers. Manag. 2018, 171, 133–155. [Google Scholar] [CrossRef]
- Jung, S.; Lee, J.; Moon, D.H.; Kim, K.H.; Kwon, E.E. Upgrading biogas into syngas through dry reforming. Renew. Sustain. Energy Rev. 2021, 143, 110949. [Google Scholar] [CrossRef]
- Charisiou, N.D.; Siakavelas, G.; Papageridis, K.N.; Baklavaridis, A.; Tzounis, L.; Avraam, D.G.; Goula, M.A. Syngas production via the biogas dry reforming reaction over nickel supported on modified with CeO2 and/or La2O3 alumina catalysts. J. Nat. Gas Sci. Eng. 2016, 31, 164–183. [Google Scholar] [CrossRef]
- Khadka, A.; Parajuli, A.; Dangol, S.; Thapa, B.; Sapkota, L.; Carmona-Martínez, A.A.; Ghimire, A. Effect of the substrate to inoculum ratios on the kinetics of biogas production during the mesophilic anaerobic digestion of food waste. Energies 2022, 15, 834. [Google Scholar] [CrossRef]
- Obileke, K.; Nwokolo, N.; Makaka, G.; Mukumba, P.; Onyeaka, H. Anaerobic digestion: Technology for biogas production as a source of renewable energy—A review. Energy Environ. 2021, 32, 191–225. [Google Scholar] [CrossRef]
- Jung, S.; Shetti, N.P.; Reddy, K.R.; Nadagouda, M.N.; Park, Y.K.; Aminabhavi, T.M.; Kwon, E.E. Current technologies of biochemical conversion of food waste into biogas production: A review. Fuel 2022, 323, 124321. [Google Scholar]
- Liu, J.; Zhao, M.; Lv, C.; Yue, P. The effect of microwave pretreatment on anaerobic co-digestion of sludge and food waste: Performance, kinetics and energy recovery. Environ. Res. 2020, 189, 109856. [Google Scholar] [CrossRef]
- Caroca, E.; Serrano, A.; Borja, R.; Jiménez, A.; Carvajal, A.; Braga, A.F.; Fermoso, F.G. Influence of phenols and furans released during thermal pretreatment of olive mill solid waste on its anaerobic digestion. Waste Manag. 2021, 120, 202–208. [Google Scholar] [CrossRef]
- Veluchamy, C.; Kalamdhad, A.S. Influence of pretreatment techniques on anaerobic digestion of pulp and paper mill sludge: A review. Bioresour. Technol. 2017, 245, 1206–1219. [Google Scholar] [CrossRef]
- Carrere, H.; Antonopoulou, G.; Affes, R.; Passos, F.; Battimelli, A.; Lyberatos, G.; Ferrer, I. Review of feedstock pretreatment strategies for improved anaerobic digestion: From lab-scale research to full-scale application. Bioresour. Technol. 2016, 199, 386–397. [Google Scholar] [CrossRef]
- Karagiannidis, A.; Perkoulidis, G. A multi-criteria ranking of different technologies for the anaerobic digestion for energy recovery of the organic fraction of municipal solid wastes. Bioresour. Technol. 2009, 100, 2355–2360. [Google Scholar] [CrossRef]
- Langer, S.; Schropp, D.; Bengelsdorf, F.R.; Othman, M.; Kazda, M. Dynamics of biofilm formation during anaerobic digestion of organic waste. Anaerobe 2014, 29, 44–51. [Google Scholar] [CrossRef] [PubMed]
- Mehdaoui, I.; Majbar, Z.; Atemni, I.; Elhaji, M.; Abbou, M.B.; Jennan, S.; Rais, Z. Agronomic valorization of the composts with olive waste. Mor. J. Chem. 2022, 10, 606–621. [Google Scholar]
- Alam, M.Z.; Hanid, N.A. Development of Indigenous biofilm for enhanced biogas production from palm oil mill effluent. J. Adv. Res. Fluid Mech. Therm. Sci. 2017, 39, 1–8. [Google Scholar]
- Mehdaoui, I.; Majbar, Z.; Atemni, I.; Jennan, S.; Ainane, T.; Gaga, Y.; Chetouani, A. What effects does an organic amendment to olive waste have on the soil and crop yield? Mor. J. Chem. 2021, 9. [Google Scholar] [CrossRef]
- Karadag, D.; Köroğlu, O.E.; Ozkaya, B.; Cakmakci, M. A review on anaerobic biofilm reactors for the treatment of dairy industry wastewater. Process Biochem. 2015, 50, 262–271. [Google Scholar] [CrossRef]
- Fazil, N.A.; Alam, M.Z.; Azmi, A.S.; Mansor, M.F. Isolation and screening of bacteria with biofilm formation ability and characterization with hydrolytic enzyme production for enhanced biogas production. Malays. J. Microbiol. 2018, 96–101. [Google Scholar]
- Yadav, D.; Barbora, L.; Rangan, L.; Mahanta, P. Tea waste and food waste as a potential feedstock for biogas production. Environ. Prog. Sustain. Energy 2016, 35, 1247–1253. [Google Scholar] [CrossRef]
- Zhang, B.; Zhang, L.L.; Zhang, S.C.; Shi, H.Z.; Cai, W.M. The influence of pH on hydrolysis and acidogenesis of kitchen wastes in two-phase anaerobic digestion. Environ. Technol. 2005, 26, 329–340. [Google Scholar] [CrossRef]
- Ikpe, A.E.; Imonitie, D.I.; Ndon, A.I.E. Investigation of biogas energy derivation from anaerobic digestion of different local food wastes in Nigeria. Acad. Platform J. Eng. Sci. 2019, 7, 332–340. [Google Scholar]
- Ahmadi, M.; Teymouri, P.; Ghalebi, M.; Jaafarzadeh, N.; Alavi, N.; Askari, A.; Foladivanda, M. Sludge characterization of an industrial water treatment plant, Iran. Desalin. Water Treat. 2014, 52, 5306–5316. [Google Scholar] [CrossRef]
- Jamali, N.S.; Jahim, J.M.; Isahak, W.N.R.W. Biofilm formation on granular activated carbon in xylose and glucose mixture for thermophilic biohydrogen production. Int. J. Hydrogen Energy 2016, 41, 21617–21627. [Google Scholar] [CrossRef]
- El-Mashad, H.M.; Zhang, R. Biogas production from co-digestion of dairy manure and food waste. Bioresour. Technol. 2010, 101, 4021–4028. [Google Scholar] [CrossRef]
- Abbassi-Guendouz, A.; Brockmann, D.; Trably, E.; Dumas, C.; Delgenès, J.P.; Steyer, J.P.; Escudié, R. Total solids content drives high solid anaerobic digestion via mass transfer limitation. Bioresour. Technol. 2012, 111, 55–61. [Google Scholar] [CrossRef]
- APHA/AWWA/WEF. Standard Methods for the Examination of Water and Wastewater. Std. Methods. 2012, 10, 541. [Google Scholar]
- Wu, T.; Fu, G.Y.; Sabula, M.; Brown, T. Bacterial community in the biofilm of granular activated carbon (GAC) PreBiofilter in bench-scale pilot plants for surface water pretreatment. World J. Microbiol. Biotechnol. 2014, 30, 3251–3262. [Google Scholar] [CrossRef]
- Gong, W.J.; Liang, H.; Li, W.Z.; Wang, Z.Z. Selection and evaluation of biofilm carrier in anaerobic digestion treatment of cattle manure. Energy 2011, 36, 3572–3578. [Google Scholar] [CrossRef]
- Li, S.M.; Jia, N.; Ma, M.G.; Zhang, Z.; Liu, Q.H.; Sun, R.C. Cellulose–silver nanocomposites: Microwave-assisted synthesis, characterization, their thermal stability, and antimicrobial property. Carbohydr. Polym. 2011, 86, 441–447. [Google Scholar] [CrossRef]
- Kiran, E.U.; Trzcinski, A.P.; Liu, Y. Enhancing the hydrolysis and methane production potential of mixed food waste by an effective enzymatic pretreatment. Bioresour. Technol. 2015, 183, 47–52. [Google Scholar] [CrossRef]
- Wichitsathian, B.; Yimrattanabavorn, J.; Wonglertarak, W. Enhancement of biogas production from pineapple waste by acid-alkaline pretreatment. IOP Conf. Ser. Earth Environ. Sci. 2020, 471, 012005. [Google Scholar] [CrossRef]
- Nagao, N.; Tajima, N.; Kawai, M.; Niwa, C.; Kurosawa, N.; Matsuyama, T.; Toda, T. Maximum organic loading rate for the single-stage wet anaerobic digestion of food waste. Bioresour. Technol. 2012, 118, 210–218. [Google Scholar] [CrossRef]
- Hallaji, S.M.; Kuroshkarim, M.; Moussavi, S.P. Enhancing methane production using anaerobic co-digestion of waste activated sludge with combined fruit waste and cheese whey. BMC Biotechnol. 2019, 19, 19. [Google Scholar] [CrossRef]
- Nie, M.; Nie, H.; He, M.; Lin, Y.; Wang, L.; Jin, P.; Zhang, S. Immobilization of biofilms of Pseudomonas aeruginosa NY3 and their application in the removal of hydrocarbons from highly concentrated oil-containing wastewater on the laboratory scale. J. Environ. Manag. 2016, 173, 34–40. [Google Scholar] [CrossRef] [PubMed]
- Bouh, I.G.; Alam, M.Z.; Kabbashi, N.A.; Ali, A.M. Enhancement of Biogas Production from Sewage Sludge by Biofilm Pretreatment Method. J. Adv. Res. Fluid Mech. Therm. Sci. 2019, 57, 141–147. [Google Scholar]
- Gibert, O.; Lefèvre, B.; Fernández, M.; Bernat, X.; Paraira, M.; Calderer, M.; Martínez-Lladó, X. Characterising biofilm development on granular activated carbon used for drinking water production. Water Res. 2013, 47, 1101–1110. [Google Scholar] [CrossRef] [PubMed]
- Johnravindar, D.; Liang, B.; Fu, R.; Luo, G.; Meruvu, H.; Yang, S.; Fei, Q. Supplementing granular activated carbon for enhanced methane production in anaerobic co-digestion of post-consumer substrates. Biomass Bioenergy 2020, 136, 105543. [Google Scholar] [CrossRef]
- Deepanraj, B.; Sivasubramanian, V.; Jayaraj, S. Multi-response optimization of process parameters in biogas production from food waste using Taguchi–Grey relational analysis. Energy Convers. Manag. 2017, 141, 429–438. [Google Scholar] [CrossRef]
- Yavini, T.D.; Chia, A.I.; John, A. Evaluation of the effect of total solids concentration on biogas yields of agricultural wastes. Int. Res. J. Environ. Sci. 2014, 3, 70–75. [Google Scholar]
- Orhorhoro, E.K.; Ebunilo, P.O.; Sadjere, G.E. Experimental determination of effect of total solid (TS) and volatile solid (VS) on biogas yield. Am. J. Mod. Energy 2017, 3, 131–135. [Google Scholar] [CrossRef]
- Fung, A.H.Y.; Rao, S.; Ngan, W.Y.; Sekoai, P.T.; Touyon, L.; Ho, T.M.; Habimana, O. Exploring the optimization of aerobic food waste digestion efficiency through the engineering of functional biofilm Bio-carriers. Bioresour. Technol. 2021, 341, 125869. [Google Scholar] [CrossRef]
- Donoso-Bravo, A.; Carballa, M.; Ruiz-Filippi, G.; Chamy, R. Treatment of low strength sewage with high suspended organic matter content in an anaerobic sequencing batch reactor and modeling application. Electron. J. Biotechnol. 2009, 12, 13–14. [Google Scholar] [CrossRef]


Disclaimer/Publisher’s Note: The statements, opinions and data contained in all publications are solely those of the individual author(s) and contributor(s) and not of MDPI and/or the editor(s). MDPI and/or the editor(s) disclaim responsibility for any injury to people or property resulting from any ideas, methods, instructions or products referred to in the content. |
© 2023 by the authors. Licensee MDPI, Basel, Switzerland. This article is an open access article distributed under the terms and conditions of the Creative Commons Attribution (CC BY) license (https://creativecommons.org/licenses/by/4.0/).