Article

Research Assessment on the Supply and Demand for Forest Ecosystem Services: The Case of Zhuxi County

1
Faculty of Geographical Science, Beijing Normal University, Beijing 100875, China
2
School of Economics & Management, Beijing Forestry University, Beijing 100083, China
3
Guangdong Forestry Survey and Planning Institute, Guangzhou 510520, China
*
Author to whom correspondence should be addressed.
Sustainability 2023, 15(4), 3184; https://doi.org/10.3390/su15043184
Submission received: 19 November 2022 / Revised: 19 January 2023 / Accepted: 1 February 2023 / Published: 9 February 2023
(This article belongs to the Section Sustainable Forestry)

Abstract

:
A refined assessment of small-scale to medium-scale forest ecosystem services based on the unique geographical conditions of Zhuxi County provides a basis for decision-making to create a regional green development strategy for the county. The specifications for assessing forest ecosystem services (GB/T38582-2020) were followed to calculate the supply of forest ecosystem services in Zhuxi County using the physical quantity method and the value quantity method, and the demand was calculated using the standard value comparison method. The total supply value of forest ecosystem services in 2020 in Zhuxi County was 35,677,894,500 yuan · a 1 . In terms of the value of each service, the value of water containment was the largest, accounting for 41.08%, and the value of forest recreation was the smallest, accounting for only 1.36%. The value per unit area of the local broadleaf–mixed forest in Zhuxi County was the largest, at 140,658.65 yuan · a 1 , while the value of the fir forest was the smallest, at 89,181.32 yuan · a 1 . The comprehensive supply–demand ratio of forest ecosystem services in Zhuxi County was 1.54, which means a moderate surplus; the supply–demand ratio of supply services was 1.27, which means a slight surplus; the supply–demand ratio of adjustment services was 1.34, which means a slight surplus; the supply–demand ratio of support services was 1.13, which means a slight surplus; and the supply–demand ratio of cultural services was 6.01, which means a high surplus. The supply–demand ratio of cultural services of forest ecosystem services in Zhuxi County was the largest and that of the support services was the smallest. From an overall perspective, the supply of forest ecosystem services in Zhuxi County in 2020 was relatively abundant and sufficient to meet local people’s demand for forest ecosystem services. In the future, some goals may include: (1) improving management capacity of forest resources and the quality of forest resources; (2) increasing the value of forest ecological services per unit area; (3) using mixed-forest planting to transform low-value tree species; (4) developing the supply capacity of forest ecological services; (5) enhancing the reprocessing industry of forest products; and (6) expanding the output of nonforest products. A good ecological defence must be established to achieve the sustainable management of forest resources.

1. Introduction

The supply and demand of ecosystem services is an international hot issue. Relevant research mainly focuses on two aspects. Firstly, it mainly focused on the quantification of the services, the supply and demand matching relationship, the evolution process, and so on. Fisher et al. (2009) divided the spatial structure of the study area into three major sectors, the supply area, the connection area, and the benefit area, according to the supply and demand relationship study [1]. It is found that in many services, supply and demand are mismatch. Climate regulation (leading to clean air) can have a worldwide influence, and its service functions can benefit a wide population [2,3,4]. Burkhard et al. (2009, 2012) studied the supply of and demand for ecosystem services according to different land types and constructed a matrix representing the relationship between these services and land use [5,6]. Wolff (2015) considered that index selection is a difficult point in ecosystem service evaluation and proposed selection and calculation methods of ecosystem service demand indicators [7]. Palacios et al. (2015) conducted a study on Biscay and other places spanning from 2000 to 2010 using the ecological footprint method to explore the supply and demand situation and change trends for raw materials, energy, and other services [8]. Hanna et al. (2020) used a questionnaire to investigate the satisfaction of different people with ecosystem services and analyzed the difference between people’s expectations and the actual values provided by these ecosystem services [9]. Xin et al(2021) analyzed the pendant areas of the imbalance between supply and demand of ecosystem services in Fujian Delta [10].
Secondly, it has focused on ecosystem service flows, static supply and demand, value conversion, and dynamic changes, among others. Huimin et al. (2016) studied the supply flow process of ecosystem services and elaborated on the generation mechanism of ecosystem service flow. Some scholars have also studied the static characteristics of the supply and demand related to ecosystem services [11]. Gaodie et al. (2008) used econometric theory to construct a framework for the value of ecosystem services from production to consumption [12]. Yang et al. (2012) measured the supply and consumption status of food production in the Yellow River Basin based on county-level land use data to provide an in-depth analysis of the supply and demand situation at each location [13]. Hengxing et al. (2021) calculated the supply and demand status for three services—water production, carbon sequestration, and food supply—in the Songnen Plain ecosystem, and the supply–demand ratio was quite different internally among them [14]. Zhan et al. (2021) analyzed and studied the supply and demand status of ecosystem services in Huangshui Basin and found that the supply and demand quantity was relatively matched but the overall supply was greater than the demand. Land use type was one of the most important factors affecting the supply–demand balance and increasing the proportion of forest land and grassland area could significantly improve the supply level [15]. Xu et al. (2022) calculated the supply of and demand for ecosystem services in Macao and found that most of them were in a state of deficit [16]. Spatial cartographic analysis of supply, demand, and the supply–demand ratio showed that there was spatial synergy.
Exploring the supply and demand relationship of ecosystem services is an important part of studying ecosystem services, and experts and scholars are paying increasing attention to this area. There are several methods to assess the supply and demand related to ecosystem services: one is to establish supply and demand coefficients based on land use or land cover data [17]; another is the ecological model evaluation method for ecological processes [18,19,20]; and the third is the public participation method based on public preference surveys, cognitive surveys, willingness collection, and interviews [21]. The forest ecosystem service assessment methods widely used by domestic and foreign academics can be divided into four major categories: the material quality method, the value method, the energy value analysis method, and the ecological model method. The relevant research results are fruitful, and new technologies, such as satellite remote sensing, are widely used in the research [22,23].
According to the existing literature, there are a few assessment indicators involved in the study of supply and demand related to forest ecosystem services at both national and regional scales, and its systemic nature needs to be strengthened. Although some scholars have put forward theoretical concepts and consideration angles, there are few empirical analyses in combination with specific data. Because there are few studies on the supply and demand assessment of forest ecosystems, this research attempts to study the supply and demand relationship of forest ecological services in the region, design a supply and demand assessment index, and establish a scientific and reasonable supply and demand evaluation system in order to strengthen the scientific and precise management of forest ecosystems, ensure the reasonable allocation of resources, ensure forest ecological safety in the region, and promote the coordinated development of the forest ecosystem and the regional coordinated economy.

2. Overview of the Study Area

Zhuxi County is part of Shiyan City, Hubei Province, in the Qinba Mountain Region, and is intersected by Hubei Province, Chongqing City, and Shanxi Province (Figure 1). It lies west of Xunyang and Pingli Counties in Shanxi Province, bordered on the south by Wuxi County in Chongqing City and on the east by Zhushan County, Hubei Province. Zhuxi County is an important hub connecting Central China, Northwest China, and Southwest China, and is known as the Great West Gate of Hubei. It is also the “Natural Heart” of China, with Jixin Ridge, known as the “Natural Heart of China,” located in the southern part of the county. In terms of area, Zhuxi County extends 51 km east–west and 104 km north–south, with a county area of 3310 square km. There are 11 towns and 4 townships under its jurisdiction. The region is rich in vegetation and biological resources, and Wu Yiyi, a famous professor, praised it as “the gene bank of animals and plants, and the encyclopedia of biology”. Zhuxi County has been effective in forestry ecological construction and is a “National Forest Tourism Demonstration County” and a “National Forest Recreation Base Pilot Construction County”.

3. Data Sources and Research Methods

3.1. Data Sources

The data on the development of agriculture, forestry, animal husbandry, and fishery in Zhuxi County were procured from the Forestry Bureau of Zhuxi County and the Agricultural and Rural Bureau of Zhuxi County. Tourism revenue data came from the Bureau of Culture and Tourism of Zhuxi County, and household population data were provided by the Public Security Bureau of Zhuxi County. Data on economic development were from the Statistical Bulletin of National Economic and Social Development of 2020 of Zhuxi County. The annual statistical report of the Forestry Bureau of Zhuxi County provided the number of tourists received at forest tourism sites. Rainfall and average annual temperature data were from the local ecological and environmental bureau and meteorological bureau, and data on carbon emissions were from the Statistical Yearbook of Zhuxi County. The academic literature was the source of forest stand evapotranspiration and surface runoff data. The forest land area, the forest type, and the area of each land type were obtained from the statistical table of the fifth forest resource inventory in Zhuxi County. The fifth forest resources census of Zhuxi County were completed in 2020.The fifth general survey of forest resources in Zhuxi County was conducted in accordance with the provisions of the Detailed Rules for the Investigation of Forest Resources Planning and Design in Hubei Province.According to the statistical data of forest resources inventory in Zhuxi County, there are 11 types of forests in Zhuxi County, including Pinus massoniana, cedar, and broadleaf–mixed. In our work, we collated the area and accumulation of various tree species by using the forest resource inventory data of Zhuxi County. The published scientific literature provided data on the annual absorption of sulfur dioxide, nitrogen oxide, fluoride, and stagnant dust in forest strips. The annual net productivity of forest vegetation stands was obtained from research information on vegetation productivity across the country. The soil erosion modulus of nonforested land and that of forested land in forest stands were obtained from published literature on carbon pools tabulated according to forest land types (Table 1).
Zhuxi County is rich in forest resources. As of 2020, the area of forest land in Zhuxi County was 273,266.66 ha, the forest coverage rate in the region reached 82.6%, and the vegetation coverage rate reached 83.9%. According to Forest Law in China (2019), divided by forest species, the local forests in Zhuxi County include protected forests, timber forests, economic forests, fuel forest and special use forests. The protected forests includes forests for water source conservation, forests for soil and water conservation, etc. The largest area was that of general timber forests, with an area of 152,164.68 ha , accounting for 55.68% of the total forest area in Zhuxi County; the smallest area was that of experimental forests, at 0.15 ha , an essentially negligible percentage. The collective natural forest area was the largest, reaching 147,947.45 ha , accounting for 54.14% of the total forest area in Zhuxi County. The individual plantation area was the smallest, 95.32 ha , accounting for 0.03% of the total forest area in Zhuxi County. According to different forest vegetation types, the forests in Zhuxi County can be divided into 11 species of trees, including masson pine, fir, and cypress. The largest area was that of broadleaf forests, at 123,721.73 ha , accounting for 45.28% of the total forest area in Zhuxi County; the smallest area was that of economic forests, with an area of 136.51 ha accounting for only 0.05% of the total forest area in Zhuxi County. Table 2, Table 3 and Table 4 present the relevant data.

3.2. Research Methods

3.2.1. Indicator System and Methods for Assessment of Forest Ecosystem Service Supply

To select the methods for assessment of the forest ecosystem service supply and demand in Zhuxi County, we needed to follow a scientific approach while keeping both feasibility and operability in view. The forest ecosystem service assessment indicators change on the basis of the purpose for the research. The indexes selected in this study met the following four conditions: (1) the indicators reflected the natural environment, climate change, the impact of human activities, and the supply capacity of forest ecological services and the human demand for forest ecosystems; (2) they represented the focus of the local government and residents; (3) the supply index and the demand index corresponded to each other and were well connected so as to facilitate the analysis and comparison of supply and demand and exploration of the current situation of supply and demand; (4) the indexes were calculated using scientific and confirmable methods, the corresponding calculation methods are commonly used and recognized, and the indexes were feasible and quantifiable.
The selection of supply indicators is based on the specific evaluation indicator system in the National standard “Forest Ecosystem Service Function Evaluation Specification” (GB/T38582-2020) issued by the State Forestry Administration in 2020. There are many indicators that can be used for evaluation. This study takes the standard as the basis, combines literature research and the actual situation of Zhuxi County’s forests, and selects several representative indicators for in-depth analysis, In this study, the service supply type of forest ecosystem is divided into four categories: supply service, regulation service, support service and cultural service, including eight evaluation indicators: forest product supply, water conservation, carbon fixation and oxygen release, air purification, noise reduction, soil conservation, biodiversity protection and forest recreation.
Supply services: refers to obtaining food, fuel wood, biochemical medicine and other products from the forest ecosystem. Here, the supply of forest products is selected as the evaluation index, and the index evaluation factor is the supply of wood and non-wood products.
Regulation service: refers to the forest ecosystem regulating the environment, for example, the forest can provide climate regulation, precipitation regulation, water purification, pollination and other services. The index evaluation factors of regulation service selected in this paper are regulating water volume, purifying water quality, fixing carbon, releasing oxygen, providing negative ions, absorbing air pollutants, absorbing dust and reducing noise.
Support services: refer to forest ecosystem soil formation, nutrient cycling, primary production and other services, which are necessary for other forest ecosystem service production. The index evaluation factors selected in this paper are soil fixation, fertilizer conservation and species resource conservation.
Cultural services: refer to the services that the forest ecosystem can provide for human beings, such as leisure, eco-tourism, popular science education, aesthetic enjoyment, inspiration, spirit and religion. The index evaluation factor selected in this paper is forest recreation.
The details are shown in Table 5.
In this study, the supply of forest ecosystem services in Zhuxi County was calculated by the material quality method and the value method following code specifications for assessment of forest ecosystem services (GB/T 38582-2020).

3.2.2. Index System and Methods for Measuring the Demand for Forest Ecosystem Services

This study considered demand as the services provided by the ecosystem that humans have used or consumed, or the services humans want to obtain from the ecosystem. To study supply and demand assessment of forest ecosystem services, a new demand evaluation system was established. This system effectively combined the supply of forest ecosystem services with human demand according to the composition of human demand for forest ecosystem services. The demand for forest ecosystem services in Zhuxi County was divided into four categories: material demand, environmental demand, ecological security demand, and spiritual demand. Eight indicators were used: demand for forest products, utilization of water resources, carbon compliance, air quality, environmental noise conditions, soil conservation, species richness, and recreational tourism demand.
Material demand: refers to the demand of people for means of life and means of production, which corresponds to the supply function of forest ecological services. The index evaluation factor of material demand selected in this paper is the per capita demand for forest products.
Environmental demand: refers to the requirements of human beings for the overall or certain elements of a specific environment for their own survival and development, which correspond to the regulatory services of the supply function of forest ecological services. The index evaluation factors selected in this paper are per capita ecological water consumption, water quality compliance rate, per capita carbon emissions, environmental comfort index, regional air quality, PM2.5 compliance rate, and the average value of regional environmental noise.
Ecological security demand: means that humans, animals and plants need a safe environment to survive and support services provided by forests. The index evaluation factors selected in this paper are water and soil conservation rate, fertilizer application intensity, special trees protection rate, and key biological species protection rate.
Spiritual demand: refers to people’s demand for knowledge, entertainment and beauty, and cultural services corresponding to the supply function of forest ecological services. The index evaluation factor selected in this paper is difficult, so we used per capita scenic area instead.
Table 6 presents the four categories together with the eight indicators.
The following resources were used in this study as reference standards for evaluating forest ecological system service needs in Zhuxi County (Table 7): implementation plan for establishing a national ecological city in Shiyan City, issued by the Office of Shiyan People’s Government in 2019; construction criteria for national ecological garden cities; construction criteria for A Beautiful China; the 14th Five-Year Implementation Plan for soil and water conservation; and the research methods in published academic papers.
The demand for forest ecosystem services was measured by combining the standard values of these demand evaluation indicators and the values obtained from the actual survey in Zhuxi County.

3.2.3. Methods for Measuring Supply and Demand Related to Forest Ecosystem Services

In this study, the demand index system of forest ecosystem services and the supply index system of forest ecosystem services in Zhuxi County were divided into four categories and eight evaluation indexes. On the basis of the established forest ecosystem service demand indicator system and the forest ecosystem service supply indicator system combined and correlated, a three-level indicator system of forest ecosystem service supply and demand was established. Studying the relationship between the supply and demand related to forest ecosystem services is crucial to the sustainable management of forest ecosystem services. The supply–demand ratio of ecosystem services was used to evaluate the supply of and demand for forest ecosystem services in Zhuxi County. It is calculated as follows:
E i = A D i
In the formula, A indicates the total forest area of Zhuxi County and D i means the area of forest demand that meets the standard value of the i-th demand type.
An E i value greater than 1 indicates oversupply, and an E i value less than 1 indicates supply less than demand.
To analyze the supply and demand related to forest ecosystem services in Zhuxi County, the measured values of supply and demand were calculated and analyzed to determine the final results. In this study, natural breaks [24] were used to grade the supply–demand ratio of forest ecosystem services in Zhuxi County, divided into five levels: moderate deficit, mild deficit, mild surplus, moderate surplus, and high surplus. The specific grading is shown in Table 8.

4. Results and Analysis

4.1. Measured Results—Supply of and Demand for Forest Ecosystem Services

4.1.1. Assessment Results for Forest Ecosystem Services Supply

After calculating the four categories and eight evaluation indicators of forest ecosystem services in Zhuxi County, it was concluded that the total supply value of forest ecosystem services in Zhuxi County in 2020. Sorted by size, adjustment services were the largest, support services were the second largest, supply services were the third largest, and cultural services were the smallest. Table 9 presents the specific supply value assessment results.
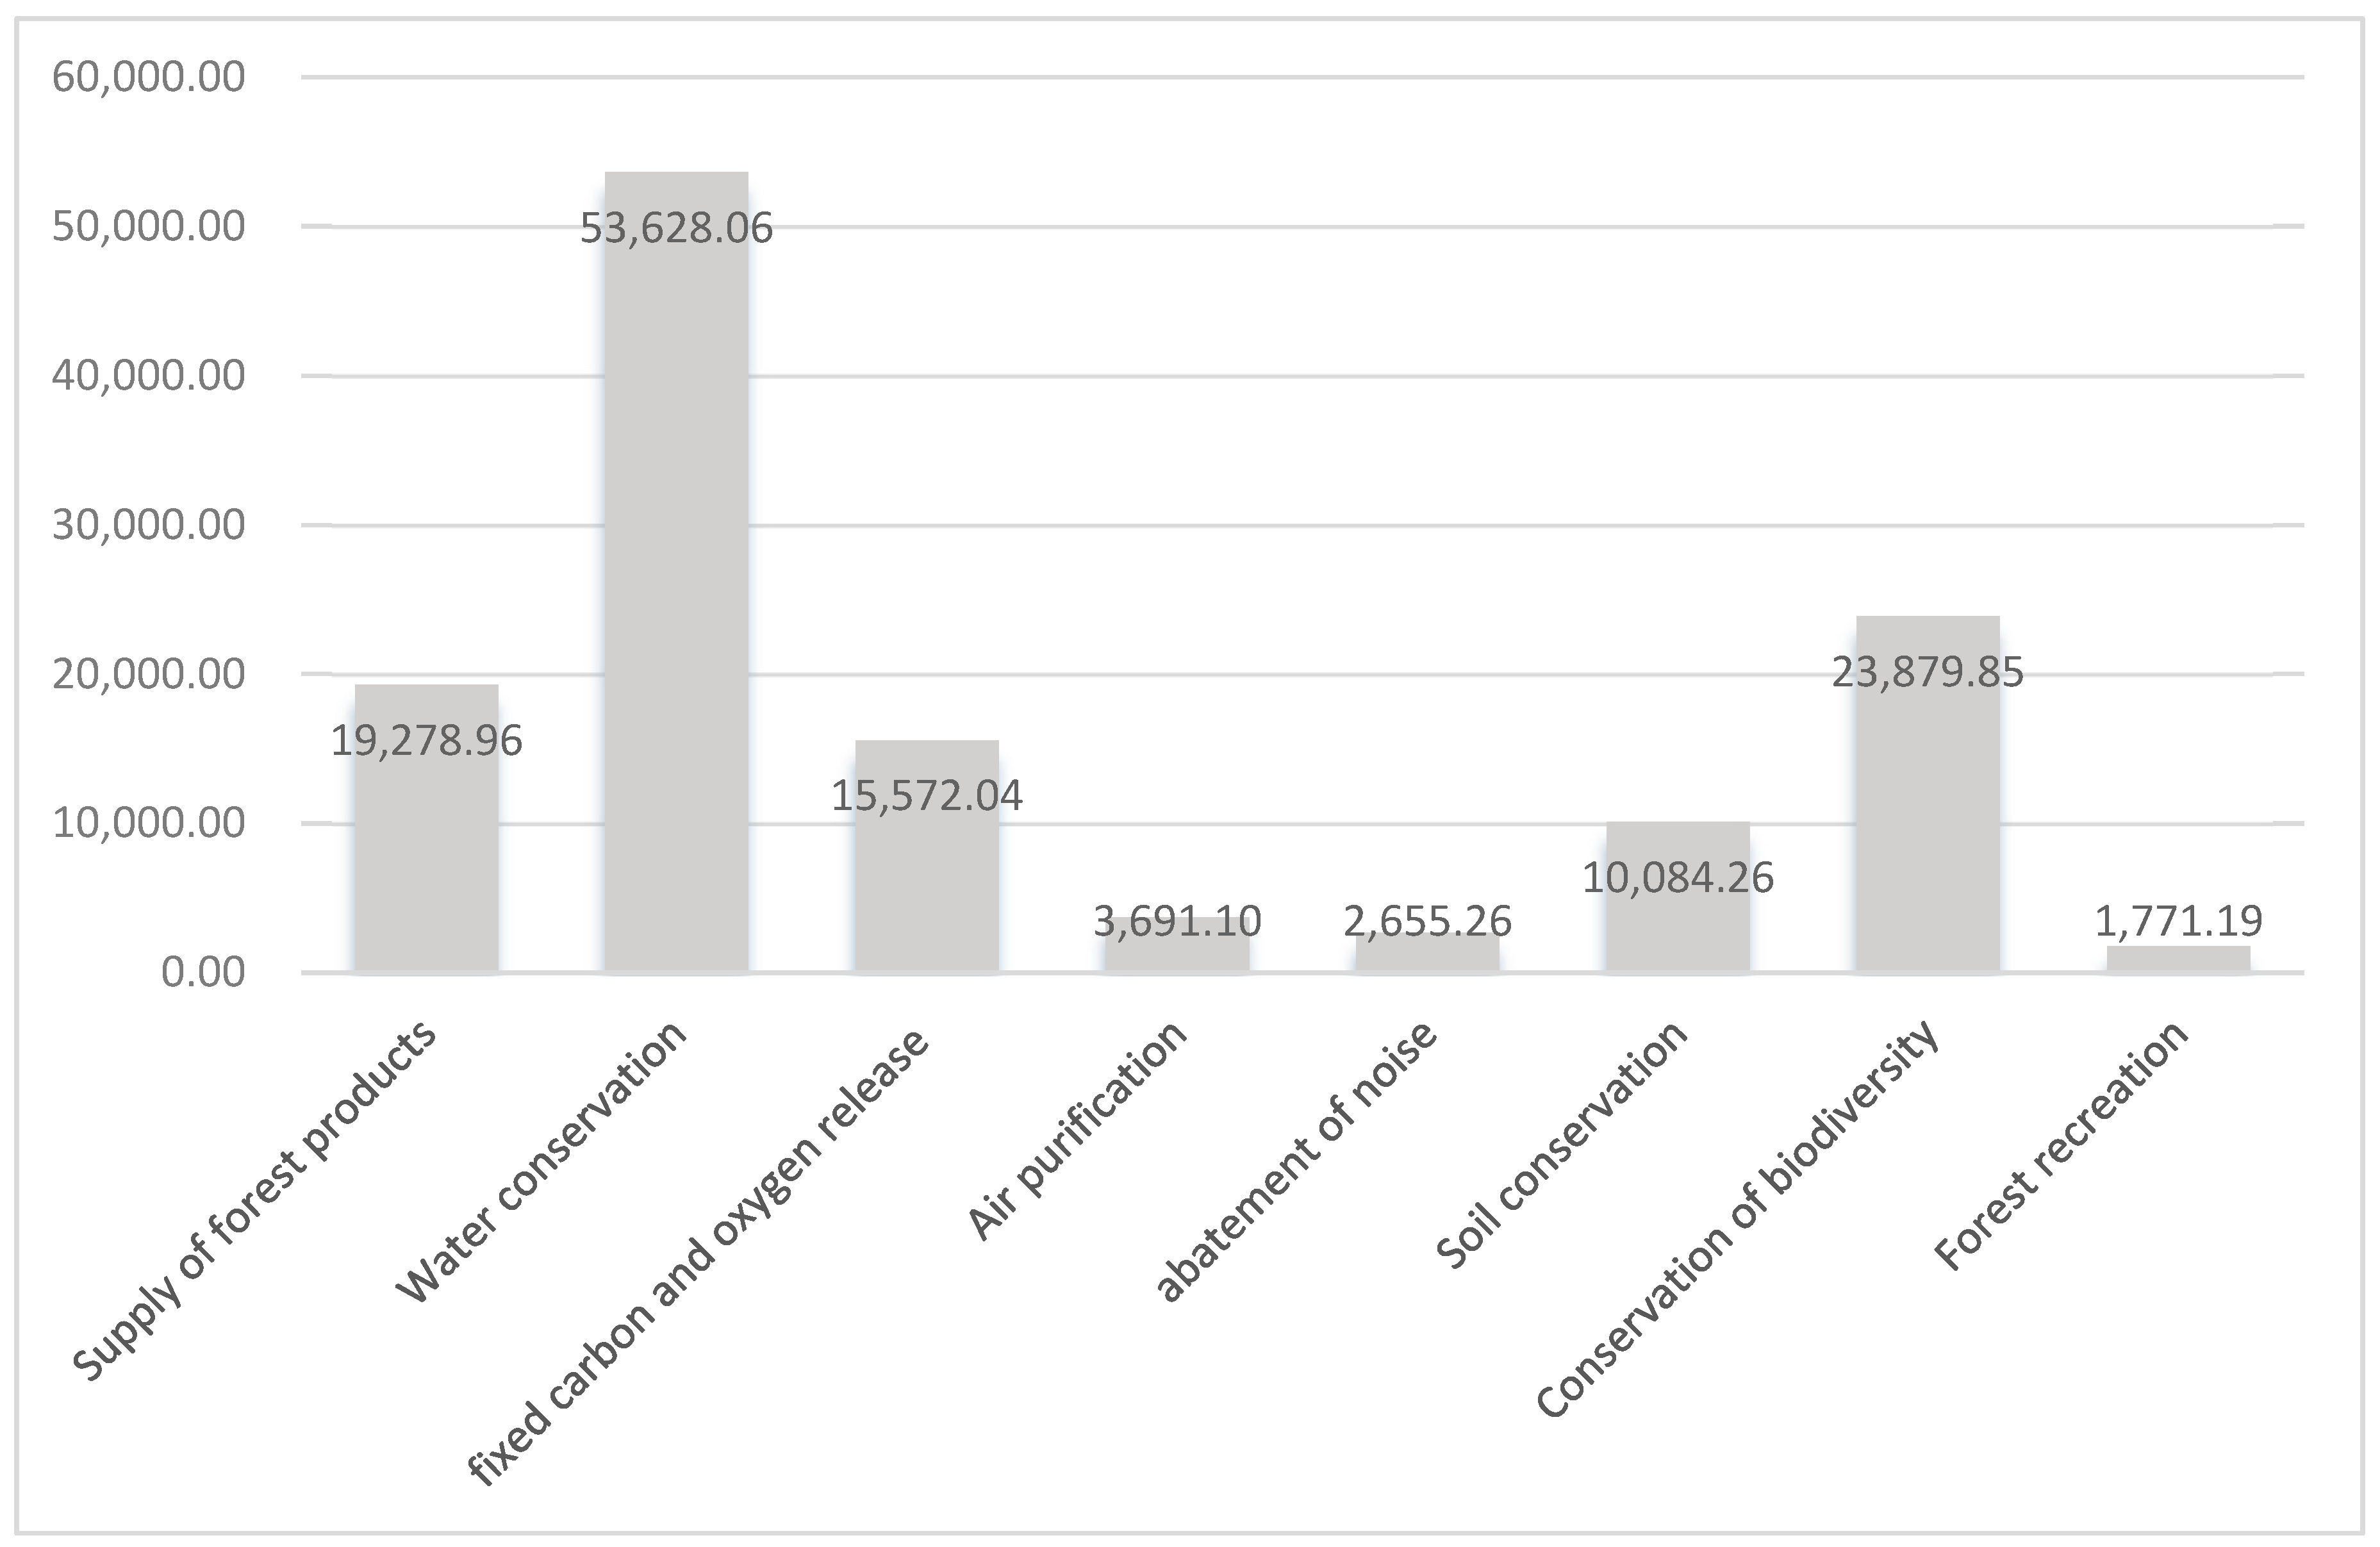
The value of each forest ecosystem service in Zhuxi County and its proportion compared to the total value were as follows: supply of forest products 5,268,297,300 yuan · a 1 (14.77%); water conservation 14,654,761,700 yuan · a 1 (41.08%); carbon fixation and oxygen release 4,255,319,800 yuan · a 1 (11.93%); air purification 1,008,653,500 yuan · a 1 (2.83%); noise reduction 725,593,500 yuan · a 1 (2.03%); soil conservation 2,755,692,300 yuan · a 1 (7.72%); biodiversity conservation 6,525,568,200 yuan · a 1 (18.29%); and forest recreation 484,008,000 yuan · a 1 (1.36%). Among the eight indicators of forest ecosystem services in Zhuxi County, the value of water conservation was the largest, accounting for 41.08% of the total value, followed by the supply of forest products, accounting for 14.77% of the total value. The value of forest recreation was the smallest, accounting for only 1.36% of the total value.
According to the relevant data above, the forest ecosystem service value per unit area of Zhuxi County in 2020 was 130,560.73 yuan . The specific value of the eight forest ecosystem services per unit area is shown in Figure 2.
The values of forest ecosystem services per unit area are ranked as follows: water conservation 14,654,761,700 yuan · a 1 > biodiversity conservation 6,525,568,200 yuan · a 1 > forest recreation 484,008,000 yuan · a 1 > carbon fixation and oxygen release 4,255,319,800 yuan · a 1 > soil conservation 2,755,692,300 yuan · a 1 > air purification 1,008,653,500 yuan · a 1 > noise reduction 725,593,500 yuan · a 1 > forest recreation 484,008,000 yuan · a 1 . The value per unit area of forest ecosystem in Zhuxi County was the largest in terms of water conservation and the smallest in terms of forest recreation. This conclusion is more consistent with the findings of scholars regarding other cities around Zhuxi County, such as the Changzhutan region, where the forest ecosystem has the largest value in terms of water conservation and the smallest value in terms of forest recreation (Huang, 2010), and Nan County, Hunan Province, where the forest ecosystem has the greatest value in terms of water retention and the lowest value for forest recreation (Wu, 2015).
The values for the supply of forest products and forest recreation in Zhuxi County were calculated without distinguishing the species of trees, and the values were directly calculated and apportioned to each species according to its stand area. Therefore, Table 9 does not list the value of each species in terms of the supply of forest products or forest recreation, both values being reflected in the total value of each species.
According to the calculation results, the magnitude and ranking of forest ecosystem service value per unit area of each forest stand in 2020 in Zhuxi County were as follows: broadleaf–mixed forest 140,658.65 yuan · a 1 > broadleaf forest 135,763.41 yuan · a 1 > coniferous–mixed forests 135,488.73 yuan · a 1 > mixed–coniferous forest 125,908.29 yuan · a 1 > cypress wood 122,976.80 yuan · a 1 > horsetail pine 109,544.90 yuan · a 1 > poplar 106,447.12 yuan · a 1 > economic forest 100,272.08 yuan · a 1 > bamboo forest 98,044.16 yuan · a 1 > shrubbery 94,196.70 yuan · a 1 > fir 89,181.32 yuan · a 1 .
The local broadleaf–mixed forest in Zhuxi County had the largest forest ecosystem service supply value, broadleaf forests were in the second place, and fir species had the smallest value. Different forest types have some differences in terms of the strength of their ecosystem service functions. Broadleaf–mixed forests ranked in the top two in terms of the value of carbon and oxygen release, noise reduction, soil conservation, and biodiversity, and were the first in terms of the value of supply services provided. The main supply services provided by broadleaf forests are soil conservation and biodiversity. Broadleaf forests have larger canopies and thicker diameters than other forest types, and they grow well locally, providing more value. Coniferous–mixed forests and the cypress wood category provide two main services, water conservation and atmospheric purification, while broadleaf–mixed forests are the best in noise reduction. The net stand productivity of bamboo forests is greater, so they have a higher function of carbon sequestration and oxygen release value but smaller values in other aspects. Fir forests have the highest stand height due to their tall and straight trees and are able to absorb large amounts of sulfur dioxide and dust, thus they have the strongest function in purifying the atmosphere. To improve the quality of local forest resources and their ecological service function value, thus improving the supply value of forest ecosystem service function per unit area, we can use mixed afforestation; adopt broadleaf–mixed or coniferous–mixed trees; choose high-quality species, such as fast-growing and vigorous species; and transform low-yielding and low-value species, such as bamboo forests and fir trees.

4.1.2. Forest Ecosystem Service Demand Assessment Results

According to the relevant data from 2020, the current demand value was calculated and analyzed for material, environmental, ecological security, and spiritual demand for forest ecosystem services in Zhuxi County.
The per capita demand for forest products in material demand met the standard value, indicating that the local production of wood products and nonwood products was sufficiently abundant to meet the demand of the local population. All indicators of environmental demand met the standard values, indicating that the services provided by forest ecosystems in Zhuxi County were sufficient to meet the needs of people in the living environment. Among the ecological security requirements, the soil and water conservation rate, the protection rate of ancient trees, and the rate of key biological species all reached the national standard values, indicating that the soil and water conservation capacity of the forest soil in Zhuxi County met the actual needs, and the species conservation capacity satisfied biological survival needs. The per capita scenic area in the spiritual demand category far exceeded the standard value, indicating that the forests of Zhuxi County provided enough scenic tourist sites to meet the demand of the local population for leisure tourism. The calculated data of the specific situation value in 2020 and the standard value are shown in Table 10.
We calculated the demand for forest ecosystem services in Zhuxi County, compared the value of the index in 2020 with the standard value, identified the gaps in the index values and the standard values, and found that the forest area satisfies this index, and reached the standard value. The forest ecosystem can provide a variety of services for humans and simultaneously meet the human needs for raw materials, such as forest products, ecological environment quality, and leisure tourism. If the forest area required to meet the standard values of various indicators is directly summed, we would be counting the existing forest area twice.
Therefore, when determining the total forest area that can satisfy the various needs of people, the average of the area that can satisfy the demand evaluation indicators is taken as the forest area value and it is assumed that with this area, all the various demand evaluation indicators in this demand category can reach the standard value. After finding the forest area required for each demand category for forest ecosystem services, the arithmetic average of the area required for the four demand categories was found and then the total value of forest ecosystem services provided per unit area of forest was calculated by multiplying the demand area by the total value of forest ecosystem services provided per unit area of forest to obtain the total value of demand for forest ecosystem services in Zhuxi County, thereby realizing the mapping of demand value to supply value.
As per Table 11, in 2020, the material demand as the per capita amount of forest products in Zhuxi County exceeded the standard value of demand. The Zhuxi County Forest could have met the local demand for forest products had its area been 176,926.39 ha. In 2020, environmental demand, water resources utilization, carbon compliance, air quality, and environmental noise conditions met or exceeded the standard value, so only 204,685.52 ha of forest area was needed to meet the environmental demand. For ecological security demand, maintaining the soil and water conservation rate to meet the standard required 241,916.88 ha of forest area and the protection rate of ancient trees and key biological species reached 100%, so the area requirement was not calculated. Therefore, 241,916.88 ha of forest area was needed to meet the ecological security requirement. In terms of the spiritual demand, since the scenic area of Zhuxi County in 2020 was 58,058.64 ha, the calculated landscape area per capita exceeded the standard value of per capita demand by several times. Thus, it can be concluded that only 45,448.24 ha of forest area was needed to meet the spiritual demands of the local people.
After determining the forest area needed for each demand type, direct summing would have led to the same problem of double counting. Therefore, the total demand for forest ecological services was taken as the average of the four demand types and the total demand area was calculated to be 176,926.39 hm2, which is much lower than the forest area that existed in Zhuxi County in 2020. From the aforementioned calculation, the value of forest ecosystem services per unit area in Zhuxi County was 130,560.73 yuan · a 1 . Thus, the total demand value of forest ecosystem services in Zhuxi County in 2020 was 23.10 billion yuan · a 1 , a value much smaller than the total supply value of 35.68 billion yuan · a 1 in 2020. The supply of forest ecosystem services in Zhuxi County was much larger than the demand and the supply of forest ecosystem services provided by forests in Zhuxi County was sufficient to meet local demand.

4.2. Supply and Demand Analysis of Forest Ecosystem Services

Forest ecosystem services provide supply services, regulation services, support services, and cultural services, and involve material demand, environmental demand, ecological safety demand, and spiritual demand. The ratio of the supply value to the demand value was calculated for each item according to the supply–demand ratio calculation method, and the grading situation of the supply–demand ratio was obtained after comparing the calculated value with the grading situation of the supply and demand ratio, as shown in Table 12.
As per Table 12, in 2020, the supply–demand ratio of supply service to material demand was 1.27, that is, the supply service of the forest ecosystem met people’s material demand for forest ecosystem services and was in a slight surplus state. The wood products produced in Zhuxi County are mainly seedlings and wood, while nonwood products include fruits, tea, medicinal materials, walnuts, chestnuts, camellia seeds, and forest beverages. According to the calculation of supply and demand, local forest products were sufficient to meet the local people’s consumption needs related to forest products. As a national processing and supply base for green agricultural products, Zhuxi County has several production areas in the northern machine–agriculture–integrated production area, the central famous tea agriculture and tourism integration area, and the southern alpine–ecological specialty area. The local area attaches great importance to investment in projects such as the green product industry to fully meet the demand for solid-wood products, processed-wood products, and other nonwood products. Zhuxi County should continue to expand the supply of forest byproducts; promote the characteristic creation and large-scale production of local industrial products; enhance the product output of local characteristic medicinal herbs, walnuts, and konjac in Zhuxi County; open market outlets; meet the needs of local people while selling the characteristic diversified, green, and safe forest products to domestic and foreign countries; and promote the effective flow of resources, thus driving the rapid development of Zhuxi County’s economy.
The supply–demand ratio of regulating services–environmental demand was 1.34 in 2020, and the regulating services of forest ecosystems were able to meet people’s environmental demand for forest ecosystem services, being in slight surplus. Zhuxi County is located at the origin of the main tributaries of the Han River and is also the main water supply site of China’s South-North Water Diversion Central Project. Its geographical location is crucial, and the surface water is of high quality. From 2010 to 2020, Zhuxi County had raised over 23,333 ha of forests and implemented the policy of ecological protection of water quality, the ability of forests to contain water within the jurisdiction was continuously strengthened, the total amount and intensity of coal energy consumption were controlled, clean energy and new energy were actively promoted, road dust was cleaned in a timely manner, air pollution control was strengthened, the environment was maintained in a fresh and beautiful state, and the atmosphere had improved. Thus, all indicators of regulation services met people’s needs from the environment and reached a slight surplus state.
In 2020, the supply–demand ratio of support services–ecological security needs was 1.13, that is, the support services of forest ecosystems met people’s ecological security needs for forest ecosystem services and were in slight surplus. Soil erosion in Zhuxi County is still a problem that needs to be continuously addressed. The current soil and water conservation rate in Zhuxi County is 82.46%, which has reached the standard value set by the state. However, it has not yet reached the standard set by Hubei Province. To achieve the soil and water conservation rate standard value set by Hubei Province in the next few years, the Zhuxi County Government needs to identify the important causes of soil erosion, prohibit the destruction of ground vegetation and deforestation, improve farming techniques, prevent soil from loosening, improve the soil and water conservation function of local forests in Zhuxi County, and search for new plans to reduce the area and intensity of soil erosion from multiple dimensions.
In 2020, the supply–demand ratio of cultural services–spiritual needs was 6.01 and the cultural services of forest ecosystems met people’s spiritual needs for forest ecosystem services, reaching a high-surplus state. In recent years, Zhuxi County provided diversified infrastructure for tourist attractions and focused on strengthening investment in leisure and health care, public services, and other aspects. It has also taken full advantage of the existing forest ecological natural resources to develop several scenic spots integrating sightseeing, tourism, leisure, shopping, and adventure. The local tourism resources are extremely rich, so the local per capita landscape area far exceeds the standard of an eco-city and is in a state of high surplus.
Overall, the overall supply–demand ratio of forest ecosystem services in Zhuxi County was 1.54 in 2020 and the total supply of forest ecosystem services met the total demand for forest ecosystem services. The overall situation of forest ecosystem supply and demand in Zhuxi County was relatively optimistic. Zhuxi County has abundant forest ecological resources, a wide forest area, a large ecological reserve, a good green ecological barrier, and a rich and sufficient supply of forest ecosystem services.

5. Conclusions

We measured the supply of and demand for forest ecosystem services in Zhuxi County by constructing a supply and demand index evaluation system, which was divided into four categories and eight major indicators. A comprehensive analysis of the current state of supply and demand combined with the supply–demand situation was performed; our main conclusions follow:
(1)
In 2020, the total supply value of forest ecosystem services in Zhuxi County was 35,677,894,500 yuan and the GDP of Zhuxi County was 8.77 billion. The total supply value of forest ecosystem services was 4.07 times the GDP of the county in 2020. The order of magnitude of the supply value for each service of the forest ecosystem in Zhuxi County follows ( yuan · a 1 ): water conservation 14,654,761,700 > biodiversity conservation 6,525,568,200 > forest recreation 484,008,000 > carbon fixation and oxygen release 4,255,319,800 > soil conservation 2,755,692,300 > air purification 1,008,653,500 > noise reduction 725,593,500 > forest recreation 484,008,000. The value of water conservation was the largest, accounting for 41.08% of the total value, and the value of forest recreation was the smallest, accounting for only 1.36% of the total value.
(2)
In 2020, the magnitude of the forest ecosystem service value per unit area of each tree species in Zhuxi County follows ( yuan · a 1 ): broadleaf–mixed forest 140,658.65 > broadleaf forest 135,763.41 > coniferous–mixed forests 135,488.73 > mixed coniferous forest 125,908.29 > cypress wood 122,976.80 > horsetail pine 109,544.90 > poplar 106,447.12 > economic forest 100,272.08 > bamboo forest 98,044.16 > shrubbery 94,196.70 > fir 89,181.32. The forest ecosystem service value of local broadleaf–mixed forests in Zhuxi County was the largest and that of fir species was the smallest.
(3)
The demand for forest ecosystem services in Zhuxi County was calculated, and all four categories of demand were met to varying degrees. From the calculated data, in 2020, the total demand area of forest ecosystem services in Zhuxi County was 176,926.39 hm2 and the total demand value of forest ecosystem services was 2,309,638,300 yuan based on the unit area value, a value much smaller than the total supply value of 3,567,784,500 yuan . The supply of forest ecosystem services in Zhuxi County was much greater than the demand and the supply of forest ecosystem services provided by forests in Zhuxi County was sufficient to meet the local demand for forest ecosystems.
(4)
In 2020, the comprehensive supply–demand ratio of forest ecosystem services in Zhuxi County was 1.54, indicating medium surplus; the supply–demand ratio of supply services was 1.27, indicating slight surplus; the supply–demand ratio of regulation services was 1.34, indicating slight surplus; the supply–demand ratio of support services was 1.13, again indicating slight surplus; and the supply–demand ratio of cultural services was 6.01, showing high surplus. It can be observed that supply–demand ratio related to forest ecosystem services and cultural services in Zhuxi County was the largest and that related to support services was the smallest.
From an overall perspective, the supply of forest ecosystem services in 2020 in Zhuxi County was relatively abundant and sufficient to meet the demand of the local people for forest ecosystem services. The mixed transformation of larch plantations has changed the species and quantity of deciduous plants, improved soil physicochemical properties, and promoted the restoration of soil fauna through the regulation of aboveground vegetation composition and structure. The species, number, and diversity of endosymbionts were increased after the hybridization.
Adopting a mixed forest planting mode can transform low value tree species and improve the supply capacity of forest ecological services. The total value of forest ecological service function is closely related to the forest area, but the forest area of Zhuxi County has reached 82.6% of the total area of Zhuxi County, so it is not reasonable and feasible to increase the forest area, and the fundamental way is to comprehensively improve the supply value of unit area. The forest ecosystem service value of local broad-leaved mixed forest in Zhuxi County is the largest, and that of fir is the smallest. This highlights the potential of forest resources and improves the ecological benefits of forests per unit area. To improve the supply value of the service function of the forest ecosystem per unit area, we can adopt mixed afforestation select high-quality varieties, such as fast growing and strong vitality trees, transform low yield and low value tree species such as Chinese fir, bamboo forest and shrub forest strengthen the management of forest resources, improve the quality of local forest resources and give better play to their ecological service function value by means of replanting and renewal, realizing sustainable management of forest resources.
Building a good ecological barrier to maintain the water and soil conservation rate is at the provincial level. The index of the water and soil conservation rate is an important link in assessing the construction of a beautiful China. The local government should build an ecological pattern of “one screen and two corridors” consisting of the Qinba Mountains ecological barrier, the river blocking ecological corridor, and the Quanhe River ecological corridor. Consider the ecological protection function of forests, avoid competing with agriculture for fertilizer, and deploy biological hedgerows and other measures to strengthen water and soil conservation in economic forests. The long-term target value of each province should be further graded to each city and county, and incorporated into the relevant planning of governments at all levels and water conservancy departments. The tasks should be clarified level by level, and new plans to reduce the area and intensity of water and soil loss should be developed. The function of water and soil conservation should be improved from multiple dimensions to achieve good results of reduction and efficiency increase. Furthermore, we should strengthen the restoration of degraded wetlands and the control of rocky desertification land, and enhance the water and soil conservation capacity of forests.

Author Contributions

Conceptualization, W.C.; methodology, W.C.; formal analysis, J.L.; investigation, J.L. and C.Z.; resources, A.L.; writing—original draft preparation, J.L.; writing—review and editing, C.Z.; supervision, W.C.; project administration, W.C. All authors have read and agreed to the published version of the manuscript.

Funding

This research was funded by the National Natural Science Foundation of China (NSFC) (No. 71573018).

Institutional Review Board Statement

Not applicable.

Informed Consent Statement

Not applicable.

Data Availability Statement

Not applicable.

Conflicts of Interest

The authors declare no conflict of interest.

References

  1. Fisher, B.; Turner, R.K.; Morling, P. Defining and classifying ecosystem services for decision making. Ecol. Econ. 2009, 68, 643–653. [Google Scholar]
  2. Anaya-Romero, M.; Muoz-Rojas, M.; Ibáez, B.; Marañón, T. Evaluation of forest ecosystem services in Mediterranean areas. A regional case study in South Spain. Ecosyst. Serv. 2016, 20, 82–90. [Google Scholar] [CrossRef]
  3. Costanza, R.; d’Arge, R.; de Groot, R.; Farber, S.; Grasso, M.; Hannon, B.; Limburg, K.; Naeem, S.; O’Neil, R.V.; Paruelo, J.; et al. The value of the world’s ecosystem services and natural capital. Nature 1997, 387, 253–260. [Google Scholar] [CrossRef]
  4. Dias, V.; Belcher, K. Value and provision of ecosystem services from prairie wetlands: A choice experiment approach. Ecosyst. Serv. 2015, 15, 35–44. [Google Scholar] [CrossRef]
  5. Burkhard, B.; Kroll, F.; Muller, F. Landscapes’ capacities to provide ecosystem services: A concept for land-cover based assessments. Landsc. Online 2009, 15, 1–22. [Google Scholar] [CrossRef]
  6. Burkhard, B.; Kroll, F.; Nedkov, S.; Muller, F. Mapping ecosystem service supply, demand and budgets. Ecol. Indic. 2012, 21, 17–29. [Google Scholar] [CrossRef]
  7. Wolff, S.; Schulp, C.; Verburg, P. Mapping ecosystem services demand A review of current research and future perspectives. Ecol. Indic. 2015, 55, 159–171. [Google Scholar]
  8. Palacios-Agundez, I.; Onaindia, M.; Barraqueta, P.; Madariaga, I. Provisioning ecosystem services supply and demand: The role of landscape management is to reinforce supply and promote synergies with other ecosystem services. Land Use Policy 2015, 47, 145–155. [Google Scholar] [CrossRef]
  9. Hanna, D.E.L.; Roux, D.J.; Currie, B.; Bennett, E.M. Identifying pathways to reduce discrepancies between desired and provided ecosystem services. Ecosyst. Serv. 2020, 43, 101–119. [Google Scholar]
  10. Xin, R.; Skov-Petersen, H.; Zeng, J.; Zhou, J.; Li, K.; Hu, J.; Liu, X.; Kong, J.; Wang, Q. Identifying key areas of imbalanced supply and demand of ecosystem services at the urban agglomeration scale: A case study of the Fujian Delta in China. Sci. Total Environ. 2021, 791, 148–173. [Google Scholar]
  11. Liu, H.M.; Fan, Y.L.; Ding, S.Y. Research progress of ecosystem service flow. Chin. J. Appl. Ecol. 2016, 27, 2161–2171. [Google Scholar]
  12. Xie, G.D.; Zhen, L.; Lu, C.X.; Cao, S.Y.; Xiao, Y. Supply, Consumption and Valuation of Ecosystem Services in China. Resour. Sci. 2008, 30, 93–99. [Google Scholar]
  13. Yang, L.; Zhen, L.; Pan, Y.; Cao, X.C.; Long, X. Ecosystem services supply and consumption-A case in Yellow River watershed, China. J. Arid. Land Resour. Environ. 2012, 26, 131–138. [Google Scholar]
  14. Xiang, H.; Zhang, J.; Wang, Z.; Mao, D. Relationships between supply and demand of ecosystem services in the Songnen Plain. Ecol. Environ. Sci. 2021, 30, 1769–1776. [Google Scholar]
  15. Zhan, T.; Yu, Y.; Wu, X.Q. Supply-demand Spatial Matching of Ecosystem services in the Huangshui River Basin. Acta Ecol. Sin. 2021, 41, 7260–7727. [Google Scholar]
  16. Xu, C.; Meng, L.; Wang, W.J. Supply-Demand Matching of Ecosystem Services from Urban Green Infrastructure in Macao. J. Chin. Urban For. 2022, 20, 29–35+95. [Google Scholar]
  17. Xie, G.D.; Zhang, C.X.; Zhang, C.S. The value of ecosystem service in China. Resour. Sci. 2015, 37, 1740–1746. [Google Scholar]
  18. Crossman, N.D.; Burkhard, B.; Nedkov, S.; Willemen, L.; Petz, K.; Palomo, I.; Drakou, E.G.; Martín-López, B.; Mcphearson, T.; Boyanova, K.; et al. A blue print for mapping and modelling ecosystem services. Ecosyst. Serv. 2013, 4, 4–14. [Google Scholar] [CrossRef]
  19. Wei, H.J.; Fan, W.; Wang, X.; Lu, N.; Dong, X.; Zhao, Y.; Ya, X.; Zhao, Y. Integrating supply and social demand in ecosystem services assessment: A review. Ecosyst. Serv. 2017, 25, 15–27. [Google Scholar]
  20. Geijzendorffer, I.R.; Martín-López, B.; Roche, P.K. Improving the identification of mismatches in ecosystem services assessments. Ecol. Indic. 2015, 52, 320–331. [Google Scholar]
  21. Jing, Y.C.; Chen, L.D.; Sun, R.H. A theoretical research framework for ecological security pattern construction based on ecosystem services supply and demand. Acta Ecol. Sin. 2018, 38, 4121–4131. [Google Scholar]
  22. Zhao, J.; Cao, Y.; Ma, J.; Jiang, Y. Evaluation of NPP and ecological service function of China′s forest ecosystem based on remote sensing and FORCCHN. Ecol. Environ. Sci. 2018, 27, 1585–1592. [Google Scholar]
  23. Huang, H.X. The Research on Evaluation of Forest Ecosystem Services and Functions in the CZX Region. Master’s Thesis, Central South University of Forestry and Technology, Changsha, China, 2010. [Google Scholar]
  24. Shi, Y.S.; Shi, D.H. Study on the balance of ecological service supply and demand in Dongting Lake ecological economic zone. Geogr. Res. 2018, 37, 1714–1723. [Google Scholar]
Figure 1. Position of Zhuxi county.
Sustainability 15 03184 g001
Figure 2. Forest ecosystem service value per unit area in Zhuxi County.
Sustainability 15 03184 g002
Table 1. Data sources.
Data TypeData Sources
National Economic and Social Development dataNational Economic and Social Development Statistical yearbook of Zhuxi County in 2020
the Forestry statistical yearbook of Zhuxi County in 2020
the Agricultural and Rural statistical yearbook of Zhuxi County in 2020
Resources and Environment information data Water Resources Bulletin of Zhuxi County in 2020
Meteorological data of Zhuxi County in 2020
The fifth forest resources census of Zhuxi County in 2020
Total pollutant discharge in Zhuxi County in 2020
Academic papers published
Table 2. Zhuxi County divided according to forest category and area.
Category Area   ( ha ) Proportion (%)
1. Protected forest93,007.3834.03
  (1) Forest for water source conservation112.930.04
  (2) Forest for soil and water conservation92,894.4533.99
2. Timber forest152,164.6855.68
3. Economic Forest1587.570.58
  (1) Fruit forest 1487.170.54
  (2) Edible raw-material forest94.840.03
  (3) Medicinal forest5.560.00
4. fuel forest8127.552.98
  (1) Oil-energy forest8.450.00
  (2) Wood-energy forest8119.102.97
5. Special use forests18,376.556.73
  (1) Forest for environmental protection2.780.00
  (2) Forest natural reserve18,376.556.72
Total273,266.66100.00
Table 3. Natural forests and artificial forests.
CategoryAttributes Area   ( ha ) Proportion (%)
Natural forestState owned36,796.6413.47
Collective147,947.4554.14
Individual214.600.08
Plantation forestState owned5014.371.83
Collective83,198.2830.45
Individual95.320.03
Total——273,266.66100.00
Table 4. Division by tree species in Arbor forest.
Category Area   ( ha ) Proportion (%)
(1) Pinus massoniana Lamb12,708.814.65
(2) Fir9605.133.51
(3) Cupressus funebris Endl57.530.02
(4) Mixed coniferous forest5603.552.05
(5) Broadleaf forest123,721.7345.28
(6) Broadleaf–mixed forest70,726.7825.88
(7) Poplar2011.980.74
(8) Mixed coniferous–broadleaf forest34,724.3112.71
Total 259,159.8294.84
Table 5. Forest ecosystem service supply assessment index system.
Supply TypeEvaluation IndicatorsIndicator Evaluation Factors
Supply servicesSupply of forest productsSupply of wood and nonwood products
Reconciliation servicesWater conservationWater regulation
Water purification
Carbon fixation and oxygen releaseCarbon fixation
Oxygen release
Air purificationNegative-ion production
Air pollution absorption
Dust absorption
Abatement of noiseAbatement of noise
Support servicesSoil conservationSoil fixation
Fertilizer preservation
Conservation of biodiversityConservation of species resources
Cultural servicesForest recreationForest recreation
Table 6. Forest ecosystem service demand index system.
RequirementDemand Evaluation IndexIndicator Evaluation Factor
Material demandDemand for forest productsPer capita demand for forest products
Environmental demandUtilization of water resourcesPer capita water consumption
Water compliance rate
Carbon complianceCarbon emissions per capita
Air qualityEnvironmental comfort index
Regional air quality
Number of days that meet PM2.5 standards
Environmental noise conditions Regional ambient noise average
Ecological security demandSoil conservationRatio of soil and water conservation
Species richnessProtection rate of ancient trees
Protection rate of key biological species
Spiritual demandRecreational tourism demand Landscape area per capita
Table 7. Standard value of the forest ecosystem service demand evaluation index.
Requirement TypeIndicator Evaluation FactorStandard ValueSource of Standard Value
Material demandPer capita demand for non-wood forest products (kg)≥100National Ecological City Construction Standard
Environmental demandPer capita water consumption ( m 3 )≥162.1Domestic Advanced City Value and International Standard
Water compliance rate (%)80National Ecological City Construction Standard
Carbon emissions per capita (kg)≤4.9Hubei Province Standard Value
Environmental comfort index≤4.55National Ecological City Construction Standard
Regional air quality (day)≥300National Ecological City Construction Standard
Number of days that meet PM2.5 standards (day)≥292National Ecological City Construction Standard
Regional ambient noise average (dB(A))≤54National Ecological City Construction Standard
Ecological security demandRatio of soil and water conservation (%)≥73Target Value of Soil and Water Conservation in the “14th Five-Year Plan”
Protection rate of ancient trees (%)100National Ecological City Construction Standard
Protection rate of key biological species (%)100Construction Standard of Amazing China
Spiritual demandLandscape area per capita (ha)≥0.034Eco-city Index and Current Standard
Table 8. Classification of the supply–demand ratio.
Supply and DemandSupply–Demand Ratio Range
Moderate DeficitMild DeficitMild SurplusModerate SurplusHigh Surplus
Supply services–material demand<0.60.6~1.01.0~1.31.3~2.3>2.3
Adjustment services–environmental requirements<0.80.8~1.01.0~1.51.5~2.3>2.3
Support services–ecological security needs<0.60.6~1.01.0~1.51.5~2.3>2.3
Cultural services–spiritual needs<0.70.7~1.01.0~1.51.5~2.3>2.3
Forest ecosystem services<0.80.8~1.01.0~1.51.5~2.3>2.3
Table 9. Total value of the forest ecosystem services supply in Zhuxi County.
Various ServicesSupply ServicesAdjustment ServicesSupport ServicesCultural ServicesSum of Value
Supply of Forest ProductsWater ConservationCarbon Fixation and Oxygen ReleaseAir PurificationNoise ReductionSoil ConservationBiodiversity ConservationForest Recreation
Unit area value (CNY)19,278.9653,628.0615,572.043691.102655.2610,084.2623,879.85 1771.19 130,560.73
The value of each indicator (CNY 10,000)526,829.731,465,476.17425,531.98100,865.3572,559.35275,569.23652,556.8248,400.803,567,789.45
Proportion (%)14.7741.0711.932.832.037.7218.291.36100.00
The value of various services (CNY 10,000)526,829.732,064,432.87928,126.0548,400.803,567,789.45
Proportion (%)14.7757.8626.011.36100.00
Table 10. Demand index value in 2020 and the standard value.
Demand TypeDemand Evaluation IndicatorsIndicator Evaluation FactorsStatus Quo ValueStandard ValueWhether the Standards Are Met
Material demandDemand for forest products Per capita demand for forest products126.71100Yes
Environmental demandWater utilizationPer capita water consumption223.45162.1Yes
The ratio of water bodies meeting standards10080Yes
Carbon compliancePer capita carbon emissions2.814.9Yes
Air qualityEnvironmental comfort index3.914.55Yes
Regional air quality356300Yes
Number of days that meet PM2.5 standards365292Yes
Environmental noise conditionsAverage regional ambient noise5254Yes
Ecological security demandSoil maintenanceSoil and water conservation rate82.4673Yes
Species abundanceProtection rate of old trees100100Yes
Protection rate of key biological species100100Yes
Spiritual demandLeisure travel needsPer capita landscape area0.200.034Yes
Table 11. Demand area determination.
Demand TypeDemand Evaluation IndicatorsIndicator Evaluation FactorsDemand AreaOverall Demand Area
Material demandDemand for forest productsPer capita demand for forest products215,654.91 215,654.91
Environmental demandWater utilizationPer capita water consumption181,099.55 204,685.52
The ratio of water bodies meeting standards
Carbon-compliantPer capita carbon emissions156,710.06
Air qualityEnvironmental comfort index227,907.79
Regional air quality
Number of days that meet PM2.5 standards
Environmental noise conditionAverage regional ambient noise253,024.69
Ecological security demandSoil maintenanceSoil and water conservation rate241,916.88 241,916.88
Species abundanceProtection rate of old trees241,916.88
Protection rate of key biological species
Material demandDemand for forest products Per capita demand for forest products45,448.24 45,448.24
Total demand——————176,926.39
Table 12. Calculation of the supply–demand ratio.
Supply and DemandSupply and Demand RatioGrade
Supply services—material needs1.27 Slight surplus
Regulation services—environmental requirements1.34 Slight surplus
Support services—ecological safety needs1.13 Slight surplus
Cultural services—spiritual needs6.01 High surplus
Forest ecosystem services in general1.54 Moderate surplus
Disclaimer/Publisher’s Note: The statements, opinions and data contained in all publications are solely those of the individual author(s) and contributor(s) and not of MDPI and/or the editor(s). MDPI and/or the editor(s) disclaim responsibility for any injury to people or property resulting from any ideas, methods, instructions or products referred to in the content.

