1. Introduction
In this modern world, human well-being and lifestyle have been improved due to rapid economic growth, achieved through massive energy consumption. All economic activities, such as running factories, farms, transportation, and even houses, heavily depend on energy consumption [
1,
2]. IEA [
3] estimated that global energy demand had increased by about 2.3% in 2018, which is the highest level of energy demand in the last decade. Unfortunately, most economies meet their energy requirements with fossil fuel energy, which has badly polluted the environment and is responsible for climate change. Climate change affects rainfall, raising the sea level, aggravating wildlife, causing global warming, and adversely impacting agriculture productivity. In this scenario, the environmentalists and economists turned their attention toward the environment. Environmental degradation has become a global challenge of the present century. Most of the literature on environmental quality analysis has used a proxy of CO
2 emissions [
1,
4], which covers only a small part of environmental degradation. Ecological footprint (EFP) is the wider term, which represents environmental quality and has been used recently by researchers in the analysis of environmental degradation.
The concept of EFP was developed by Wackernagel et al. [
5] to measure the impact of human activities on the environment. The unit of measurement of EFP is the global hectare (gha, which determines the amount of land needed to meet the demands of human activities). There are six components of EFP: cropland, grazing land, forest, built-up lands, fishing, and carbon footprint. The forest, cropland, and fishery footprints measure the production of forest, crops, fish, and seafood that a country uses. The built-up land and grazing footprints quantify the land for housing, industry, transportation, and livestock grazing. Rashid et al. [
6] measured EFP, which is based on two main factors, including the record of EFP components and converting the land area for the impact of human activities on the environment. Global Footprint Network [
7] measured EFP per person in terms of demand for EFP factors and biocapacity per person as the supply of EFP. Biocapacity reserve or deficit is the difference between EFP per person and biocapacity per person.
Pakistan is a developing country and has been facing the problem of environmental degradation due to climate change for the last two decades [
8]. Pakistan is included in the top 10 countries of the world that are badly affected by climate change. Eckstein et al. [
9] estimated that, due to global warming, Pakistan has faced 152 extreme events from 1999 to 2018, which have created massive human loss. Meanwhile, energy demand has increased sharply during this period due to high population growth.
From 1980 to 2020, Pakistan’s EFP consumption per capita increased from 0.50 gha to 0.98 gha. To meet the energy demand, Pakistan relies heavily on traditional energy resources, mostly consisting of fossil fuel energy consumption (FFEC) [
1]. It is considered an important contributor to enhancing EFP [
10,
11]. Furthermore, EFP has been rising due to the overuse of ecosystems. Excessive pressure from greenhouse gases, climate change, and sea acidity have also exacerbated the problem of EFP in Pakistan.
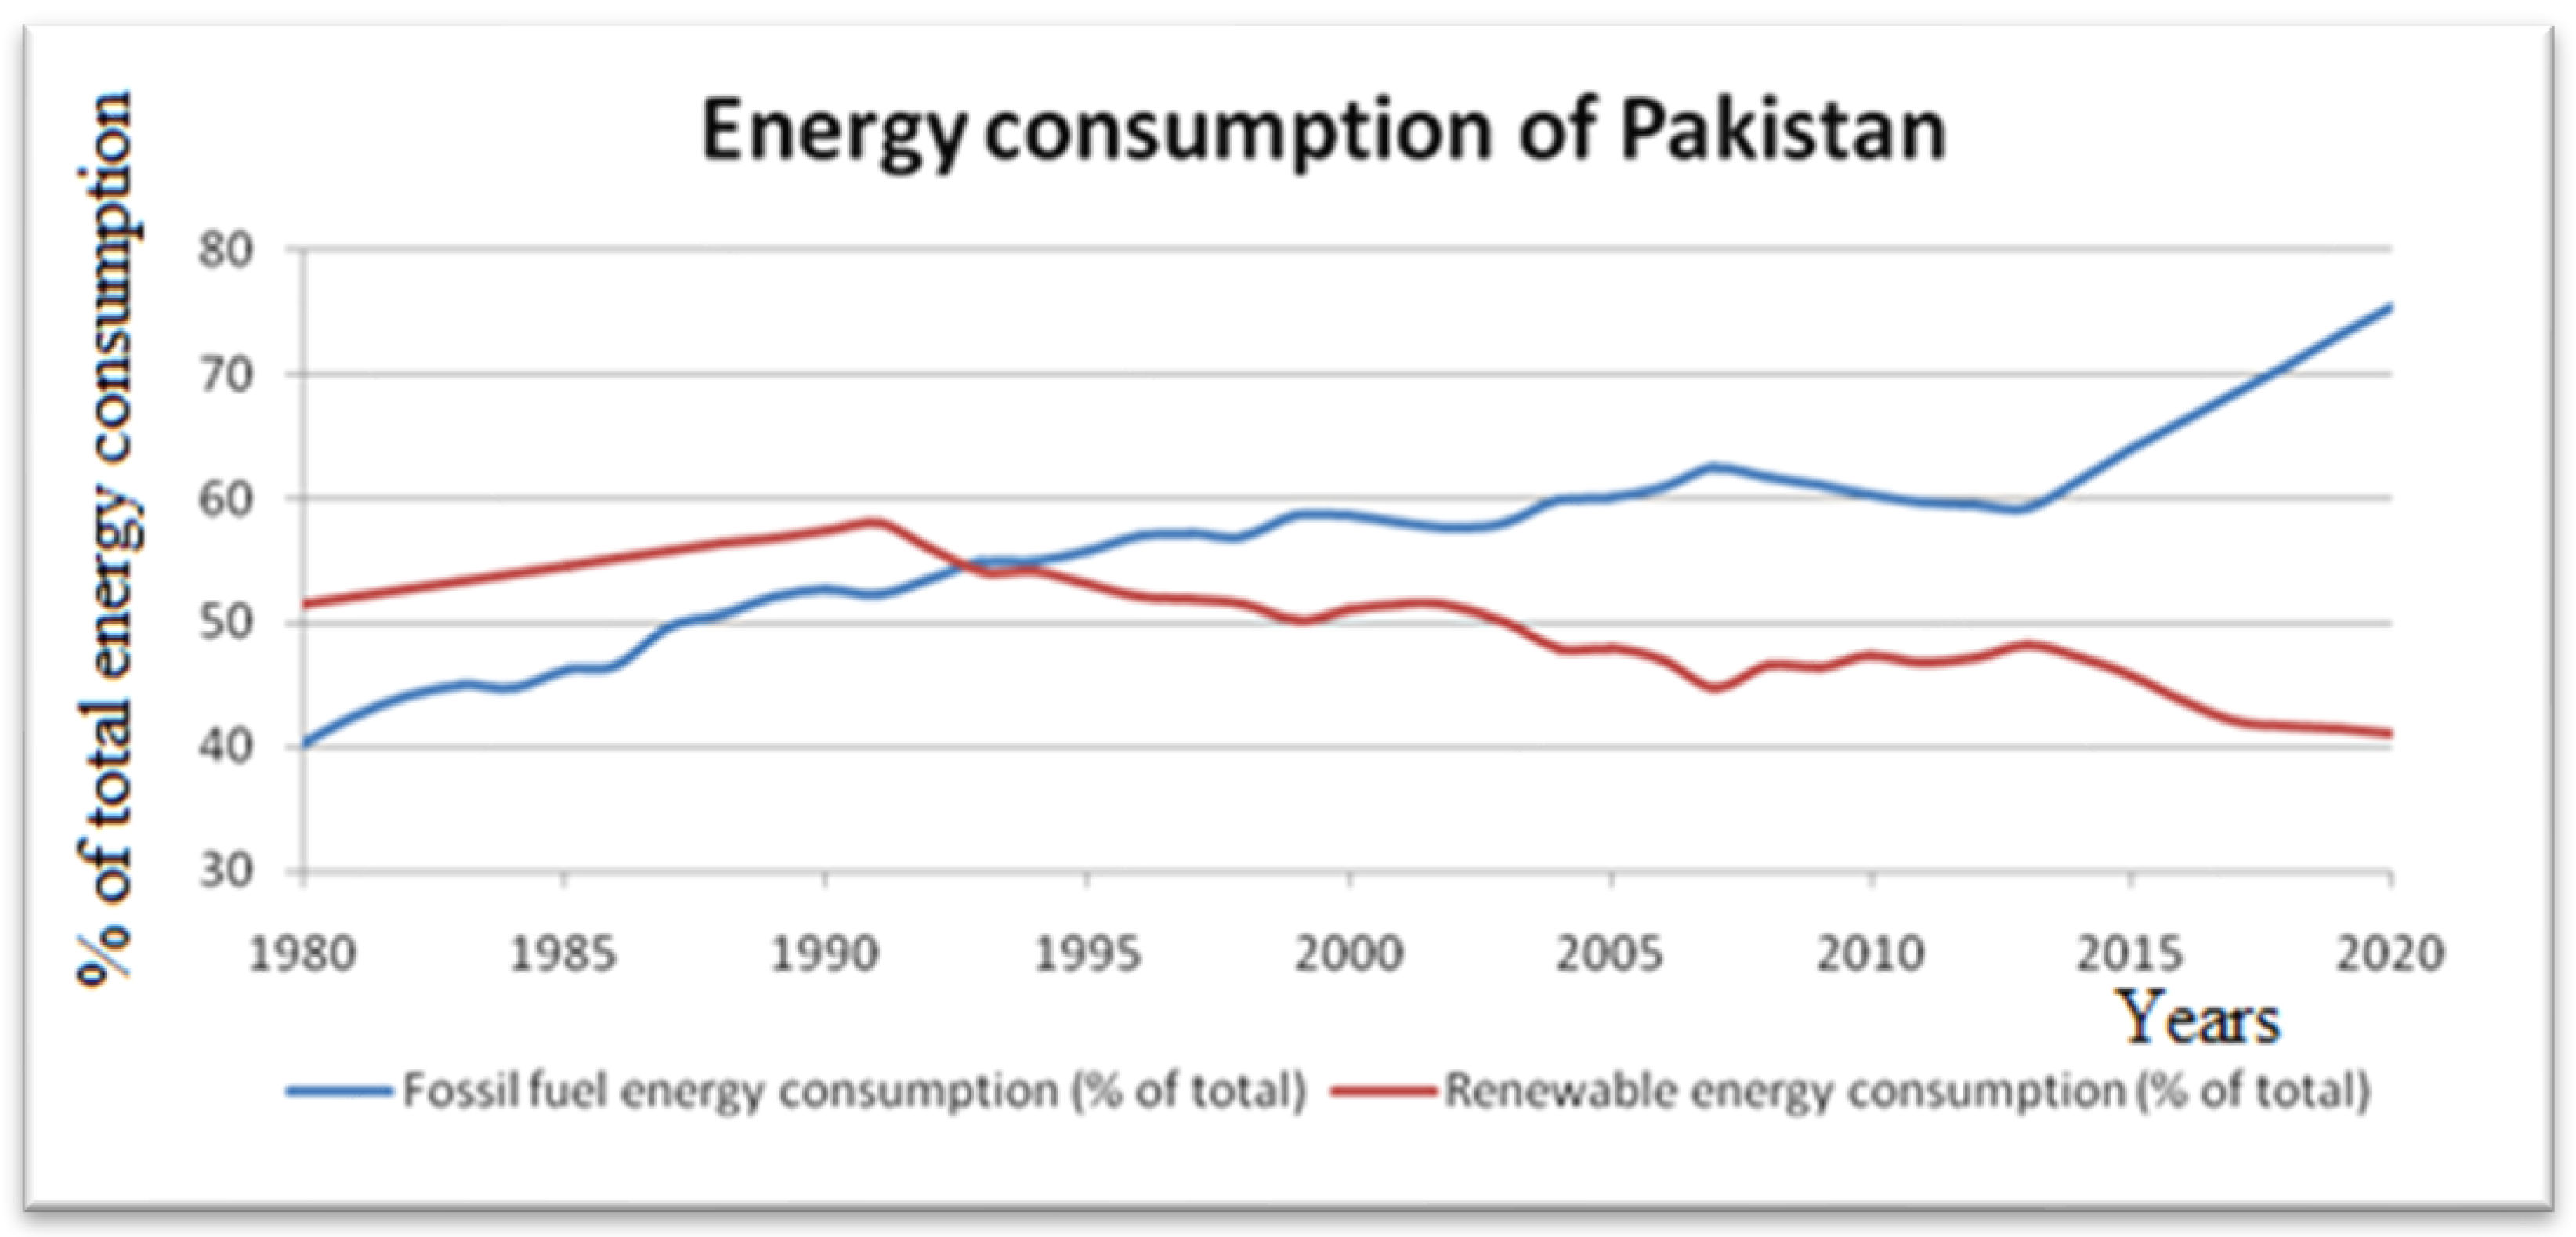
Figure 1 shows Pakistan FFEC and renewable energy consumption (RENEW) from 1980 to 2020. It can be observed that the use of FFEC and RENEW both have increased very rapidly in Pakistan, particularly during the last decade. EFP can be reduced by giving preference to renewable energy resources over the use of FFEC. Hadj [
10] pointed out that renewable energy resources help decline EFP.
This study explores the impact of FFEC and RENEW on EFP in Pakistan. This study is significant, as it uses the Non-linear ARDL (NARDL) estimation technique to analyze the impact of FFEC and RENEW on EFP in Pakistan. Not much literature has analyzed the dynamic relationship between energy consumption (EC) and EFP using recent econometric development. Only a few studies have tried to examine the impact of EC on EFP using the NARDL estimation technique [
10,
12]. This study will be a valuable addition to the existing literature.
2. Literature Review
Several studies in the literature have examined environmental degradation using the proxy of CO
2 emissions [
13,
14,
15]. Wackernagel et al. [
5] have used a broader way to measure environmental degradation by using the concept of EFP. Later on, several studies extended its application and connected the EFP with energy use [
10,
12,
16]. Not many studies have used the non-linear and asymmetric estimation technique on an individual country basis to examine the association between the concerned variables.
Majeed et al. [
12] examined the asymmetric effects of energy sources on EFP from 1971 to 2014. The study results show that only the negative shock of EC significantly increases EFP. Furthermore, an increase in oil consumption significantly increases EFP, and a decrease in coal and Biomass Energy Consumption (BMC) significantly improves EFP. Hadj et al. [
10] investigated the FFEC and BMC on EFP in Saudi Arabia from 1984–2017. The study concluded that an increase in FFEC significantly increases EFP, while BMC significantly declines EFP. Baz et al. [
11] examined the impact of EC on environmental quality measured by EFP in Pakistan from 1971–2014. The results show that positive shock in EC significantly increases EFP, while negative shock declines it.
Apart from the asymmetric effect, some literature is available which measures the linear analysis of EC on EFP. Rehman et al. [
17] empirically estimated that EC significantly increased EFP from 1974 to 2017 in Pakistan. Chunling et al. [
18] pointed out that government and public investment in energy significantly increased EFP from 1992 to 2018 in Pakistan. Sharif et al. [
19] pointed out that FFEC significantly enhances EFP in Turkey. They also stressed that FFEC significantly enhances EFP, while RENEW declines EFP in Turkey. Nathaniel [
20] showed that EC significantly increases EFP in Indonesia. Caglar et al. [
21] found that RENEW decreases EFP, while Non-RENEW increases EFP. Kongbuamai et al. [
22] investigated that RENEW and Non-RENEW both positively impact the EFP in BRICS countries.
Several studies have been conducted on the relationship between globalization and EFP, but the results were mixed. In some studies, globalization increases the EFP because it often involves increased transportation of goods and resources, leading to increased emissions from transportation sources such as ships, trains, and trucks. Additionally, globalization can lead to an increase in the consumption of goods and resources, leading to increased extraction and production, which have negative impacts on the environment. Additionally, globalization can lead to a loss of biodiversity, as natural habitats are destroyed to make way for development and resource extraction [
17,
23,
24,
25]. Conversely, several studies have examined that globalization can also lead to a decline in EFP. Globalization increases the efficiency in the production and distribution of goods, which can reduce the amount of resources used and emissions produced. Additionally, globalization can lead to the spread of technology and knowledge, which can help in promoting sustainable practices in various industries. Moreover, globalization facilitates trade in environmental goods and services, which can be helpful in promoting sustainable development [
26,
27,
28].
The results of previous studies conducted on the impact of urbanization on EFP are also mixed. Some studies revealed that urbanization increases EFP because the rising urban population fulfils their demand through massive energy consumption [
20,
29]. Meanwhile, some studies pointed out that urbanization reduces EFP as the increase in per capita income improves people’s living standard and motivates them to move toward environment-friendly activities. Furthermore, environmental agencies and government institutions also target the urban population to provide them with a clean environment. Some studies were conducted on the relationship between capital and EFP, which have explained that capital reduces EFP [
30,
31], while other studies found that capital increases EFP [
32,
33]. Education also plays a significant role in reducing EFP. Amjad et al. [
34] explored that primary school enrollment significantly deteriorates the environment in Pakistan, as people with primary education level do not care about the environment.
From the above literature review, it can be inferred that the impact of EC and globalization on EFP is unclear. This calls for the need to conduct further research on this relationship by using recent econometric development with the latest data set. It will bring the true picture of the relationship between the above-mentioned variables and provide a guideline to the policymakers for formulating policies that may be helpful in improving environmental quality in Pakistan.
3. Materials and Methods
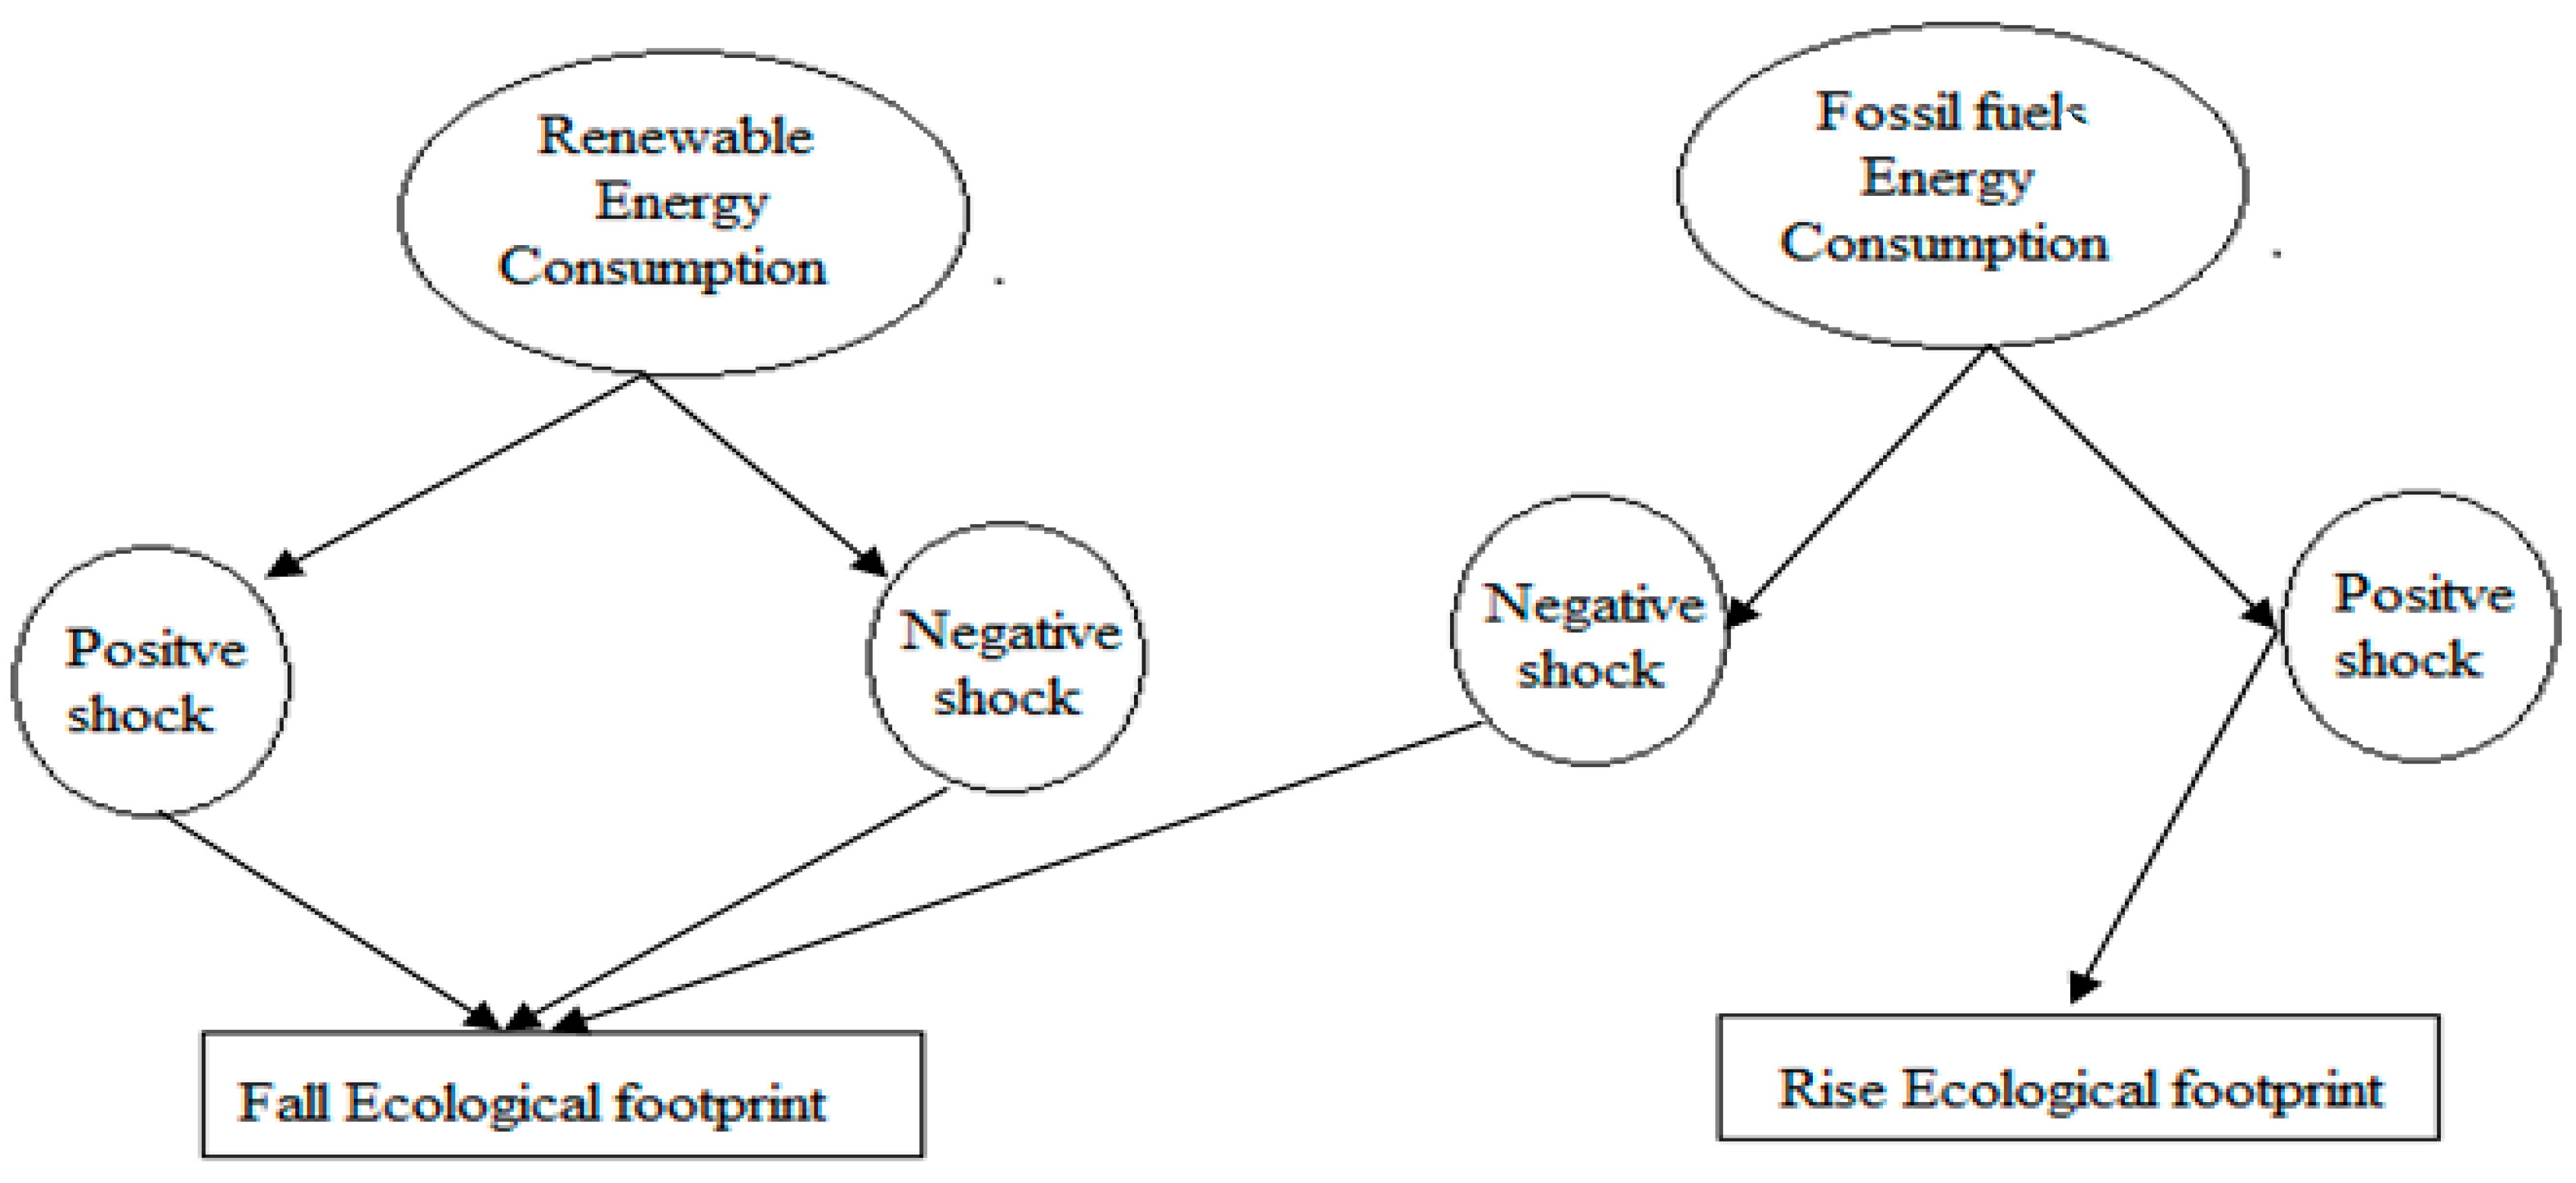
This section is started with a conceptual framework to examine the impact of EC on EFP in Pakistan. This study uses EFP as the proxy for environmental pollution. As discussed earlier, Pakistan has higher EFP than its biocapacity, which causes high environmental pollution. This study uses both FFEC and RENEW separately in the analysis. Since Pakistan has been facing ups and downs in the energy sector, it is decomposed into positive and negative series by the motivation of [
35]. The positive shock in FFEC increases EFP (10), while its negative shock declines it. Similarly, negative and positive series RENEW decrease EFP [
10]. The flow chart of the conceptual framework is presented in
Figure 2.
This study uses EFP as the proxy to measure environmental quality as a dependent variable. At the same time, FFEC and RENEW are the key explanatory variables measured in the percentage of total energy consumption. In contrast, education (EDU), capital (GFCF), globalization (GLOB), and urban population (URPOP) are used as the control variables. The study uses annual time series data for the period of 1980–2020. The sources and description of the variables are presented in
Table 1.
The study uses two models to examine the impact of
EC on
EFP in Pakistan. In models 1 and 2,
FFEC and
RENEW are used as the independent variables, respectively, along with control variables, namely education, capital, globalization, and urbanization, as shown in Equations (1) and (2).
The econometric models are:
Equations (3) and (4) can be used to explore the relationship between the variables. It is observed both FFEC and RENEW consumption have faced many fluctuations in Pakistan.
Pakistan’s energy sector has faced severe ups and downs, indicating that traditional econometric techniques are not appropriate for estimating the relationship between EC and EFP.
To study such models, [
35] espoused the new framework called the Non-linear Autoregressive Distributed Lag Model (
NARDL), which is the extended version of
ARDL developed by [
39]. For this purpose, Equations (5) and (6) are transformed as:
In Equations (7) and (8), the
LNFFEC and
LNRENEW are decomposed into positive series
LNFFEC+ and
LNRENEW+, and negative series as
LNFFEC− and
LNRENEW−. Its partial sum process can be written as:
After incorporating the error correction term in both models, we get:
In Equations (11) and (12), and , show the short-term impact of LNFFEC and LNRENEW on EFP. ECt−1 shows the error correction term, and the negative sign of shows the speed of dynamic adjustment for a stable model, whose value lies between 0 and −1. Here, , , and are the long-term coefficients of LNFFEC and LNRENEW on EFP.
The long-run asymmetries of LNFFEC and LNRENEW on EFP by the Wald test are presented as and .
Furthermore, the asymmetric cumulative multiplier effect of
LNFFEC+,
LNFFEC−,
LNRENEW+, and
LNRENW− on EFP are postulated as:
If , then and are the asymmetric long-run coefficients.
4. Results and Discussions
Table 2 presents the summary statistics of the model. The high value of the Jarque–Bera and insignificant probability values show that all series are normally distributed [
40,
41].
The NARDL approach is applicable if either series are stationary at level or at first difference. The energy sector faces many breaks; traditional unit root tests may provide misleading results. In such a situation, the Zivot–Andrews unit root test provides authentic results by incorporating structural breaks [
31].
Table 3 shows that all series become stationary at I (0) or I (1). I (0) shows that the series become stationary at level, while I (1) presents that the series become stationary at first difference.
Table 4 presents the results of the bound test to explore the long-run cointegration between energy consumption on EFP. In model 1, the F-statistics value lies between the lower and upper critical regions, providing inconclusive results. In this case, the error correction term is used to check the existence of the long-run relationship between the variables [
42]. In
Table 5, the ECM of model 1 is negative, which is statistically significant and shows the existence of a long-run relationship between FFEC and EFP [
43]. In model 2, the F-statistics value is greater than the critical value, which indicates that long-run cointegration exists between RENEW and EFP.
Table 5 presents the detailed results of NARDL of models 1 and 2. In model 1, the error correction term (ECM) value is −0.7945, which means that, annually, 79.45% of disequilibrium is recovered and moved toward equilibrium after (1/0.7945 = ) 1.26 years. In model 2, the ECM value is stable, which shows that after (1/0.7040 = ) 1.42 years it reaches equilibrium.
In model 1, the LNFFEC is decomposed into positive (LNFFEC
+) and negative (LNFFEC
−) series, as discussed in Equation (5). It shows that an increase in the LNFFEC
+ significantly increases EFP in the long run [
11]. Meanwhile, the decline in LNFFEC
− significantly reduces EFP in the long run. These results are opposite to the results of [
12]. The Wald test’s asymmetric behavior of LNFFEC is checked, as presented in
Table 6. The significant value of F-statistics shows that fossil fuels increase the EFP in Pakistan. This indicates that an increase in FFEC increases CO
2 emissions, adversely affecting the natural resources and increasing EFP.
In model 2, the LNRENEW is decomposed into positive and negative series, as discussed in Equation (6). A one-unit increase in LNRENEW
+ significantly declines the EFP in Pakistan [
10]. On the other hand, a one-unit decline in LNRENEW
− insignificantly declines EFP. The Wald test shows the existence of an asymmetric relationship of LNRENEW. These results show that EFP can be declined by not giving preference to FFEC over alternative energy consumption based on renewable energy resources (wind, solar, hydropower, bioenergy, and biomass). Furthermore, RENEW is relatively cheap and does not pollute the environment.
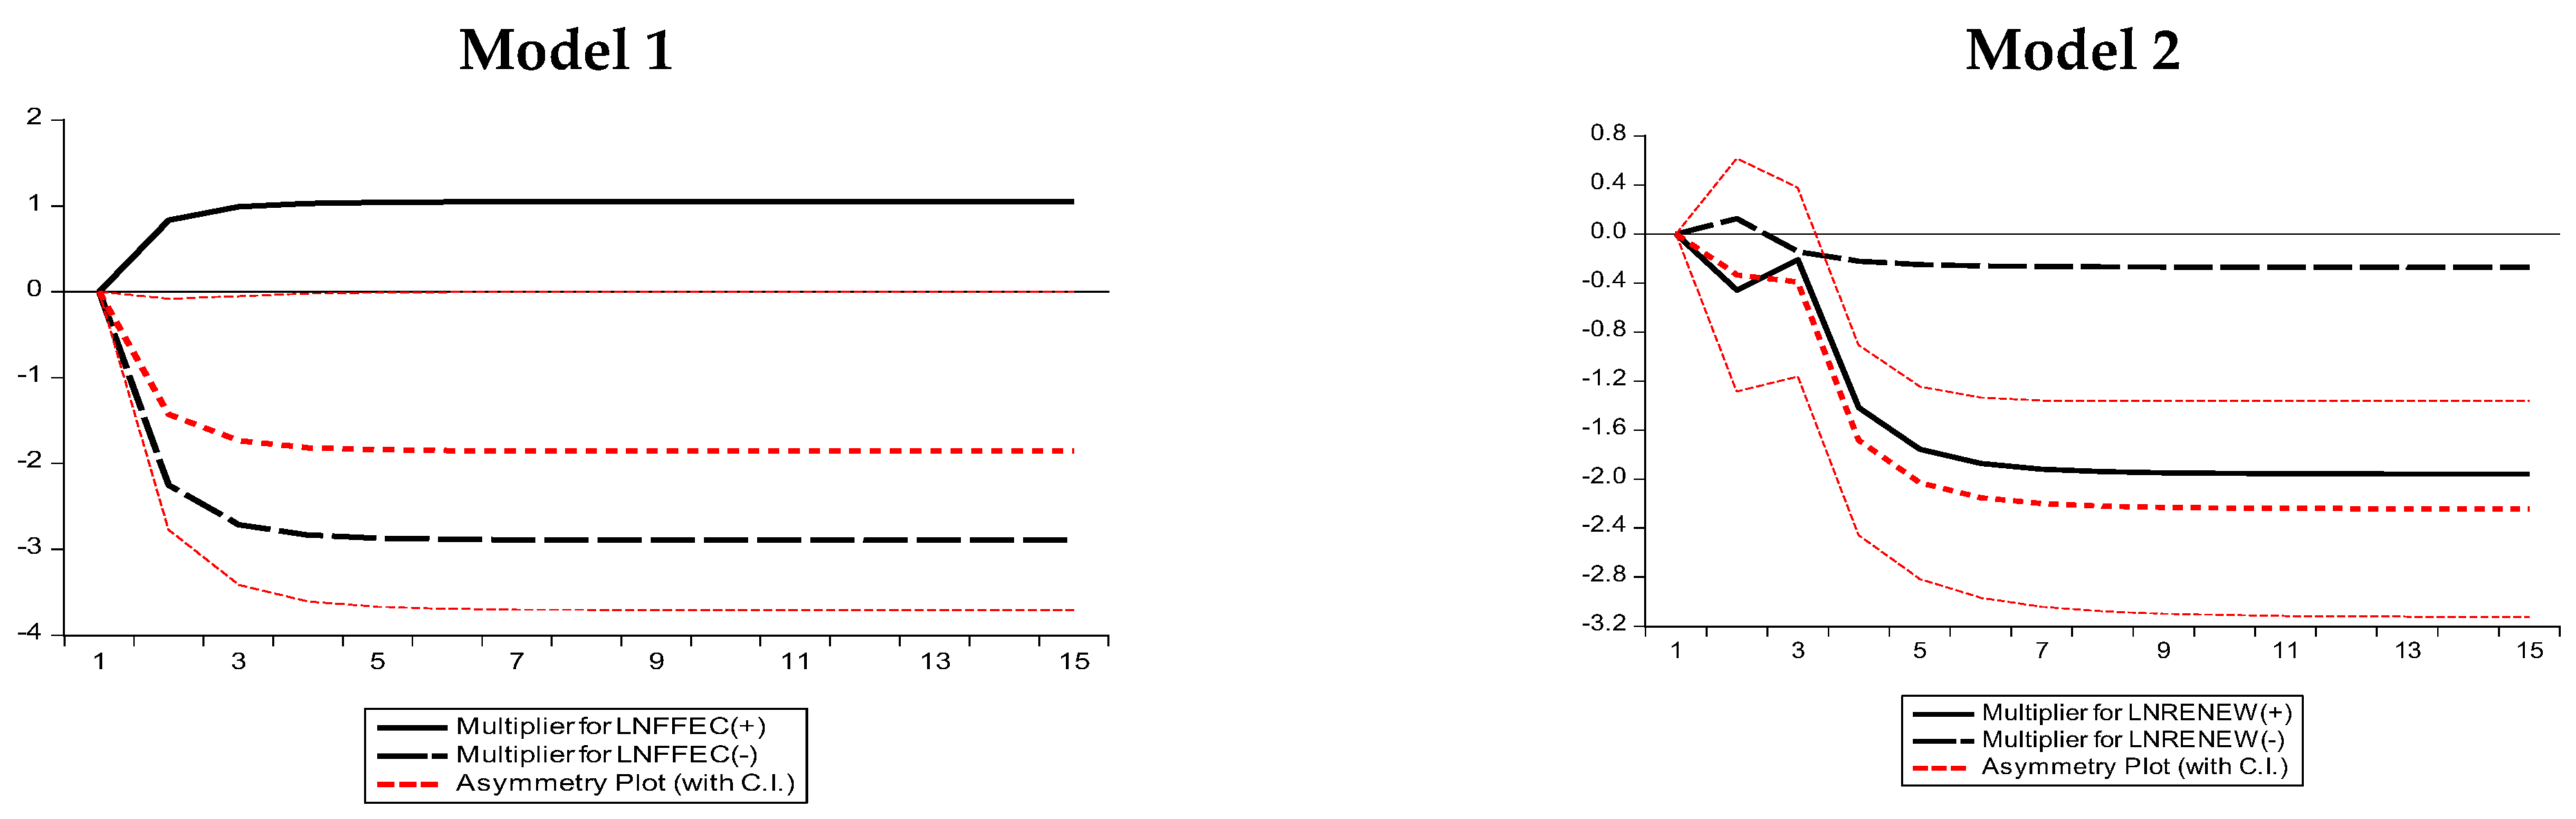
The dynamic multiplier effect of LNFFEC and LNRENEW are plotted in
Figure 3, which shows the adjustment of the new equilibrium after positive and negative shocks. The solid black line shows the non-linear adjustment of EFP due to the positive shock, while the black dotted line shows the adjustment of EFP due to negative shock. The red dotted line indicates the asymmetric pattern of positive and negative shocks.
Figure 3 verifies the NARDL results that positive shocks of FFEC increase EFP, negative shock decreases EFP, and both positive and negative shocks of RENEW decline EFP in Pakistan.
This study finds mixed results of control variables capital, globalization, and urbanization on EFP. As far as LNGFCF is concerned, in model 1, a one-unit increase in the LNGFCF declines EFP by 0.1647 percent [
30,
31,
33]. Meanwhile, in model 2, with a one-unit increase in the LNGFCF, the EFP increases by 0.2205 percent [
33].
The impact of globalization on EFP also turns up ambiguous. In model 1, the LNGLOB significantly increases EFP [
17,
23,
25]. This relationship shows that foreign investors prefer to invest in dirty technologies and exploit natural resources by investing in low-cost production techniques. In model 2, the LNGLOB significantly declines EFP [
26,
28]. Globalization can improve environmental quality by exchanging environmentally-friendly technologies.
The urban population (LNURPOP) also shows mixed results. In model 1, the LNURPOP declines EFP [
30,
31]. Urbanization deteriorates the EFP because an increase in per capita income enhances people’s living standards and motivates them to engage in environmentally-friendly activities. Environmental agencies and government institutions also can help the urban population to achieve a clean environment. Meanwhile, in model 2, the LNURPOP significantly increases EFP [
20,
29]. It may be due to the reason that most of the urban population fulfils their energy requirements through the massive use of FFEC. In both models, LNEDU significantly increases EFP [
34], which means primary education deteriorates Pakistan’s environment because low education people do not care about the environment.
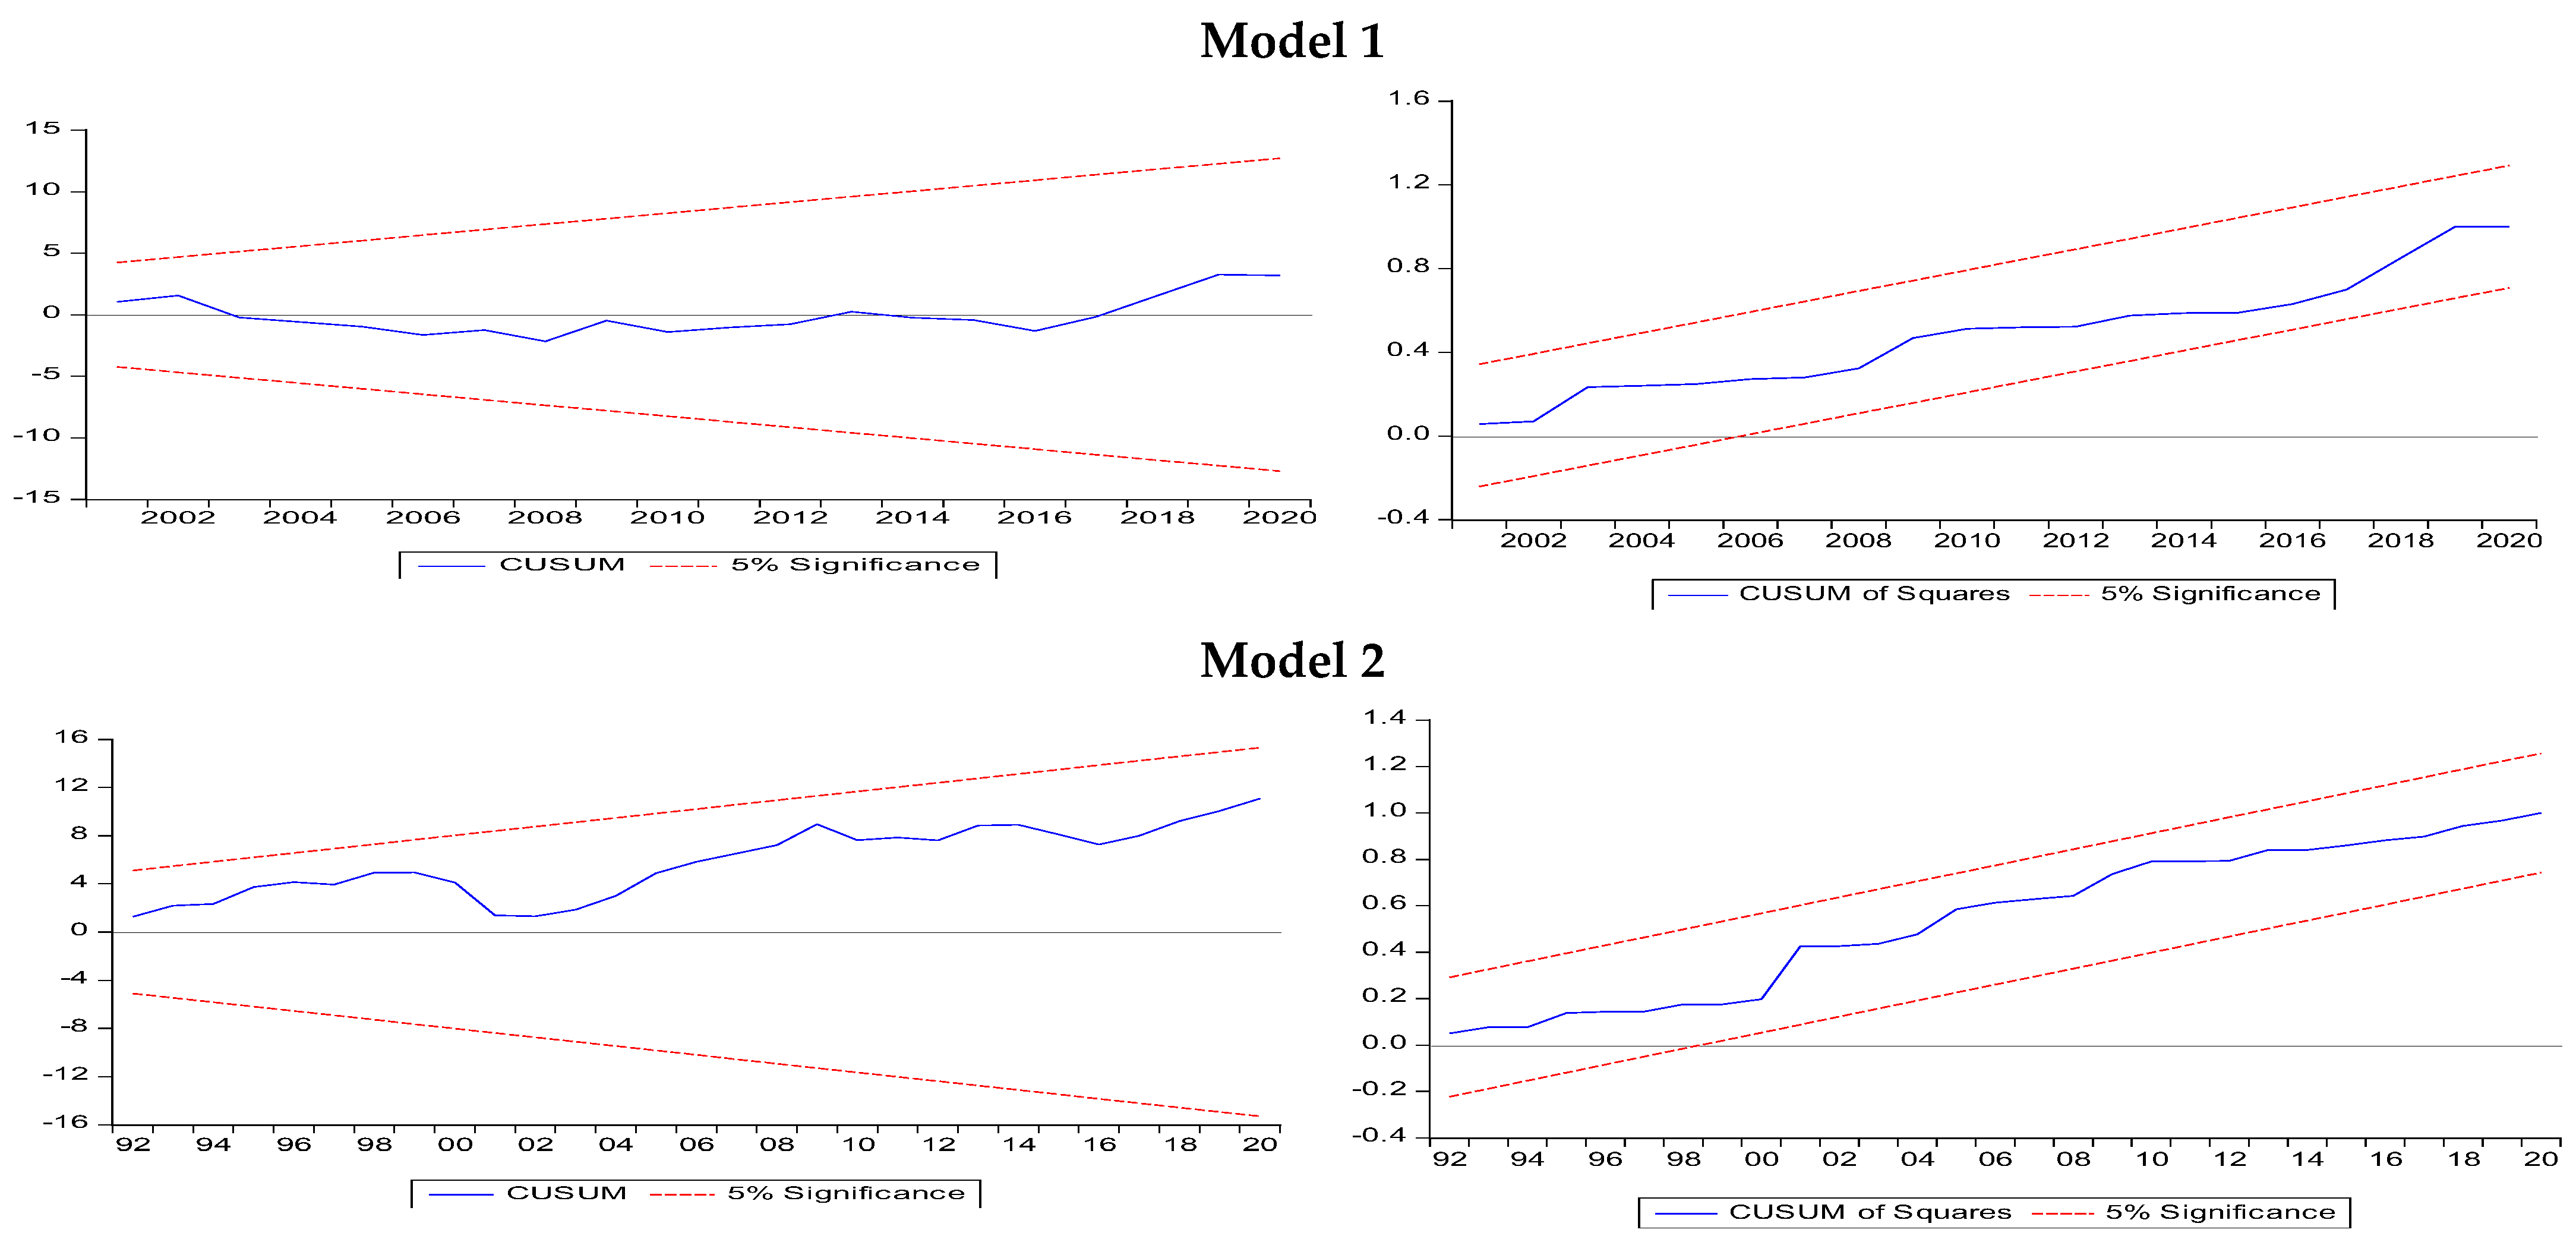
The stability tests are presented in
Figure 4. The trend lines of the CUSUM and CUSUMQ graphs lie between the critical bounds, which means that both models are stable.
The diagnostic tests are presented in
Table 7. The insignificant probability values show no evidence of serial correlation and heteroskedasticity. Moreover, both models are correctly specified and are also normally distributed.
5. Conclusions and Recommendations
This study examines the causes of the high ecological footprint in Pakistan. For this purpose, the asymmetric relationship between EC and EFP is examined. The ecological footprint is used as the dependent variable, and FFEC and RENEW are used as the proxy of EC in two separate models. In this study, the annual time series data from 1980 to 2020 have been used for analysis purposes. The Zivot–Andrews unit root test has been applied to explore the authentic results after checking the order of integration of the variables. The bound test verified the long-run cointegration, which shows the existence of long-run cointegration between EC and EFP. Both models’ long-run and short-run coefficients are estimated using NARDL. The results show an asymmetric long-run impact of EC on EFP. The positive shocks of FFEC significantly increase EFP, while its negative shocks decline the EFP.
On the other hand, both positive and negative shocks in RENEW decrease the EFP. This study suggests that the government of Pakistan should promote the positive shocks of RENEW and negative shocks in FFEC for reducing EFP. For this purpose, the government should encourage the households, industries, and transport sector to use RENEW in all economic activities. Furthermore, the government should formulate and strictly implement policies that are helpful in reducing EFP. The major limitation of this study is that its analysis is confined to the Pakistani economy. This research work can be extended to regional levels, such as South Asian countries, ASEAN countries, and African countries. It is left to future researchers to extend this work to a group of countries using the latest econometric techniques on appropriate variables for empirical analysis.


 ,
, 
