Abstract
Landslides are one of the most serious geological disasters in oil and gas pipelines. According to investigations, the cross-cutting relationship between landslides and pipelines can be divided into three types: pipeline longitudinal crossing landslide, pipeline transversely crossing landslide, and pipeline oblique crossing landslide. This different cross-cutting relationship is one of the important factors affecting pipeline landslide disasters. As a result, it is necessary to study the stress and deformation characteristics of oil and gas pipelines under different cross-cutting relationships, which is of great significance for the prevention and control of oil and gas pipeline landslides. In this paper, an ideal pipe-soil coupling interaction model of oil and gas pipeline oblique crossing landslide was established using FLAC3D. The influence of the buried depth of the pipeline, the displacement of the sliding body, and the different intersection angles of landslide and pipeline on the deformation and stress of the pipeline under the action of a landslide is analyzed, and a typical case of pipeline oblique crossing landslide is used for analysis. The results demonstrated that the stress of pipeline oblique crossing landslide is complex, and the stress concentration is obvious at the shear outlet and the trailing edge of the landslide. The stress at the shear outlet is the largest, which should be regarded as the key location. The displacement and stress of pipeline oblique crossing landslide are obviously affected by the displacement of the sliding body and the buried depth of the pipeline. The displacement and stress of the pipeline increase significantly with the increase of the displacement of the sliding body. With the increase of pipeline buried depth, the displacement of the pipeline shows an overall decrease, and when the buried depth of the pipeline is 3–3.5 m, the displacement and stress are close to the peak, indicating that the buried depth is of great risk. The intersection angle between the pipeline and landslide has a significant effect on the stress of the pipeline. The smaller the intersection angle, the safer the pipeline is.
1. Introduction
As one of the important transportation modes of onshore oil and gas, pipeline transportation has the advantages of safety, environmental friendliness, and high efficiency. It has become one of the most important oil and gas transportation modes in the world. As a result, pipeline safety affects the stable and healthy development of the global economy [1,2,3]. However, as a long-distance linear project, oil and gas pipelines traverse different geological environments. Especially in mountainous areas, geological disasters have the characteristics of diversity, complexity, and universality, which bring great challenges to the safety prevention and control of oil and gas pipelines. By 2021, the length of China’s oil and gas pipeline network reached 150,000 km, and it is expected that by 2025, the length of China’s oil and gas pipeline will reach 240,000 km [4]. Due to the increasing mileage of pipeline construction and the susceptibility of geological disasters in mountainous areas, geological disasters have become an important threat to the safe operation of pipelines. According to incomplete statistics, up to 2014, there were 282 geological disasters along the Lanzhou-Chengdu-Chongqing oil pipeline, Zhonggui gas pipeline, and West-East gas pipeline in China, among which 107 were landslides, accounting for 38% [5]. Thus, landslides are one of the main geological disasters threatening the safe operation of pipelines [6,7,8]. Under the action of a landslide, the pipeline is pushed or pulled by soil, resulting in pipeline deformation and rupture, which brings great challenges to pipeline operation and management (Table 1) [9,10,11].

Table 1.
Pipeline disaster cases caused by landslides.
The way of pipeline crossing landslide is very important to study the deformation and failure characteristics of pipelines. Therefore, Brodavkin [12] first divided pipelines into oblique and parallel types according to the relationship between pipelines and slide direction. The classification method is simple, but it does not show the characteristics of landslides. On the basis of Brodavkin, Lin et al. [13] established the classification system of pipeline landslide by scientific induction in 2009. According to the cross-cutting relationship between pipelines and landslides, the pipeline crossing landslide was divided into three types: pipeline transversely crossing landslide, pipeline longitudinal crossing landslide, and pipeline oblique crossing landslide (Figure 1). At present, this naming method has been widely used.

Figure 1.
Cross-cutting relationship between pipelines and landslides: (a) pipeline transversely crossing landslide; (b) pipeline longitudinal crossing landslide; and (c) pipeline oblique crossing landslide [13].
The response state of pipelines under landslides and the pipe–soil interaction are the basis of studying pipeline-landslide disaster mechanism. Since the 1970s, scholars at home and abroad have done many studies on the mechanical response state of pipeline landslide and the law of pipe–soil interaction by using three methods: analytical method, numerical simulation, and model test. Despite the rapid development in recent years, no obvious consensus has been achieved. In 1995, Rajani et al. [14] analyzed the force and deformation characteristics of the pipeline for the first time by the analytic method; they pointed out that with the aggravation of the landslide deformation, the pipeline deviation would increase continuously. On the basis of Rajani, O’Rourke [15] established an elastic-plastic model of the pipe–soil interaction and concluded that the maximum stress of the pipeline increased with the increase of the buried depth of the pipeline, soil cohesion, soil density, and internal friction angle. Cocchetti et al. [16,17] assumed the pipe as a beam element, on the basis of the elastoplastic model of pipe–soil interaction established by O’Rourke, and applied nonlinear theory to study the pipe–soil contact interaction. Long et al. [18] adopted the elastic foundation beam method based on the Winkler model when analyzing the characteristics of pipeline deformation and failure. Audibert [19] studied the influence of different pipe diameters on the side earth pressure of the pipeline through the test method, and believed that the smaller the pipe diameter, the greater the influence of the side earth pressure on the pipeline. Calvetti et al. [20] used the pulley wire rope to simulate the axial force system of the pipeline, and then used the sinking soil box to simulate the landslide. Georgiadis et al. [21] carried out an analysis experiment on the response state of the pipeline and believed that the decisive factor of the force on the pipeline was the sliding velocity of the sliding body. Yoshizaki and Karimain et al. [22,23] studied the force law of the pipeline under the action of backfill soil and sliding body through a series of experiments; they believed that backfill material with light density could significantly reduce the influence of the sliding body on the damage of the pipeline. Yatabe [24] used Abaqus to establish a pipeline landslide model and analyzed the displacement variation rule of elbow under large ground deformation. Evans et al. [25] established a pipeline crossing landslide model. Assuming that the pipe is a linear elastic material and the contact between the pipe and soil adopts the common node technology to transfer the force between the pipe and the sliding body, the deformation and failure characteristics of the pipe are analyzed. Zhou et al. [26] created a vertical pipe-landslide model for pipelines and landslides, adopted Moore–Coulomb and Ramberg–Osgood constitutive models for landslides and pipelines, respectively, and analyzed the deformation and failure characteristics of pipelines under different factors.
From the above studies, it can be seen that many previous studies have been done on the response state of pipelines under landslides and the pipe–soil interaction. However, when laying pipelines in landslide-prone areas, the influence of different buried depths of pipelines, different sliding displacements, and the cross-cutting relationship between pipelines and landslide sliding directions on the mechanical response of pipelines has still not been studied in depth. Therefore, in this paper, FLAC3D numerical simulation software is used to establish an ideal model of completely coupled tube–soil interaction of pipeline oblique crossing landslide. It has important theoretical and practical significance to provide the basis for the risk assessment and prevention of pipeline landslides. The novelty of this work is as follows:
- (1)
- The stress mechanism of pipelines at different intersection angles of landslides and pipelines.
- (2)
- The influence of buried depths and sliding displacements on the stress of gas pipeline oblique crossing landslide.
2. Influence of the Buried Depth of Pipeline and Displacement of Sliding Body on Pipeline Oblique Crossing Landslide
FLAC3D can be used to simulate the mechanical properties and analyze the plastic flow of soil, rock, and other materials, which is widely used in the field of geotechnical engineering [27,28,29]. Therefore, in this study, FLAC3D6.0 was used to establish an ideal model of pipeline oblique crossing landslide [30,31], and further analyze the influence of buried depth, the displacement of the sliding body, and buried position on stress and deformation under the effect of a landslide.
2.1. Establishment of Model
This paper mainly studies the mechanical response of pipeline oblique crossing landslide. According to the relationship between landslides and pipelines, and considering the boundary effect of the model, a pipeline-landslide ideal model with a landslide width of 60 m, a landslide height of 45 m, a sliding body thickness of 2–10 m, and a slope of 30–45° was established (Figure 2). The intersection angle between the pipeline and landslide is 45°, the buried depth of the pipeline is taken as seven cases: 1 m, 1.5 m, 2 m, 2.5 m, 3 m, 3.5 m, and 4 m, respectively, and the maximum displacement of the sliding body is taken as four cases: 1 m, 2 m, 3 m, and 4 m, respectively, for analysis. In the process of modeling and simulation, the parameters related to the pipeline remain unchanged.
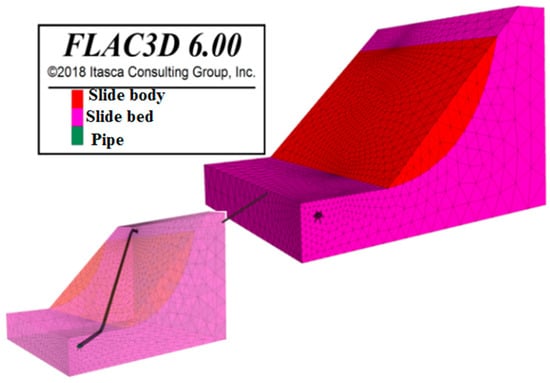
Figure 2.
Ideal piping-landslide model with complete coupling.
The landslide is divided into sliding body and sliding bed and divided by a triangular mesh element. In the modeling process, the mesh of the pipeline and the sliding body around the pipe are encrypted. In the calculation process, the Moore–Coulomb model is adopted for the landslide, and the velocity boundary conditions with normal constraints are used around and at the bottom of the model, and the slope body adopts the free boundary. The pipeline model is built based on the landslide model using the SHELL element in FLAC3D6.0. Due to the large stiffness difference between the pipeline and the sliding body, a pipe–soil interface is established between the pipeline and the sliding body to reduce the large error caused by the stiffness difference (Figure 3). In the calculation process, the elastic-plastic constitutive model is adopted and applies the gravity load.
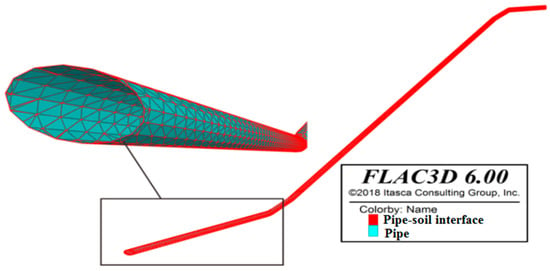
Figure 3.
Pipe–soil interface models.
2.2. Geotechnical Parameters
The physical and mechanical parameters of the landslide are shown in Table 2, while the parameters of the pipeline and pipe–soil interface are shown in Table 3 and Table 4.

Table 2.
Physical and mechanical parameters of the landslide (from experimental data).

Table 3.
Parameters of the pipeline [11].

Table 4.
Parameters of the pipe–soil interface [11].
2.3. Influence of Buried Depth and Displacement of Sliding Body on Force of Pipeline
In order to study the influence of buried depth and sliding displacement on the mechanical response of the pipeline, the corresponding pipe-soil coupling models with seven different buried depths were established respectively when the maximum sliding body was 1 m, 2 m, 3 m, and 4 m. During the analysis, the intersection angle between the pipeline and the landslide was 45°.
(1) Mechanical response of pipeline with the displacement of sliding body
In order to analyze the variation of the mechanical response of the pipeline with the displacement of the sliding body, a pipe-soil coupling model with a constant buried depth of 2 m was randomly selected to analyze the simulation results.
(2) Mechanical response of pipeline with buried depth
Figure 4 shows the combined displacement cloud diagram of the sliding body under different maximum displacement conditions when the buried depth of the pipeline is 2 m. Figure 5 shows the combined displacement cloud diagram of the sliding body under different buried depths when the displacement of the sliding body is 2 m. It shows that the overall distribution characteristics of combined displacement are consistent under the conditions of different maximum sliding displacements and different buried depths of the pipeline because the buried depth of the pipeline does not change much, and the relative plane position relationship between the pipeline and landslide is unchanged. However, due to the existence of the pipeline, the continuity distribution characteristics of landslide displacement were broken, and the sliding displacement in the buried position of the pipeline was the smallest, which increased from the center of the pipeline to both sides.
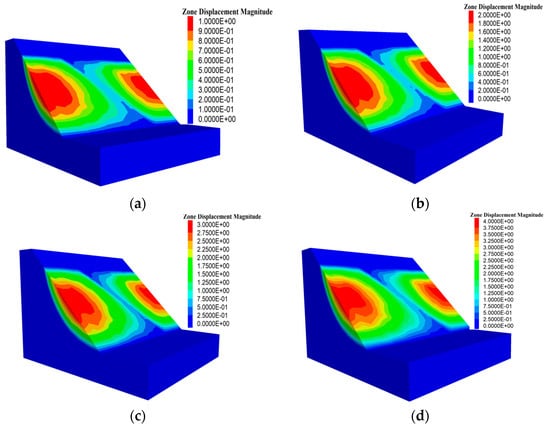
Figure 4.
Combined displacement cloud diagram of the sliding body under different displacement conditions when the buried depth of the pipeline is 2 m: (a) the maximum displacement of the sliding body is 1 m; (b) the maximum displacement of the sliding body is 2 m; (c) the maximum displacement of the sliding body is 3 m; and (d) the maximum displacement of the sliding body is 4 m.
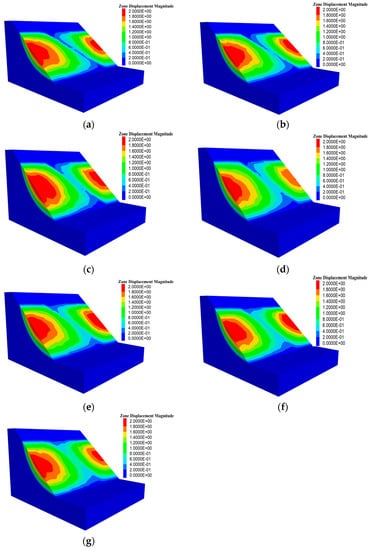
Figure 5.
Combined displacement cloud diagram of the sliding body under different buried depth conditions when the displacement of the sliding body is 2 m: (a) the buried depth is 1 m; (b) the buried depth is 1.5 m; (c) the buried depth is 2m; (d) the buried depth is 2.5 m; (e) the buried depth is 3 m; (f) the buried depth is 3.5 m; (g) the buried depth is 4 m.
Figure 6 shows the combined displacement cloud diagram of the pipeline under different maximum displacement conditions of the sliding body when the buried depth of the pipeline is 2 m, and the shear stress distribution diagram is in the XZ direction. Figure 7 shows the combined displacement cloud diagram of the pipeline under different buried depth conditions when the sliding displacement is 2 m, and the shear stress distribution diagram is in the XZ direction. It can be seen from the cloud diagram that the overall distribution characteristics of the pipeline combined displacement and shear stress cloud diagram do not change under the conditions of different maximum displacement of the sliding body and different buried depths of the pipeline. The size distribution of pipeline displacement is consistent with that of the displacement of the sliding body, that is, the position of sliding displacement is large, the pipeline displacement is relatively large, and the position of sliding displacement is small, the pipeline displacement is relatively small. It can be seen from the shear stress distribution in the XZ direction that stress concentration is obvious at the shear outlet and the trailing edge of the landslide, and the two stress directions are opposite. The shear stress at the trailing edge of the landslide is opposite to the direction of the free face, while the shear outlet of the landslide shows the stress shear in the same direction as that of the free face under the effect of landslide pushing. The absolute value of stress at the shear outlet is the largest, which should be regarded as the key location.
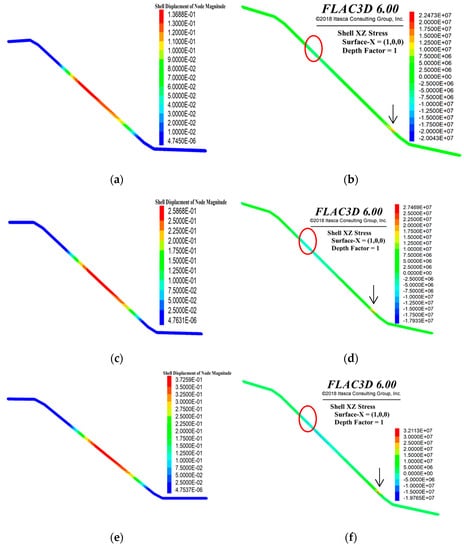
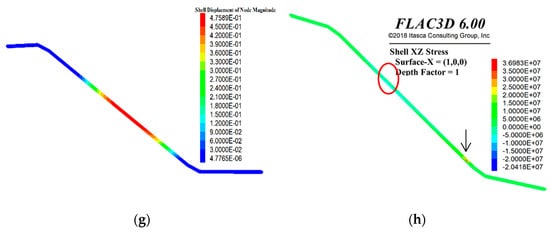
Figure 6.
Combined displacement and stress cloud diagram of the pipeline under different displacement conditions when the buried depth of the pipeline is 2 m: (a) combined displacement of the pipeline when the displacement of the sliding body is 1 m; (b) stress of the pipeline when the displacement of the sliding body is 1 m; (c) combined displacement of the pipeline when the displacement of the sliding body is 2 m; (d) stress of the pipeline when the displacement of the sliding body is 1 m; (e) combined displacement of the pipeline when the displacement of the sliding body is 3 m; (f) stress of the pipeline when the displacement of the sliding body is 3 m; (g) combined displacement of the pipeline when the displacement of the sliding body is 4 m; (h) stress of the pipeline when the displacement of the sliding body is 4 m.
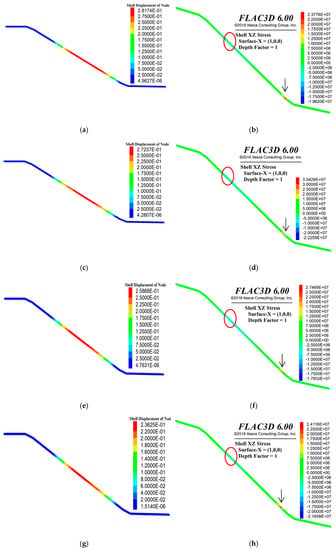
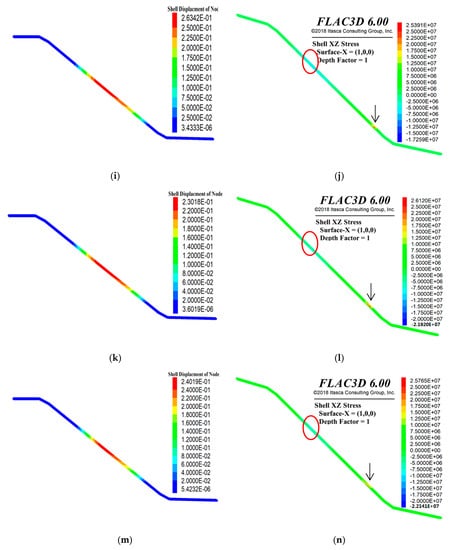
Figure 7.
Combined displacement and stress cloud diagram of the pipeline under different buried depths when the displacement of the sliding body is 2 m: (a) combined displacement of the pipeline when the buried depth is 1 m; (b) stress of the pipeline when the buried depth is 1 m; (c) combined displacement of the pipeline when the buried depth is 1.5 m; (d) stress of the pipeline when the buried depth is 1.5 m; (e) combined displacement of the pipeline when the buried depth is 2 m; (f) stress of the pipeline when the buried depth is 2 m; (g) combined displacement of the pipeline when the buried depth is 2.5 m; (h) stress of the pipeline when the buried depth is 2.5 m; (i) combined displacement of the pipeline when the buried depth is 3 m; (j) stress of the pipeline when the buried depth is 3 m; (k) combined displacement of the pipeline when the buried depth is 3.5 m; (l) stress of the pipeline when the buried depth is 3.5 m; (m) combined displacement of the pipeline when the buried depth is 4 m; (n) stress of the pipeline when the buried depth is 4 m.
Table 5 and Table 6 show the maximum displacement and stress of the pipeline under different displacements of the sliding body and different buried depths of the pipeline, respectively, and Figure 8 shows the corresponding curves. The displacement and stress of the pipeline are significantly affected by the displacement of the sliding body, and the displacement and stress of the pipeline increase significantly with the increase of the displacement of the sliding body. The influence of pipeline-buried depth on displacement and stress of the pipeline is obvious under the effect of the landslide. With the increase of pipeline-buried depth, the displacement of pipeline shows an overall decrease, while stress shows an overall increase. However, with the increase of the buried depth of the pipeline, due to the difference of stress and strain in different parts of the sliding body, the pushing effect on the pipeline is different. Furthermore, the displacement and stress of the pipeline fluctuate with the increase of the buried depth of the pipeline. When the buried depth of the pipeline is 3–3.5 m, the displacement and stress are close to the peak, indicating that the buried depth is of great risk. Furthermore, the pipeline is in a failure state when the displacement of the sliding body is greater than 1 m and the buried depth of the pipeline is greater than 1.5 m, so the displacement of the sliding body should be strengthened to give an early warning in time.

Table 5.
Maximum displacement of the pipeline under different sliding displacements and different buried depths (mm).

Table 6.
Maximum stress of the pipeline under different sliding displacements and different buried depths (Pa).
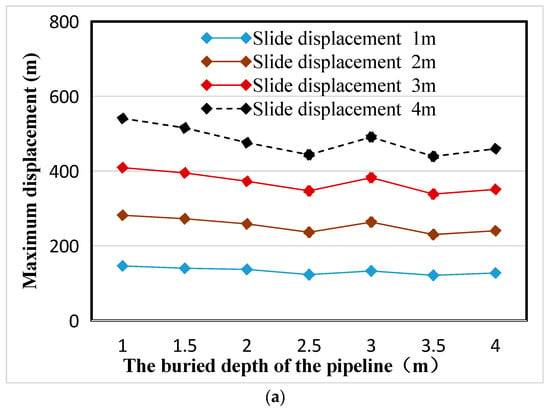
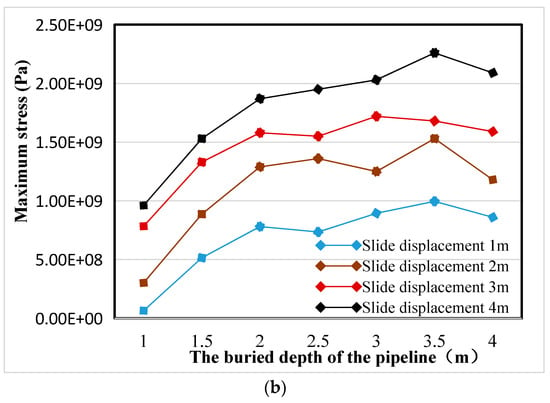
Figure 8.
Maximum displacement and stress of the pipeline under different buried depths and different sliding displacements: (a) maximum displacement and (b) maximum stress.
In order to analyze the variation of the mechanical response of the pipeline with the buried depth, a pipe-soil coupling model with a constant sliding displacement of 2 m was randomly selected to analyze the simulation results.
3. Effect of Intersection Angle between Pipeline and Landslide on Mechanical Response of Pipeline
The stress characteristics are not consistent for different intersection angles of the pipeline and landslide. Therefore, different intersection angles of the pipeline and landslide will affect the deformation and failure of the pipeline. This paper studies the variation law of pipeline displacement under different intersection angles. Seven cases of the intersection angle between the pipeline and the landslide are 0°, 15°, 30°, 45°, 60°, 75° and 90°, the buried depth of the pipeline is 2 m, and the maximum displacement of the sliding body is 4 m for analysis.
Figure 9a–n show the combined displacement cloud diagram of the sliding body and pipeline under different intersection angles of the pipeline and landslide (0°, 15°, 30°, 45°, 60°, 75° and 90°). Due to the different intersection angles between the pipeline and the landslide, the displacement field and the size of the sliding body vary. When the intersection angle is 0°, as shown in Figure 9a, the displacement field of the pipeline centered around on both sides of the symmetrical distribution; with the increase of intersection angle, the displacement becomes a more uneven distribution. The symmetry of displacement distribution on both sides of the pipeline becomes worse and worse, and the symmetric distribution of displacement on both sides of the sliding body centered on the pipeline appears until the intersection angle increases to 90°, as shown in Figure 9m. The distribution of pipeline displacement varies with the intersection angle between the pipeline and landslide. When the intersection angle is 0–45°, the pipeline displacement distribution is similar, whereas when the intersection angle is 45–90°, the pipeline displacement distribution is not similar. It can be seen that a 45° intersection angle between the pipeline and landslide is the cut-off point for force change of the pipeline. The main reason is that when the intersection angle is greater than 45°, the pipeline no longer intersects the shear outlet of the landslide, but intersects the boundary on both sides of the landslide, and the force characteristics change significantly.
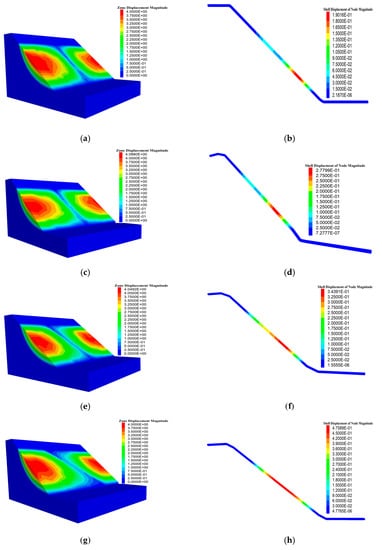
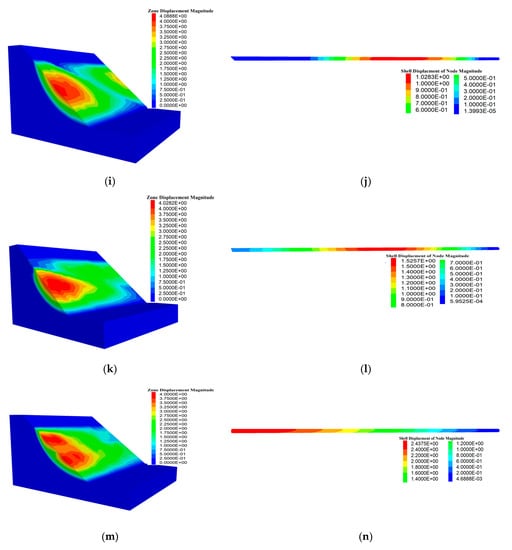
Figure 9.
Combined displacement cloud diagram of the sliding body and pipeline under different intersection angles of the pipeline and landslide: (a) combined displacement of the sliding body when the intersection angle is 0°; (b) combined displacement of the pipeline when the intersection angle is 0°; (c) combined displacement of the sliding body when the intersection angle is 15°; (d) combined displacement of the pipeline when the intersection angle is 15°; (e) combined displacement of the sliding body when the intersection angle is 30°; (f) combined displacement of the pipeline when the intersection angle is 30°; (g) combined displacement of the sliding body when the intersection angle is 45°; (h) combined displacement of the pipeline when the intersection angle is 45°; (i) combined displacement of the sliding body when the intersection angle is 60°; (j) combined displacement of the pipeline when the intersection angle is 60°; (k) combined displacement of the sliding body when the intersection angle is 75°; (l) combined displacement of the pipeline when the intersection angle is 75°; (m) combined displacement of the sliding body when the intersection angle is 90°; (n) combined displacement of the pipeline when the intersection angle is 90°.
As shown in Table 7 and Figure 10, the maximum displacement of the pipeline increased with the increase of the intersection angle between the pipeline and the landslide. When the intersection angle between the pipeline and landslide direction is 0°, the pipeline displacement is the minimum, which is 190.16 mm. When the intersection angle between the pipeline and landslide direction is 90°, the pipeline displacement reaches the maximum, which is 2437.5 mm. When the intersection angle is 0°–45°, the increase rate of pipeline displacement is small, and when the intersection angle is 45°–90°, the increase rate of pipeline displacement is large.

Table 7.
Maximum displacement of the pipeline under different intersection angles between the pipeline and the landslide.
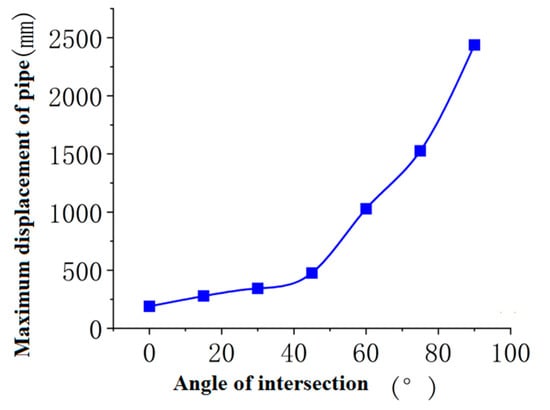
Figure 10.
Maximum displacement of the pipeline at different intersection angles.
In order to analyze the deformation and stress characteristics of the pipeline in detail, the stress value at the maximum displacement of the pipeline under different intersection angles is extracted. As shown in Table 8 and Figure 11, the maximum stress of the pipeline increases with the increase of the intersection angle between the pipeline and the landslide. When the intersection angle between the pipeline and landslide is 90°, that is, the pipeline and landslide slide vertically, the maximum stress value of the pipeline reaches 2.16 × 10⁹ Pa. Similar to the variation characteristics of displacement, when the intersection angle is 0°–45°, the increase rate of maximum stress is small, and when the intersection angle is 45°–90°, the increase rate of stress is large. Therefore, by comprehensive analysis of the characteristics of displacement and stress of the pipeline, it can be seen that the smaller the intersection angle between the pipeline and landslide, the safer the pipeline is. When the intersection angle between the pipeline and landslide direction is greater than 45°, the threat to the pipeline increases.

Table 8.
Maximum stress of the pipeline under different intersection angles between the pipeline and the landslide.
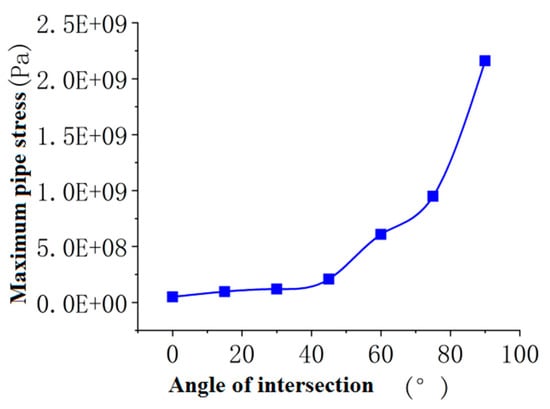
Figure 11.
Maximum stress of the pipeline at different intersection angles.
4. Typical Case of Pipeline Oblique Crossing Landslide
Taking the landslide of the Second Branch of Yunnan Oil Transport (MJ053) pipeline of China National Pipeline Network as a typical case, the complete coupling model of pipeline-landslide is established using FLAC3D. The stability of the landslide and the displacement and stress of the pipeline oblique crossing landslide are analyzed.
4.1. Landslide Characteristics
The landslide was located at Jianshui section (MJ053) of Baikun Pipeline in Jianshui County, Yunnan Province, and the pipeline crossed the landslide area diagonally (Figure 12). The geomorphic unit of the site is hilly, and the micro-geomorphic features are high in the southeast and low in the northwest. The elevation of the landslide is 1347 m–1363 m, and it presents a “slow-steep” step-like landform longitudinally. The middle and lower part of the front edge is relatively slow, ranging from 2° to 8°. The upper slope of the landslide is relatively large, ranging from 15° to 45°. The main sliding direction of the landslide is 312°, the landslide is curved in plane form, the average length of the landslide is about 90 m, the average width is about 80 m, the total area is about 7200 m2, the average thickness of the landslide is about 3 m, and the total volume is about 2.16 × 10⁴ m3, which is a shallow soil landslide. The surface deformation in the landslide area is mainly characterized by fracture development (Figure 13). A total of 8 fractures (L1 to L8) were developed in the landslide area, with a maximum width of 0.1 cm–10 cm, and local dislocation occurred to form the landslide back wall of 0.1 m to 1.5 m (Figure 14).
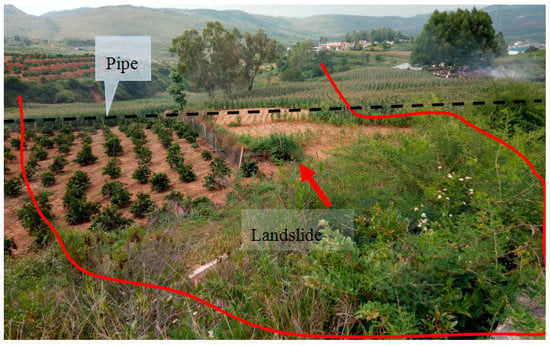
Figure 12.
Photo of landslide.
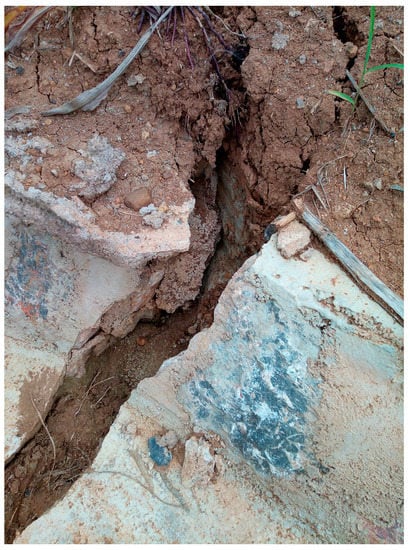
Figure 13.
Serious deformation of the original drainage ditch.
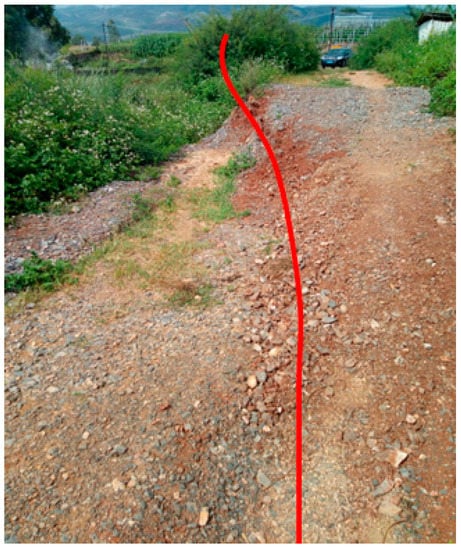
Figure 14.
Cracks on trailing edge of landslide.
According to the field drilling data, the stratigraphic lithology exposed in the landslide area mainly consists of plain fill (Q4ml), clay (Q4al+pl), and argillaceous siltstone (N) (Figure 15). The hydrogeological conditions are simple. According to the occurrence conditions and migration forms of groundwater, it can be divided into two categories: loose rock pore water and bedrock fissure water. There is no spring in the landslide area. The stable groundwater depth measured in the borehole in the rainy season is 0.50~0.80 m, and the stable groundwater depth measured in the dry season is 1.50~3.00 m.

Figure 15.
Typical engineering geological section of landslide.
4.2. Numerical Simulation Analysis of Pipeline-Landslide
(1) Modeling
According to the landslide survey report, the model size is 149 m long, 113 m wide, and 44 m high after considering the boundary conditions. The sliding body, sliding zone, and bedrock are divided by triangular grid elements. In order to improve the calculation accuracy and the accuracy of numerical simulation, the pipeline grid, the sliding body around the pipeline, and the sliding zone grid are locally encrypted. The model consists of 38,902 triangular nodes and 217,257 triangular elements, as shown in Figure 16.
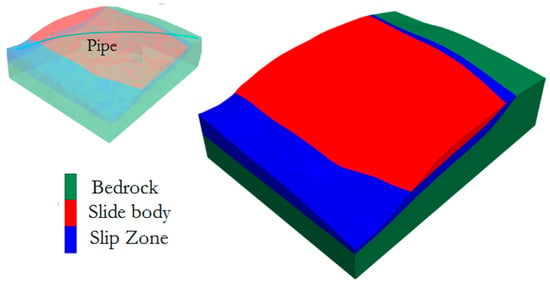
Figure 16.
Landslide–pipeline interaction model.
The pipeline is located in the middle part of the landslide, and the buried depth of the pipeline is about 2.0 m on average. In the process of modeling and calculation, the influence of pipe diameter and other parameters on the mechanical response state of pipe is ignored. The pipeline type is X70 tubular steel, with a wall thickness of 14.6 mm. The SHELL element in FLAC3D was used to establish the fully coupled pipe-soil model. In order to improve the accuracy of the numerical calculation, a pipe-soil contact surface is established on the surface of the pipeline to provide the sliding between the pipeline and the sliding body.
(2) Geotechnical parameters
The calculated parameters are obtained according to the site survey report and after several inversion trials. The calculated parameters are shown in Table 9, Table 10 and Table 11.

Table 9.
Geotechnical parameters of the landslide under natural conditions.

Table 10.
Mechanical parameters of the pipeline.

Table 11.
Parameters of pipe–soil interface.
(3) Pipeline-landslide stability analysis
The landslide stability was calculated by the strength reduction method using FLAC3D6.0. As shown in Figure 17, the stability coefficient of the landslide is 0.971, which is in an unstable state under natural working conditions. At this time, the surface sliding body has been transformed from the creeping stage to the sliding, and the deep sliding body is in the critical stage from creeping to sliding. According to the survey report, the maximum displacement of the landslide is 500 mm, which is in good agreement with the numerical analysis result of 453.74 mm. Based on the in situ deformation and numerical simulation results, it can be seen that the landslide is in an unstable state under natural conditions, and it is necessary to take comprehensive engineering measures to control the landslide to reduce its threat to the oil pipeline.
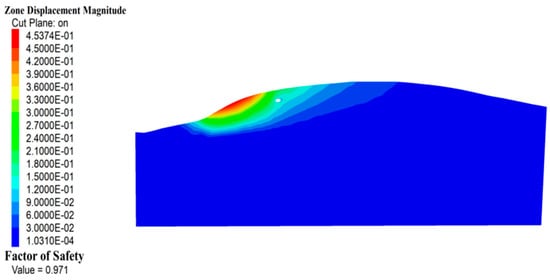
Figure 17.
Landslide stability.
(4) Stress analysis of pipeline
According to the calculation results of landslide stability, the stability coefficient in the natural condition is 0.971, which is in an unstable state, and the slope deformation is obvious. At this time, the pipeline is pushed by the soil around the pipeline to produce a large displacement. As shown in Figure 18, the maximum displacement of the pipeline under the landslide is 156.87 mm, distributed at the side edge of the landslide, which is basically consistent with the surface displacement of the sliding body. It can be seen that the pipeline oblique crossing landslide is mainly affected by the landslide pushing, resulting in deformation and displacement. The site survey report shows that the actual displacement of the pipeline is about 150 mm, which is close to the numerical simulation results.
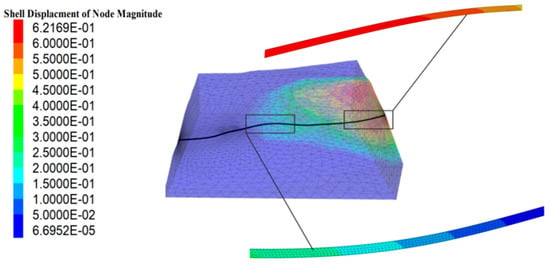
Figure 18.
The displacement of the pipeline.
Figure 19 shows the vertical stress variation cloud diagram of the pipeline under the action of the landslide. The results show that the pipeline is subjected to the pushing or tension and compression of the sliding body, resulting in the tensile stress and compressive stress concentration. The maximum tensile stress of the pipeline is 2.3454 × 10⁷ Pa at the maximum displacement of the sliding body, and the maximum compressive stress of the pipeline is 1.2751 × 10⁷ Pa at the small displacement of the pipeline. The tensile strength of the oil pipeline is 9.86 × 10⁶ Pa. At this time, the maximum tensile stress of the pipeline is greater than the ultimate tensile strength, and the local damage of the pipeline occurs, which is consistent with the on-site pipeline state.
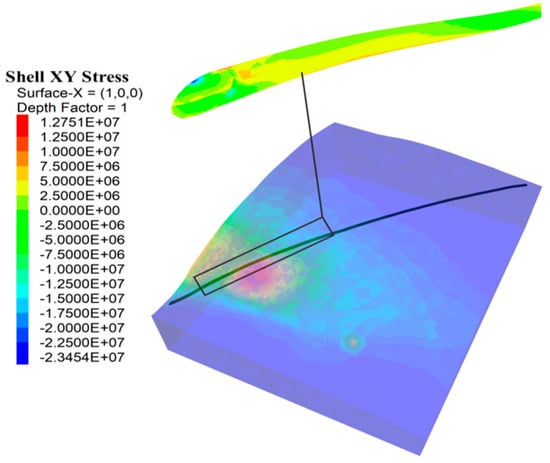
Figure 19.
Vertical pipeline stress.
In order to further analyze the variation of pipeline displacement in the process of the landslide, seven monitoring points are set on the pipeline model to monitor the displacement variation of the pipeline. The arrangement of monitoring points is shown in Figure 20. According to the numerical simulation results, the pipeline displacement monitoring data is extracted, and the pipeline displacement change curve is obtained after processing (Figure 21). With the development of the landslide, the pipeline displacement shows an overall increasing trend. The pipeline displacement increases significantly where the displacement of the sliding body is large, and the pipeline displacement changes little where the displacement of the sliding body is small.
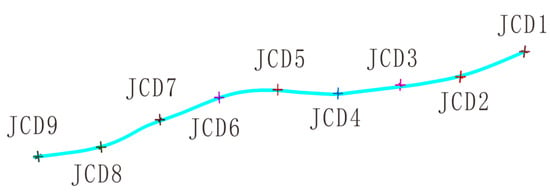
Figure 20.
Monitoring point arrangement.
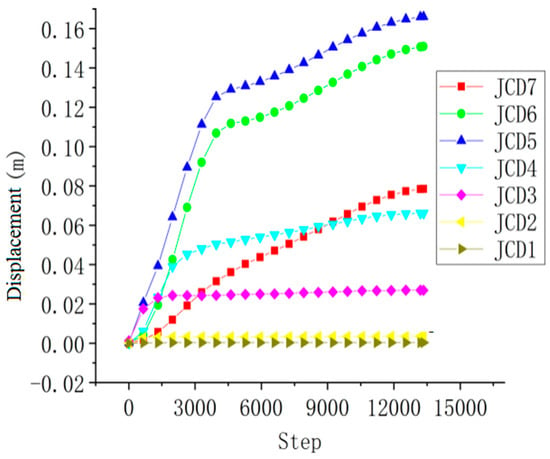
Figure 21.
Displacement monitoring curve.
According to the above numerical simulation, the stability coefficient of the landslide is less than 0.971, and it is in an unstable state. Part of the soil in the landslide area has slipped obviously, leading to obvious deformation and displacement of the pipeline. Referring to the specification, it can be seen that the pipeline displacement is greater than the maximum allowable displacement value of the specification, and the stress is in the limit equilibrium state. Therefore, the landslide directly threatens the pipeline safety, and it is necessary to treat the pipeline landslide.
5. Conclusions
The ideal model of pipe-soil coupling interaction of oil and gas pipeline oblique crossing landslide is established using FLAC3D. The stress and deformation characteristics of pipelines under different sliding displacements, different buried depths, and different intersection angles between landslides and pipelines were analyzed, and a typical case of pipeline oblique crossing landslide was used for analysis. The main conclusions are as follows:
(1) The displacement field distribution of the sliding body is influenced by the existence of the pipeline. Due to the existence of the pipeline, the continuous distribution characteristics of landslide displacement are broken, and the displacement of the sliding body in the buried position of the pipeline is the smallest, increasing from the center of the pipeline to both sides. The overall distribution characteristics of displacement field of the sliding body are consistent under different maximum displacements of the sliding body and different buried depths of the pipeline. However, with the increase of the intersection angle between the pipeline and the landslide, the displacement distribution of the sliding body becomes more and more uneven, and the symmetry of the displacement distribution on both sides of the pipeline becomes worse and worse.
(2) The stress distribution characteristics of pipeline oblique crossing landslides have its particularity. The stress concentration is obvious at the shear outlet and the trailing edge of the landslide, and the two stress directions are opposite. The shear stress at the trailing edge of the landslide is opposite to the direction of the free face, while the shear outlet of the landslide shows the stress shear in the same direction as that of the free face under the effect of landslide pushing. The absolute value of stress at the shear outlet is the largest, which should be regarded as the key location.
(3) The displacement and stress of pipeline oblique crossing landslides are significantly affected by the displacement of the sliding body and the buried depth of the pipeline. The displacement and stress of the pipeline always increase with the increase of the maximum displacement of the sliding body and decrease with the increase of the buried depth of the pipeline.
(4) The intersection angle of the pipeline and landslide has a significant influence on the stress of the pipeline. With the increase of the intersection angle between the pipeline and landslide, the maximum displacement and stress of the pipeline increase. The smaller the intersection angle between the pipeline and landslide, the safer the pipeline is. Moreover, there is a significant difference between the pipeline displacement field when the intersection angle is 0°–45° and when the intersection angle is 45°–90°. The main reason is that when the intersection angle is greater than 45°, the pipe no longer intersects the landslide shear outlet, but intersects the boundary on both sides of the landslide, and the stress characteristics change significantly.
In short, there are still many problems in pipeline-landslide disasters that need in-depth study. On the basis of the above research, it is the main direction of future research to put forward some targeted prevention measures and incorporate the research results into pipeline safety evaluation.
Author Contributions
F.-Y.A., T.-H.C., C.Y., Y.-F.W. and S.-Q.Y. contributed equally to this work. All authors have read and agreed to the published version of the manuscript.
Funding
This research was funded by the National Natural Science Foundation of China, grant number 42267020, the Key Research and Development Program of Yunnan Province in 2022, grant number 202203AC100003.
Institutional Review Board Statement
Not applicable.
Informed Consent Statement
Not applicable.
Data Availability Statement
The data used to support the findings of this study are included within the article.
Acknowledgments
The authors acknowledge the PipeChina’s help and support.
Conflicts of Interest
The authors declare no conflict of interest, financial, or otherwise.
References
- Qiuyang, L.I.; Minghua, Z.H.; Zhang, B.; Wen, W.E.; Lele, W.A.; Xueqin, Z.H.; Lin, C.H. Current construction status and development trend of global oil and gas pipelines in 2020. Oil Gas Storage Transp. 2021, 40, 1330–1337. [Google Scholar]
- Interstate Natural Gas Association of America. Interstate Natural Gas Pipeline Efficiency [EB/OL]. Available online: http://www.ingaa.org/11885/Reports/10927.aspx (accessed on 1 January 2020).
- EGIG. The 10th Report of the Gas Pipeline Incidents of European Gas Pipeline Incident Data Group; R.0395[R]; EGIG: Groningen, The Netherlands, 2018; Volume 17, pp. 10–30. [Google Scholar]
- Gao, P. New progress in China’s oil and gas pipeline construction in 2021. Int. Pet. Econ. 2022, 30, 12–19. [Google Scholar]
- Qingwen, M.; Chenghua, W.; Jiming, K. Dynamical mechanisms of effects of landslides on long distance oil and gas pipelines. Wuhan Univ. J. Nat. Sci. 2006, 11, 820–824. [Google Scholar] [CrossRef]
- Novotný, J. Stability problems in road and pipeline constructions and their mitigation—Examples from Sakhalin and Azerbaijan. J. Mt. Sci. 2011, 8, 307–313. [Google Scholar] [CrossRef]
- Borfecchia, F.; De Canio, G.; De Cecco, L.; Giocoli, A.; Grauso, S.; La Porta, L.; Martini, S.; Pollino, M.; Roselli, I.; Zini, A. Mapping the earthquake-induced landslide hazard around the main oil pipeline network of the Agri Valley (Basilicata, southern Italy) by means of two GIS-based modelling approaches. Nat. Hazards 2015, 81, 759–777. [Google Scholar] [CrossRef]
- Zhang, S.-Z.; Li, S.-Y.; Chen, S.-N.; Wu, Z.-Z.; Wang, R.-J.; Duo, Y.-Q. Stress analysis on large-diameter buried gas pipelines under catastrophic landslides. Pet. Sci. 2017, 14, 579–585. [Google Scholar] [CrossRef]
- Zhu, C.-J. Treatment of landslide in Baiyangping section of Sichuan gas pipeline project. Oil-Gasfield Surf. Eng. 2010, 29, 4–5. [Google Scholar]
- Zhang, J. Study on Landslide Stability and Treatment Monitoring in the Jiange Section of the Lanzhou-Chengdu-Chongqing Oil Pipeline. Master’s Thesis, Southwest Petroleum University, Chengdu, China, 2017. [Google Scholar]
- Xi, S. Study on Critical Criterion and Sensitive Section of Deformation and Failure of Buried Pipeline in Landslide Area. Ph.D. Thesis, China University of Geosciences, Beijing, China, 2018. [Google Scholar]
- Borodavkin, P.P. Buried Pipeline; Feng Liang Version; Petroleum Industry Press: Beijing, China, 1980. [Google Scholar]
- Lin, D.; Xu, K.F.; Huang, R.Q.; Zhu, Y.; Luo, M. Landslides Classification of Pipeline for Transporting Oil and Gas. Welded Pipe Tube 2009, 21, 66–68. [Google Scholar]
- Rajani, B.B.; Robertson, P.K.; Morgenstern, N.R. Simplified design methods for pipelines subject to transverse and longitudinal soil movements. Can. Geotech. J. 1995, 32, 309–323. [Google Scholar] [CrossRef]
- O’Rourke, M.J.; Liu, X.; Flores-Berrones, R. Steel Pipe Wrinkling due to Longitudinal Permanent Ground Deformation. J. Transp. Eng. 1995, 121, 443–451. [Google Scholar] [CrossRef]
- Cocchetti, G.; di Prisco, C.; Galli, A.; Nova, R. Soil-pipeline interaction along unstable slopes:a coupled three-dimensional approach. Part 1:Theoretical fonnulation. Can. Geotech. J. 2007, 46, 1289–1304. [Google Scholar] [CrossRef]
- Cocchetti, G.; di Prisco, C.; Galli, A. Soil-pipeline interaction along unstable slopes:a coupled three-dimensional approach. Part 2: Numerical analyses. Can. Geotech. J. 2009, 46, 1305–1321. [Google Scholar] [CrossRef]
- Yun, L.; Kang, L. Reliability analysis of high pressure buried pipeline underlandslide. Appl. Mech. Mater. 2014, 501–504, 1081–1086. [Google Scholar] [CrossRef]
- Audibert, J.M.; ENyman, K.J. Soil restraint against hori zontal mo-tion of pipes. J. Geotech. Eng. Divi-Sion 1977, 103, 1119–1142. [Google Scholar] [CrossRef]
- Calvetti, F.; Di Prisco, C.; Nova, R. Experimental and numeri-cal analysis of soil-pipe interactior. J. Geotech. Geoenviron. Eng. 2004, 130, 1292–1299. [Google Scholar] [CrossRef]
- Georgiadis, M. Landslide drag forces on pipelines. Soils Found. 1991, 31, 156–161. [Google Scholar] [CrossRef]
- Yoshizaki, K.; Sakanoue, T. Experimental study on Soil-pipeline interaction using eps back fill. In New Pipeline Technologies Security and Safety Baltimore; ASCE: Reston, VA, USA, 2003; pp. 1126–1134. [Google Scholar]
- Karimain, S.A. Response of Buried Steel Pipelines Subjected to Longitudinal and Transverse Ground Movement. Ph.D. Thesis, University of Tehran, Teheran, Iran, 2003. [Google Scholar]
- Yatabe, H.; Fukuda, N.; Masuda, T.; Toyoda, M. Analytical Study of Appropriate Designfr High-Grade Induction Bend Pipes Subjected to Large Ground Deformation. J. Offshore Mech. Arct. Eng. 2004, 126, 376–383. [Google Scholar] [CrossRef]
- Vans, A.J. Three-Dimensional Finite Element Analysis of Longitudinal Support in Buried Pipes. Master’s Thesis, Utah State University, Logan, UT, USA, 2004. [Google Scholar]
- Zhou, X. Study on Effects of Different Factors on Pipelines Risk Under Landslide. Ind. Saf. Environ. Prot. 2012, 38, 42–44. [Google Scholar]
- Fa-You, A.; Hei, M.-C.; Yan, S.-Q.; Zhang, P. Investigating the Effect of the Rock-Socketed Depth of the Hinged Cable-Anchored Pile on the Earthquake Response Characteristics of Supporting Structures. Adv. Civ. Eng. 2022, 2022, 2249654. [Google Scholar] [CrossRef]
- Wu, J.-J.; Li, Y.; Cheng, Q.-G.; Wen, H.; Liang, X. A simplified method for the determination of vertically loaded pile-soil interface parameters in layered soil based on FLAC3D. Front. Struct. Civ. Eng. 2015, 10, 103–111. [Google Scholar] [CrossRef]
- Peng, S.; Liao, W.; Liu, E. Pipe–soil interaction under the rainfall-induced instability of slope based on soil strength reduction method. Energy Rep. 2020, 6, 1865–1875. [Google Scholar] [CrossRef]
- Liu, E.; Li, D.; Li, W.; Liao, Y.; Qiao, W.; Liu, W.; Azimi, M. Erosion simulation and improvement scheme of separator blowdown system—A case study of Changning national shale gas demonstration area. J. Nat. Gas Sci. Eng. 2021, 88, 103856. [Google Scholar] [CrossRef]
- Liu, E.; Wang, X.; Zhao, W.; Su, Z.; Chen, Q. Analysis and Research on Pipeline Vibration of a Natural Gas Compressor Station and Vibration Reduction Measures. Energy Fuels 2020, 35, 479–492. [Google Scholar] [CrossRef]
Disclaimer/Publisher’s Note: The statements, opinions and data contained in all publications are solely those of the individual author(s) and contributor(s) and not of MDPI and/or the editor(s). MDPI and/or the editor(s) disclaim responsibility for any injury to people or property resulting from any ideas, methods, instructions or products referred to in the content. |
© 2023 by the authors. Licensee MDPI, Basel, Switzerland. This article is an open access article distributed under the terms and conditions of the Creative Commons Attribution (CC BY) license (https://creativecommons.org/licenses/by/4.0/).