Article

Experimental Study on Liquefaction Characteristics of Saturated Sands Mixed with Fly Ash and Tire Crumb Rubber

1
Faculty of Engineering and Architecture, Muş Alparslan University, Mus 49250, Turkey
2
Institute of Science and Technology, Muş Alparslan University, Mus 49250, Turkey
*
Author to whom correspondence should be addressed.
Sustainability 2023, 15(4), 2960; https://doi.org/10.3390/su15042960
Submission received: 18 January 2023 / Revised: 3 February 2023 / Accepted: 3 February 2023 / Published: 6 February 2023
(This article belongs to the Section Sustainable Engineering and Science)

Abstract

:
The liquefaction of saturated sandy soils during dynamic loading can inflict excessive damage on the structures, leading to significant human and economic losses. Recycling and reusing industrial waste materials may offer a sustainable and economic solution to this problem. This study investigates the influence of two waste materials, namely, recycled fly ash and tire crumb rubber, on the liquefaction characteristics of sand. For this purpose, loose and medium-dense triaxial specimens were prepared using sand–fly ash mixtures containing 0–40% of fly ash and sand–tire crumb rubber mixtures containing 0–30% of crumb rubber. The liquefaction characteristics of the specimens were examined through a series of stress-controlled, undrained, dynamic triaxial tests. The tests were conducted at 1 Hz loading frequency and under initial effective confining stresses of 50 and 100 kPa. The experimental results showed that, at a similar relative density, the liquefaction resistance of the sand–fly ash specimens decreased as the fly ash content (FA) increased up to about 20%; then, it slightly increased until FA reached 40%. Sand-only specimens showed greater liquefaction resistance than sand–fly ash specimens. The liquefaction resistance of the sand–tire crumb rubber specimens was enhanced by increasing the rubber content (RC) in the mixtures. It was found that the increasing liquefaction resistance of sand with the addition of tire crumb rubber was more noticeable under higher confining stresses.

1. Introduction

The devastating effects of earthquake-induced liquefaction have been recurrently witnessed in the past and recent earthquakes resulting in serious human and economic losses. The 1964 Alaska, USA earthquake; the 1964 Niigata, Japan earthquake; the 1999 Kocaeli, Turkey earthquake; the 2010 Maule, Chile earthquake; the 2011 Tohoku, Japan earthquake; the 2011 Christchurch, New Zealand earthquake; and the 2018 Palu, Indonesia earthquake have exhibited remarkable examples of extensive liquefaction-induced damage or failures that structures and lifeline facilities suffered [1,2].
In geotechnical earthquake engineering, the liquefaction phenomenon gained research interest after the strong 1964 earthquakes in Alaska and Niigata. Since then, significant progress has been made—based on the analysis of case histories and experimental data from element testing in static and dynamic conditions—in producing several definitions and frameworks that characterize liquefaction. It is widely accepted that liquefaction occurs in saturated sandy soils and involves the generation of excess pore pressures during seismic loading, which causes substantial degradation of effective stress and shear strength and stiffness. Based on cyclic triaxial tests of loosely and densely packed pure sand specimens, Seed and Lee [3] defined initial liquefaction, or simply liquefaction, as the condition in which excess pore pressures ( u e ) observed during undrained loading reach the initial effective confining stresses ( σ c ) for the first time ( r u = u e σ c = 1 ). Ishihara [4] later suggested that, for different soil types (e.g., sands containing fines), a double amplitude axial strain of 5% developed in undrained cyclic loading may correspond to the onset of liquefaction.
Liquefaction was first observed in sandy soils during the 1964 Niigata, Japan earthquake, and the initial studies predominantly concentrated on pure sand deposits [5]. Case studies of liquefaction during major earthquakes around the world—such as the 1985 Central Chile earthquake; the 1999 Kocaeli, Turkey earthquake; the 1999 Chi-Chi, Taiwan earthquake; and the 2011 Christchurch, New Zealand earthquake—reveal that liquefaction occurs not only in pure sand deposits but also in silt, silty sand, and clayey sand deposits [6]. These observations have set off a major interest in the investigation of the fundamental role that fines play in the liquefaction behavior of saturated sands. Extensive laboratory-based studies have been conducted since the 1990s to gain a scientific understanding of the effects of fines’ content, type, activity, and plasticity. These research efforts have produced conflicting results. Some researchers [7,8,9] have observed that, at the same packing index (e.g., void ratio and/or relative density), the liquefaction resistance of silty sands significantly drops to the critical non-plastic silt content and then increases as the critical fines content ( F c ) is exceeded. The critical fines content was shown to vary from 10 to 42%. On the contrary, the liquefaction resistance of silty sands was observed to decrease [10] or increase [11] with the increasing non-plastic fines content. There are also some points of disagreement on whether the plasticity or content of the fines is more important for the liquefaction resistance of sands with plastic fines. Some studies [12] found the plasticity of fines to be more important, whereas others [13] considered the fines content to be more influential. In terms of plasticity, the most common finding is that the liquefaction resistance of sand containing plastic fines increases as the plasticity index ( P I ) increases, which is especially true for greater P I values [14,15]. The findings of Park and Kim [16] were contrary to this common understanding, suggesting that, at the same fines content, increasing the plasticity of fines reduced the liquefaction resistance of silty and clayey sands. In terms of fines content, the liquefaction resistance of sands was observed to initially decrease with the addition of plastic fines and then start to increase beyond the critical fines content [17,18].
Past earthquakes have served as a reminder of the necessity for the development of soil improvement methods to mitigate liquefaction-induced damage. Since the 1964 earthquakes, various methods have become readily available for use in the remediation of liquefaction in the free field or beneath structures ranging from residential buildings with shallow foundations to nuclear power facilities [19]. The design of a suitable liquefaction mitigation method is preliminarily conducted based on the applicability, effectiveness, and/or cost–benefit ratio. Their detrimental effects on surrounding structures and the environment are usually disregarded [20]. The majority of traditional methods use synthetic man-made materials (e.g., chemical grouts) to improve soil, which may harm the environment [21]. Environmental concerns necessitate the development and/or use of economical and sustainable methods [22,23]. Furthermore, industrialization and urbanization promote increasing consumer demand for energy and raw materials, producing a huge amount of industrial waste around the world annually [24]. Fly ash and tire rubber are among the most common types of industrial waste, and only a small portion of them is recycled and/or reused. The use of these wastes as soil-reinforcing material is promising for sustainable development and may provide a viable solution to growing environmental problems [25].
Fly ash is the byproduct of coal-fired thermal power plants. Previous studies suggested different applications of fly ash in geotechnical engineering, including road, embankment, dyke, and dam construction; back, mine, and structural filling; and soil stabilization. Fly ash has been used as bulk fill material in the construction of road or highway embankments [26] and utilized to stabilize soils [27]. Numerous researchers have also investigated the physical and mechanical properties and cyclic strength characteristics of fly ash under different loading conditions. The California Bearing Ratio (CBR), unconfined compressive strength, shear strength, and resilient modulus of fine-grained soils have been observed to increase with the addition of fly ash [28,29,30]. It has been shown that the cyclic behavior and liquefaction potential of fly ash are influenced by various parameters, including confining stress, relative density, anisotropy, loading frequency, and cyclic stress ratio [31,32,33]. Sandy soils have been mixed with Class F fly ash at different proportions and subjected to cyclic loading to investigate the effect of fly ash on the liquefaction resistance of sand [34,35,36,37]. These studies have reported conflicting results. Chattaraj and Sengupta [34] suggested that fly ash was more liquefiable than sand. Keramatikerman et al. [35] tested sand specimens with 0–6% fly ash content and concluded that sand specimens with higher fly ash content were more resistant to liquefaction. Kolay et al. [36] reported that the liquefaction resistance of sand–fly ash mixtures first dropped as the fly ash content ( F A ) increased from 0 to 20%, increased up to an F A of 25%, then reduced up to an F A of 30%, and ultimately increased with a further increase in fly ash content from 30 to 50%.
Scrap tires, including organic and inorganic components, are non-biodegradable wastes. They can be found in different forms, such as rubber buffings, shredded tires (50–305 mm), tire chips (12–50 mm), granulated rubber (425 μm–12 mm), and ground rubber (425 μm–2 mm), depending on the particle size and shape. The granulated and ground rubber is crumbs [38]. Scrap tires show useful engineering properties, including low bulk density, high thermal resistivity, high elastic deformability, high drainage capacity, high physical and chemical durability, and high damping capacity [39,40]. Thus, they are used extensively in different geotechnical engineering applications as a light-weight construction material for embankments, in backfills behind retaining or caisson quay walls, in the reinforcement of soft soil, in the drainage layer in landfills, and in slope stabilization [41,42,43]. Scrap tires are also used for reducing the dynamic and liquefaction effects on structures [44,45]. The physical properties and mechanical behavior of sand–tire rubber mixtures under monotonic loading have been extensively studied in the literature. Some researchers observed that the friction angle and/or shear strength of sand–rubber mixtures increased as the tire shreds/chips/crumb contents increased [46,47], while others reported contradictory results, showing a decreasing trend in the shear strength with the addition of tire rubber [48,49,50]. The element and/or physical modeling test results reveal that tire rubber content, confining stress, sand/rubber size, and rubber fraction are the most significant parameters affecting the behavior of sand–tire rubber mixtures under cyclic loading. The shear modulus and damping ratio of the characteristics of sand have been shown to significantly change with the addition of tire rubber, increasing or decreasing depending on the shear strain and amplitude of the confining stress pressure [51,52,53,54]. Studies on the liquefaction behavior of sand–tire rubber mixtures have also produced contradictory results. The addition of tire rubber in the sand was reported to reduce the excess pore water pressure generation and enhance the liquefaction resistance of saturated sand [55,56,57,58]. A few studies have provided opposite results, indicating an increase in the liquefaction potential of sand with the inclusion of tire rubber [59,60]. Mashiri et al. [61] observed an insignificant change, an increase, and a decrease in the liquefaction resistance of sand–tire rubber mixtures as the tire rubber content was increased from 0–10%, 10–30%, and 30–40%, respectively.
A comprehensive review of the literature mentioned above indicates that there have been various studies conducted to examine the effect of scrap tires on the dynamic response of saturated sands; however, the research results have often been contradictory. Particularly, researchers have not reached a consensus on the liquefaction behavior of sand–tire rubber mixtures, and additional experimental studies are of great value to elucidate ambiguous aspects of this subject. Moreover, previous studies have mostly focused on sand–tire chip mixtures, and significant knowledge gaps still exist regarding the liquefaction behavior of sand–crumb rubber mixtures. Class F fly ashes consist of light, non-plastic, fine-grained, typically silt-sized, particles. It is also evident from the published literature that, although a wide variety of research is available on the dynamic behavior of sands containing non-plastic silts, only a few relevant experimental studies exist on sand–fly ash mixtures, and existing data appear to contradict one another. Further study is needed to address the question regarding how the addition of fly ash affects the liquefaction resistance of sand and whether fly ash behaves similarly to non-plastic silt when mixed with sand.
This study presents the results from 45 stress-controlled, undrained, dynamic triaxial tests to discuss the effect of fly ash and tire crumb rubber on the liquefaction behavior of saturated sand under different fly ash or crumb rubber content levels, initial effective confining stress levels, and relative density levels. The test results are expected to offer additional data that reinforce the existing literature and offer useful insights that may enable the proper and widespread use of these waste materials in economically and sustainably protecting structures against liquefaction.

2. Materials and Methods
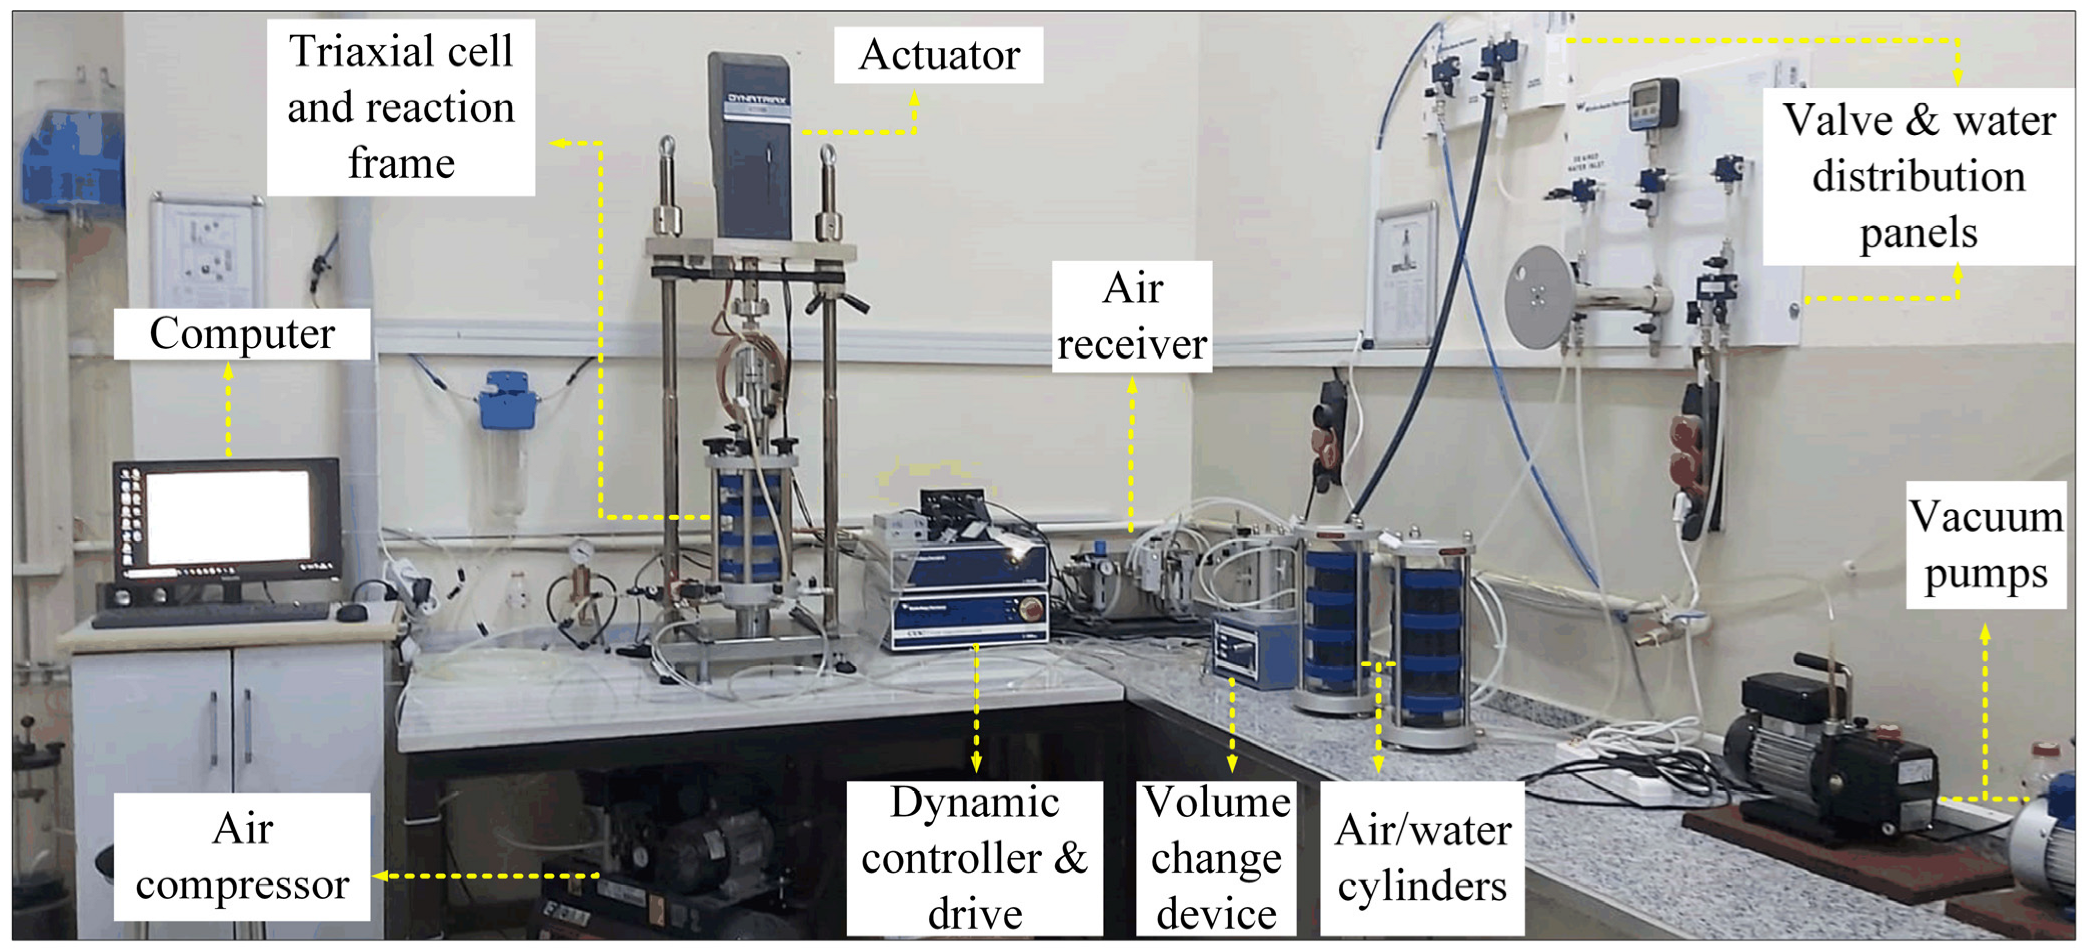
2.1. Test Device

In this study, dynamic triaxial experiments were conducted using the Dynatriax EmS triaxial testing apparatus manufactured by the Wykeham Farrance-Controls Groups, Milan, Italy. The main components of this apparatus are shown in Figure 1. It has an electromechanical actuator that applies the axial force and has a dynamic load capacity of 15 kN and an operating frequency of 10 Hz. The main instrumentation and components of this triaxial system are a triaxial cell with 1000 kPa pressure capacity; an automatic volume change device (100 cc capacity and precision of ±0.1 cc); a submersible load cell measuring axial forces (0–25 kN capacity and accuracy of ±0.05% FS); displacement transducers measuring axial displacements (±25 mm capacity and accuracy of 0.2% FS); pressure transducers recording pore water, cell, and back pressure (0–1000 kPa capacity and accuracy of ±0.25% FS). The monitoring instruments were calibrated regularly.
Dynatriax EmS is a fully automated, computer-controlled test system, and its software and data acquisition system allow different test stages (e.g., back pressure saturation, isotropic consolidation, and cyclic shearing) to be performed in an effective and well-controlled manner. The cell pressure is controlled by compressed air.

2.2. Test Materials

The materials used during the tests were podima sand, Class F fly ash, and tire crumb rubber. Figure 2 shows the particle size distribution curves of the test materials and their comparisons with the liquefaction boundaries proposed by Tsuchida [62]. The engineering properties of these materials were found following the procedures in ASTM standards.
Podima sand originates from the sand quarry located in the Çanakkale province of Turkey and is commercially available. It is a naturally occurring, fine-grained, and uniform silica sand with rounded grains. The sieve analysis was performed according to ASTM D6913 [63]. The sand had an effective grain size ( D 10 ) of 0.16 and mean grain size ( D 50 ) of 0.65. The uniformity coefficient ( C u ) and the coefficient of curvature ( C c ) of the podima sand were 4.75 and 1.49, respectively. According to the Unified Soil Classification System (USCS), it is classified as poorly graded sand (SP). The specific gravity ( G s ) of test sand was 2.63, as per ASTM D854 [64]. It had a minimum void ratio ( e m i n ) of 0.398, as per ASTM D4253-Method 1A [65], and a maximum void ratio ( e m a x ) of 0.63, as per ASTM D4254-Method A [66].
Fly ash was collected from the Seyitömer thermal power plant in the Kütahya province of Turkey. The specific gravity of fly ash was calculated as 2.10 [64]. The physical and chemical properties of Seyitömer fly ash were studied in the literature [67,68]. Based on the grain size distribution analysis completed using the laser particle size analyzer, the mean grain size of fly ash was reported to be 28 µm [69]. Based on its chemical composition, it was classified as Class F fly ash.
The tire rubber was obtained from a local company specializing in recycling waste rubber tires. Based on the grain size distribution analysis [63], the sizes of the rubber particles were mostly in the range of 1 to 4.25 mm, and they were designated as crumb rubber. The mean grain size of tire crumb rubber was 2.6 mm. The specific gravity of tire crumb rubber was found to be 1.1 [64].
Different packing index parameters, such as the global void ratio, intergranular void ratio, and relative density, have been used in the literature to study the behavior of sand with fines [70]. In the present study, relative density ( D r ), most extensively used in geotechnical engineering practices, was selected as the packing index parameter to discuss the effect of non-plastic fly ash and tire crumb rubber on the liquefaction characteristics of sand specimens. The minimum ( e m i n ) and maximum void ratios ( e m a x ) were required to calculate the relative densities of mixtures. For this reason, sand–fly ash and sand–tire crumb rubber mixtures with various weight ratios, provided in Equation (1), were prepared. Then, the minimum and maximum void ratio of the sand–fly ash and sand–tire crumb rubber mixtures were experimentally determined following the procedures specified in ASTM D4253-Method 1A [65] and ASTM D4254-Method A [66]. Furthermore, the specific gravity of the mixtures was measured as per ASTM D854 [64].
F A   o r   R C = W w a s t e W s a n d + W w a s t e
where W s a n d and W w a s t e correspond to the dry weight of sand and fly ash or tire crumb rubber wastes, respectively. F A and R C indicate the weight ratios for fly ash and tire crumb rubber mixtures, respectively. It should be noted that there are different methods of calculating the minimum and maximum void ratio values. Each method has some limitations and may produce different results [71]. Although the ASTM standards used in this study are particularly applicable for sand containing up to 15% fines (finer than 0.075 mm), they have been successfully used in several past studies and shown to produce repeatable minimum and maximum void ratio values [72,73].
Table 1 shows the specific gravity, minimum, and maximum void ratios calculated for sand–fly ash and sand–tire crumb rubber mixtures prepared at different weight ratios. The variation in the minimum and maximum void ratios with the addition of fly ash and tire crumb rubber is also depicted in Figure 3. It is evident from Table 1 that the specific gravity of mixtures decreased as the fly ash and tire crumb rubber content increased. Figure 3 reveals that minimum and maximum void ratios of the sand–fly ash mixture initially decreased until reaching approximately 10% of fly ash content, and began to increase with further increases in the fly ash. The minimum and maximum void ratios of the sand–tire crumb rubber mixture continuously increased as the rubber content increased.

2.3. Specimen Preparation

In geotechnical engineering, various methods exist to prepare reconstituted sand specimens with fines, including dry or wet pluviation, dry or moist tamping, slurry deposition, and dry funnel deposition. Each method reproduces a particular sand fabric. In this study, the uniformity of the specimens, the range of fly ash or rubber content achieved, the repeatability of the method, and the time and effort required for specimen preparation were more important criteria, and the dry funnel deposition method was selected for the preparation of the triaxial specimens. This method allowed for preparing loose and medium-dense triaxial specimens with a wide range of fly ash or tire crumb rubber content. It was also less laborious and less time-consuming.
The required amount of sand, fly ash, or tire crumb rubber was weighed on a dry basis. Pure sand was mixed with fly ash or tire crumb rubber in the desired dry-weight ratios. The sand–fly ash and sand–tire crumb rubber mixtures were continuously stirred until they were visibly uniform and homogenous. This was followed by the assembly of porous discs with a diameter of 70 mm, filter papers with a diameter of 70 mm, an impermeable rubber latex membrane, and a split cylindrical mold with an internal diameter of 70 mm and a height of 140 mm. For this, a porous stone and filter paper was positioned on top of the base pedestal. The latex membrane was installed and sealed to the base pedestal by two O-rings. The split mold was placed. The membrane was stretched tightly by folding its end over the outside of the split mold. Suction was applied with a vacuum pump to remove the air pockets between the membrane and the mold wall and to keep the membrane in place. The sand–fly ash and sand–tire crumb rubber mixtures, in a tray, were poured into the mold from a virtually zero fall height using a cone-shaped funnel, giving special attention to the homogeneity of the specimens. The nozzle diameter of the funnel was 3 mm and 7 mm for sand–fly ash and sand–tire crumb rubber mixtures, respectively. The funnel was raised very slowly along the axis of symmetry of the specimens, and the external walls of the mold were tapped carefully, whenever necessary, to accomplish the desired density. The surface was carefully leveled after filling the mold with the mixtures, and a second filter paper and porous stone were placed on top of the specimens, which was followed by the placement of the top (vacuum) cap. The membrane was unfolded and sealed around the top cap by two O-rings. Before the split mold was removed, a small vacuum (e.g., 20 kPa) was applied to the specimens so that they did not collapse and could remain undeformed until saturation. The split mold was removed, and the height of the specimens was measured with caution. The above-mentioned procedure created 70 mm diameter specimens with a height/diameter ratio of approximately 2. The triaxial cell was carefully mounted on the cell base and filled with de-aired water. The cell pressure was increased to 20 kPa. The specimens were slowly washed with carbon dioxide ( C O 2 ) for at least 30 min, flushing out the air within the void spaces. The percolation of C O 2 through the specimens allowed for expediting and/or facilitating the saturation process. Similarly, the specimens were cautiously washed with de-aired water by allowing de-air water to fill all the voids and the carbon dioxide gas to flow out of the specimens. The top vacuum cap was carefully connected to the loading ram, followed by the saturation of specimens.
The specimens were saturated using the back pressure saturation method, in which cell and back pressure were ramped up at the same rate. The cell pressure ( σ 3 ) and back pressure ( u 0 ) were increased in increments of 50 kPa until the target back pressures were reached. A constant differential pressure ( σ c = 10 kPa) was maintained during this process, keeping the cell pressure at 10 kPa above the back pressure. The saturation of specimens was evaluated through Skempton’s B-value. This coefficient corresponds to the ratio of the change in pore pressure to the change in cell pressure or confining stress ( B = Δ u Δ σ 3 ). The B-value of the specimens was checked by closing the back pressure line, suddenly increasing the cell pressure by 10 kPa, and recording the change in pore pressure after 10 s. At the beginning of consolidation, the B-values of the specimens were in the range of 99–100%.
The saturated specimens were isotropically consolidated to target effective confining stresses. This was performed by keeping the back pressure constant (e.g., 300 kPa), increasing the cell pressure up to the target value (400 kPa), and finally, allowing specimens to drain from the back pressure line connected to the volume change device. The consolidation process continued until the pore pressure stabilized and volume change was insignificant. The height and volume changes measured during this process were used to recalculate the new height, area, volume, and void ratios of the specimens. Figure 4 and Figure 5 show examples of images from experiments involving sand–fly ash and sand–tire crumb rubber mixtures, respectively.
Stress-controlled, undrained, dynamic triaxial tests were conducted on isotropically consolidated specimens, following the procedures in ASTM D5311 [74]. The tests were conducted by subjecting the specimens to uniform sinusoidal loading with a frequency of 1 Hz. The amplitudes of cyclic stress ratios ( C S R ) varied from 0.1 to 0.2 depending on the test requirements. The cyclic shear continued until an excess pore pressure ratio ( r u ) of 1 was reached. The experiments ceased after excess pore pressures were allowed to dissipate, and post-test visual inspections and observations of the specimens were made.

2.4. Testing Program

Table 2 presents the test program and typical test results for the pure sand, sand–fly ash, and sand–tire crumb rubber mixtures. A series of 12 dynamic triaxial tests were conducted on pure sand specimens prepared in loose ( D r 40 % ) and medium-dense ( D r 55 % ) states. These tests served as a benchmark for the assessment of the influence of fly ash and tire crumb rubber on the liquefaction behavior of sand. A total of 18 tests were carried out on sand–fly ash mixtures containing 0–40% fly ash. A series of 15 tests were conducted on sand–tire crumb rubber mixtures, and the rubber content was in the range of 0–30%.
All the tests were performed at different initial effective confining stresses ( σ c ), ranging from 50–200 kPa, to investigate their effect on the liquefaction behavior of sand with or without fly ash and tire crumb rubber. In the tests, the cell or confining pressure ( σ 3 ) was 400 kPa, and the back pressure ( u 0 ) was in the range of 200–300 kPa depending on the desired initial effective confining stress. The selection of C S R values was principally dictated by the need to make a direct comparison between the experimental results, particularly the build-up of excess pore pressures, obtained under analogous test conditions (e.g., similar amplitudes of cyclic loading). The C S R values used for the sand-only specimens (benchmark tests) were also utilized for the sand–fly ash or sand–tire crumb rubber mixtures.

3. Test Results

3.1. Typical Experimental Results

Figure 6 shows the typical experimental output of the cyclic behavior of a pure sand specimen with a relative density ( D r ) of 39% and tested at an initial effective confining stress ( σ c ) of 100 kPa and a cyclic stress ratio of 0.2. It appeared that, as the specimen was cyclically loaded in an undrained condition, significant excess pore pressures developed. The mean effective stress ( p ) decreased as the number of cycles increased, causing the stress path in the q p space to move toward the left. The pore pressure reached initial confining stress after about nine loading cycles, and the excess pore pressure ratio ( r u ) was equal to 1. This condition indicated the onset of liquefaction. Similar observations were made for sand specimens containing fly ash and tire crumb rubber. The only differences were in the number of cycles required for liquefaction and the rate of excess pore generation, which will be discussed later.

3.2. Liquefaction Behavior of Sand–Fly Ash Mixtures

The results from dynamic triaxial tests on sand–fly ash mixtures containing 0, 10, 20, 30, and 40% fly ash are presented herein to assess the effect of fly ash addition on the liquefaction resistance of the sand. This assessment was made in terms of the variation in excess pore pressure ratio ( r u ), with the number of cycles ( N ) and cyclic resistance curves obtained through three distinct experiments with three different cyclic stress ratios at a given relative density ( D r ) and initial effective confining stress ( σ c ). Cyclic resistance curves represent the relationship between the number of cycles to liquefaction ( N l i q ) versus the cyclic stress ratio ( C S R ). In this study, the cyclic stress ratios at 20 cyclic loading cycles ( C S R N = 20 ) was defined as liquefaction resistance.
Figure 7 shows the excess pore pressure ratios and the number of cycles to liquefaction recorded for different sand–fly ash mixtures at a relative density of 40% and effective confining stress of 100 kPa. It can be inferred from the figure that, in all cases, although the stiffness of the specimens appeared to recover during the unloading phase, excess pore pressures accumulated progressively with the applied cyclic loading. The soil-softening was intensified when the excess pore pressure ratios exceeded 75% of the initial effective confining stress, and ultimately, liquefaction ( r u = 1 ) was reached. For a given amplitude of cyclic stress ratio ( C S R of 0.1), the addition of fly ash to sand caused a significant decrease in N l i q , up to a threshold of fly ash content ( F A c ) of 20%. The addition of fly ash beyond 20% was observed to increase N l i q . The rate of excess pore pressure generation was higher for sand–fly ash specimens compared to pure sand.
The cyclic resistance curves and variation in liquefaction resistance with fly ash content are depicted in Figure 8 to discuss the effect of fly ash at different amplitudes of cyclic stress. The number of cycles to liquefaction was inversely proportional to the cyclic stress ratio ( N l i q decreasing with increasing C S R ). It may be seen from the figure that, irrespective of the cyclic stress ratio, the pure sand exhibited the highest liquefaction resistance, and the sand specimen containing 20% fly ash had the lowest strength. The liquefaction resistance of sand was approximately 0.18, which was about 1.62 times that of the specimen containing 20% fly ash, and 1.07 times that of the specimen with 40% fly ash content. The liquefaction resistance of sand with 10% fly ash content almost coincided with that of sand with 40% fly ash content.
Figure 9 compares excess pore pressure ratios and cyclic resistance curves of pure sand and sand–fly ash specimens having relative densities of 40% and 55%. For a given effective confining stress ( σ c = 100 kPa) and cyclic stress ratio ( C S R = 0.15 ), the loose sand showed rapid excess pore pressure generation and reached liquefaction after about 50 loading cycles. However, the rate of excess pore pressure generation was lower for the medium-dense sand than for the loose sand specimen, and medium-dense sand liquefied after 151 cycles. As expected, the liquefaction resistance of sand was observed to increase with increasing relative density. Similar patterns were also observed for the sand specimens with 30% fly ash. It appears that the liquefaction resistance of sand–fly ash mixtures was sensitive to variations in the relative density.
Figure 10 shows the effect of effective confining stress on excess pore generation and cyclic triaxial behavior of pure sand and sand–fly ash mixtures. The experiments conducted at the same cyclic stress ratio and relative density but two different effective confining stresses revealed that both pure sand and sand specimens with fly ash at lower confining stress ( σ c = 50 kPa) required a much larger number of loading cycles for liquefaction than those at higher confining stress ( σ c = 100 kPa). What is interesting in Figure 10 is that the effect of effective confining stress was somewhat more pronounced for sand–fly ash mixtures than for pure specimens. These results may imply that effective confining stress is an influencing factor, and sands with fly ash will show greater resistance to liquefaction under lower effective confining stresses.

3.3. Liquefaction Behavior of Sand–Tire Crumb Rubber Mixtures

Figure 11 shows the tendency of the excess pore pressure generation during undrained cyclic loading of sand–tire rubber specimens containing 0, 5, 10, 20, and 30% of tire crumb rubber by weight at a relative density of 40%, an effective confining pressure of 100 kPa, and a cyclic stress ratio of 0.15.
As can be seen from the figure, the excess pore pressure ratio in pure sand increased and ultimately reached 1. It suffered a sudden increase in excess pore pressure, especially beyond r u = 0.75, implying a transition point from insignificant to rapid deformation. The dynamic pore pressure behavior of the sand specimen with lower tire crumb rubber content (10%) was similar to that of pure sand. On the other hand, in sand specimens with 20 and 30% of tire crumb rubber, excess pore pressure ratios increased in a comparatively slower manner and finally approached 1. The rate of excess pore pressure accumulation after r u = 0.75 was much lower in this case. The number of cycles to liquefaction was seen to continuously increase with increasing tire crumb rubber content. The pure sand specimen liquefied after 50 cycles, whereas liquefaction occurred after 52, 61, 87, and 102 cycles for sand with 5, 10, 20, and 30% rubber content, respectively.
Figure 12 shows the cyclic resistance curves for sand mixtures with different tire crumb rubber content at a relative density of 40% and effective confining stress of 100 kPa. The liquefaction resistance of sand specimens was seen to increase when mixed with tire crumb rubber. The results showed a higher rate of increase in the liquefaction resistance, particularly after 10% percent of tire crumb rubber. The test results also revealed that although the tire crumb rubber increased the resistance of sand to liquefaction, sands with tire crumb rubber may suffer liquefaction if the magnitude and number of cyclic shear stresses are sufficient.
Figure 13 shows the influence of effective confining stress on the undrained excess pore pressure behavior of sand–tire crumb rubber mixtures with a rubber content of 10%. It seems that a higher effective confining stress caused an increase in the number of cycles to liquefaction. At a relative density of 40% and cyclic stress ratio of 0.15, the sand-only specimen reached liquefaction after 61 cycles, whereas the sand–tire crumb rubber mixture was liquified after 85 cycles.
Based on the experimental observation presented above, it is concluded that the addition of tire crumb rubber enhances the liquefaction resistance of the sand, controlling the build-up of excess pore pressures during cyclic shear. The sand–tire crumb rubber mixtures will have a greater liquefaction resistance than the pure sand specimens. The beneficial effect of tire crumb rubber is expected to be more noticeable with a relatively higher rubber content and higher confining stress.

3.4. Comparative Discussion of Test Results

The experimental results derived from this study are compared with those collected from the previous studies to discuss the soundness of the experimental observations and their implications for liquefaction mitigation in practice. Moreover, the mechanisms governing the cyclic undrained behavior of saturated sand–fly ash and sand–tire crumb rubber mixtures were elucidated. This discussion is made based on the liquefaction resistance ( C S R N = 20 ) and liquefaction resistance ratios ( L R R ) determined by processing N l i q C S R data. The liquefaction resistance ratio ( L R R ) was defined as the liquefaction resistance of sand–fly ash or sand–tire crumb rubber mixture normalized with that of pure sand:
L R R = ( C S R N = 20 ) w a s t e ( C S R N = 20 ) s a n d
where ( C S R N = 20 ) s a n d and ( C S R N = 20 ) w a s t e correspond to cyclic stress ratios at 20 loading cycles for pure sand and the mixture of sand–waste material (fly ash or tire crumb rubber), respectively.
Figure 14 and Figure 15 compare the experimental data from this study with those of Tamang [75]. In the present study, the liquefaction resistance of sand sharply decreased with the inclusion of fly ash (FA = 0–20%) and then increased (FA = 20–40%). On the other hand, Tamang [75] initially showed a slight decrease in the liquefaction resistance of sand (FA = 0–20%), and then a sharp increase (FA = 20–25%), followed by a sharp drop (FA = 20–25%). The liquefaction resistance of sand started to increase on a further increase in the fly ash content (FA = 30–50%). The apparent inconsistencies in the test results may be attributed to the different nature of the fly ash used in these studies. The influence of fly ash having different physical and chemical properties is expected to be vastly different even for the same density and loading condition.
The variation in liquefaction potential with the inclusion of fly ash containing silt-sized non-plastic particles ( ( D 50 ) f l y   a s h   ( D 50 ) s a n d   > 0.23 ) can be ascribed to the progressive change of the soil fabric and the increase/decrease in particle interlock depending on the amount of fly ash in the voids. Thevanayagam et al. [76] suggested that, below threshold fines content, fines filling the voids of sand were unable to move, actively participate in the force chain, and transfer the cyclic loads to the sand particles. This may explain the increasing liquefaction potential below fly ash content of 20%. It is noted that the preparation of triaxial specimens with sand–fly ash mixtures was particularly difficult when the fly ash content was beyond 40%, and, therefore, the data was available only for a limited range of fly ash content (0–40%) in this study. Further research will be useful to draw a more concrete conclusion about this aspect.
Figure 16 compares the results of this study with the results of previously published studies on sand–tire rubber mixtures. In these studies, the mean grain size of the tire rubber was usually a few times larger than that of the sand ( ( D 50 ) r u b b e r   ( D 50 ) s a n d   = 3.25 4.76 ). In the current study, for any given relative density and effective confining stress, the presence of tire crumb rubber ( ( D 50 ) r u b b e r   ( D 50 ) s a n d   4 ) was found to cause an increase in the liquefaction resistance of the sand. This observation was consistent with that of Enquan and Qiong [58], who considered rubber particles 4.76 times larger than sand particles sand ( ( D 50 ) r u b b e r   ( D 50 ) s a n d   = 4.76 ). Shariatmadari et al. [77] showed that the liquefaction resistance of sand–tire rubber mixtures with ( D 50 ) r u b b e r   ( D 50 ) s a n d   3.25 initially decreased as the tire rubber content increased from 0–10% and then slightly recovered with a further increase in the rubber content (10–25%). The above-mentioned results were, however, applicable to a limited range of rubber content. Mashiri [78] considered a wider range of rubber (tire chips) content and established the existence of a threshold rubber content. The liquefaction resistance of sand–rubber mixtures appeared to increase until the rubber content exceeded 30% and decreased beyond this threshold value.
This apparent increase in the liquefaction resistance of sand can be attributed to the increase in the permeability due to the addition of tire crumb rubber to the sand (rubber particles are larger than sand particles) and/or the increase in the compressibility of the sand matrix with the inclusion of highly elastic tire crumb rubber particles. For the mixtures containing large-size rubber particles (e.g., ( D 50 ) r u b b e r   ( D 50 ) s a n d   4 ), Li et al. [79] suggested that the second effect was more significant, especially at higher effective confining stresses. It is expected that the sand–tire rubber mixtures may be compressed more easily than the pure sand specimens, reducing the build-up of excess pore pressures and increasing the liquefaction resistance when subjected to cyclic loading.
Prediction of excess pore pressure is of great importance in liquefaction-related studies, and different stress-based empirical models relating excess pore pressure ratios ( r u ) to the cycle ratio ( N N l i q ), are proposed for this purpose. Table 3 presents some of the models widely used in design practice to predict the excess pore pressures generated in sand specimens with or without fines.
Figure 17 compares the predictions of three different models with the excess pore pressure ratios obtained for pure sand specimens at a relative density of ≈40%, an effective confining pressure of 100 kPa, and cyclic stress ratios of 0.1–0.15. It is evident that the performance of these models strongly relies on the selection of the empirical coefficients which define the upper and lower bounds of the prediction curves and are typically determined via stress-controlled cyclic tests in undrained conditions.
The method of Seed et al. [80] and Polito et al. [81] seems to provide a reasonable prediction of excess pore pressures, satisfactorily capturing the increasing trend in the build-up of excess pore pressure ratio with increasing cycle ratio. The apparent deviation from the predicted boundaries particularly at the early stages of cyclic loading can be reduced by modifying the fitting coefficients which are soil-specific.
Figure 18 presents excess pore pressure ratios obtained for fly ash–sand and rubber–sand mixtures and their comparison with the prediction of the hyperbolic model proposed by Enquan and Qiong [58]. It is seen that, using reasonable upper and lower bound coefficients, this hyperbolic model provided adequately accurate predictions, engulfing the majority of the excess pore pressure data.

4. Conclusions and Recommendations

Fly ash and tire crumb rubber are viable alternative materials for geotechnical applications. The reuse of related waste materials in mitigating earthquake-induced liquefaction effects is a sustainable and economic alternative to traditional soil improvement methods, which will contribute to the elimination of environmental problems associated with their disposal. In this study, a set of stress-controlled, undrained, dynamic triaxial experiments were conducted to investigate the effect of fly ash and tire crumb rubber on the build-up of excess pore pressure and liquefaction potential of saturated sand. For this purpose, loose and medium-dense triaxial specimens were prepared by mixing pure sand with fly ash or tire crumb rubber at prescribed ratios by weight. The mixtures were subjected to cyclic loading under varying effective confining stresses and cyclic stress ratios. The following conclusions were drawn from the test results:
(1)
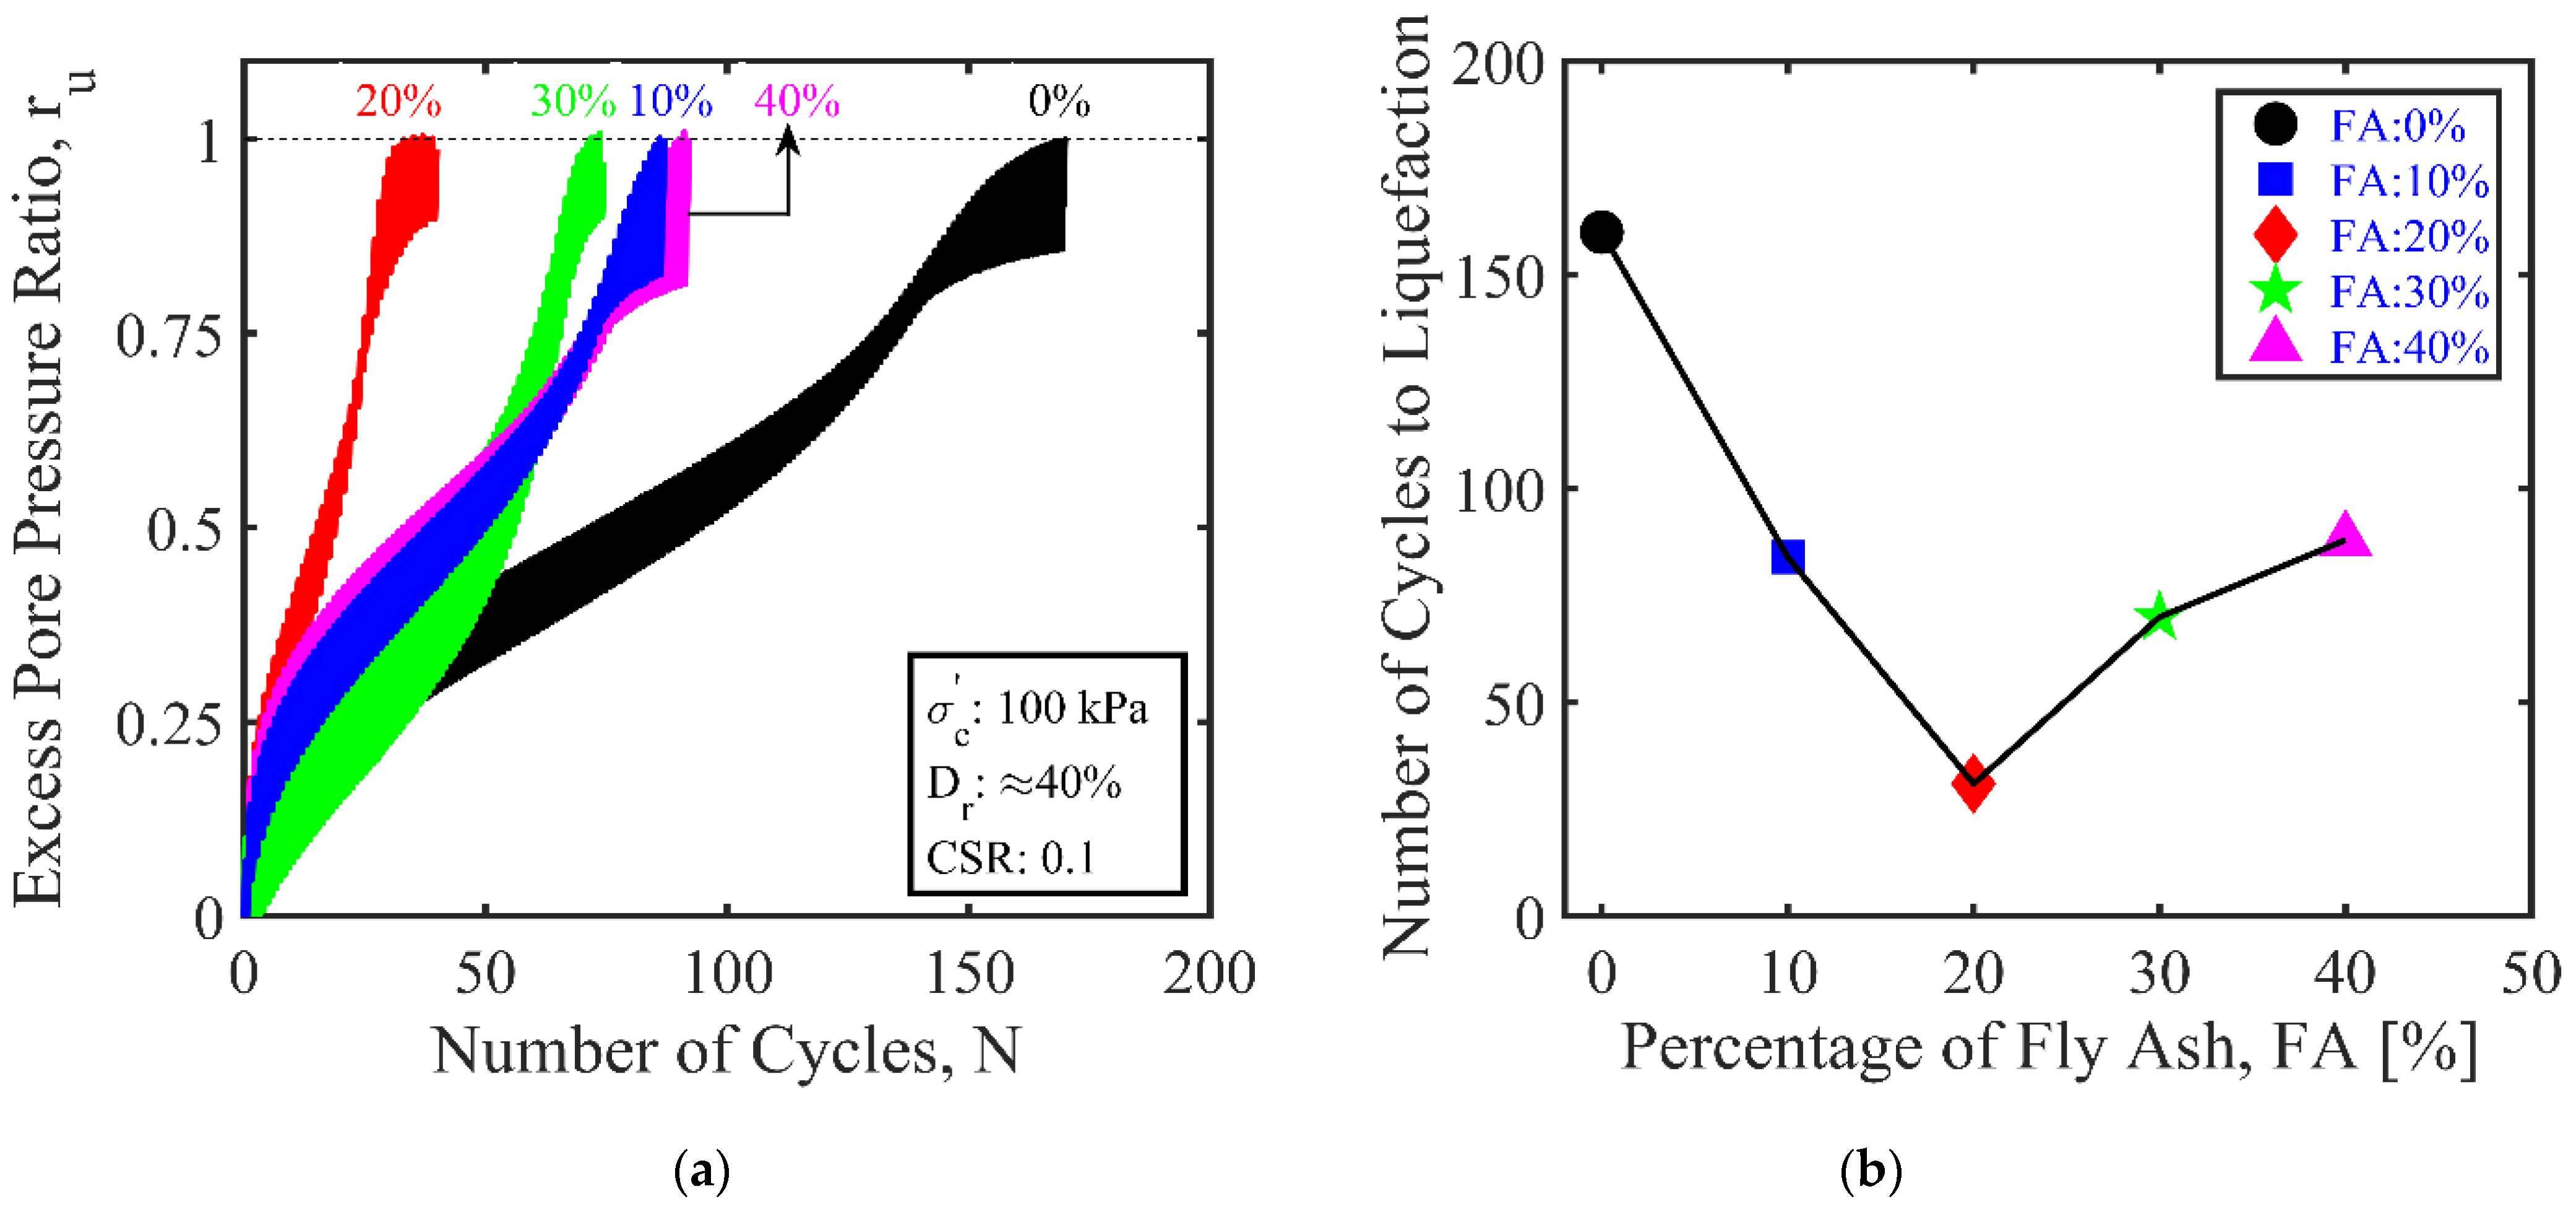
For a given relative density and effective confining stress, the liquefaction resistance of the sand–fly ash mixture decreased as the fly ash content in the mixtures increased up to 20%. Some of the liquefaction strength recovered when fly ash was added up to 40%.
(2)
Under the range of fly ash contents tested in this study, the liquefaction resistance of pure sand specimens was always greater than that of sand specimens containing non-plastic fly ash particles.
(3)
The liquefaction resistance of sand with fly ash was affected by the confinement pressure. The sand–fly ash mixtures appeared to possess a higher liquefaction resistance under a lower effective confining stress. Similar results were observed for the pure sand specimens.
(4)
The rate of the build-up of excess pore pressure was higher in the sand–fly ash mixtures than in sand-only specimens, which was attributed to the decreased permeability of sand with the inclusion of silt-sized fly ash particles ( ( D 50 ) f l y   a s h   ( D 50 ) s a n d   > 0.23 ).
(5)
The addition of tire crumb rubber to sand ( ( D 50 ) r u b b e r   ( D 50 ) s a n d   4 ) reduced the generation of excess pore pressure due to the increased compressibility of the soil matrix, thus improving resistance to liquefaction. The enhancement in liquefaction resistance was smaller at up to 10% tire crumb rubber content, but it was relatively greater beyond this value (10–30%).
(6)
For a given relative density and rubber content, sand–tire crumb rubber mixtures at an effective confining stress of 200 kPa had a higher liquefaction resistance than those at 100 kPa, suggesting that the beneficial effect of tire crumb rubber was more noticeable under higher confining stress.
(7)
Tire crumb rubber appeared to offer a better solution than fly ash in improving the liquefaction resistance of the sand.
The results presented in this study are valid only for a limited range of fly ash or tire crumb rubber contents. Further dynamic triaxial experiments at wider ranges will be useful to establish the optimum fly ash and tire crumb rubber content for engineering applications involving liquefaction mitigation. Moreover, the results are assessed on a basis of relative density, and further research should verify their applicability using different packing index parameters, such as the global void ratio or the skeleton void ratio. Finally, the conclusions are deduced from dynamic triaxial tests on podima sand, Class F fly ash (Seyitömer), and crumb rubber, and they may not be generalized for other types of test materials and test conditions.

Author Contributions

A.Z.: conceptualization, data curation, funding acquisition, supervision, investigation, methodology, writing—original draft. M.E.: investigation, resources. All authors have read and agreed to the published version of the manuscript.

Funding

This work was supported by the Muş Alparslan University Scientific Research Coordination Unit [Grant No. BAP-22-MMF-4902-05].

Institutional Review Board Statement

Not applicable.

Informed Consent Statement

Not applicable.

Data Availability Statement

The data presented in this study are available from the author upon reasonable request.

Acknowledgments

The authors would like to express their appreciation for the assistance of the technical staff during the experiments conducted at the Civil Engineering Laboratory of Muş Alparslan University.

Conflicts of Interest

The author declares no conflict of interest.

References

  1. Bhattacharya, S.; Hyodo, M.; Goda, K.; Tazoh, T.; Taylor, C.A. Liquefaction of soil in the Tokyo Bay area from the 2011 Tohoku (Japan) earthquake. Soil Dyn. Earthq. Eng. 2011, 31, 1618–1628. [Google Scholar] [CrossRef]
  2. Bertalot, D.; Brennan, A.J.; Villalobos, F.A. Influence of bearing pressure on liquefaction-induced settlement of shallow foundations. Géotechnique 2013, 63, 391–399. [Google Scholar] [CrossRef]
  3. Seed, H.B.; Lee, K.L. Liquefaction of saturated sands during cyclic loading. J. Soil Mech. Found. Div. 1966, 92, 105–134. [Google Scholar] [CrossRef]
  4. Ishihara, K. Liquefaction and flow failure during earthquakes. Géotechnique 1993, 43, 351–451. [Google Scholar] [CrossRef]
  5. Seed, H.B.; Peacock, W.H. Test procedures for measuring soil liquefaction characteristics. J. Geotech. Eng. Div. Am. Soc. Civ. Eng. 1971, 97, 1099–1119. [Google Scholar] [CrossRef]
  6. Stewart, J.P.; Chu, D.B.; Seed, R.B.; Ju, J.W.; Perkins, W.J.; Boulanger, R.W.; Chen, Y.C.; Ou, C.Y.; Sun, J.; Yu, M.S. Chi–Chi earthquake reconnaissance report: Soil liquefaction. Earthq. Spectra 2001, 17, 37–60. [Google Scholar] [CrossRef]
  7. Thevanaygam, S.; Mohan, S. Intergranular state variables and stress-strain behaviour of silty sands. Geotechnique 2000, 50, 1–23. [Google Scholar] [CrossRef]
  8. Altun, S.; Goktepe, A.; Akguner, C. Cyclic Shear Strength of Silts and Sands under Cyclic Loading. In Proceedings of the Earthquake Engineering and Soil Dynamics, Geo-Frontiers Congress, Austin, TX, USA, 24–26 January 2005; pp. 1–11. [Google Scholar] [CrossRef]
  9. Hernandez, Y.A.; Towhata, I.; Gunji, K.; Yamada, S. Laboratory tests on cyclic undrained behavior of loose sand with cohesionless silt and its application to assessment of seismic performance of subsoil. Soil Dyn. Earthq. Eng. 2015, 79, 365–378. [Google Scholar] [CrossRef]
  10. Cubrinovski, M.; Rees, S. Effects of Fines on Undrained Behaviour of Sands. In Proceedings of the Geotechnical Earthquake Engineering and Soil Dynamics Congress IV, Sacramento, CA, USA, 18–22 May 2008; pp. 18–22. [Google Scholar] [CrossRef] [Green Version]
  11. Seed, H.B.; Tokimatsu, K.; Harder, L.F.; Chung, R.M. The influence of SPT procedures in soil liquefaction resistance evaluations. J. Geotech. Eng. Div. Am. Soc. Civ. Eng. 1985, 111, 1425–1445. [Google Scholar] [CrossRef]
  12. Ishihara, K.; Koseki, J. Discussion on the Cyclic Shear Strength of Fines Containing Sands, Earthquake Geotechnical Engineering. In Proceedings of the 12th International Conference on Soil Mechanics and Foundation Engineering, Rio de Janeiro, Brazil, 13–18 August 1989; pp. 101–106. [Google Scholar]
  13. Koester, J.P. The influence of fines type and content on cyclic strength: Ground failures under seismic conditions. Geotech. Spec. Publ. Am. Soc. Civ. Eng. 1994, 44, 330–345. [Google Scholar]
  14. Ishihara, K.; Yasuda, S.; Yokota, K. Cyclic strength of undisturbed mine tailings. In Proceedings of the First International Conference on Recent Advances in Geotechnical Earthquake Engineering and Soil Dynamics, St. Louis, MI, USA, 26 April–3 May 1981; pp. 53–58. [Google Scholar]
  15. Gratchev, I.B.; Sassa, K.; Osipov, V.I.; Sokolov, V.N. The liquefaction of clayey soils under cyclic loading. Eng. Geol. 2006, 86, 70–84. [Google Scholar] [CrossRef]
  16. Park, S.S.; Kim, Y.S. Liquefaction resistance of sands containing plastic fines with different plasticity. J. Geotech. Geoenviron. Eng. 2013, 139, 825–830. [Google Scholar] [CrossRef]
  17. Polito, C.P. The Effects of Non-Plastic and Plastic Fines on the Liquefaction of Sandy Soils. Ph.D. Thesis, Virginia Tech. University, Blacksburg, VA, USA, 1999. [Google Scholar]
  18. Ghahremani, M.; Ghalandarzadeh, A. Effect of plastic fines on cyclic resistance of sands. In Proceedings of the Soil and Rock Behavior and Modeling, GeoShanghai International Conference, Shanghai, China, 6–8 June 2006; pp. 406–412. [Google Scholar] [CrossRef]
  19. Mitchell, J.K.; Baxter, C.D.P.; Munson, T.C. Performance of Improved Ground during Earthquakes. In Soil Improvement for Earthquake Hazard Mitigation, Geotechnical Special Publication. Am. Soc. Civ. Eng. 1995, 49, 1–36. [Google Scholar]
  20. Gallagher, P.M.; Pamuk, A.; Abdoun, T. Stabilization of liquefiable soils using colloidal silica grout. J. Mater. Civ. Eng. 2007, 19, 33–40. [Google Scholar] [CrossRef]
  21. Karol, R.H. Chemical Grouting and Soil Stabilization, 3rd ed.; Revised and Expanded; Marcel Dekker: New York, NY, USA, 2003. [Google Scholar]
  22. Yuan, S.; Sui, W.; Han, G.; Duan, W. An optimized combination of mine water control, treatment, utilization, and reinjection for environmentally sustainable mining: A case study. Mine Water Environ. 2022, 41, 828–839. [Google Scholar] [CrossRef]
  23. Yang, B.; Liu, J.; Zhao, X.; Zheng, S. Evaporation and cracked soda soil improved by fly ash from recycled materials. Land Degrad. Dev. 2021, 32, 2823–2832. [Google Scholar] [CrossRef]
  24. Bilgen, G.; Altuntas, F. Sustainable re-use of waste glass, cement and lime treated dredged material as pavement material. Case Stud. Constr. Mater. 2023, 18, e01815. [Google Scholar] [CrossRef]
  25. Towhata, I. Geotechnical Earthquake Engineering; Springer: Berlin, Germany, 2008. [Google Scholar]
  26. Yoon, S.; Balunaini, U.; Yildrim, I.Z.; Prezzi, M.; Siddiki, N.Z. Construction of an embankment with a fly and bottom ash mixture: Field performance study. J. Mater. Civ. Eng. 2009, 21, 271–278. [Google Scholar] [CrossRef]
  27. Cristelo, N.; Glendinning, S.; Miranda, T.; Oliveira, D.; Silva, R. Soil stabilization using alkaline activation of fly ash for self-compacting rammed earth construction. Constr. Build. Mater. 2012, 36, 727–735. [Google Scholar] [CrossRef] [Green Version]
  28. Edil, T.B.; Acosta, H.A.; Benson, C.H. Stabilizing soft fine-grained soils with fly ash. J. Mater. Civ. Eng. 2006, 18, 283–294. [Google Scholar] [CrossRef]
  29. Mir, B.A.; Sridharan, A. Physical and compaction behaviour of clay soil–fly ash mixtures. Geotech. Geol. Eng. 2013, 31, 1059–1072. [Google Scholar] [CrossRef]
  30. Turan, C.; Javadi, A.A.; Vinai, R.; Beig Zali, R. Geotechnical characteristics of fine-grained soils stabilized with fly ash, a review. Sustainability 2022, 14, 16710. [Google Scholar] [CrossRef]
  31. Zand, B.; Tu, W.; Amaya, P.J.; Wolfe, W.E.; Butalia, T.S. An experimental investigation on liquefaction potential and postliquefaction shear strength of impounded fly ash. Fuel 2009, 88, 1160–1166. [Google Scholar] [CrossRef]
  32. Baki, M.A.L.; Rahman, M.M.; Lo, S.R. Liquefaction of a coal ash investigated by monotonic and cyclic triaxial tests. Soils Found. 2019, 59, 1522–1536. [Google Scholar] [CrossRef]
  33. Nong, Z.Z.; Park, S.S.; Lee, S.B.; Jiang, P.M. Cyclic resistance of fly ash influenced by anisotropic stress condition, sand contents, and gravel content. Soils Found. 2022, 62, 101157. [Google Scholar] [CrossRef]
  34. Chattaraj, R.; Sengupta, A. Dynamic properties of fly ash. J. Mater. Civ. Eng. 2017, 29, 04016190. [Google Scholar] [CrossRef]
  35. Keramatikerman, M.; Chegenizadeh, A.; Nikraz, H. Experimental study on effect of fly ash on liquefaction resistance of sand. Soil Dyn. Earthquake Eng. 2017, 93, 1–6. [Google Scholar] [CrossRef]
  36. Kolay, P.K.; Puri, V.K.; Tamang, R.L.; Regmi, G.; Kumar, S. Effects of fly ash on liquefaction characteristics of Ottawa sand. Int. J. Geosynth. Ground Eng. 2019, 5, 1–14. [Google Scholar] [CrossRef]
  37. Barman, P.; Singh, B. Strength characteristics of sand amended with two waste materials—Fly ash and scrap tyre. Environ. Process. 2020, 7, 653–672. [Google Scholar] [CrossRef]
  38. ASTM D6270-20; Standard Practice for Use of Scrap Tires in Civil Engineering Applications. ASTM International: West Conshohocken, PA, USA, 2020. [CrossRef]
  39. Hazarika, H.; Yasuhara, K.; Kikuchi, Y.; Karmokar, A.K.; Mitarai, Y. Multifaceted potentials of tire-derived three dimensional geosynthetics in geotechnical applications and their evaluation. Geotext. Geomembr. 2010, 28, 303–315. [Google Scholar] [CrossRef]
  40. Tasalloti, A.; Chiaro, G.; Murali, A.; Banasiak, L. Physical and mechanical properties of granulated rubber mixed with granular soils-a literature review. Sustainability 2021, 13, 4309. [Google Scholar] [CrossRef]
  41. Bosscher, P.J.; Edil, T.B.; Kuraoka, S. Design of highway embankments using tire chips. J. Geotech. Geoenviron. Eng. 1997, 123, 295–304. [Google Scholar] [CrossRef]
  42. Hazarika, H.; Kohama, E.; Sugano, T. Underwater shake table tests on waterfront structures protected with tire chips cushion. J. Geotech. Geoenviron. Eng. 2008, 134, 1706–1719. [Google Scholar] [CrossRef]
  43. Bazienė, K.; Vaiškūnaitė, R. Research of sustainable use of tire shreds in landfill. Sustainability 2016, 8, 767. [Google Scholar] [CrossRef]
  44. Tsang, H.H.; Lo, S.H.; Xu, X.; Sheikh, M.N. Seismic isolation for low-to-medium-rise building using granulated rubber-soil mixtures: Numerical study. Earthquake Eng. Struct. Dyn. 2012, 41, 2009–2024. [Google Scholar] [CrossRef]
  45. Hazarika, H.; Pasha, S.M.K.; Ishibashi, I.; Yoshimoto, N.; Kinoshita, T.; Endo, S.; Karmokar, A.K.; Hitosugi, T. Tire-chip reinforced foundation as liquefaction countermeasure for residential buildings. Soils Found. 2020, 60, 315–326. [Google Scholar] [CrossRef]
  46. Foose, G.J.; Benson, C.H.; Bosscher, P. Sand reinforced with shredded wastes tires. J. Geotech. Eng. 1996, 122, 760–767. [Google Scholar] [CrossRef]
  47. Anvari, S.M.; Shooshpasha, I.; Kutanaei, S.S. Effect of granulated rubber on shear strength of fine-grained sand. J. Rock Mech. Geotech. Eng. 2017, 9, 936–944. [Google Scholar] [CrossRef]
  48. Youwai, S.; Bergado, D.T. Strength and deformation characteristics of shredded rubber tire sand mixtures. Can. Geotech. J. 2003, 40, 254–264. [Google Scholar] [CrossRef]
  49. Sheikh, M.N.; Mashiri, M.S.; Vinod, J.S.; Tsang, H.H. Shear and compressibility behavior of sand-tire crumb mixtures. J. Mater. Civ. Eng. 2013, 25, 1366–1374. [Google Scholar] [CrossRef]
  50. Noorzad, R.; Raveshi, M. Mechanical behavior of waste tire crumbs–sand mixtures determined by triaxial tests. Geotech. Geol. Eng. 2017, 35, 1793–1802. [Google Scholar] [CrossRef]
  51. Senetakis, K.; Anastasiadis, A.; Pitilakis, K. Dynamic properties of dry sand/rubber (SRM) and gravel/rubber (GRM) mixtures in a wide range of shearing strain amplitudes. Soil Dyn. Earthq. Eng. 2012, 33, 38–53. [Google Scholar] [CrossRef]
  52. Pistolas, G.; Anastasiadis, A.; Pitilakis, K. Dynamic behaviour of granular soil materials mixed with granulated rubber: Effect of rubber content and granularity on the small-strain shear modulus and damping ratio. Geotech. Geol. Eng. 2018, 36, 1267–1281. [Google Scholar] [CrossRef]
  53. Okur, D.V.; Umu, S.U. Dynamic properties of clean sand modified with granulated rubber. Adv. Civ. Eng. 2018, 2018, 5209494. [Google Scholar] [CrossRef]
  54. Sarajpoor, S.; Kavand, A.; Zogh, P.; Ghalandarzadeh, A. Dynamic behavior of sand-rubber mixtures based on hollow cylinder tests. Constr. Build. Mater. 2020, 251, 118948. [Google Scholar] [CrossRef]
  55. Hazarika, H.; Hyodo, M.; Yasuhara, K. Investigation of tire chips-sand mixtures as preventive measure against liquefaction. In Proceedings of the Ground Improvement and Geosynthetics, GeoShanghai International Conference, Shanghai, China, 3–5 June 2010; pp. 338–345. [Google Scholar] [CrossRef]
  56. Kaneko, T.; Orense, R.P.; Hyodo, M.; Yoshimoto, N. Seismic response characteristics of saturated sand deposits mixed with tire chips. J. Geotech. Geoenviron. Eng. 2013, 139, 633–643. [Google Scholar] [CrossRef]
  57. Bahadori, H.; Manafi, S. Effect of tyre chips on dynamic properties of saturated sands. Int. J. Phys. Model. Geotech. 2015, 15, 116–128. [Google Scholar] [CrossRef]
  58. Enquan, Z.; Qiong, W. Experimental investigation on shear strength and liquefaction potential of rubber-sand mixtures. Adv. Civ. Eng. 2019, 2019, 5934961. [Google Scholar] [CrossRef]
  59. Promputthangkoon, P.; Hyde, A.F.L. Compressibility and Liquefaction Potential of Rubber Composite Soils. In Proceedings of the International Workshop on Scrap Tire Derived Geomaterials-Opportunities and Challenges, Yokosuka, Japan, 23–24 March 2008; pp. 161–170. [Google Scholar]
  60. Shariatmadari, N.; Karimpour-Fard, M.; Shargh, A. Evaluation of liquefaction potential in sand-tire crumb mixtures using the energy approach. Int. J. Civ. Eng. 2019, 17, 181–191. [Google Scholar] [CrossRef]
  61. Mashiri, M.S.; Vinod, J.S.; Sheikh, M.N. Liquefaction potential and dynamic properties of sand-tyre chip (STCh) mixtures. Geotech. Test. J. 2016, 39, 69–79. [Google Scholar] [CrossRef]
  62. Tsuchida, H. Prediction and Countermeasure against the Liquefaction in Sand Deposits. In Abstract of the Seminar at the Port and Harbour Research Institute; Japanese Ministry of Transport: Yokosuka, Japan, 1970; pp. 3.1–3.33. [Google Scholar]
  63. ASTM D6913/D6913M-17; Standard Test Methods for Particle-Size Distribution (Gradation) of Soils Using Sieve Analysis. ASTM International: West Conshohocken, PA, USA, 2017. [CrossRef]
  64. ASTM D854-14; Standard Test Methods for Specific Gravity of Soil Solids by Water Pycnometer. ASTM International: West Conshohocken, PA, USA, 2014. [CrossRef]
  65. ASTM D4253-16e1; Standard Test Methods for Maximum Index Density and Unit Weight of Soils Using a Vibratory Table. ASTM International: West Conshohocken, PA, USA, 2019. [CrossRef]
  66. ASTM D4254-16; Standard Test Methods for Minimum Index Density and Unit Weight of Soils and Calculation of Relative Density. ASTM International: West Conshohocken, PA, USA, 2016. [CrossRef]
  67. Bayat, O. Characterisation of Turkish fly ashes. Fuel 1998, 77, 1059–1066. [Google Scholar] [CrossRef]
  68. Cicek, T.; Tanrıverdi, M. Lime based steam autoclaved fly ash bricks. Constr. Build. Mater. 2007, 21, 1295–1300. [Google Scholar] [CrossRef]
  69. Demir, I.; Başpınar, M.S.; Görhan, G.; Kahraman, E. Preliminary investigation of Seyitomer fly ash for use in building brick manufacturing. Afyon Kocatepe Üniversitesi Fen Ve Mühendislik Bilimleri Dergisi 2009, 9, 131–137. Available online: https://dergipark.org.tr/tr/pub/akufemubid/issue/1612/20162 (accessed on 15 January 2023).
  70. Monkul, M.M.; Etminan, E.; Şenol, A. Influence of coefficient of uniformity and base sand gradation on static liquefaction of loose sands with silt. Soil Dyn. Earthq. Eng. 2016, 89, 185–197. [Google Scholar] [CrossRef]
  71. Lade, P.V.; Liggio, C.D.; Yamamuro, J.A. Effects of non-plastic fines on minimum and maximum void ratios of sand. Geotech. Test. J. 1998, 21, 336–347. [Google Scholar] [CrossRef]
  72. Thevanayagam, S. Effect of fines and confining stress on undrained shear strength of silty sands. J. Geotech. Geoenviron. Eng. 1998, 124, 479–491. [Google Scholar] [CrossRef]
  73. Amini, F.; Qi, G.Z. Liquefaction testing of stratified silty sands. J. Geotech. Geoenviron. Eng. 2000, 126, 208–217. [Google Scholar] [CrossRef]
  74. ASTM D5311/D5311M-13; Standard Test Method for Load Controlled Cyclic Triaxial Strength of Soil. ASTM International: West Conshohocken, PA, USA, 2013. [CrossRef]
  75. Tamang, L.R. Effects of Addition of Small Percentages of Fly Ash on Liquefaction Characteristics of Sand. Master’s Thesis, Southern Illinois University, Carbondale, IL, USA, 2014. [Google Scholar]
  76. Thevanayagam, S.; Fiorillo, M.; Liang, J. Effects of non-plastic fines on undrained cyclic strength of silty sands. In Proceedings of the Soil Dynamics and Liquefaction, Geo-Denver 2000, Denver, CA, USA, 5–8 August 2020; pp. 77–91. [Google Scholar] [CrossRef]
  77. Shariatmadari, N.; Karimpour-Fard, M.; Shargh, A. Undrained monotonic and cyclic behavior of sand-ground rubber mixtures. Earthq. Eng. Eng. Vib. 2018, 17, 541–553. [Google Scholar] [CrossRef]
  78. Mashiri, M.S. Monotonic and Cyclic Behaviour of Sand-Tyre Chip (Stch) Mixtures. Ph.D. Thesis, University of Wollongong, Kowloon City, Hong Kong, 2014. [Google Scholar]
  79. Li, B.; Huang, M.; Zeng, X. Dynamic behavior and liquefaction analysis of recycled-rubber sand mixtures. J. Mater. Civ. Eng. 2016, 28, 04016122. [Google Scholar] [CrossRef]
  80. Seed, H.B.; Idriss, I.M.; Makdisi, F.; Banerjee, N. EERC 75-29 Report: Representation of Irregular Stress Time Histories by Equivalent Uniform Stress Series in Liquefaction Analyses; Earthquake Engineering Research Center, University of California: Berkeley, CA, USA, 1975. [Google Scholar]
  81. Polito, C.P.; Green, R.A.; Lee, J. Pore pressure generation models for sands and silty soils subjected to cyclic loading. J. Geotech. Geoenviron. Eng. 2008, 134, 1490–1500. [Google Scholar] [CrossRef]
  82. Baziar, M.H.; Shahnazari, H.; Sharafi, H. A laboratory study on the pore pressure generation model for Firouzkooh silty sands using hollow torsional test. Int. J. Civ. Eng. 2011, 9, 126–134. Available online: http://ijce.iust.ac.ir/article-1-489-en.html (accessed on 15 January 2023).
Figure 1. A picture of the dynamic triaxial test system at Mus Alparslan University.
Sustainability 15 02960 g001
Figure 2. Particle size distribution curve of podima sand, Seyitomer fly ash, and tire crumb rubber, and their comparisons with the liquefaction boundaries proposed by Tsuchida [62].
Sustainability 15 02960 g002
Figure 3. Variation in minimum and maximum void ratios with the addition of fly ash and tire crumb rubber to sand: (a) sand–fly ash mixtures; (b) sand–tire crumb rubber mixtures.
Sustainability 15 02960 g003
Figure 4. Examples of images from experiments involving sand–fly ash mixtures.
Sustainability 15 02960 g004
Figure 5. Examples of images from experiments involving sand–tire crumb rubber mixtures.
Sustainability 15 02960 g005
Figure 6. Typical experimental data recorded for a pure sand specimen: (a) variation in excess pore pressure ratio with the number of cycles; (b) stress degradation with the accumulation of excess pore pressure.
Sustainability 15 02960 g006
Figure 7. Effect of fly ash on excess pore pressure generation: (a) excess pore pressure ratios; (b) the number of cycles to liquefaction recorded at different percentages of fly ash.
Sustainability 15 02960 g007
Figure 8. Effect of fly ash on liquefaction resistance of sand: (a) liquefaction resistance curves for sand–fly ash mixtures; (b) variation in liquefaction resistance with fly ash content.
Sustainability 15 02960 g008
Figure 9. Effect of relative density on cyclic triaxial behavior of pure sand and sand–fly ash mixtures: (a) excess pore pressure ratios; (b) liquefaction resistance curves recorded at two different relative densities.
Sustainability 15 02960 g009
Figure 10. Effect of confining stress on cyclic triaxial behavior of pure sand and sand–fly ash mixtures: (a) excess pore pressure ratios; (b) liquefaction resistance curves recorded at two different confining stresses.
Sustainability 15 02960 g010
Figure 11. Effect of tire crumb rubber on excess pore pressure generation: (a) excess pore pressure ratios; (b) the number of cycles to liquefaction recorded at different percentages of tire crumb rubber.
Sustainability 15 02960 g011
Figure 12. Effect of tire crumb rubber on liquefaction resistance of sand: (a) liquefaction resistance curves for sand–tire crumb rubber mixtures; (b) variation in liquefaction resistance with tire crumb rubber content.
Sustainability 15 02960 g012
Figure 13. Effect of confining stress on cyclic triaxial behavior of sand–tire crumb rubber mixtures: (a) excess pore pressure ratios; (b) liquefaction resistance curves recorded at two different confining stresses.
Sustainability 15 02960 g013
Figure 14. Comparison of the experimental results obtained in the current study with those of Tamang [75]: the variation in the number of cycles to liquefaction with fly ash content.
Sustainability 15 02960 g014
Figure 15. Comparison of the experimental results obtained in this study with those of Tamang [75]: the variation in (a) liquefaction resistance; (b) liquefaction resistance ratio with fly ash content.
Sustainability 15 02960 g015
Figure 16. Comparison of the experimental data obtained in the present study with the results of previous studies [58,77,78]: the variation in (a) liquefaction resistance ratio; (b) the number of cycles to liquefaction with tire crumb rubber content.
Sustainability 15 02960 g016
Figure 17. Excess pore pressure ratios obtained for pure sand and their comparison with different excess pore pressure models [80,81,82].
Sustainability 15 02960 g017
Figure 18. Excess pore pressure ratios obtained for (a) fly ash–sand and (b) rubber–sand mixtures and their comparison with the prediction of the hyperbolic model proposed by Enquan and Qiong [58].
Sustainability 15 02960 g018
Table 1. Specific gravity, minimum, and maximum void ratios calculated for sand–fly ash and sand–tire crumb rubber mixtures prepared at different weight ratios.
Fly AshTire Crumb Rubber
Weight Ratios [%] G s e m i n e m a x G s e m i n e m a x
0 (pure sand)2.630.3980.632.630.3980.63
102.580.290.552.310.410.64
202.520.350.542.050.430.66
302.420.400.751.870.460.68
402.380.460.971.700.500.73
502.360.551.151.540.550.80
100 (pure fly ash or rubber)2.101.462.351.100.891.23
Table 2. Test program and typical test results for pure sand, sand–fly ash, and sand–tire crumb rubber mixtures.
Test
Material(s)
Test
No
Test
ID
D r ( % ) FA or RC (%) σ c ( kPa ) CSR N l i q
Pure sand1CS14001000.10160
2CS24101000.1550
3CS33901000.209
4CS4390500.10280
5CS5400500.1580
6CS6410500.2015
7CS75601000.15151
8CS85501000.17564
9CS95701000.2035
10CS10570500.15281
11CS11550500.175119
12CS12540500.2046
Sand and fly ash13SFA139101000.1084
14SFA240101000.1516
15SFA339101000.204
16SFA438201000.1031
17SFA541201000.156
18SFA640201000.202
19SFA741301000.1070
20SFA840301000.1524
21SFA939301000.205
22SFA1038401000.1088
23SFA1140401000.1532
24SFA1239401000.205
25SFA133930500.10142
26SFA144030500.1538
27SFA153830500.2012
28SFA1656301000.15113
29SFA1755301000.17536
30SFA1854301000.2014
Sand and tire crumb rubber31SR14051000.10196
32SR23951000.1552
33SR34151000.208
34SR441101000.10295
35SR539101000.1561
36SR640101000.2010
37SR740201000.10325
38SR840201000.1587
39SR942201000.2015
40SR1039301000.10490
41SR1141301000.15102
42SR1240301000.2027
43SR1342102000.10370
44SR1440102000.1585
45SR1538102000.2013
Table 3. Stress-based excess pore pressure generation models.
ModelsRelationshipUpper/Lower Coefficients
Seed et al. [80] r u = { 1 2 + 1 π · s i n 1 [ 2 · ( N N l i q ) 1 α 1 ] } α U = 1
α L = 0.6
Polito et al. [81] r u = { 1 2 + 1 π · s i n 1 [ 2 · ( N N l i q ) 1 α 1 ] } α U = 0.93
α L = 0.80
(calculated as a function of D r , F C , and C S R )
Baziar et al. [82] r u = { 2 π · s i n 1 [ ( N N l i q ) 1 2 · α ] } + β 1 { 2 · N N l i q 1 } 2 α U = 0.8 α U = 0.6
β U = 0.25
β L = 0
Enquan and Qiong [58] r u = N N l i q α   +   ( 1 α ) · ( N N l i q ) N / A
Disclaimer/Publisher’s Note: The statements, opinions and data contained in all publications are solely those of the individual author(s) and contributor(s) and not of MDPI and/or the editor(s). MDPI and/or the editor(s) disclaim responsibility for any injury to people or property resulting from any ideas, methods, instructions or products referred to in the content.

