

Improving Cyclists’ Safety Using Intelligent Situational Awareness System


Abstract

1. Introduction
2. Problem Definition
3. Related Works
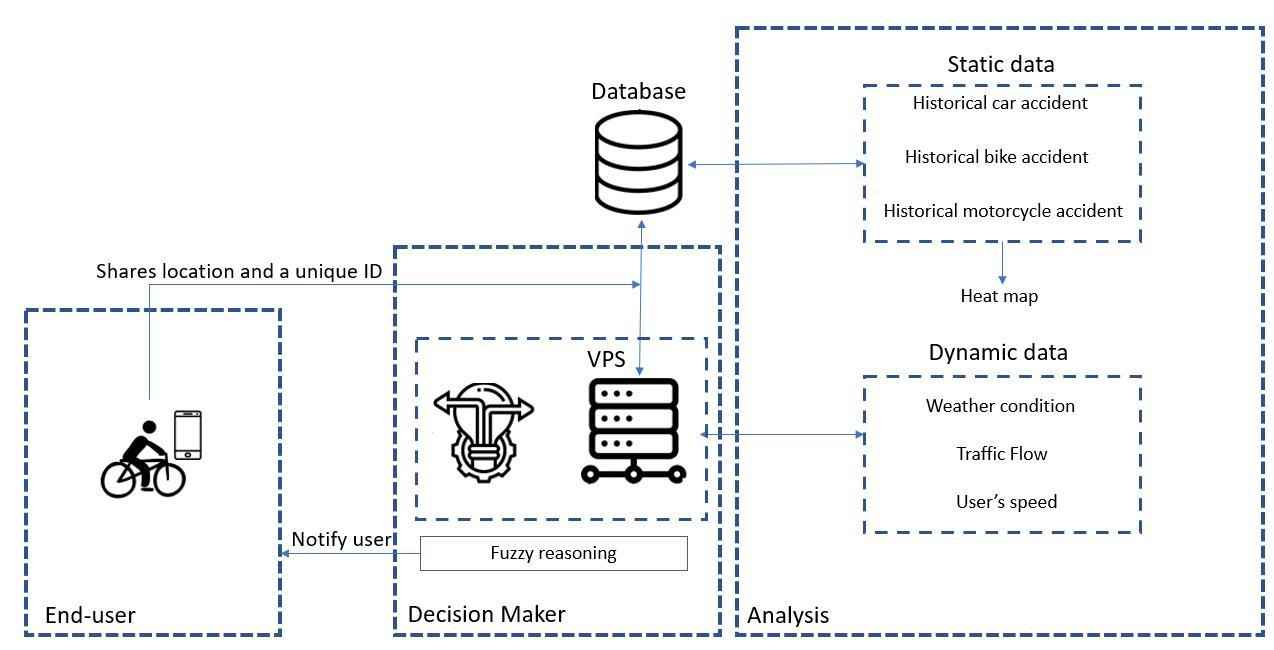
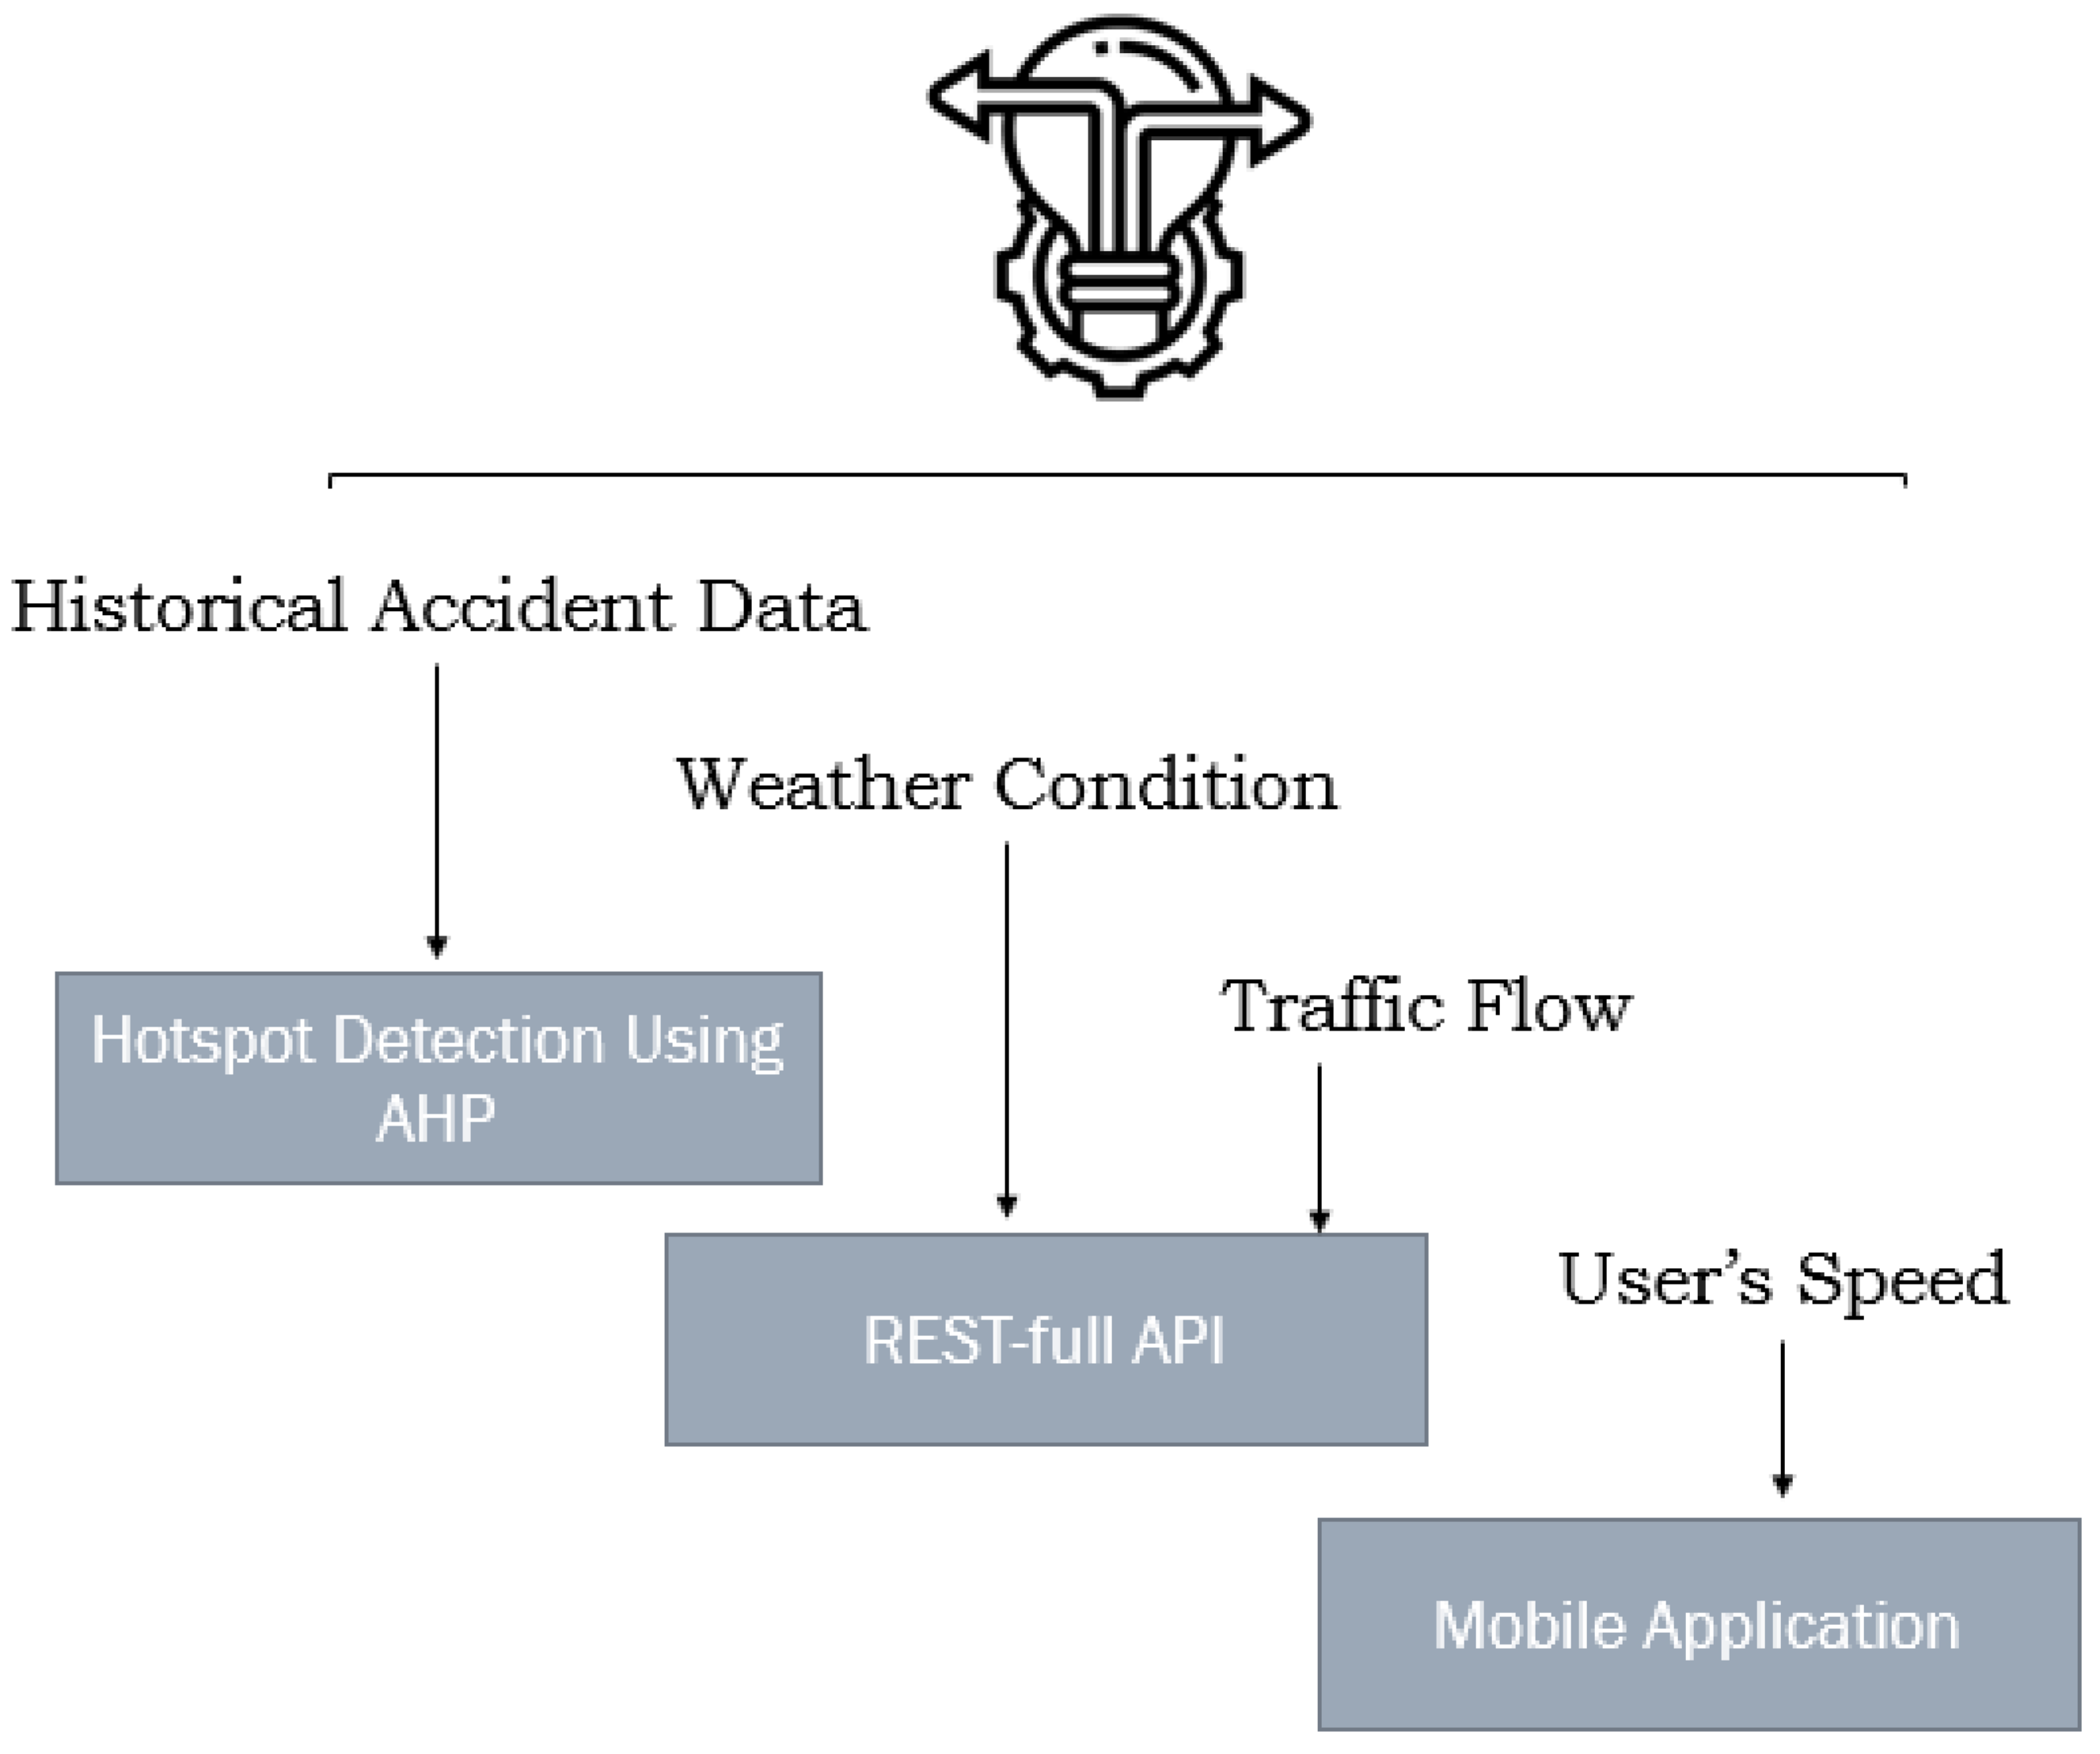
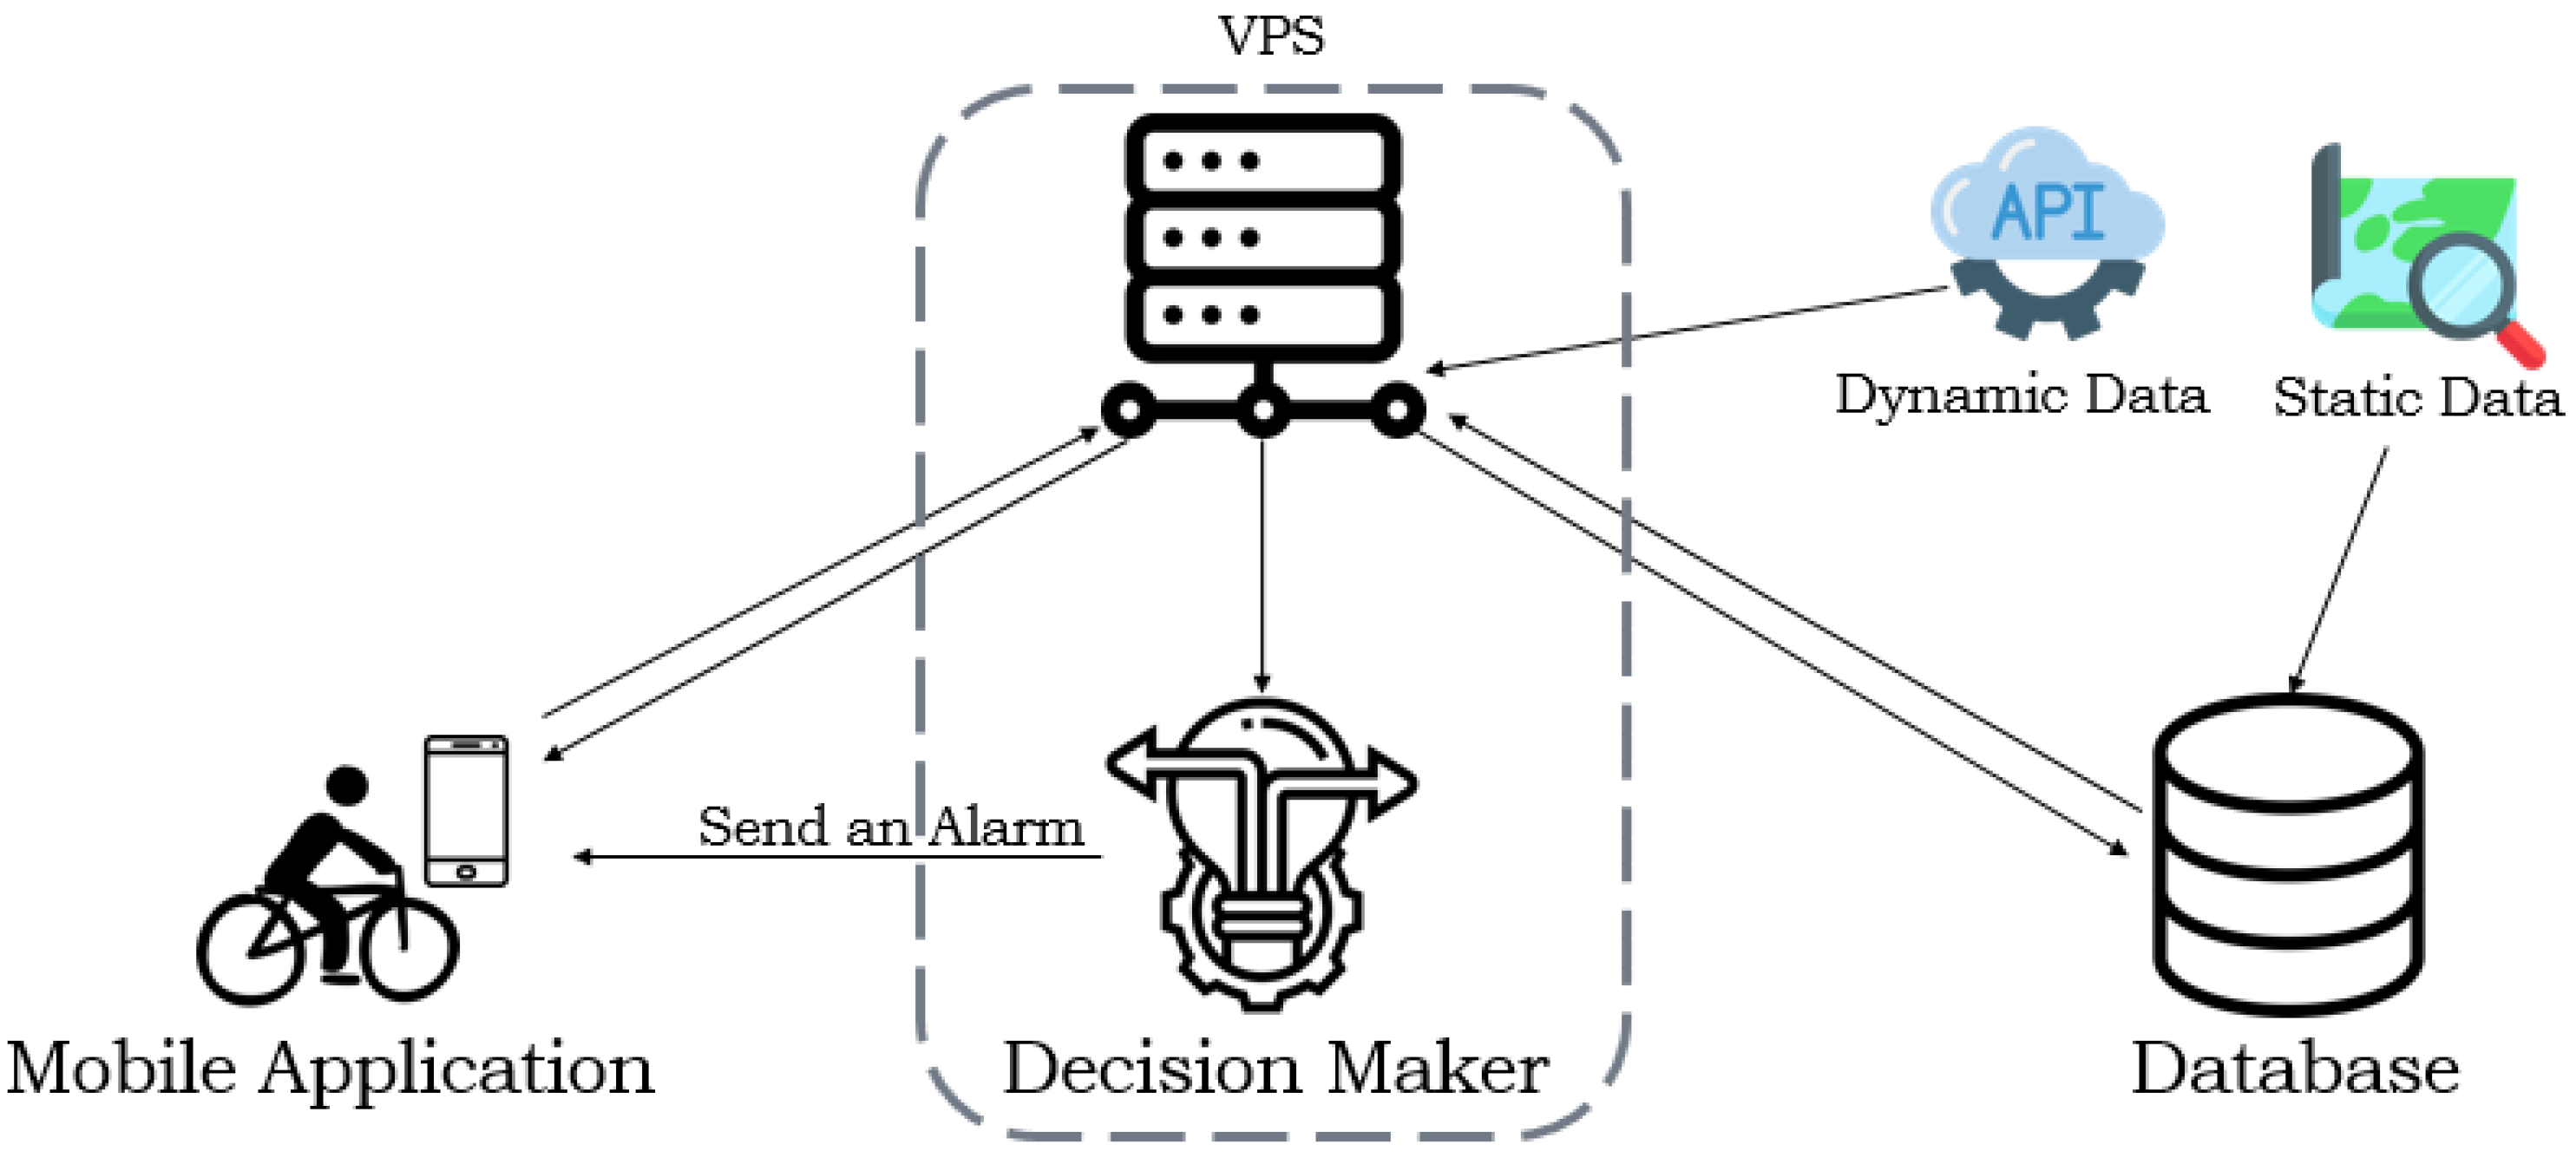
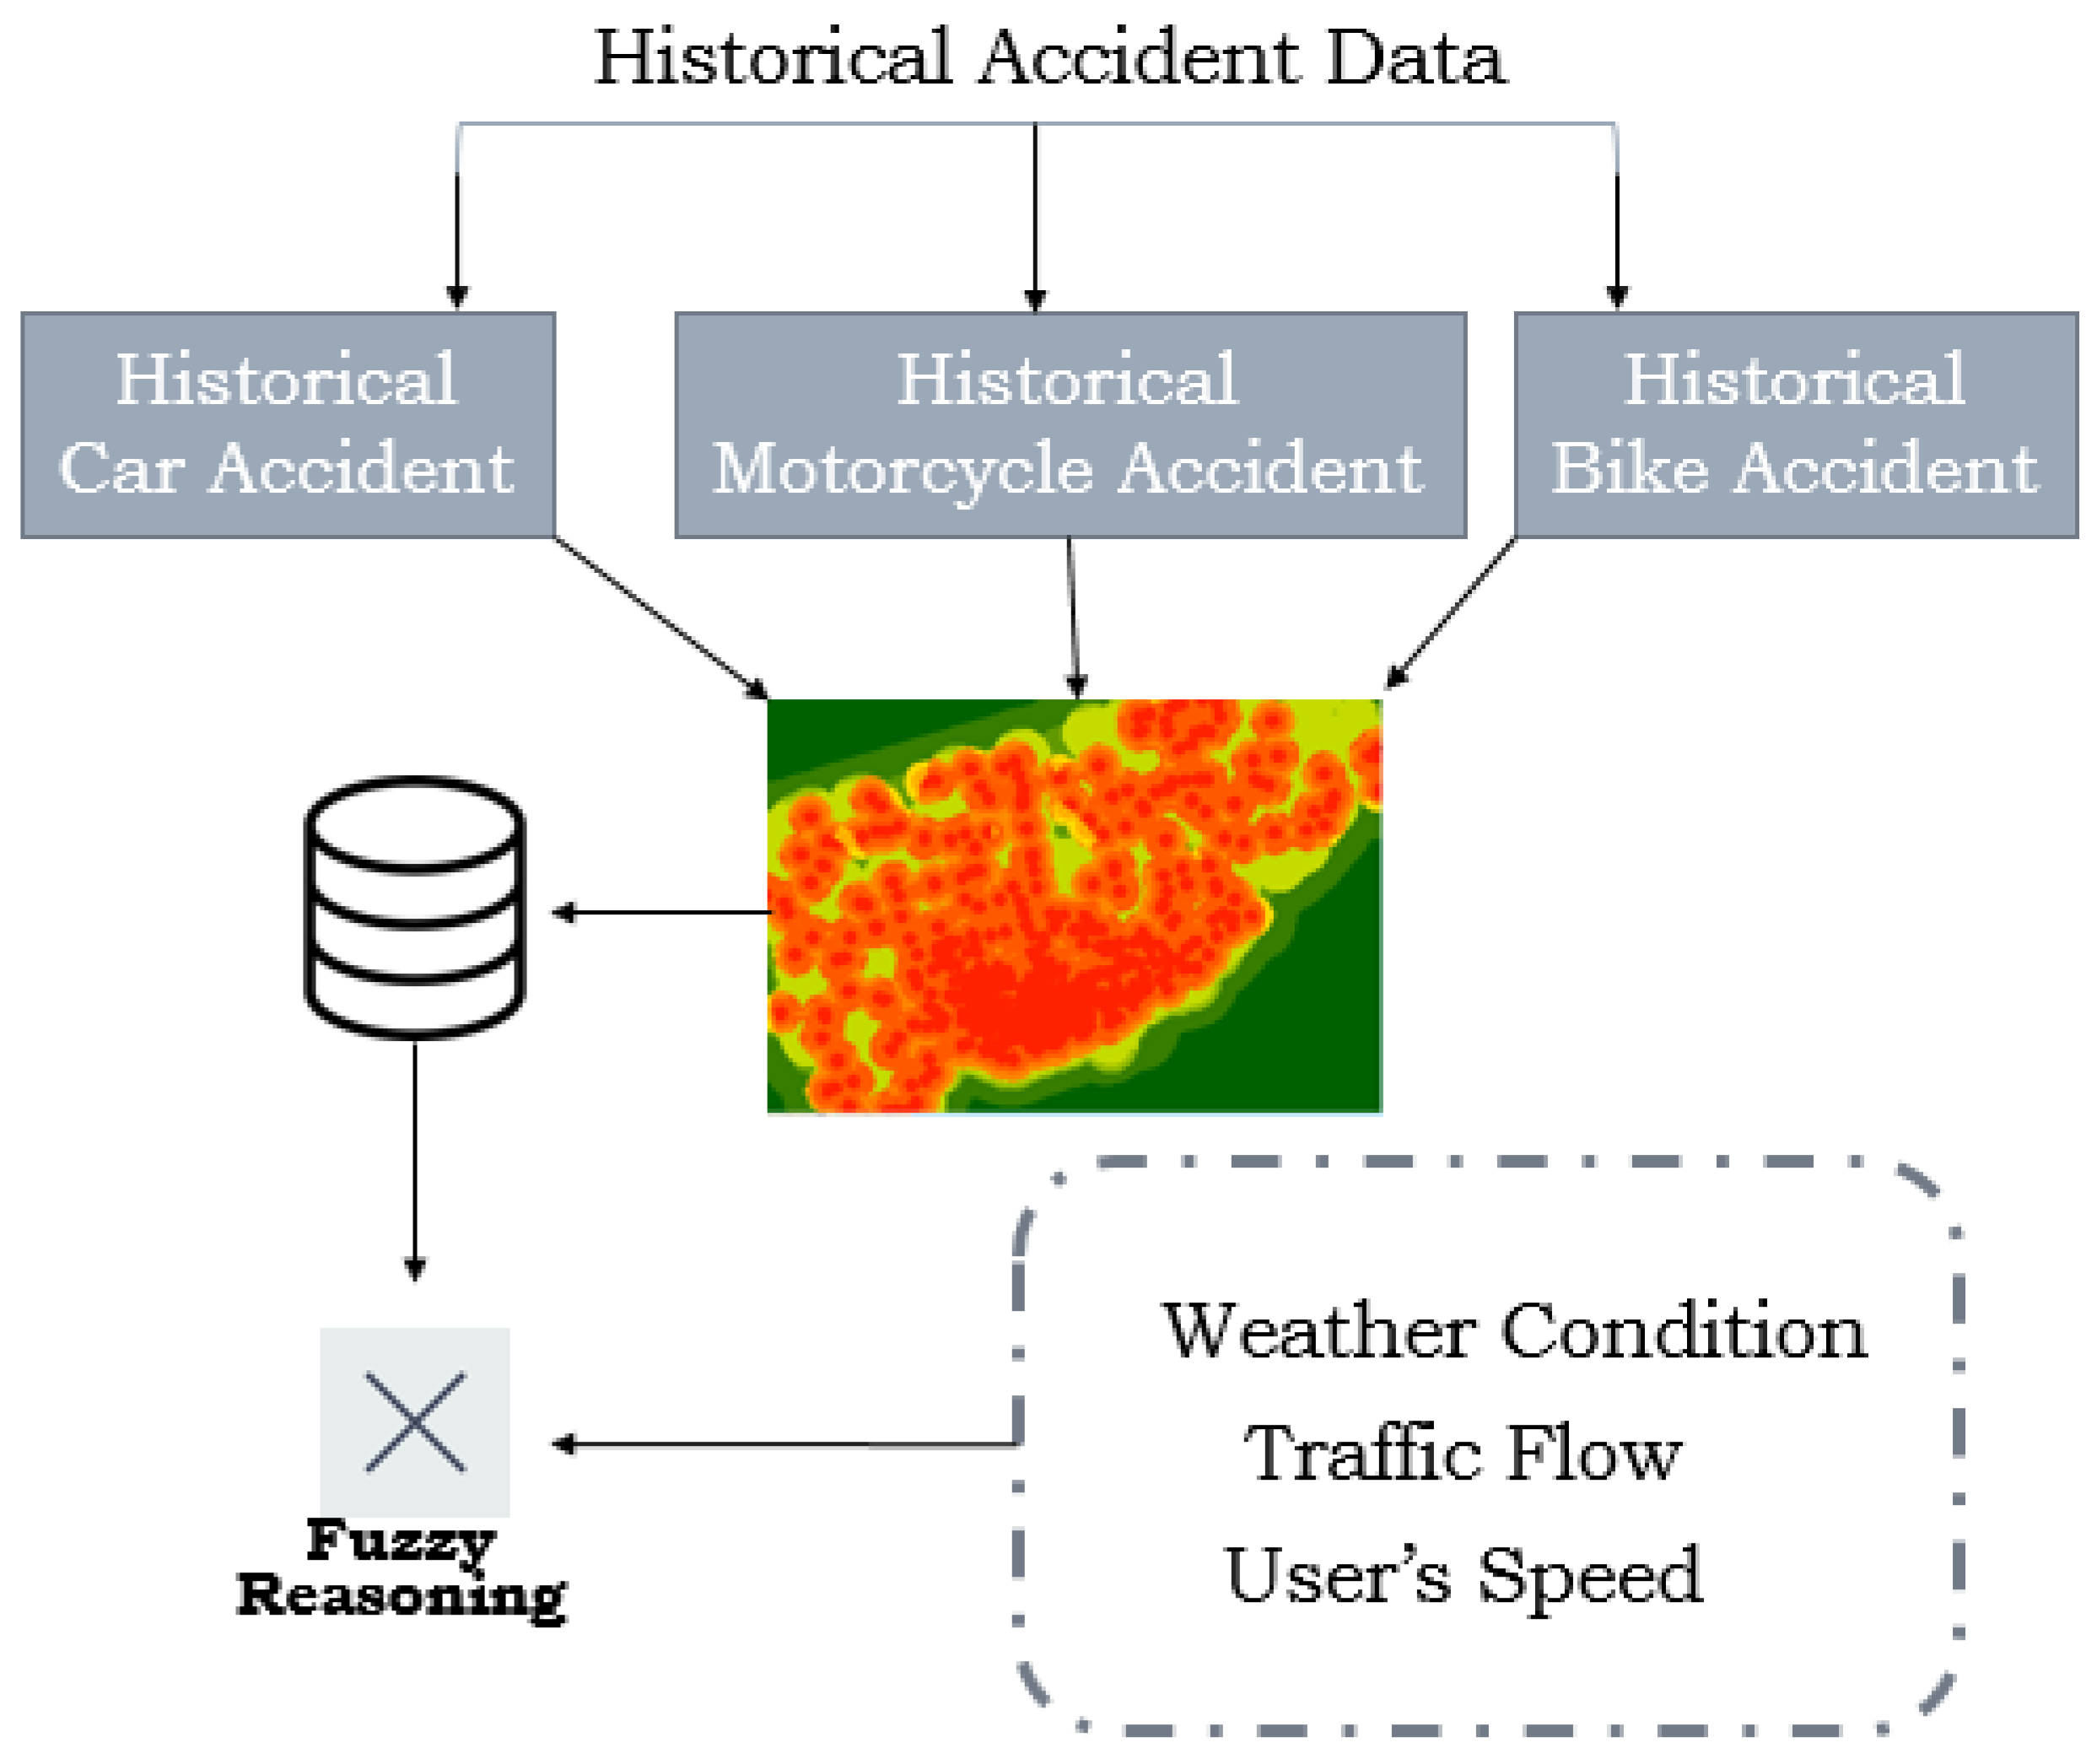
4. Methodology
5. Implementation and Results
6. Evaluation and Results
7. Conclusions
Author Contributions
Funding
Institutional Review Board Statement
Informed Consent Statement
Data Availability Statement
Acknowledgments
Conflicts of Interest
References
- World Health Organisation. 2020. Available online: https://www.who.int/ (accessed on 10 October 2022).
- Conducted by Nanos for the City of Toronto, J. City of Toronto Cycling Study. Nanos 2019, 7. Available online: https://www.toronto.ca/wp-content/uploads/2021/04/8f76-2019-Cycling-Public-Option-Survey-City-of-Toronto-Cycling.pdf (accessed on 10 October 2022).
- Useche, S.A.; Montoro, L.; Sanmartin, J.; Alonso, F. Healthy but risky: A descriptive study on cyclists’ encouraging and discouraging factors for using bicycles, habits and safety outcomes. Transp. Res. Part F Traffic Psychol. Behav. 2019, 62, 587–598. [Google Scholar] [CrossRef]
- Valent, F.; Schiava, F.; Savonitto, C.; Gallo, T.; Brusaferro, S.; Barbone, F. Risk factors for fatal road traffic accidents in Udine, Italy. Accid. Anal. Prev. 2002, 34, 71–84. [Google Scholar] [CrossRef] [PubMed]
- Bjørnskau, T. Road Traffic Risk in Norway 2005–2007. In TØI Report 986/2008 [In Norwegian, English Summary]; Institute of Transport Economics: Oslo, Norway, 2008. [Google Scholar]
- Illinois Department of Transportation Report, M. Crash facts and statistics. Ill. Crash Facts Stat. 2017, 17, 18. Available online: http://www.idot.illinois.gov/Assets/uploads/files/Transportation-System/Resources/Safety/Crash-Reports/crash-facts/2017%20Crash%20Facts.pdf (accessed on 10 October 2022).
- Mason-Jones, A.J.; Turrell, S.; Gomez, G.Z.; Tait, C.; Lovelace, R. Severe and fatal cycling crash injury in Britain: Time to make urban cycling safer. J. Urban Health 2022, 99, 334–343. [Google Scholar] [CrossRef]
- Kaygisiz, Ö.; Hauger, G. Network-based point pattern analysis of bicycle accidents to improve cyclist safety. Transp. Res. Rec. 2017, 2659, 106–116. [Google Scholar] [CrossRef]
- Su, K.; Li, J.; Fu, H. Smart city and the applications. In Proceedings of the 2011 International Conference on Electronics, Communications and Control (ICECC), Ningbo, China, 9–11 September 2011; pp. 1028–1031. [Google Scholar]
- Nam, T.; Pardo, T.A. Conceptualizing smart city with dimensions of technology, people, and institutions. In Proceedings of the 12th Annual International Digital Government Research Conference: Digital Government Innovation in Challenging Times, College Park, MD, USA, 12–15 June 2011; pp. 282–291. [Google Scholar]
- Mrityunjaya, D.; Kumar, N.; Ali, S.; Kelagadi, H. Smart transportation. In Proceedings of the 2017 International Conference on I-SMAC (IoT in Social, Mobile, Analytics and Cloud)(I-SMAC), Palladam, India, 10–11 February 2017; pp. 1–5. [Google Scholar]
- Buckman, A.H.; Mayfield, M.; Beck, S.B. What is a smart building? Smart Sustain. Built Environ. 2014, 3, 92–109. [Google Scholar] [CrossRef]
- Sundaravadivel, P.; Kougianos, E.; Mohanty, S.P.; Ganapathiraju, M.K. Everything you wanted to know about smart health care: Evaluating the different technologies and components of the internet of things for better health. IEEE Consum. Electron. Mag. 2017, 7, 18–28. [Google Scholar] [CrossRef]
- Dimitrakopoulos, G.; Demestichas, P. Intelligent transportation systems. IEEE Veh. Technol. Mag. 2010, 5, 77–84. [Google Scholar] [CrossRef]
- Lin, Y.; Wang, P.; Ma, M. Intelligent transportation system (ITS): Concept, challenge and opportunity. In Proceedings of the 2017 IEEE 3rd International Conference on Big Data Security on Cloud (Bigdatasecurity), IEEE International Conference on High Performance and Smart Computing (hpsc), and IEEE International Conference on Intelligent Data and Security (ids), Beijing, China, 26–28 May 2017; pp. 167–172. [Google Scholar]
- Hu, J.; Zhong, G.; Cheng, Z.; Wang, D. GIS-based road safety evaluation model for cyclist in campus of Higher Education Mega Center. In Proceedings of the 2012 15th International IEEE Conference on Intelligent Transportation Systems, Anchorage, AK, USA, 16–19 September 2012; pp. 1127–1131. [Google Scholar]
- Nourbakhshrezaei, A.; Jadidi, M.; Delavar, M.; Moshiri, B. A novel context-aware system to improve driver’s field of view in urban traffic networks. J. Intell. Transp. Syst. 2022, 1–16. [Google Scholar] [CrossRef]
- Nourbakhsh, A.; Delavar, M.; Jadidi, M.; Moshiri, B. Reducing the time to get emergency assistance for accident vehicles on the road through an intelligent transportation system. Int. Arch. Photogramm. Remote Sens. Spat. Inf. Sci. 2019, 42, 827–832. [Google Scholar] [CrossRef]
- Borruso, G. Network density estimation: A GIS approach for analysing point patterns in a network space. Trans. GIS 2008, 12, 377–402. [Google Scholar] [CrossRef]
- Anaya, J.J.; Merdrignac, P.; Shagdar, O.; Nashashibi, F.; Naranjo, J.E. Vehicle to pedestrian communications for protection of vulnerable road users. In Proceedings of the 2014 IEEE Intelligent Vehicles Symposium Proceedings, Dearborn, MI, USA, 8–11 June 2014; pp. 1037–1042. [Google Scholar]
- Nguyen, Q.H.; Morold, M.; David, K.; Dressler, F. Car-to-Pedestrian communication with MEC-support for adaptive safety of Vulnerable Road Users. Comput. Commun. 2020, 150, 83–93. [Google Scholar] [CrossRef]
- Bachmann, M.; Morold, M.; David, K. On the Required Movement Recognition Accuracy in Cooperative VRU Collision Avoidance Systems. IEEE Trans. Intell. Transp. Syst. 2020, 22, 1708–1717. [Google Scholar] [CrossRef]
- Otani, R.; Shikishima, A.; Wada, T. A Study on Vehicle-Pedestrian Communication System Using Warning Ranges of Mobile Objects. In Proceedings of the 2020 International Conference on Information Networking (ICOIN), Barcelona, Spain, 7–10 January 2020; pp. 517–522. [Google Scholar]
- Won, M. Intelligent traffic monitoring systems for vehicle classification: A survey. IEEE Access 2020, 8, 73340–73358. [Google Scholar] [CrossRef]
- Benalla, M.; Achchab, B.; Hrimech, H. Improving Driver Assistance in Intelligent Transportation Systems: An Agent-Based Evidential Reasoning Approach. J. Adv. Transp. 2020, 2020, 4607858. [Google Scholar] [CrossRef]
- Hoseinzadeh, N.; Arvin, R.; Khattak, A.J.; Han, L.D. Integrating safety and mobility for pathfinding using big data generated by connected vehicles. J. Intell. Transp. Syst. 2020, 24, 404–420. [Google Scholar] [CrossRef]
- Zhou, H.; Xu, W.; Chen, J.; Wang, W. Evolutionary V2X technologies toward the Internet of vehicles: Challenges and opportunities. Proc. IEEE 2020, 108, 308–323. [Google Scholar] [CrossRef]
- Arena, F.; Pau, G.; Severino, A. A Review on IEEE 802.11 p for Intelligent Transportation Systems. J. Sens. Actuator Netw. 2020, 9, 22. [Google Scholar] [CrossRef]
- Mesimäki, J.; Luoma, J. Near accidents and collisions between pedestrians and cyclists. Eur. Transp. Res. Rev. 2021, 13, 1–12. [Google Scholar] [CrossRef]
- Brown, L.; Morris, A.; Thomas, P.; Ekambaram, K.; Margaritis, D.; Davidse, R.; Usami, D.S.; Robibaro, M.; Persia, L.; Buttler, I.; et al. Investigation of accidents involving powered two wheelers and bicycles–A European in-depth study. J. Saf. Res. 2021, 76, 135–145. [Google Scholar] [CrossRef] [PubMed]
- Virzi Mariotti, G.; Golfo, S.; Carollo, F.; Scalici, E. Study of an impact vehicle-bike at high speed. Acad. Lett. 2021, 2. [Google Scholar] [CrossRef]
- Jain, S.; Borgiattino, C.; Ren, Y.; Gruteser, M.; Chen, Y. On the limits of positioning-based pedestrian risk awareness. In Proceedings of the 2014 Workshop on Mobile Augmented Reality and Robotic Technology-Based Systems, Bretton Woods, NH, USA, 16 June 2014; pp. 23–28. [Google Scholar]
- Bachmann, M.; Morold, M.; David, K. Improving smartphone based collision avoidance by using pedestrian context information. In Proceedings of the 2017 IEEE International Conference on Pervasive Computing and Communications Workshops (PerCom Workshops), Kailua-Kona, HI, USA, 13–17 March 2017; pp. 2–5. [Google Scholar]
- Jiang, K.; Yang, Z.; Feng, Z.; Sze, N.; Yu, Z.; Huang, Z.; Chen, J. Effects of using mobile phones while cycling: A study from the perspectives of manipulation and visual strategies. Transp. Res. Part F Traffic Psychol. Behav. 2021, 83, 291–303. [Google Scholar] [CrossRef]
- Lin, Z.; Fan, W. Cyclist injury severity analysis with mixed-logit models at intersections and nonintersection locations. J. Transp. Saf. Secur. 2021, 13, 223–245. [Google Scholar] [CrossRef]
- Rolison, J.J.; Regev, S.; Moutari, S.; Feeney, A. What are the factors that contribute to road accidents? An assessment of law enforcement views, ordinary drivers’ opinions, and road accident records. Accid. Anal. Prev. 2018, 115, 11–24. [Google Scholar] [CrossRef] [PubMed]
- Rubayat, A.; Sultana, N. Reasons behind the road-traffic accident in Dhaka city: An empirical Study. Int. J. Res. Humanit. Arts Lit. 2013, 1, 47–56. [Google Scholar]
- Hakki, A.H.; Hakki, M.; Hakki, D.A.; Hakki, B. Collision Detection System. U.S. Patent App. 16/506408, 27 October 2020. [Google Scholar]
- Johnson, S.; Fayaz, M.A.; Krishnan, H.S. IoT based rear-end collision avoidance system in highways. Int. J. Adv. Comput. Res. 2019, 9, 379–385. [Google Scholar] [CrossRef]
- Charlotte BIKES Bicycle Plan. City of Charlotte Department of Transportation. Available online: https://charlottenc.gov/Transportation/Programs/Documents/Charlotte%20BIKES%20Final.pdf (accessed on 10 October 2022).
- Hamilton, T.L.; Wichman, C.J. Bicycle infrastructure and traffic congestion: Evidence from DC’s Capital Bikeshare. J. Environ. Econ. Manag. 2018, 87, 72–93. [Google Scholar] [CrossRef]
- Holienčinová, M.; Kádeková, Z.; Holota, T.; Nagyová, L. Smart solution of traffic congestion through bike sharing system in a small city. Mob. Networks Appl. 2020, 25, 868–875. [Google Scholar] [CrossRef]
- Qiu, L.Y.; He, L.Y. Bike sharing and the economy, the environment, and health-related externalities. Sustainability 2018, 10, 1145. [Google Scholar] [CrossRef]
- Cao, Y.; Shen, D. Contribution of shared bikes to carbon dioxide emission reduction and the economy in Beijing. Sustain. Cities Soc. 2019, 51, 101749. [Google Scholar] [CrossRef]
- Mamdani, E.H.; Assilian, S. An experiment in linguistic synthesis with a fuzzy logic controller. Int. J. Man-Mach. Stud. 1975, 7, 1–13. [Google Scholar] [CrossRef]
- Sadollah, A. Introductory chapter: Which membership function is appropriate in fuzzy system? In Fuzzy Logic Based in Optimization Methods and Control Systems and Its Applications; IntechOpen: London, UK, 2018. [Google Scholar] [CrossRef]
- Derbel, I.; Hachani, N.; Ounelli, H. Membership Functions Generation Based on Density Function. In Proceedings of the 2008 International Conference CIS, Suzhou, China, 13–17 December 2008; Volume 1, pp. 96–101. [Google Scholar] [CrossRef]
- Chen, M.S.; Wang, S.W. Fuzzy clustering analysis for optimizing fuzzy membership functions. Fuzzy Sets Syst. 1999, 103, 239–254. [Google Scholar] [CrossRef]
- Chen, M.S. A comparative study of learning methods in tuning parameters of fuzzy membership functions. In Proceedings of the IEEE SMC’99 Conference Proceedings, 1999 IEEE International Conference on Systems, Man, and Cybernetics (Cat. No. 99CH37028), Tokyo, Japan, 12–15 October 1999; Volume 3, pp. 40–44. [Google Scholar]
- Murgano, E.; Caponetto, R.; Pappalardo, G.; Cafiso, S.D.; Severino, A. A novel acceleration signal processing procedure for cycling safety assessment. Sensors 2021, 21, 4183. [Google Scholar] [CrossRef]
- Caggiani, L.; Camporeale, R. Toward Sustainability: Bike-Sharing Systems Design, Simulation and Management. 2021. Available online: https://www.mdpi.com/2071-1050/13/14/7519/htm (accessed on 10 October 2022).
- Sharma, B.; Nam, H.; Yan, W.; Kim, H. Barriers and Enabling Factors Affecting Satisfaction and Safety Perception with Use of Bicycle Roads in Seoul, South Korea. Int. J. Environ. Res. Public Health 2019, 16, 773. [Google Scholar] [CrossRef]
- Skoczyński, P. Analysis of solutions improving safety of cyclists in the road traffic. Appl. Sci. 2021, 11, 3771. [Google Scholar] [CrossRef]
- Poudel, N.; Singleton, P.A. Bicycle safety at roundabouts: A systematic literature review. Transp. Rev. 2021, 41, 617–642. [Google Scholar] [CrossRef]
- López-Molina, M.; Llopis-Castelló, D.; Pérez-Zuriaga, A.M.; Alonso-Troyano, C.; García, A. Skid Resistance Analysis of Urban Bike Lane Pavements for Safe Micromobility. Sustainability 2023, 15, 698. [Google Scholar] [CrossRef]
- Lee, J.; Seo, D. Influences of urban bikeway design and land use on bike collision severity: Evidence from Pohang in South Korea. Sustainability 2022, 14, 8397. [Google Scholar] [CrossRef]
- Mirzahossein, H.; Rassafi, A.A.; Jamali, Z.; Guzik, R.; Severino, A.; Arena, F. Active Transport Network Design Based on Transit-Oriented Development and Complete Street Approach: Finding the Potential in Qazvin. Infrastructures 2022, 7, 23. [Google Scholar] [CrossRef]
- Cantisani, G.; Durastanti, C.; Moretti, L. Cyclists at roundabouts: Risk analysis and rational criteria for choosing safer layouts. Infrastructures 2021, 6, 34. [Google Scholar] [CrossRef]
- Silla, A.; Leden, L.; Rämä, P.; Scholliers, J.; Van Noort, M.; Bell, D. Can cyclist safety be improved with intelligent transport systems? Accid. Anal. Prev. 2017, 105, 134–145. [Google Scholar] [CrossRef] [PubMed]
- Kapousizis, G.; Ulak, M.B.; Geurs, K.; Havinga, P.J. A review of state-of-the-art bicycle technologies affecting cycling safety: Level of smartness and technology readiness. Transp. Rev. 2022, 1–23. [Google Scholar] [CrossRef]


| Rule 1 | if speed is high and collision is high and traffic flow is light => send alarm |
| Rule 2 | if speed is high and collision is low and traffic flow is heavy => send alarm |
| Rule 3 | if speed is low and collision is low => don’t send |
| Rule 4 | if speed is low and collision is high and traffic flow is light => send alarm |
| Rule 5 | if speed is low and collision is high and traffic flow is heavy => don’t send alarm |
| Source | Data | Name |
|---|---|---|
| Data.torontopolice.on.ca | 2018 | Cyclist Accident |
| Data.torontopolice.on.ca | 2018 | Car Accident |
| Toronto Public Safety Data | 2018 | Motorcycle Accident |
| Traffic Developer Website | Real-Time | Traffic Data |
| Open Weather Map | Real-Time | Weather Data |
| Mobile Application | Real-Time | User Speed |
| Criterion | Normalized | Average | |||||
|---|---|---|---|---|---|---|---|
| - | Bike | Motorcycle | Vehicle | Bike | Motorcycle | Vehicle | - |
| Bike | 1 | 3 | 4 | 0.632 | 0.631 | 0.631 | 0.63133 |
| Motorcycle | 1/3 | 1 | 4/3 | 0.21 | 0.229 | 0.21 | 0.2163 |
| Vehicle | 1/4 | 3/4 | 1 | 0.158 | 0.157 | 0.157 | 0.157 |
| Sum | 1.58 | 4.75 | 6.33 | ≈1 | ≈1 | ≈1 | ≈1 |
| IP and Port | Name | Input | Output |
|---|---|---|---|
| http://212.90.102.16:4242 | getWeathermap | (lat, long) | Json Object |
| http://212.90.102.16:4242 | getTrafficLs | (lattop, lontop, latbtm, lonbtm) | Json Object |
| http://212.90.102.16:4242 | fuzzyReasoning | (speed, tr, col, weather) | String |
| http://212.90.102.16:4242 | sendNotification | (firebaseId, txtAlarm) | String |
Disclaimer/Publisher’s Note: The statements, opinions and data contained in all publications are solely those of the individual author(s) and contributor(s) and not of MDPI and/or the editor(s). MDPI and/or the editor(s) disclaim responsibility for any injury to people or property resulting from any ideas, methods, instructions or products referred to in the content. |
© 2023 by the authors. Licensee MDPI, Basel, Switzerland. This article is an open access article distributed under the terms and conditions of the Creative Commons Attribution (CC BY) license (https://creativecommons.org/licenses/by/4.0/).
Share and Cite
Nourbakhshrezaei, A.; Jadidi, M.; Sohn, G. Improving Cyclists’ Safety Using Intelligent Situational Awareness System. Sustainability 2023, 15, 2866. https://doi.org/10.3390/su15042866
Nourbakhshrezaei A, Jadidi M, Sohn G. Improving Cyclists’ Safety Using Intelligent Situational Awareness System. Sustainability. 2023; 15(4):2866. https://doi.org/10.3390/su15042866
Chicago/Turabian StyleNourbakhshrezaei, Amirhossein, Mojgan Jadidi, and Gunho Sohn. 2023. "Improving Cyclists’ Safety Using Intelligent Situational Awareness System" Sustainability 15, no. 4: 2866. https://doi.org/10.3390/su15042866
APA StyleNourbakhshrezaei, A., Jadidi, M., & Sohn, G. (2023). Improving Cyclists’ Safety Using Intelligent Situational Awareness System. Sustainability, 15(4), 2866. https://doi.org/10.3390/su15042866