Abstract
Landslides and their disastrous consequences on the environment and human life have emphasized the need for a better understanding of the dangers associated with slope movement. The objective of this research was to assess and utilize mapping methods for predicting the hazards of landslides and thus to limit the damage of these phenomena more effectively. In the current investigation, multi-hazard mapping was employed in evaluating the risk of slope movements for the municipality of Bensekrane in Tlemcen in Algeria. There has been no hazard assessment made for the study area although it has factors responsible for triggering landslides. The standard Farès method (arithmetic and probabilistic) was employed, and the results were compared with those obtained from the modified Farès technique (arithmetic and probabilistic), which was developed based on a synthesis or combination of previous approaches. In the modified Farès technique, dynamic factors were also included, such as seismic activity, vegetation cover and groundwater level, and, thus, it was considered more reliable. However, the choice of method depended mainly on the availability of data from the study area. The maps obtained showed that the study area is susceptible to slope movements and will be employed for land use planning. The maps obtained by the arithmetic modified Farès method were different from those obtained by the arithmetic Farès method. The former presented a large part of the surface (88%) with an average hazard, unlike the latter, which presented the largest surface (66%) and a low hazard. The maps generated by the probabilistic modified Farès method showed a surface with a high hazard, unlike that obtained by the probabilistic Farès method, where a high hazard did not exist. These differences between the maps were due to the addition of dynamic factors. It is better to choose the modified Farès method, which takes into account all the factors that exist in reality. In this study, enhanced spatial, natural hazard maps were created using the modified Farès method to better aid decision makers and builders in making correct choices for increased safety and town planning. It is crucial to be able to utilize reliable maps based on multi-hazard risk assessment for land development purposes to lessen the possibility of destructive landslides. The modified Farès method can be applied to any other comparable areas around the world.
1. Introduction
Earthquakes and landslides are constant threats to human life in many parts of the world [1,2]. Hills with steep slopes, for example, are inherently unstable, thus, resulting in natural catastrophes during rainy seasons [3]. The loss of life due to landslides is especially serious in mountainous areas. The creation of landslide susceptibility maps can provide decision makers with tools for safeguarding the environment and human lives. The modeling and forecasting of land movement vulnerability threats can aid in monitoring and averting a variety of humanitarian and environmental damages [4,5,6].
Communities with high population densities and located in regions with high slopes prone to earthquakes face geological hazards such as debris flows and rock avalanches [7,8,9]. For the safety of local inhabitants, there is a need to be able to better assess the risk to buildings, especially those that are old and that do not meet modern regulations. Risk assessment with regards to multi-geohazards is urgently required. Reports from major international organizations have recognized the importance of multi-hazard risk assessment [10,11]. One drawback or shortcoming is that most previous studies have employed only a single-hazard risk assessment. This is not sufficient for communities facing multiple hazards such as earthquakes, landslides, flooding and fire. Carrington [12,13] examined the influence of disasters on the resources of emergency departments situated in local communities. They concluded that better disaster planning and readiness strategies can help to overcome health resource shortfalls. Additionally, case studies of past calamities are required to better understand the effects of disasters on emergency department performance and their resources [14,15,16].
Scientists try to predict hazardous natural phenomena, to study them and to limit their damage [1,17]. Their origins are varied; they can be geophysical, such as earthquakes and volcanic eruptions, hydrometeorological, such as cyclones, storms, floods and avalanches or geomorphologic, such as ground movements [18,19,20,21]. In the case of land movement, they are triggered mainly in areas where soil balance conditions are relatively precarious and are often aggravated by hydraulic, seismic or anthropic stresses. To limit the catastrophic effects of these phenomena, their prevention and prediction is part of a global policy of risk reduction [22,23,24]. Furthermore, ground movements are events which can be very slow or extremely fast, spectacular and often harmful [25]. Almost all are only normal episodes of the external phase of a geologic cycle or a structural defect [26]. There are numerous classifications due to the diversity of factors responsible for movements of slopes proposed by geologists and geotechnical engineers. Likewise, some movements may evolve and give birth to another type of movement. For example, crawling can change into a landslide. For this reason, it is essential to work with a variety of slope movements [14,27].
There is a variety of methods available for evaluating the hazard due to slope movements [28,29]. However, deciding which one is the most reliable and what are the triggering factors needs to be explored. Furthermore, dynamic and permanent factors are present at the same time. Thus, approaches that consider only one type of factor are not very realistic, and, so, methods that consider both dynamic and permanent factors at the same time should be developed [30,31,32,33]. In general, the permanent factors are the slope, the lithology and the indices of instability, whereas the dynamic factors are the seismicity, the vegetation cover and the groundwater level; Table 1 presents permanent factors, such as site conditions, and dynamic, time-varying factors, such as precipitation and temperature, which may trigger these phenomena [15].

Table 1.
Triggering factors [15].
There has been no rigorous risk assessment made for the case study area in Bensekrane in Algeria even though it possesses factors responsible for triggering landslides. The multi-hazard risk assessment and landslide susceptibility mapping technique that supports the greatest number of triggering factors is the most adequate because it better represents reality. Data concerning the dynamic factors can be obtained, especially about seismicity, vegetation cover and the groundwater table.
In the current investigation, multi-hazard mapping was employed in evaluating the risk of slope movements using as a case study the municipality of Bensekrane in Tlemcen in Algeria. For the evaluation of a hazard, the standard Farès method and a modified Farès technique were chosen. The latter includes dynamic as well as permanent factors, while the former standard technique only considers permanent factors. Both methods were selected to assess the differences in the maps produced by different levels of input data.
2. Data and Methodology
2.1. Description of Study Area
The study area was defined as the municipality of Bensekrane, covering an area of 780 Km2 and including the R’kham, Takbalet and Guetna agglomerations (Figure 1). It is characterized by a rugged terrain with slopes varying between 0% and 30% and consisting of clay and travertine. It is bordered to the south by the municipality of Amieur, to the east by the municipality of El Fehoul, to the west by the municipality of Sidi Abdelli and to the north by the municipalities of El Kihel and Aghlal [15].
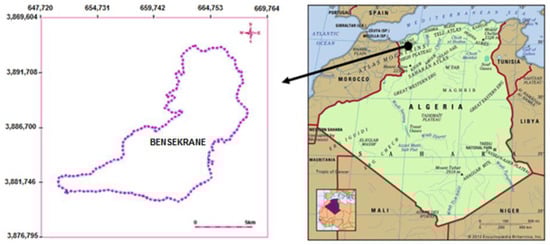
Figure 1.
Study area.
2.2. Influencing Factors
Usually, the creation of a hazard map consists of two phases. In the analytical phase, an inventory is made of current and archival documents, and data are gathered from inquiries and from observations of the ground [16]. The second phase involves interpretation and synthesis. Likewise, the methods can be qualitative or quantitative, direct or indirect. They relate to hazard zoning in a descriptive and quantitative manner. Descriptive methods are subjective in contrast to quantitative methods, which provide a numerical estimate (probabilities) for the occurrence of the phenomena in all the zones of hazard [16,17,18,19].
A statistical study, such as that of Anbalagan [35], was first performed to establish the degree of causality (relation of a cause and an effect) between factors and phenomena to define the quantitative criterion, to distinguish the stable zones from the unstable zones and to estimate the hazards in the region [19,20]. The degrees of hazard may be classified from very low to very strong. The triggering factors considered by Anbalagan [35] were lithology, relationship between orientation of discontinuities and slope, elevation and degree of vegetation ground cover. This method considered three permanent factors and only one dynamic factor. The features were insufficient for producing a reliable hazard map. In this method, it was the elevation that was considered. Elevation is the altitude relative to the mean sea level, while slope is the difference in altitude divided by horizontal distance. This gives information about the study area (e.g., hilly or flat terrain). It is possible, for example, to have a significant elevation with a flat terrain. Therefore, the choice of the slope is more sensible than that of elevation. It was for this reason that the dynamic factors were included since this was more representative of the real world.
The purpose of a hazard map is to provide information about the probability of occurrence of a natural hazard in a specific location. It should assist in responsible behavior from citizens and decision makers [17,38]. A statutory zoning map is a planning tool used by national and local authorities to regulate and controls land use and development. It may impose restrictions on construction of buildings to reduce the risk. It can be argued that it is intended not only for political authorities, but also for concerned citizens. The plans of risk prevention (PRP) indicate the zones in which regulations are imperative for new projects [17,38]. In addition to the permanent factors that trigger landslides, dynamic factors such as seismicity, vegetation cover and groundwater level should be included in any multi-hazard risk assessment. In the present case, the input data and methodology were selected based on literature reviews, which allowed us to produce a realistic multi-hazard map (details in the next section).
2.3. Methodology
Several methods were identified for assessing a hazard due to slope movements. Each method considers several triggers. The choice of these factors often depends on a researcher’s specialty (e.g., geologist, geographer or engineer) and the data availability. One should adapt to each situation, especially regarding the availability of data. The standard Farès method is based solely on permanent factors. However, dynamic factors are present and can actively participate in triggering slope movements. It was for this reason that an improvement was proposed by including dynamic factors. Some methods only consider the active factor such as groundwater and do not make it possible to model other factors such as vegetation cover and seismicity. However, the modified Farès method considers the mentioned dynamic factors (i.e., groundwater level, seismicity and vegetation cover). Thus, the modified Farès was selected in addition to the standard Farès method and was applied in this study to produce a reliable hazard map. Later, the maps produced by both the methods were compared to see the difference in results at different levels of input data used.
2.3.1. Method of Farès
The methodology consisted of separately mapping the factors bound to the slope, to the lithology (i.e., geology) and to instability factors [36]. An index (I) was then assigned for each factor (IP for slope, IL for lithology and II for indices of instability). This index reflected the importance of the genesis of these instabilities and allowed for the translation of factors into simulation maps of the hazard. The combination of these maps by using arithmetical and probability evaluation allowed for the creation of two hazard maps [15,37].
The assessment of the hazard was first performed by the arithmetic technique where the risk indices were IP, IL and II (Table 2). The risk indices were added together (i.e., IP + IL + II). Then, classes were obtained to define the intensity of the hazard. Furthermore, a probabilistic method was also employed. It consisted of converting the risk indices into terms of partial probability. The risk related to the slope was graded in four levels, the lowest index (1), corresponding to a probability of ¼, or index (2), which represented a probability of ½. Beyond that, the value of the slope was considered decisive. The highest index (4) corresponded to a probability of risk 1 (Table 2). Thus, the risk assessment was estimated as the product of the probabilities of the different factors. To obtain the map of the spatial occurrence, probabilities of the risk (its minimum was 1%, its maximum was 100%) were indicated by PR (i.e., PP × PL × PI). The partial properties allowed us to obtain classes that defined the intensity of the hazard. The factors taken in account are given in Table 3. They are slope, geology or lithology and geomorphology or instability indices [37].
Table 2.
Conversion of the risk indices into partial probability by Farès method [37].
Table 3.
The factors of the Farès method [37].
2.3.2. Modified Farès Method
The modified Farès method integrates both permanent and dynamic risk factors. Permanent factors incorporated include slope, lithology (i.e., geology) and indices of instability. Dynamic or time-varying factors that were added to the hazard analysis were groundwater level, seismicity and vegetation cover.
The assessment of the hazard was performed by the arithmetic method, where the risk indices, IP, IL, II, IS, IV and IN (IP for slope, IL for lithology, II for indices for instability, IS for seismicity, IV vegetation cover and IN for groundwater level), were added up. Then, classes were obtained to define the intensity of the hazard. In addition, the probabilistic technique was employed where the indices were converted to partial probability (Table 4) and then multiplied together to make a product (i.e., PP × PL × PI × PS × PV × PN). The partial properties allowed us to obtain classes that defined the intensity of the hazard. The factors taken in account are given in Table 5 and are the slope, the geology or lithology, the geomorphology or instability indices.
Table 4.
Conversion of the risk indices into partial probability by modified Farès method [15].
Table 5.
Factors of the modified Farès method [15].
2.4. Input Data
The study area was the municipality of Bensekrane belonging to the district of Tlemcen in Algeria, situated at the edge of Wadi Isser, the main tributary of the Tafna [15].
2.4.1. Permanents Factors
The municipality is characterized by slightly raised but uneven ground with slopes varying from 0 to 30%. It is hilly and sometimes has abrupt breaks around the marble quarries with slopes between 30 and 35%. The map shows the distribution of slopes in the commune of Bensekrane [24] (Figure 2a). The map of the slopes was made from a topographic map using MapInfo GIS. Furthermore, slopes were divided into 6 classes, because the limit slope, equal to 33%, was calculated by the stability calculation code FLAC2D [14,15]. According to Farès [37], the indices of the slopes were given by the values IP = 1 for 0–10%, 10–15%, 15–20%, 20–25% and 25–30% because these intervals were lower than the limit slope calculated by the FLAC2D software. IP = 2 for 30–35%, 3 for 35–55% and IP = 4 for >55%.
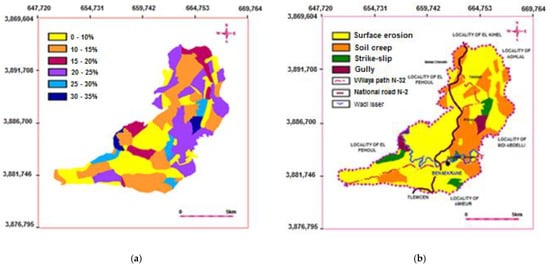
Figure 2.
(a) Slope map; (b) map of instability indicators.
The areas indicating soil instability, such as surface erosion, gully erosion, soil creep and strike-slip faults, were prepared using MapInfo GIS [39] in vector mode. Figure 2b [15] shows the instability indicators present in the study area. The signs of instability present allowed us to map the instability indices given in Figure 3.
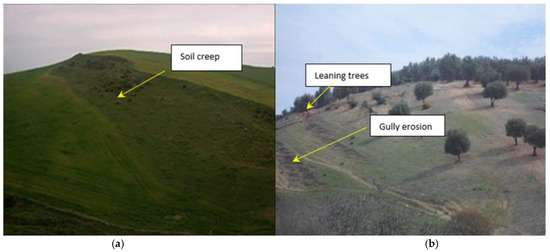
Figure 3.
(a,b)The indicators of instability.
The signs of instability were observed on the ground and classified as:
II = 1 for surface erosion, II = 2 for leaning trees, II = 3 for soil creep, II = 4 for strike-slip faults, II = 5 for gully erosion [15,37,39].
Regarding the geology and lithology of the study area, it consisted of a thick layer of sandstone and clay marl. There was also the presence of travertine [39]. The lithology is an essential factor in the stability of hillsides (Figure 4) [15]. The distribution was shown in the following way:
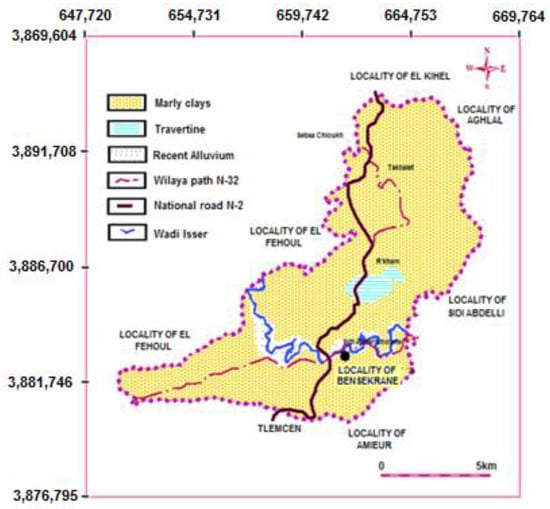
Figure 4.
Geological map.
IL = 1 for travertine, IL = 2 for stoneware, IL = 3 for clay marl [15,37,39].
2.4.2. Dynamics Factors
Dynamic factors were included in the modified Farès method. This included the groundwater, the seismicity and the vegetation cover [15]. The piezometric surface of the groundwater in the municipality of Bensekrane is shown in Figure 5a [15,39]. The level of the groundwater is situated at a depth between 80 m and 200 m [39]. Concerning the effect of the groundwater level, the indices were assigned based on the depth as follows: [9,15,37]: IN = 1 for 75–100 m, IN = 2 for 50–75 m, IN = 3 for 25–50 m, IN = 4 for 0–25 m. In the present case, (IN) was taken equal to 1.
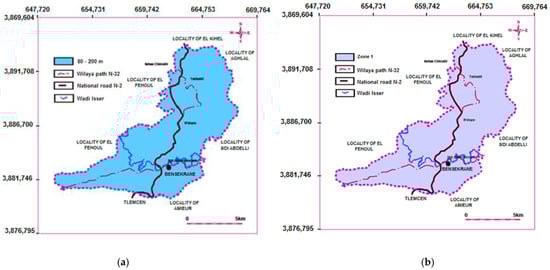
Figure 5.
(a) The hydrogeological map; (b) the seismic map.
According to the new zoning of the Algerian earthquake-resistant regulation, the RPA 99 (2003) in [9,15,37], IN = 1 for 75–100 m, IN = 2 for 50–75 m, IN = 3 for 25–50 m, IN = 4 for 0–25 m. In the present case, (IN) was taken equal to 1.
The municipality of Bensekrane was classified as Zone 1, thus, IS = 2. (Figure 5b).
Plant cover may contribute to stabilizing the soil. The denser the vegetation cover, the greater the contribution to stabilization. The vegetation cover (Figure 6) present in our study area was: annual culture, arboricultural, citrus and vine [39], the index of which was IV and which can contribute to the stability of slopes.
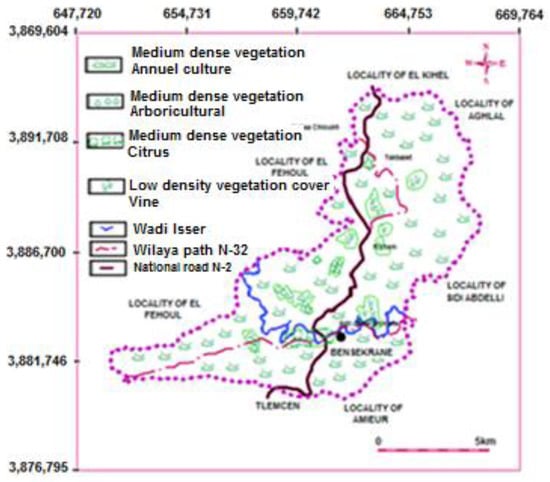
Figure 6.
Vegetation cover map.
The value of IV was determined by the density of vegetation:
IV = 1 for very dense vegetation cover, forest vegetation, IV = 2 for medium-dense vegetation cover, surface of moderate vegetation, IV = 3 for low-density vegetation cover, some plantations, IV = 4 for bare, arid soil [15,37,39].
For Bensekrane, the IV = 2 for moderately dense vegetation cover, moderate vegetation surface (annual culture, arboricultural, citrus). IV = 3 for low vegetation cover, some plantations.
2.4.3. Development of Multi-Hazard Risk Assessment Map
The indices of each factor were grouped, as shown in in Table 6. Table 6 represents indices of permanent and dynamic factors present in the study area. The sum of these indices (IP + IL+ II + IS + IV + IN) allowed for determination of the hazard classes to establish the maps. The partial probability was grouped as shown in the Table 7; it was obtained by converting the indices and then multiplying them together to make a product (PP × PL × PI × PS × PV × PN) to obtain classes that define the intensity of the hazard. The natural hazard was determined according to the arithmetical and probability methods (Figure 7).
Table 6.
Indices of factors of the modified Farès method according to the study area [15].
Table 7.
Partial probability of the modified Farès method according to the study area [15].
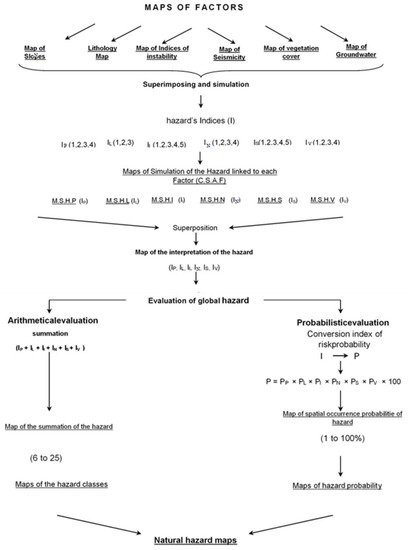
Figure 7.
Schematic of modified method for mapping natural hazard of slope movement (dynamic factors were included).
All the maps were prepared using MapInfo GIS in vector mode. Figure 7 represents a summary of the methodology applied in obtaining the hazard maps. It was enough to have the maps of the trigger factors considered; then, it was necessary to determine the risk indices for each factor, which were translated into partial probabilities. The evaluation of global hazard was achieved by arithmetic and probabilistic evaluation. The result obtained represented hazard classes, which allowed us to obtain two hazard maps: the first for the arithmetic evaluation and the second for the probabilistic evaluation.
3. Results and Discussion
The hazard maps were created and compared based on two methods: the standard Farès method and modified Farès method (using arithmetic and probabilistic approaches) for the municipality of Bensekrane in Algeria.
3.1. Hazard Assessment by Method of Farès
The natural hazard was determined according to arithmetical and probability approaches.
The first one consisted of adding up the indications IP + IL + II, which gave a minimum value of 3 and a maximum of 12 [15]. These zones were reduced to four classes defined as follows:
- −
- Class 1 (3–5): low hazard (520.62 Km2);
- −
- Class 2 (6–8): average hazard (214.68 Km2);
- −
- Class 3 (9–10): high hazard (17.7 Km2);
- −
- Class 4 (11–12): very high hazard.
The classes and intervals were translated into a map of natural hazards (Figure 8). There was no very high class of hazard on this map. The probability method consisted of converting the indications in partial probabilities. The products of these, PP × PL × PI × 100, estimated or represented the hazard level. The percentages were classified in four levels:
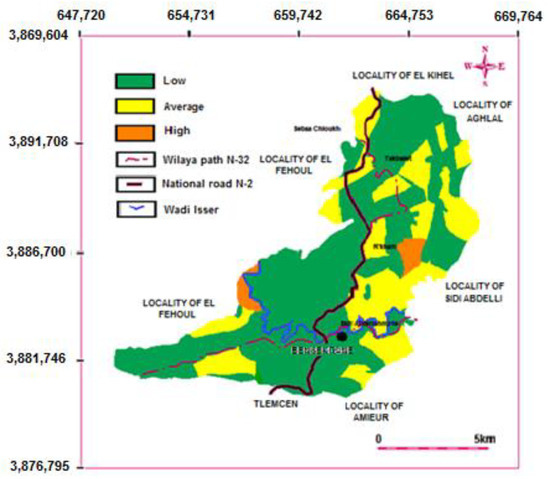
Figure 8.
Natural hazard map based on the arithmetic method of Farès.
- −
- Level 1 (1–10%): low hazard (547.62 Km2);
- −
- Level 2 (10–30%): average hazard (232.38 Km2);
- −
- Level 3 (30–50%): high hazard;
- −
- Level 4 (50–100%): very high hazard.
By comparing the two arithmetic and probabilistic approaches, we noticed that the maps obtained presented differences concerning the distribution of the hazard. This was due to the methodology of the approach; the arithmetic approach is a summation of the indices, whereas the probabilistic approach is a conversion of the indices towards a partial probability. The difference was in the central and eastern regions, which presented a high hazard.
These classes and intervals were translated into a map of natural hazards (Figure 9). There were no high hazard or very high hazard classes on this map.
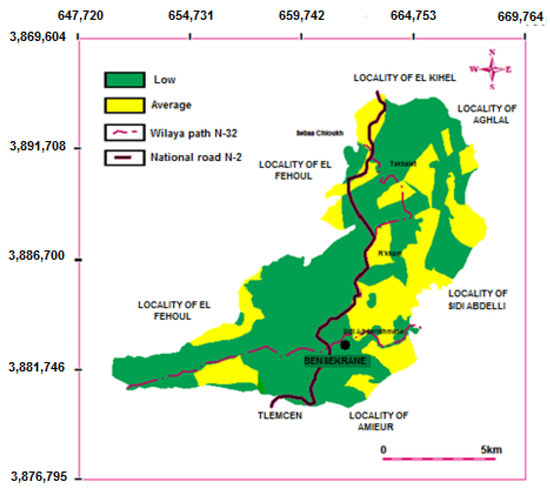
Figure 9.
Natural hazard map based on the probabilistic method of Farès.
3.2. Hazard Assessment by Modified Farès Method
The natural hazard was determined according to the arithmetical and probability methods. The first one consisted of adding up the indications IP + IL + II + IS + IV + IN, which gave a minimum value of 6 and a maximum of 25 [15].
The hazard zones were reduced to four classes defined as follows (Figure 10):
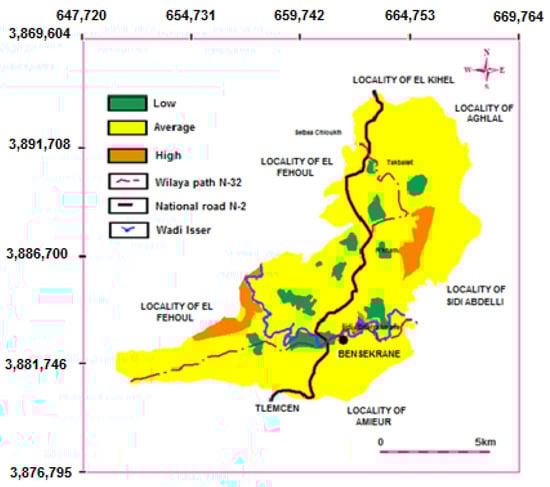
Figure 10.
Natural hazard map based on the arithmetic method of Farès.
- −
- Class 1 (6–10): low hazard (43.65 Km2);
- −
- Class 2 (11–15): average hazard (687.48 Km2);
- −
- Class 3 (16–20): high hazard (48.87 Km2);
- −
- Class 4 (21–25): very high hazard.
There was no very high hazard class on this map (Figure 10).
After converting the indices to partial probability, the product: PP × PL × PI × PN × PS × PV × 100 was calculated to estimate the hazard. The hazards were classified into four levels (Figure 11):
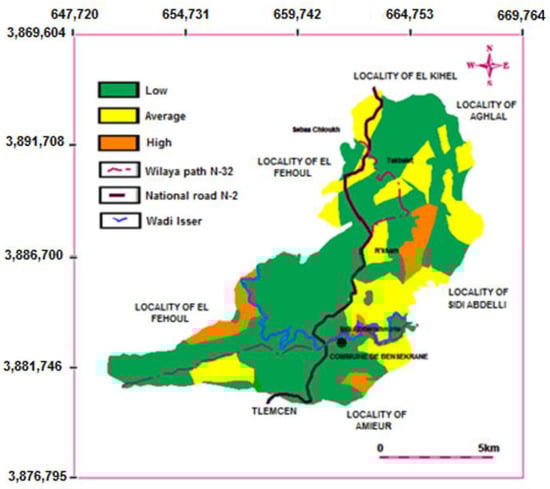
Figure 11.
Natural hazard map based on the probabilistic method of Farès.
- −
- Level 1 (0–0.5%): low hazard (547.62 Km2);
- −
- Level 2 (0.5–1.25%): average hazard (178.63 Km2);
- −
- Level 3 (1.25–4%): high hazard (53.75 Km2);
- −
- Level 4 (>4%): very high hazard.
There was no very high hazard class on this map (Figure 11).
Comparing the natural hazard maps developed using the arithmetical method, it was observed that the map created with the modified Farès method (Figure 11) was more realistic than that based on the technique of Farès (Figure 8) because we included the dynamic factors presents in the study area. The method of Farès (Table 4) allowed us to obtain two maps since it uses the arithmetic and probabilistic method for the evaluation of the hazard. The comparison between these two maps showed that the map made by the arithmetic Farès method (Figure 8) represented three levels of hazard: low, average and high. The one obtained by the probabilistic Farès method (Figure 9) contained only the low and average levels. The high level represented the areas where the slope is very high (30–35%) (Figure 2). This was due to the methodology of the approach; the arithmetic approach is a summation of the indices, whereas the probabilistic approach is a conversion of the indices towards a partial probability.
There were large areas (687.48 Km2) where the hazard was average. This was due to the summation of the triggers (permanent and dynamic) in the arithmetic method. We noticed that adding the indices or multiplying the partial probabilities influenced the intensity of the hazard. The comparison of the two maps obtained by the arithmetic Farès method (Figure 8) and by the customized (modified Farès) arithmetic method (Figure 10) showed that they were completely different maps; this was due to the addition of dynamic factors, seismicity, vegetation cover and groundwater. The addition of these factors affected the final map results.
It can be argued that the addition of dynamic factors influenced the assessment. The effect of the groundwater level apparently had a weak influence because of its high depth below the ground (Figure 5b). On the other hand, the vegetation cover and the seismicity of the zone influenced the results (Figure 10 and Figure 11). The probabilistic assessment of the hazard by the two methods yielded results that appeared almost similar. However, the modified Farès method, which included multi-hazard dynamic factors, produced what we hoped would be a more reliable map. The objective of the present study was achieved because the maps obtained showed the influence of dynamic factors in the evaluation of the hazard. Similar conclusions were observed in studies reported by Labriki, Byou and Zhou [7,8,40].
The current investigation resulted in four multi-hazard risk assessment maps. The reliability of these maps remains to be determined. Instabilities at the site should allow for confirmation of the dependability of the map. A key point to remember relates to being able to predict or to estimate when and where the failure of a slope (i.e., landslide) will occur. In other words, the level of probability of occurrence in fact modulates the degree of hazard. Our approach has been validated by multi-risk studies, hence, our interest in adding dynamic factors [41,42]. This requires the quantitative monitoring of embankments at risk. It is necessary to mention that the addition of the seismic effect was possible because of the availability of seismic zoning regulations in the case study region. A dynamic study of clay slopes showed that the introduction of dynamic factors increased the risk associated with slope movements and obtained a similar result [43]. Refinements to the maps will probably need to be added eventually. This can be the objective of future research.
The establishment of these maps makes it possible to see the influence of dynamic factors. The choice of map depends on the intensity of the hazard on each map. The selection of the method likewise depends on the data available for the area to be considered.
4. Conclusions
Multi-hazard risk assessment maps were created using permanent and dynamic factors, namely, seismic activity, vegetation cover and groundwater level. Results showed that a large area of the case study region presented a low hazard. The addition of dynamic factors allowed different maps to be generated, indicating the importance of active features in hazard evaluation. The modified Farès method, which had more input data, showed a slight difference compared to the standard Farès methods, which had less data as input. It was preferable to use the modified Farès method. The differences, although minimal, can create risks for structures and for inhabitants. However, one could conclude that the results from the standard Farès method could be utilized in data-scare situations with a similar geographical set-up to the current study area. Furthermore, continued urbanization in these safe zones can be envisaged without decision makers having to take major protective measures. On the other hand, zones exposed to high hazards (e.g., landslides) can be urbanized, but it will be necessary to incorporate protective works. It can be argued that the reliability of the maps can only be known after 50–100 years.
In closing, it is the appearance of instabilities at the site level that allows stakeholders such as town and urban planners to declare whether a hazard map is a reliable predictor or not. Such maps help decision makers and builders in their choices for enhanced safety and town planning. It is crucial to be able to utilize reliable maps based on multi-hazard risk assessment for land development purposes to lessen the possibility of destructive landslides.
Author Contributions
Conceptualization, F.B., M.A.A. and C.A.; methodology, F.B., C.A., N.K. and J.M.G.; software, F.B. and C.A.; validation, M.A.A., M.G. and J.M.G.; formal analysis, F.B., C.A. and N.K.; investigation, F.B., C.A., M.A.A., N.K., J.M.G. and M.G.; resources, F.B., C.A. and M.A.A.; data curation, F.B., M.A.A. and C.A.; writing—original draft preparation, F.B., C.A., M.A.A., N.K., J.M.G. and M.G.; writing—review and editing, F.B., C.A., M.A.A., N.K., J.M.G. and M.G.; visualization, F.B., C.A., M.A.A., N.K., J.M.G. and M.G.; supervision, C.A., M.A.A., N.K., J.M.G. and M.G. All authors have read and agreed to the published version of the manuscript.
Funding
This research received no external funding.
Institutional Review Board Statement
Not applicable.
Informed Consent Statement
Not applicable.
Data Availability Statement
Not applicable.
Conflicts of Interest
The authors declare no conflict of interest.
References
- Pourghasemi, H.R.; Sadhasivam, N.; Amiri, M.; Eskandari, S.; Santosh, M. Landslide susceptibility assessment and mapping using state-of-the art machine learning techniques. Nat. Hazards 2021, 108, 1291–1316. [Google Scholar] [CrossRef]
- Ostad-Ali-Askari, K. Management of risks substances and sustainable development. Appl. Water Sci. 2022, 12, 65. [Google Scholar] [CrossRef]
- Pal, S.C.; Chakrabortty, R.; Saha, A.; Bozchaloei, S.K.; Pham, Q.B.; Linh, N.T.T.; Anh, D.T.; Janizadeh, S.; Ahmadi, K. Evaluation of debris flow and landslide hazards using ensemble framework of Bayesian-and tree-based models. Bull. Eng. Geol. Environ. 2022, 81, 1–25. [Google Scholar] [CrossRef]
- Wei, L.; Hu, K.; Hu, X.; Wu, C.; Zhang, X. Quantitative multi-hazard risk assessment to buildings in the Jiuzhaigou valley, a world natural heritage site in Western China. Geomat. Nat. Hazards Risk 2022, 13, 193–221. [Google Scholar] [CrossRef]
- UNISDR. Sendai Framework for Disaster Risk Reduction 2015–2030; United Nations Office for Disaster Risk Reduction (UNISDR): Geneva, Switzerland, 2015. [Google Scholar]
- Carrington, M.A.; Ranse, J.; Hammad, K. The impact of disasters on emergency department resources: Review against the Sendai framework for disaster risk reduction 2015–2030. Australas. Emerg. Care 2021, 24, 55–60. [Google Scholar]
- Labriki, A.; Chakiri, S.; Nouaim, W.; Allouza, M.; Ezzayani, J. Approche méthodologique d’évaluation de susceptibilité des versants aux glissements de terrain par un modèle volumique de l’aléa; Application au secteur de Boujibar Al Hoceima (Rif, Maroc). Eur. Sci. J. ESJ 2016, 12, 206. [Google Scholar] [CrossRef]
- Byou, T.; Obda, K.; Taous, A.; Obda, I. Susceptibilité aux glissements de terrain dans la ville d’Al Hoceima et sa périphérie: Application de la méthode de la théorie de l’évidence. Geomatica 2021, 75, 1–27. [Google Scholar] [CrossRef]
- Martin, P. Ces Risques que L’on dit Naturels; Editions Eyrolles: Paris, France, 2007; ISBN13: 978-2-212-11917-6. [Google Scholar]
- Bonnard, C. Landslides. In Proceedings of the Fifth International Symposium on Landslides, Lausanne, Switzerland, 10–15 July 1988. [Google Scholar]
- Favre, J.L. Géotechnique, Sécurité des Travaux, Risque, Modélisation Incertaine, Fiabilité, Analyse de Risque; Ellipses: Washington, DC, USA, 2004. [Google Scholar]
- Favre, J.L. Trois Régions du Danger sur les Mouvements de Terrain. In Proceedings of the Actes du Colloque International: Risques, Vulnérabilité et Fiabilité dans la Construction, Alger, Algérie, 12–13 October 2003. [Google Scholar]
- Toutain, C. Prévenir les Catastrophes Naturelles? Les Essentiels Milan: Toulouse, France, 2001. [Google Scholar]
- Flageollet, J.C. Les Mouvements de la Terre et Leur Prévention; Edition Masson: Paris, France, 1989. [Google Scholar]
- Benzenine, F.; Allal, M.A.; Abdelbaki, C. Systémique et SIG: Prévention Contre L’Aléa des Mouvements de Pente, cas de la Commune de Bensekrane, Tlemcen (Algérie); Editions Universitaires Européenne: Saarbrücken, Germany, 2012. [Google Scholar]
- Besson, L. Natural Hazards in the Mountains, Treatment, Surveillance; Artès-Publialp: Grenoble, France, 1996; 438p. [Google Scholar]
- Besson, L.; Grask, E.; Toulemont, E. Plans de Prévention des Risques Naturels, Risques des Mouvements de Sol, Guide Méthodologique; La Documentation Française: Paris, France, 1999. [Google Scholar]
- Corominas, J.; Mavrouli, C. Estimation quantitative du risque (QRA) pour les bâtiments liés aux éboulements rocheux: Progrès et défis. Mémoire Société Vaud. Sci. Nat. 2013, 25, 229–242. [Google Scholar]
- Augendre, M. La Cartographie et le Zonage. La Vulnérabilité, un Concept Fondamental au Cœur des Méthodes D’Evaluation des Risques Naturels; Collection Géorisques: Montpellier, France, 2005; pp. 9–26. [Google Scholar]
- Clerici, A.; Perego, S.; Tellini, C.; Vescovi, P. A procedure for landslide susceptibility zonation by the conditional analysis method. Geomorphology 2002, 48, 349–364. [Google Scholar]
- Ostad-Ali-Askari, K. Investigation of meteorological variables on runoff archetypal using SWAT: Basic concepts and fundamentals. Appl. Water Sci. 2022, 12, 177. [Google Scholar] [CrossRef]
- Wilde, M.; Günther, A.; Reichenbach, P.; Malet, J.-P.; Hervas, J. Pan-European landslide susceptibility mapping: ELSUS Version 2. J. Maps 2018, 14, 97–104. [Google Scholar]
- Guzzetti, F.; Mondini, A.C.; Cardinali, M.; Fiorucci, F.; Santangelo, M.; Chang, K.-T. Landslide inventory maps: New tools for an old problem. Earth Sci. Rev. 2012, 112, 42–66. [Google Scholar] [CrossRef]
- Bathrellos, G.D.; Skilodimou, H.D.; Chousianitis, K.; Youssef, A.M.; Pradhan, B. Suitability estimation for urban development using multi-hazard assessment map. Sci. Total Environ. 2017, 575, 119–134. [Google Scholar] [CrossRef]
- Bell, R.; Glade, T. Multi-hazard analysis in natural risk assessments. WIT Trans. Ecol. Environ. 2004, 77, 1–10. [Google Scholar]
- Çellek, S. Effect of the Slope Angle and Its Classification on Landslide. Nat. Hazards Earth Syst. Sci. Discuss. 2020, 87, 1–28. [Google Scholar] [CrossRef]
- Guzzetti, F.; Reichenbach, P.; Cardinali, M.; Galli, M.; Ardizzone, F. Probablistic Landslide Hazard Assessment at the Basin Scale. Geomorphology 2005, 72, 272–299. [Google Scholar]
- Kumar, N.; Yamaç, S.S.; Velmurugan, A. Applications of remote sensing and GIS in natural resource management. J. Sci. Assoc. 2015, 20, 1–6. [Google Scholar]
- Abdelbaki, C.; Touaibia, B.; Ammari, A.; Mahmoudi, H.; Goosen, M. Contribution of GIS and Hydraulic Modeling to the Management of Water Distribution Network. In Geospatial Challenges in the 21st Century; Springer: Cham, Switzerland, 2019. [Google Scholar] [CrossRef]
- Koutsopoulos, K.; de Miguel González, R.; Donert, K. (Eds.) Geospatial Challenges in the 21st Century; Key Challenges in Geography; Springer: Cham, Switzerland, 2019. [Google Scholar] [CrossRef]
- Wang, Y.; Fang, Z.; Wang, M.; Peng, L.; Hong, H. Comparative study of landslide susceptibility mapping with different recurrent neural networks. Comput. Geosci. 2020, 138, 104445. [Google Scholar] [CrossRef]
- Gill, J.C.; Malamud, B.D. Anthropogenic processes, natural hazards, and interactions in a multihazard framework. Earth Sci. Rev. 2017, 166, 246–269. [Google Scholar] [CrossRef]
- Gill, J.C.; Malamud, B.D. Reviewing and visualizing the interactions of natural hazards. Rev. Geophys. 2014, 52, 680–722. [Google Scholar] [CrossRef]
- LCPC. Collection Environnement, Caractérisation et Cartographie de L’Aléa dû Aux Mouvements de Sol; Les Risques Naturels: Paris, France, 2000. [Google Scholar]
- Anbalagan, R. Landslide hazard evaluation and zonation mapping in mountainous terrain. Eng. Geol. 1992, 32, 269–277. [Google Scholar] [CrossRef]
- Grossi, P.; Kunrenther, H. Catastrophe Modeling: A New Approach to Managing Risk; Springer: Berlin/Heidelberg, Germany, 2005. [Google Scholar] [CrossRef]
- Farès, A.; Rollet, M.; Broquet, P. Méthodologique de la cartographie des risques naturels liés aux mouvements de terrain (Région Taounate, Rif Maroc). Rev. Française Géotech. 1994, 69, 63–72. [Google Scholar] [CrossRef]
- Gilles, A.; Cartographie du Risque Naturel Dans le Monde. Etude Comparative Entre une Approche D’Ordre Social et une Approche D’Ordre Economique de la Vulnérabilité. Cybergeo: Eur. J. Geogr. 2004. Available online: http://journals.openedition.org/cybergeo/2614 (accessed on 3 February 2022).
- Allal, M.A. Technical Report, Dossier Géotechnique Commune de Bensekrane; URBA: Tlemcen, Algérie, 2004. [Google Scholar]
- Zhou, S.; Chen, G.; Fang, L.; Nie, Y. GIS-Based Integration of Subjective and Objective Weighting Methods for Regional Landslides Susceptibility Mapping. Sustainability 2016, 8, 334. [Google Scholar] [CrossRef]
- Nachappa, G.T.; Ghorbanzadeh, O.; Gholamnia, K.; Blaschke, T. Multi-Hazard Exposure Mapping Using Machine Learning for the State of Salzburg, Austria. Remote Sens. 2020, 12, 2757. [Google Scholar]
- Youssef, A.M.; Mahdi, A.M.; Al-Katheri, M.M.; Pouyan, S.; Pourghasemi, H.R. Multi-hazards modeling using machine learning algorithms in Southwestern Saudi Arabia. Res. Sq. 2022, in press. [Google Scholar] [CrossRef]
- Karray, M.; Ghobrial, F. Analyse Dynamique des Pentes Argileuses et des Remblais Construits sur des Dépôts D’Argile; Rapport Final Geo-03-13; Université de Sherbrooke: Sherbrooke, QC, Canada, 2013. [Google Scholar] [CrossRef]
Disclaimer/Publisher’s Note: The statements, opinions and data contained in all publications are solely those of the individual author(s) and contributor(s) and not of MDPI and/or the editor(s). MDPI and/or the editor(s) disclaim responsibility for any injury to people or property resulting from any ideas, methods, instructions or products referred to in the content. |
© 2023 by the authors. Licensee MDPI, Basel, Switzerland. This article is an open access article distributed under the terms and conditions of the Creative Commons Attribution (CC BY) license (https://creativecommons.org/licenses/by/4.0/).