Article

Modelling Distributions of Asian and African Rice Based on MaxEnt

The Innovation Team of Crop Germplasm Resources Preservation and Information, Institute of Crop Science, Chinese Academy of Agricultural Sciences, Beijing 100081, China
*
Authors to whom correspondence should be addressed.
These authors contributed equally to this work.
Sustainability 2023, 15(3), 2765; https://doi.org/10.3390/su15032765
Submission received: 27 December 2022 / Revised: 22 January 2023 / Accepted: 30 January 2023 / Published: 3 February 2023
(This article belongs to the Section Sustainability, Biodiversity and Conservation)

Abstract

:
Rice landraces, including Asian rice (Oryza sativa L.) and African rice (Oryza glaberrima Steud.), provide important genetic resources for rice breeding to address challenges related to food security. Due to climate change and farm destruction, rice landraces require urgent conservation action. Recognition of the geographical distributions of rice landraces will promote further collecting efforts. Here we modelled the potential distributions of eight rice landrace subgroups using 8351 occurrence records combined with environmental predictors with Maximum Entropy (MaxEnt) algorithm. The results showed they were predicted in eight sub-regions, including the Indus, Ganges, Meghna, Mekong, Yangtze, Pearl, Niger, and Senegal river basins. We then further revealed the changes in suitable areas of rice landraces under future climate change. Suitable areas showed an upward trend in most of study areas, while sub-regions of North and Central China and West Coast of West Africa displayed an unsuitable trend indicating rice landraces are more likely to disappear from fields in these areas. The above changes were mainly determined by changing global temperature and precipitation. Those increasingly unsuitable areas should receive high priority in further collections. Overall, these results provide valuable references for further collecting efforts of rice landraces, while shedding light on global biodiversity conservation.

1. Introduction

Crop landraces, also known as farmers’, traditional, or local varieties, are cultivated flora formed by native or traditional agricultural cultures through cultivation, selection, and dissemination [1,2,3]. As important genetic resources, crop landraces play an important role in modern agricultural breeding [4]. Food security is a major challenge in the world today. Our growing population is expected to increase the demand on global food production [5,6]. Climate change, urbanization, and non-food crops land uses are constantly threatening the habitat of crop landraces, causing a decline in the richness of species [7]. In addition, modern agricultural practices implement single crop improvement varieties, resulting in the loss of genetic diversity of crop landraces [8]. These factors have negative effects on the landraces and would even eventually lead to their extinction. It is thus now urgent to carry out the necessary rescue collection for crop landraces. The preliminary geographical distribution assessment of crop landraces can inform collecting efforts for ex situ conservation (i.e., genebanks and botanical gardens).
The genus Oryza L. includes two crop landraces, Asian rice (Oryza sativa L.) and African rice (Oryza glaberrima Steud.), which originated independently in Asia and Africa, respectively [9]. They are now widely grown throughout the world and supply a source of food for more than half of the world’s population [10]. However, owing to the above reasons, the species richness and genetic diversity of these two rice landraces are being lost at an accelerated rate. Some rice landrace subgroups have even disappeared from farmer’s fields. Since the emergence of the Green Revolution, locally adapted rice landraces have been displaced by high-yielding varieties. During this process, the genetic diversity of rice landraces decreased drastically in Asia and Africa [11]. According to the World Conservation Monitoring Centre (1992), 74% of the rice landraces in Indonesia are mainly from a single stock [12]. Despite extensive collecting efforts over the past decades, the diversity of rice landraces is still commonly considered to remain under-represented in ex situ conservation.
Recognition of the geographical distributions of rice landraces will promote further collecting efforts. In recent years, species distribution models (SDMs), such as domain environmental envelope (DOMAIN), genetic algorithms for rule-set production (GARP), bioclimatic modeling (BIOCLIM), ecological niche factor analysis (ENFA), and maximum entropy (MaxEnt), have been widely used to predict the potential distributions of various crops. Among them, the MaxEnt model, based on maximum entropy theory, was originally developed as a statistical model using occurrence data and environmental variables (such as rainfall and temperature of study areas) to predict species distributions with high accuracy, objectivity, and geographical uniformity, which is a very frequently used tool for species distribution modelling and has been proven to generate robust results comparing to other SDMs [13]. The MaxEnt model can evaluate the geographical distribution of a species by locating the distribution with the maximum entropy (i.e., closest to geographic homogeneity) and subject to environmental conditions derived from the recorded occurrence sites [14]. Compared to other SDMs, the MaxEnt model has many advantages as follows: (1) only species occurrence records and environmental variables are required to feed the model during the modelling process; (2) both discrete and continuous variables can be utilized as variables and interactions between variables can be evaluated; (3) “over-fitting” results can be avoided by γ-regulation of model parameters; (4) the outputs are continuous and are appropriate for explanation [15]. Based on these advantages, the MaxEnt model has been successfully applied for species distribution modelling with presence-only records in the previous works [16,17,18].
Specifically, the MaxEnt model has been successfully applied to model the geographical distributions of crop wild relatives and crop landraces and obtained excellent results [19,20]. The geographical distributions of rice landraces were projected using the MaxEnt model in the previous study [1], which demonstrated that the MaxEnt model is suitable for assessing the potential distribution of rice landraces. However, due to incomplete records of origins, particularly in China, the geographical distributions of rice landraces have not been comprehensively assessed. To promote further collecting efforts for rice landraces, we used MaxEnt algorithm to build rice landrace distribution models (thereafter RLDMs) to predict an approximation of the distributions of Asian rice and African rice, respectively [21]. In this study, we are the first to establish the comprehensive geographical distributions of rice landraces via adding occurrence records in China and reveal the changes in suitable areas of rice landraces under future climate change. Our models relied on openly accessible occurrence records, environmental predictors, and tools [21,22,23]. The objectives of this study were to (1) build RLDMs to reveal the current potential geographical distributions of rice landraces; (2) use the RLDMs to indicate changes in suitable areas of rice landraces under four future climate scenarios in the next decades; (3) determine the main environmental variables associated with the potential distributions.

2. Materials and Methods

2.1. Crop Landrace Study Areas

The distributions of rice landraces were modelled in recognized primary areas and in some secondary areas of diversity, where these crops have been domesticated and cultivated for a long time, and where high levels of genetic diversity and adaptation to indigenous environmental and cultural factors would be expected [24]. These regions were identified through literature reviews. O. sativa was domesticated from O. rufipogon Griff. through two separate domestication events, forming O. sativa japonica and O. sativa indica. The group japonica was domesticated about 7000 years ago in the Yangtze River and Qiantang River Basin of Southern China. The group indica was subsequently domesticated about 4500 years ago in the Ganges plains of India [25]. O. glaberrima was domesticated from the rice wild relative O. barthii in West Africa for approximately 3000 years BP in the inner Niger Delta region in Mali [26]. For our study, we focused on East, South, and Southeast Asia as the center of primary regions of diversity for Asian rice, and West Africa as the center of primary regions of diversity for African rice.

2.2. Occurrence Records

The RLDMs rely on geographical occurrence records, which are coordinates of sites where landraces were formerly collected for ex situ conservation. In this study, the occurrence records of rice landrace were obtained from a literature review [1] and CGRIS (Chinese Crop Germplasm Resources Information System—https://cgris.net/ (accessed on 10 September 2022)). The Asian rice included four distinct major subgroups: indica, aus, aromatic, and japonica, and the African rice contained four clusters—K2, K4, K5, and others—that captured most of the genetic variation of the whole O. glaberrima collection conserved at the AfricaRice genebank [26,27]. Occurrences were clipped to study areas per subgroup. Removing duplicated occurrence records within or between data sources and correcting or deleting coordinates when the longitude and latitude were zero, inverted, or located in the wrong place, we finally got a total of 8351 occurrence records for the eight subgroups. In addition, due to all spatially gridded data being scaled at a spatial resolution of 2.5 arc-min (~5 km2), the MaxEnt model could automatically perform ~5 km2 spatial filtering. All occurrences within the study region of rice landrace subgroups are in Supplementary Figures S1 and S2.

2.3. Environmental Predictors

In this study, we compiled and gathered spatially gridded information for a total of 35 potential environmental predictors of rice landraces, including climatic and topographic variables under current conditions and future conditions. The predictors under current conditions ranging from 1970 to 2000 were gathered from the WorldClim v2 dataset [22]. The future predictors ranging from 2041 to 2060 were downloaded from the Coupled Model Intercomparison Project Phase 6, with 4 climate scenarios including ssp126, ssp585, ssp245, and ssp370 [28]. The variables related to water stress and growing degree days were collected from the Environmental Rasters for Ecological Modelling (ENVIREM) dataset [23]. Elevation data were gathered from the Shuttle Radar Topography Mission (SRTM) dataset. All spatially gridded data were scaled to or computed at a spatial resolution of 2.5 arc-min (~5 km2).

2.4. Landrace Distribution Modelling

We produced the RLDMs using the MaxEnt Java application to predict the probability of geographical distributions for each rice landrace subgroup [21]. To avoid excessive model complexity and multicollinearity of variables that could result in model overfitting, the variables used in the models were reselected from the environmental predictors using a combination of Random Forest Classification (RFC) and Pearson correlation coefficient [29,30,31]. For variables with correlation coefficient value ≥ ±80%, the one with less importance in RFC was dropped [32]. Finally, a total of 13 variables (Supplementary Table S4) were selected for use in the RLDMs and the correlation is shown in Figure 1a.
For each subgroup, the RLDMs were built by ten-fold (K = 10) cross-validation with 10,000 background points (pseudo-absences) and a regularization multiplier of 1.0, using linear and quadratic features. We assessed the RLDMs performance using the ten-fold average area under the test receiving operating characteristic curve (AUC) and the standard deviation of the AUC across ten replicates (SDAUC). The Jackknife test was carried out to examine the contribution of environmental variables on landrace distributions. The output results of ASCII form were calculated and visualized using QGIS 3.22.
For model validation, the robust RLDMs required a mean AUC ≥ 0.9 and SDAUC < 0.05. In this study, to generate a single prediction that represents the presence probability for each rice landrace subgroup, we computed the average across K models. The output results of models were the distribution probability, showing the probability value of the current occurrence of subgroups on the grid. Determining the geographical distributions more precisely, geographical areas with probability values above 0.8 were considered the final areas of potential presence [24]. Finally, the RLDMs were used to predict the geographical distributions of rice landraces in the next decades under 4 future climate scenarios with ssp126, ssp585, ssp245, and ssp370, indicating the impacts of climate change on rice landraces.

3. Results

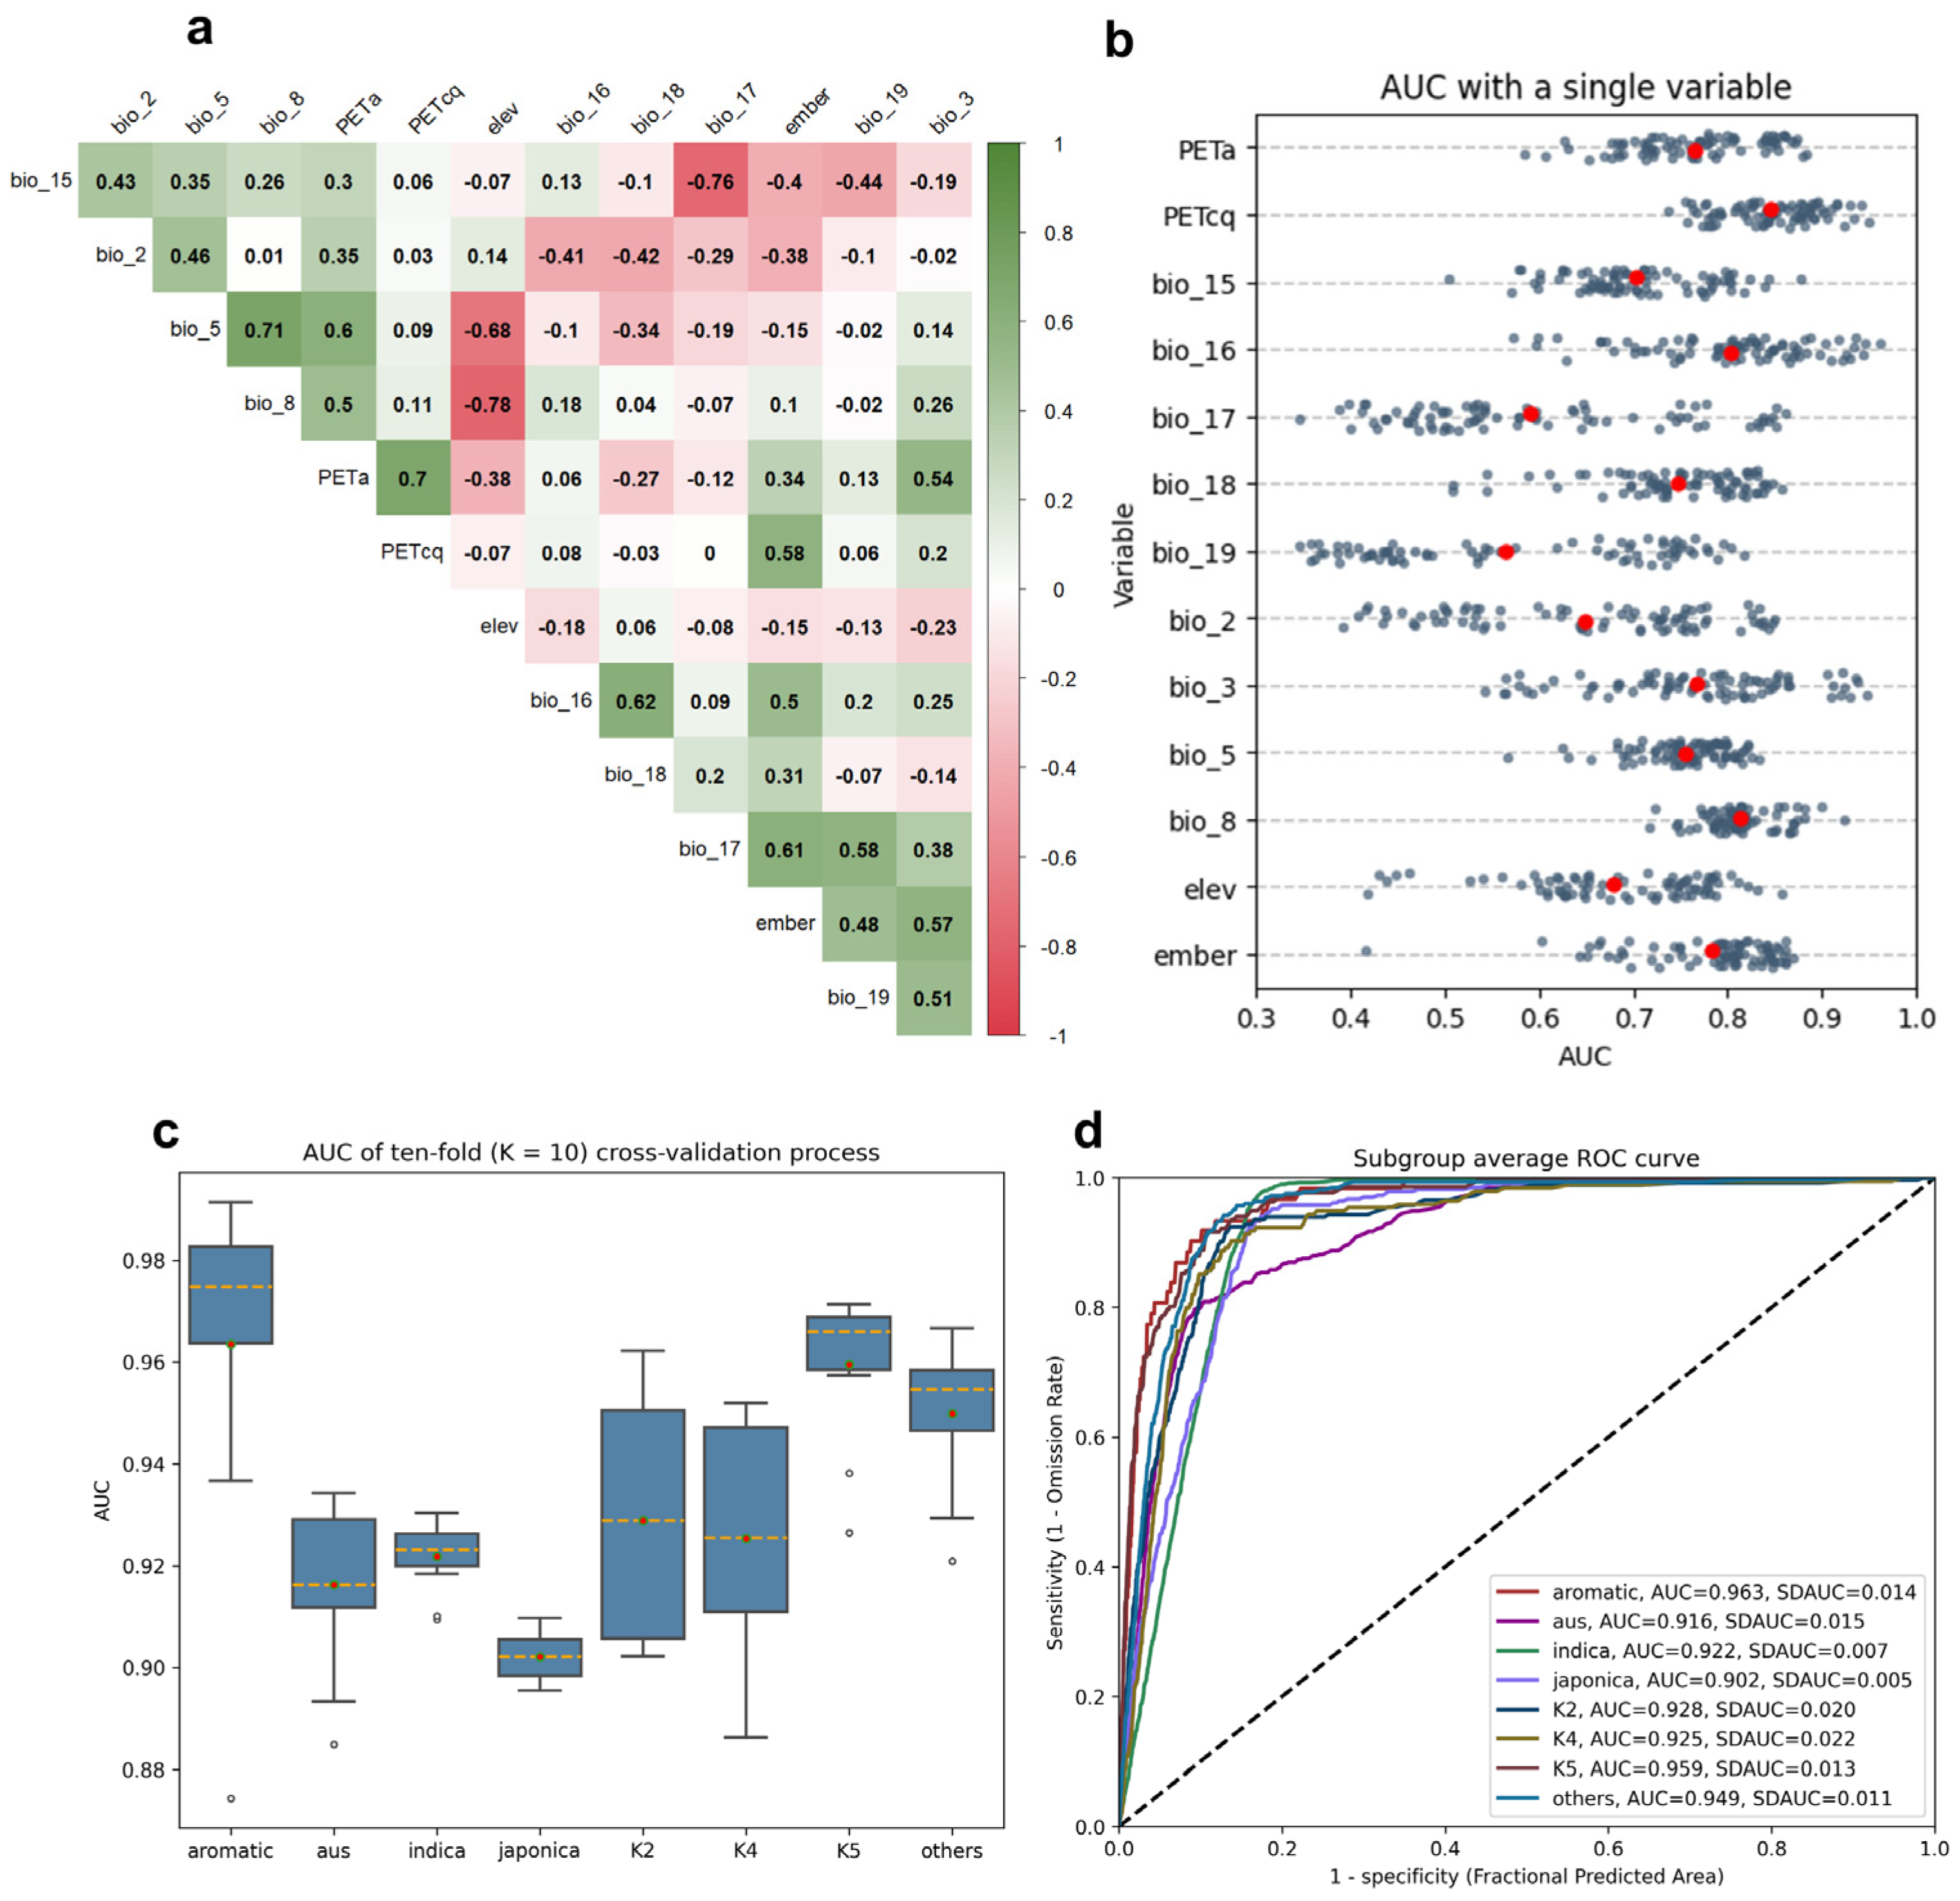
3.1. Modelling Validation

The average AUC values and SDAUC values across K models for RLDMs of each rice landrace subgroup are shown in Figure 1d. The results showed that all RLDMs had considerably high AUC values, ranging from 0.916 to 0.963, and low SDAUC values, ranging from 0.005 to 0.022. Besides, the average AUC values of each model under each environmental variable were generated (Supplementary Table S5). Overall, the above results demonstrated that the RLDMs results for rice landrace geographical distributions were accurate and reliable for further analysis.

3.2. Predicted Distributions of Rice Landraces

On the basis of occurrences of rice landrace subgroups and environmental predictor variables, the richness of predicted geographical distributions of rice landraces are provided in Figure 2a. Areas with potential geographical distributions of rice landraces were projected in sub-regions of South, Southeast, and East Asia and West Africa. These geographical distributions of the diversity of rice landraces are consistent with the historically recognized centers of origin and major regions of world rice crop diversity [33].
The geographical distribution areas of rice landraces could be further divided into eight sub-regions. Specifically, the predicted geographical distributions of Asian rice could be divided into six sub-regions, including the Indus, Meghna, Ganges, Mekong, Yangtze, and Pearl River basins. Regions with a particularly high level of richness of Asian rice were expected in the Basin of the Meghna River and the Ganges, with up to four subgroups overlapping in the same areas (~5 km2). The potential distributed areas of African rice could be divided into two sub-regions, including the basin of the Niger River and the Senegal River. The assessed African rice displayed particularly high predicted richness in Southern Senegal, Guinea Peso, Southwestern Mali, Western Guinea, and Eastern Nigeria, with up to four subgroups. The predicted distributions of each subgroup of rice landraces are provided in Figure 2b (mainly predicted distribution areas shown in Table 1).

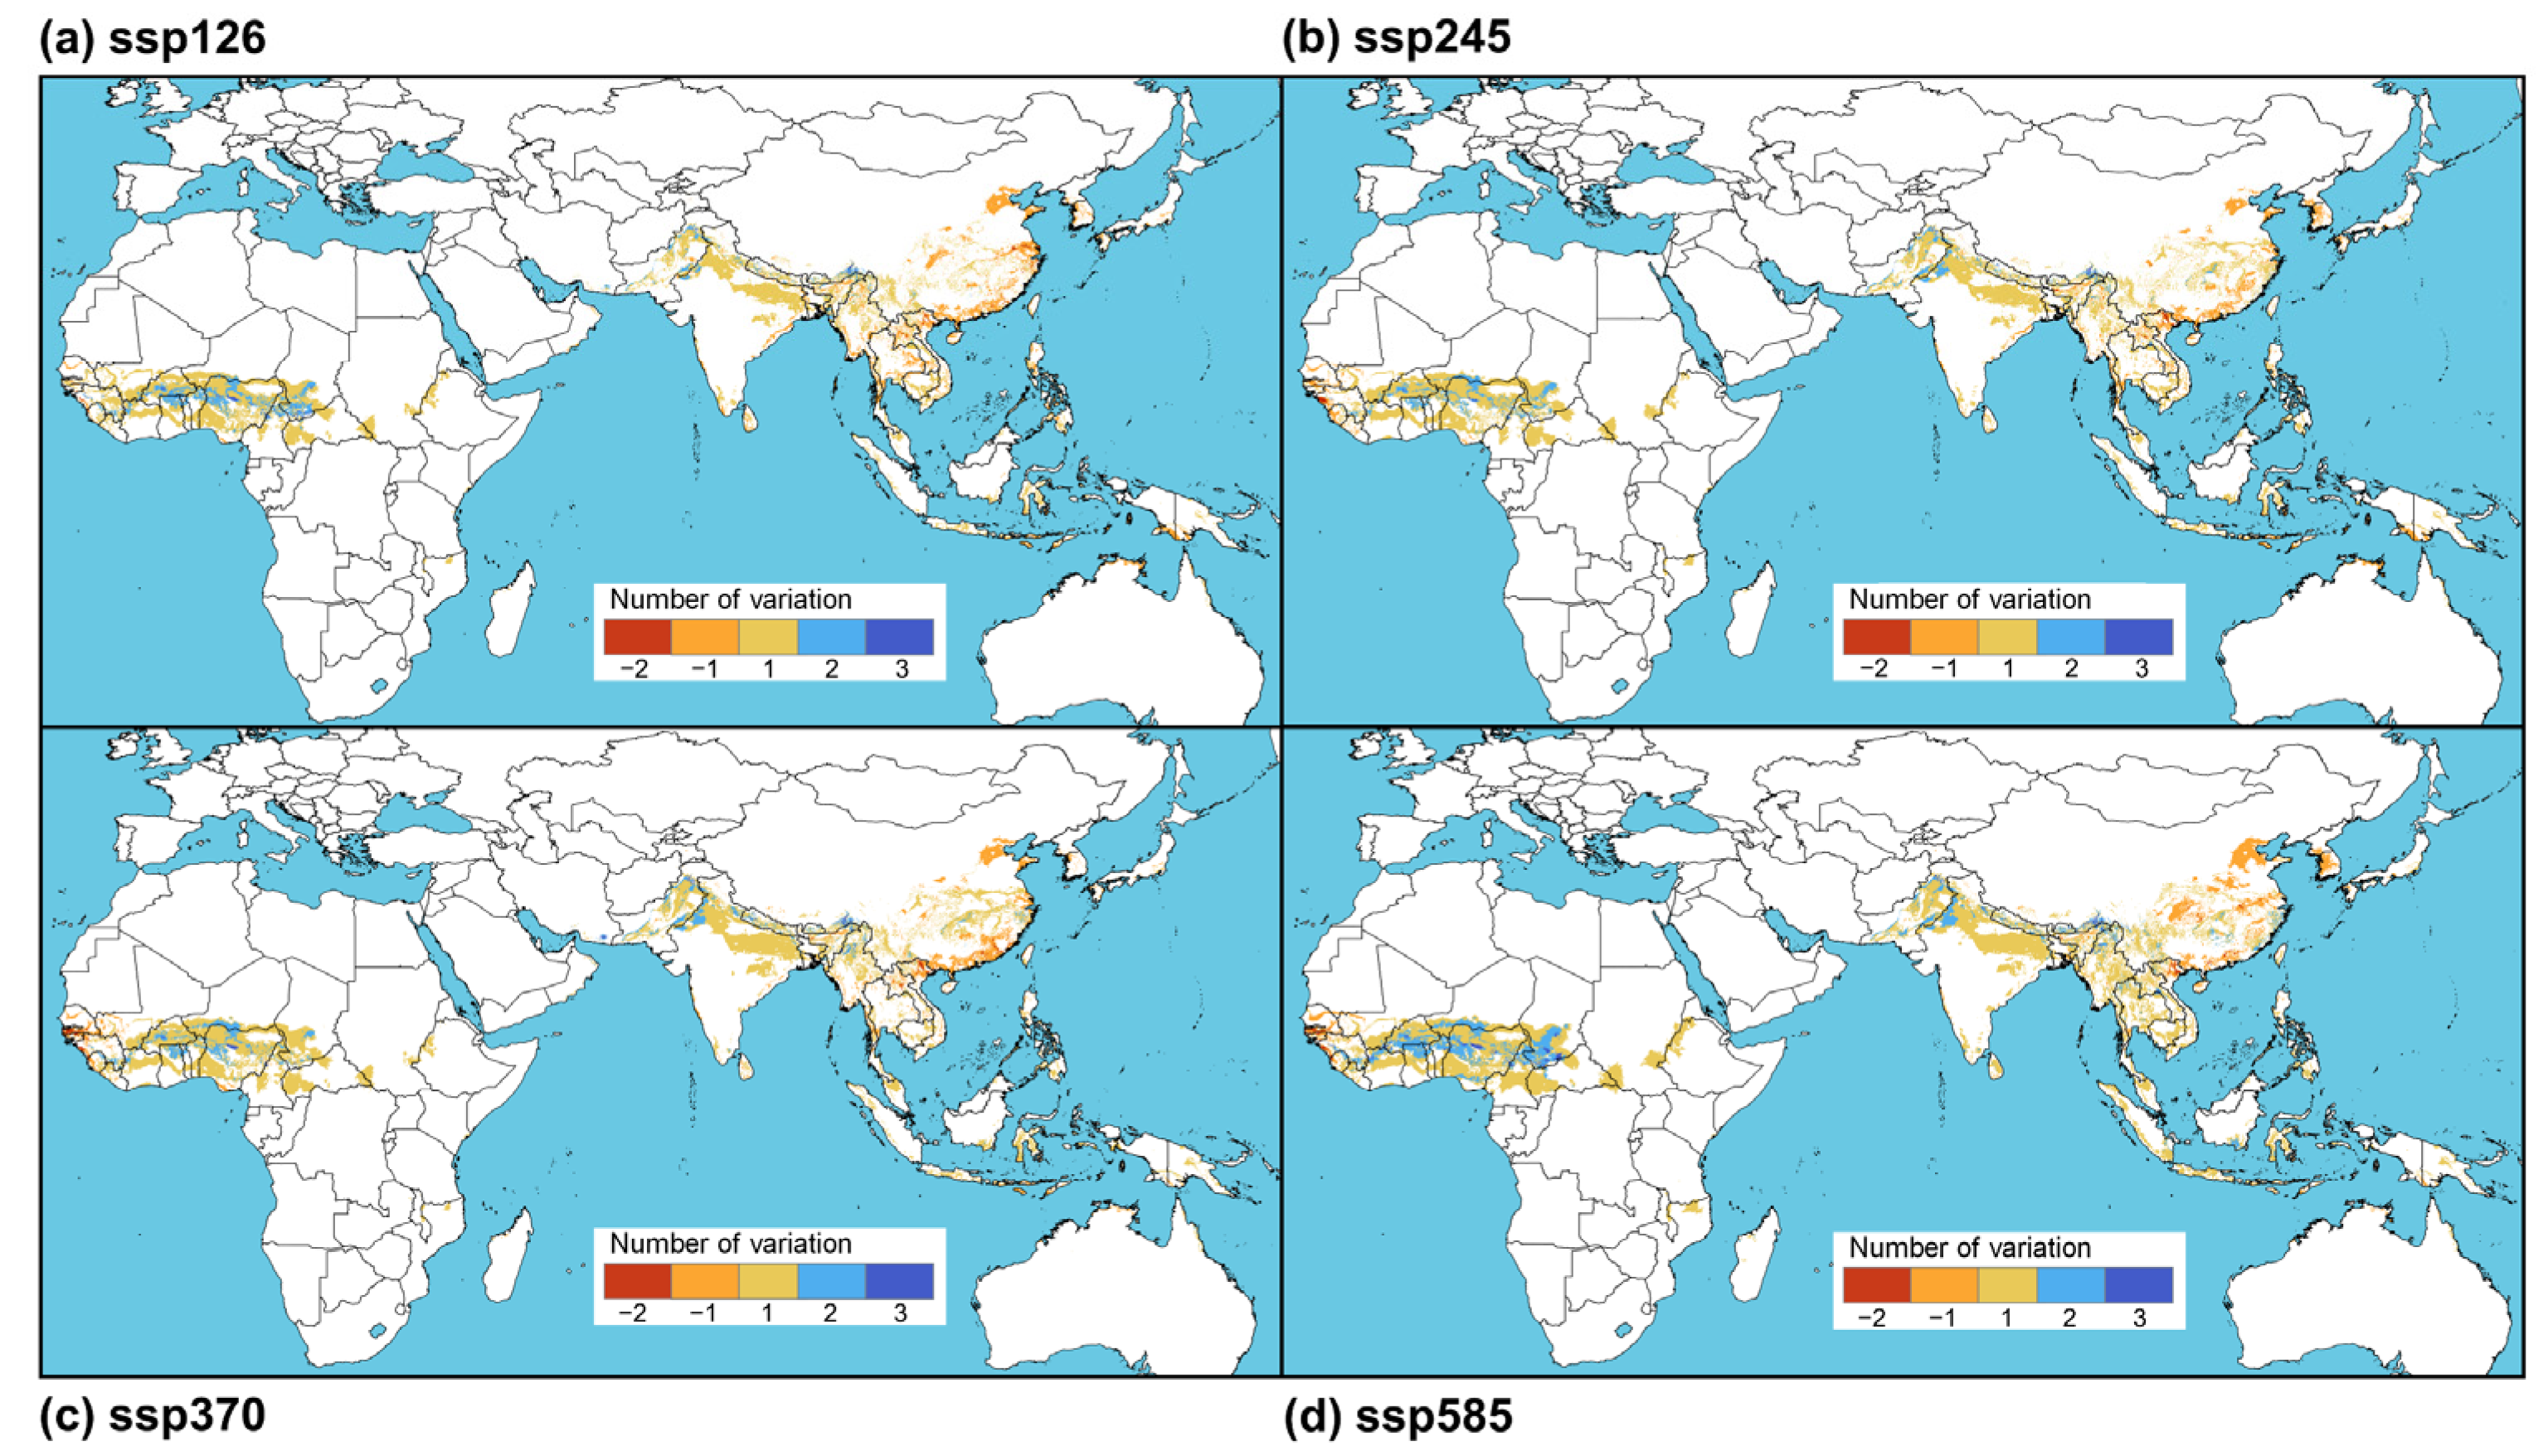
3.3. Changing Suitable Areas under Climate Change

To understand how the suitable areas of rice landraces would change under climate change, we further demonstrate the suitable areas of rice landraces in the next decades under four future climate scenarios including ssp126, ssp585, ssp245, and ssp370, using the RLDMs of each rice landrace subgroup (Supplementary Figure S5 presents the predicted distributions of rice landrace subgroups under four future climate scenarios). We then obtained the changing suitable areas of rice landraces in our study areas shown in Figure 3, comparing with current distribution areas. The results showed that the changing trends of suitable areas of rice landraces were generally consistent under four future climate scenarios.
For Asian rice, suitable areas mainly increased in Central Pakistan, Northern India, Nepal, and Southeast Asia, particularly in North Burma; unsuitable areas primarily increased in sub-regions of North China and Southwest China. For African rice, increased suitable areas were widely located in West Africa, especially in Burkina Faso, Central Nigeria, and Southern Mali; increased unsuitable areas were mainly present in sub-regions of the West Coast of West Africa. Among them, Pakistan, India, Burma, China, Burkina Faso, Nigeria, and Niger were the countries with the most significant changes.

3.4. Further Collection Assessments

Across the predicted geographical distributions of rice landraces of all eight subgroups, further collecting efforts for ex situ conservation should be concentrated in eight sub-regions, specifically in Central Pakistan, Northeastern India, Bangladesh, North Burma, Laos, Cambodia, Southern Vietnam, South China for Asian rice and Southern Senegal, Guinea Peso, Southwestern Mali, Western Guinea, and Eastern Nigeria for African rice, where the assessed rice landraces displayed particularly high levels of predicted richness. Meanwhile, the suitable areas of rice landrace subgroups will gradually change in the coming decades with the ongoing climate change. The majority of the study areas showed an overall increasing trend in suitable areas under all four future climate scenarios, indicating that the range of suitable habitats for rice will increase in the next decades, which provided good conditions for the development of genetic diversity in rice landraces. Conversely, unsuitable areas were primarily distributed in sub-regions of North and Central China, and West Coast of West Africa, which means that rice landraces are much more likely to disappear from farmers’ fields in these areas. These areas thus should be highly prioritized in future collection efforts.

3.5. Main Environmental Predictors Determining the Distributions

To further investigate the impacts of environmental predictors on the geographical distribution modelling of rice landraces, the average AUC with a single variable of each RLDMs was analyzed (Figure 1b). The results showed that the most of environmental variables individually contributed more than 0.6 to the model results, suggesting that the environmental variables reselected were valid. Furthermore, the PETa (Annual potential evapotranspiration), PETcq (Mean monthly PET of coldest quarter), ember (Emberger’s pluviothermic quotient), bio_3 (Isothermality), bio_5 (Max Temperature of Warmest Month), bio_8 (Mean Temperature of Wettest Quarter), and bio_16 (Precipitation of Wettest Quarter) had the highest effect on the geographical prediction of rice landraces, which were temperature-related and precipitation-related variables. The mean AUC based on each of the seven variables was above 0.75, indicating that these variables were the main environmental predictors determining the geographical distribution of rice landraces. In addition, the bioclimatic variables generally had higher effects on the geographical distributions of rice landraces, compared with the variables related to water stress and growing degree days. Taken together, these results provide valuable insights for future studies on the impacts of climate change on the distribution of rice landraces.

4. Discussion

Rice is one of the most important food crops for human beings and has long been cultivated mainly in Asia, southern Europe, and parts of tropical America and Africa [34]. As food security has been a spotlight around the world in recent decades, rice landrace genetic resources have attracted a considerable amount of research attention [34,35]. The effective use of rice landrace genetic resources is essential in efforts to address the increasing challenges (e.g., global warming, environmental degradation, etc.) associated with human nutrition and sustainable agricultural development [36,37]. Understanding the potential distributions of rice landraces provides a foundation for in situ and ex situ conservation planning, thereby conserving rice landraces diversity and supplying available raw materials for rice breeding [38].
The potential geographical distributions of rice landraces were established by building RLDMs in this study. Similarly, the geographical distributions of rice landraces were projected using the MaxEnt model in the previous study [1]. However, due to incomplete records of origins, particularly in China, the previous model results led to underestimations of the geographical distributions of rice landraces. In our study, we added the occurrence records of rice landraces originating in China, which first established the comprehensive geographical distribution models of rice landraces. Following that, the RLDMs were used to demonstrate the suitable areas of rice landraces under four future climate scenarios, which first revealed the impact of climate change on the suitable areas of rice landraces.
In addition, we further analyzed how the potential geographical distributions obtained from the RLDMs were determined by environmental predictors and to what extent they were influenced. We found that the models were mainly determined by seven variables—PETa, PETcq, ember, bio_3, bio_5, bio_8, and bio_16, which were temperature-related and precipitation-related factors. In practice, rice is normally a rain-fed crop and is strongly affected by temperature-related and precipitation-related variables in many stages of rice growth. It was reported that mean temperature and annual precipitation were the main climatic factors affecting the climatic suitability of rice crops in a previous study [39], which was consistent with this study. The mean temperature is essential to ensure flowering and maturity of rice crop [40]. The RLDMs predicted the geographical distributions of rice landraces under natural conditions, in which irrigation was not considered and precipitation-related factors were the only water inputs for models [41]. This explained the importance of precipitation-related factors for the geographical distributions of rice landraces. Collectively, these variables would provide valuable references for further research on the geographical distributions of rice landraces and reveal the mechanisms of climate change affecting rice landrace geographical distributions, which could be used as early warning indicators for rice landrace conservation.
The process of rice landrace distribution modelling described here suggests the potential to link genetic, physiological, morphological, and other traits of rice landraces to environmental predictors within the areas of origin. This process can provide valuable references for further collecting efforts for rice landraces. While our modelling is based on openly accessible data and state-of-the-art tools, there are still several limitations as below.
First, the model accuracy of rice landrace distributions is largely influenced by the quality, completeness, and availability of occurrence data. The occurrence data used in our analysis are mainly obtained from online shared databases (e.g., Genesys, WIEWS, etc.). Some rice landrace subgroups are insufficiently sampled. These institutions that share data may not report all holdings and many existing records lack coordinate information [42]. Meanwhile, some additional information may be present in other smaller online databases or may not even be publicly available by the holding institutions [43]. The occurrence data thus are not fully representative of the true distribution of rice landraces in the center of crop origins. These gaps increase the uncertainty in our model, probably leading to underestimations of the true extent of the distributions of rice landraces. Integrating geographical passport and characterization data from pertinent national and subnational institutions into an online database, such as Genesys, may help to address this data challenge in the future.
Second, the MaxEnt model expresses a probability distribution of the species from a set of environmental variables and occurrence localities. The quality and comprehensiveness of these predictors also affect the model accuracy. Many variables lacking predictor information are not well-integrated into the modelling process. These may include other environmental variables, such as abiotic (e.g., soil nutrient availability, soil irrigation, etc.), biotic (e.g., mycorrhizae, pathogens, etc.), and agriculturally relevant socioeconomic variables (e.g., farming systems, farmer choices, etc.) [44,45]. Nevertheless, it is a challenge to quantify these variables, especially highly subjective human activities. Further development of high-resolution predictor information will improve the model performance. Meanwhile, the limitations of predicting species distributions should be accepted, as they are driven by a combination of human preferences and environmental factors.
Finally, although we applied a widely used species distribution model, we are going to develop an ensemble model (EM) of multiple methods in further research, which may improve the accuracy of RLDMs [46,47,48]. Besides, the RLDMs are unable to predict recent extinction of rice landraces due to intensive human activities unless such damages are related to available predictors, such as land use information [49]. The geographical distributions predicted by RLDMs thus can only be used as a decision support tool for rice landrace collecting efforts, and the determination of specific further collecting plans needs to be combined with the corresponding expert opinions.

5. Conclusions

The RLDMs provided reliable predictions for the geographical distributions of rice landraces. The current geographical distributions of rice landraces were predicted in eight sub-regions—the Indus, Ganges, Meghna, Mekong, Yangtze, Pearl, Niger, and Senegal river basins. Moreover, the changes in suitable areas of rice landraces under future climate change was revealed. Suitable areas showed an upward trend in most of the study areas, while sub-regions of North and Central China and the West Coast of West Africa displayed an unsuitable trend. These increasingly unsuitable areas should be high priority in further collecting efforts. The PETa, PETcq, ember, bio_3, bio_5, bio_8, and bio_16 were identified as the main environmental predictors determining the geographical distributions of rice landraces, which were temperature-related and precipitation-related factors. In summary, these results provide valuable references for further conservation action of rice landraces.

Supplementary Materials

The following supporting information can be downloaded at: https://www.mdpi.com/article/10.3390/su15032765/s1.

Author Contributions

Y.L.: Conceptualization, Methodology, Software, Visualization, Writing—original draft, and Writing—review & editing; H.W.: Conceptualization, Methodology, Software, Visualization, Writing—original draft, and Writing—review & editing; Y.C. (Yanqing Chen): Conceptualization, Methodology, Software, Visualization, Writing—original draft, and Writing—review & editing; J.T.: Data curation, Visualization, and Writing—review & editing; J.H.: Data curation, Visualization, and Writing—review & editing; S.Y.: Data curation, Visualization, and Writing—review & editing; Y.C. (Yongsheng Cao): Supervision, Validation, and Writing—review & editing; W.F.: Supervision, Validation, and Writing—review & editing. Y.L., H.W., and Y.C. (Yanqing Chen) contributed equally to this work. All authors have read and agreed to the published version of the manuscript.

Funding

This work was supported by the Central Public-interest Scientific Institution Basal Research Fund (Y2022LM14) of China and the Agricultural Science and Technology Innovation Program (ASTIP) (CAAS-ASTIP-2023-ICS01).

Data Availability Statement

Data are available in the Supplementary materials. (Occurrence records used for this study are available at https://doi.org/10.1038/s41477-022-01144-8 and https://cgris.net/ (accessed on 10 September 2022)).

Conflicts of Interest

The authors declare that they have no known competing financial interests or personal relationships that could have appeared to influence the work reported in this paper.

References

  1. Ramirez-Villegas, J.; Khoury, C.K.; Achicanoy, H.A.; Diaz, M.V.; Mendez, A.C.; Sosa, C.C.; Kehel, Z.; Guarino, L.; Abberton, M.; Aunario, J.; et al. State of ex situ conservation of landrace groups of 25 major crops. Nat. Plants 2022, 8, 491–499. [Google Scholar] [CrossRef]
  2. Villa, T.; Maxted, N.; Scholten, M.; Ford-Lloyd, B. Defining and identifying crop landraces. Plant Genet. Resour. 2005, 3, 373–384. [Google Scholar] [CrossRef]
  3. Khoury, C.K.; Brush, S.; Costich, D.E.; Curry, H.A.; de Haan, S.; Engels, J.M.M.; Guarino, L.; Hoban, S.; Mercer, K.L.; Miller, A.J.; et al. Crop genetic erosion: Understanding and responding to loss of crop diversity. New Phytol. 2022, 233, 84–118. [Google Scholar] [CrossRef]
  4. Reem, H.; Toby, H. The use of wild relatives in crop improvement: A survey of developments over the last 20 years Euphytica. Neth. J. Plant Breed. 2007, 156, 1–13. [Google Scholar] [CrossRef]
  5. Tilman, D.; Clark, M. Global diets link environmental sustainability and human health. Nature 2014, 515, 518–522. [Google Scholar] [CrossRef] [PubMed]
  6. Mercer, K.L.; Perales, H.R. Evolutionary response of landraces to climate change in centers of crop diversity. Evol. Appl. 2010, 3, 480–493. [Google Scholar] [CrossRef] [PubMed]
  7. Casañas, F.; Simó, J.; Casals, J.; Prohens, J. Toward an evolved concept of landrace. Front. Plant Sci. 2017, 8, 145. [Google Scholar] [CrossRef]
  8. Frison, E.A.; Cherfas, J.; Hodgkin, T. Agricultural Biodiversity Is Essential for a Sustainable Improvement in Food and Nutrition Security. Sustainability 2011, 3, 238–253. [Google Scholar] [CrossRef]
  9. Wambugu, P.W.; Ndjiondjop, M.N.; Henry, R. Genetics and Genomics of African Rice (Oryza glaberrima Steud) Domestication. Rice 2021, 14, 6. [Google Scholar] [CrossRef]
  10. Chen, C.; He, W.; Nassirou, T.Y.; Nsabiyumva, A.; Dong, X.; Adedze, Y.M.N.; Jin, D. Molecular characterization and genetic diversity of different genotypes of Oryza sativa and Oryza glaberrima. Electron. J. Biotechnol. 2017, 30, 48–57. [Google Scholar] [CrossRef]
  11. Mir, R.A.; Sharma, A.; Mahajan, R. Crop Landraces: Present Threats and Opportunities for Conservation. In Rediscovery of Genetic and Genomic Resources for Future Food Security; Salgotra, R., Zargar, S., Eds.; Springer: Singapore, 2020. [Google Scholar] [CrossRef]
  12. B. Groombridge. Global Biodiversity: Status of the Earth’s Living Resources. A Report Compiled by the World Conservation Monitoring Centre. Geol. Mag. 1992, 132, 124. [Google Scholar] [CrossRef]
  13. Barbet-Massin, M.; Jiguet, F.; Albert, C.H.; Thuiller, W. Selecting pseudo-absences for species distribution models: How, where and how many? Methods Ecol. Evol. 2012, 3, 327–338. [Google Scholar] [CrossRef]
  14. Cao, B.; Bai, C.; Zhang, M.; Lu, Y.; Gao, P.; Yang, J.; Xue, Y.; Li, G. Future landscape of renewable fuel resources: Current and future conservation and utilization of main biofuel crops in China. Sci. Total Environ. 2022, 806, 150946. [Google Scholar] [CrossRef] [PubMed]
  15. Phillips, S.J.; Dudík, M. Modeling of species distributions with Maxent: New extensions and a comprehensive evaluation. Ecography 2008, 31, 161–175. [Google Scholar] [CrossRef]
  16. Cao, B.; Bai, C.; Wu, K.; Xue, Y.; Yang, J.; Gao, P.; Liang, H.; Li, G. Concentrated conservation and utilization: Four medicinal crops for diabetes treatment showed similar habitat distribution patterns in China. Ind. Crop. Prod. 2020, 152, 112478. [Google Scholar] [CrossRef]
  17. Cámara-Leret, R.; Raes, N.; Roehrdanz, P.; De Fretes, Y.; Heatubun, C.D.; Roeble, L.; Schuiteman, A.; Van Welzen, P.C.; Hannah, L. Climate change threatens New Guinea’s biocultural heritage. Sci. Adv. 2019, 5, eaaz1455. [Google Scholar] [CrossRef] [PubMed]
  18. Pironon, S.; Etherington, T.R.; Borrell, J.S.; Kühn, N.; Macias-Fauria, M.; Ondo, I.; Tovar, C.; Wilkin, P.; Willis, K.J. Potential adaptive strategies for 29 Sub-Saharan crops under future climate change. Nat. Clim. Chang. 2019, 9, 758–763. [Google Scholar] [CrossRef]
  19. Castañeda-Álvarez, N.P.; Khoury, C.K.; Achicanoy, H.A.; Bernau, V.; Dempewolf, H.; Eastwood, R.J.; Guarino, L.; Harker, R.H.; Jarvis, A.; Maxted, N.; et al. Global conservation priorities for crop wild relatives. Nat. Plants 2016, 2, 16022. [Google Scholar] [CrossRef]
  20. Khoury, C.K.; Carver, D.; Greene, S.L.; Williams, K.A.; Achicanoy, H.A.; Schori, M.; León, B.; Wiersema, J.H.; Frances, A. Crop wild relatives of the United States require urgent conservation action. Proc. Natl. Acad. Sci. USA 2020, 117, 33351–33357. [Google Scholar] [CrossRef]
  21. Phillips, S.J.; Anderson, R.P.; Dudík, M.; Schapire, R.E.; Blair, M.E. Opening the black box: An open-source release of Maxent. Ecography 2017, 40, 887–893. [Google Scholar] [CrossRef]
  22. Fick, S.E.; Hijmans, R.J. WorldClim 2: New 1-km spatial resolution climate surfaces for global land areas. Int. J. Climatol. 2017, 37, 4302–4315. [Google Scholar] [CrossRef]
  23. Title, P.O.; Bemmels, J.B. ENVIREM: An expanded set of bioclimatic and topographic variables increases flexibility and improves performance of ecological niche modeling. Ecography 2018, 41, 291–307. [Google Scholar] [CrossRef]
  24. Ramirez-Villegas, J.; Khoury, C.K.; Achicanoy, H.A.; Mendez, A.C.; Diaz, M.V.; Sosa, C.C.; Debouck, D.G.; Kehel, Z.; Guarino, L. A gap analysis modelling framework to prioritize collecting for ex situ conservation of crop landraces. Divers Distrib. 2020, 26, 730–742. [Google Scholar] [CrossRef]
  25. Choi, J.Y.; Purugganan, M. Multiple Origin but Single Domestication Led to Oryza sativa. G3 Genes|Genomes|Genet. 2018, 8, 797–803. [Google Scholar] [CrossRef] [PubMed]
  26. Choi, J.Y.; Zaidem, M.; Gutaker, R.; Dorph, K.; Singh, R.K.; Purugganan, M.D. The complex geography of domestication of the African rice Oryza glaberrima. PLoS Genet. 2019, 15, e1007414. [Google Scholar] [CrossRef]
  27. Garris, A.; Tai, T.; Coburn, J.; Kresovich, S.; McCouch, S. Genetic Structure and Diversity in Oryza sativa L. Genetics 2005, 169, 1631–1638. [Google Scholar] [CrossRef]
  28. Eyring, V.; Bony, S.; Meehl, G.A.; Senior, C.A.; Stevens, B.; Stouffer, R.J.; Taylor, K.E. Overview of the Coupled Model Intercomparison Project Phase 6 (CMIP6) experimental design and organization. Geosci. Model Dev. 2016, 9, 1937–1958. [Google Scholar] [CrossRef]
  29. Ho, T. A Data Complexity Analysis of Comparative Advantages of Decision Forest Constructors. Pattern Anal. Appl. 2002, 5, 102–112. [Google Scholar] [CrossRef]
  30. Reshef, D.; Reshef, Y.; Finucane, H.; Grossman, S.; McVean, G.; Turnbaugh, P.; Lander, E.; Mitzenmacher, M.; Sabeti, P. Detecting novel associations in large data sets. Science 2011, 334, 1518–1524. [Google Scholar] [CrossRef] [Green Version]
  31. Lavery, M.R.; Acharya, P.; Sivo, S.A.; Xu, L. Number of predictors and multicollinearity: What are their effects on error and bias in regression? Commun. Stat. -Simul. Comput. 2019, 48, 27–38. [Google Scholar] [CrossRef]
  32. Stanton, J.C.; Pearson, R.G.; Horning, N.; Ersts, P.; Reşit Akçakaya, H. Combining static and dynamic variables in species distribution models under climate change. Methods Ecol. Evol. 2012, 3, 349–357. [Google Scholar] [CrossRef]
  33. Vavilov, N.I. The centres of origin of cultivated plants. Works Appl. Bot. Plant Breed. 1926, 16, 1–248. [Google Scholar]
  34. McCouch, S.R.; Wright, M.H.; Tung, C.-W.; Maron, L.G.; McNally, K.L.; Fitzgerald, M.; Singh, N.; DeClerck, G.; Agosto-Perez, F.; Korniliev, P.; et al. Open access resources for genome-wide association mapping in rice. Nat. Commun. 2016, 7, 10532. [Google Scholar] [CrossRef] [PubMed]
  35. Wang, Y.; Wang, Y.; Sun, X.; Caiji, Z.; Yang, J.; Di Cui, D.; Cao, G.; Ma, X.; Han, B.; Xue, D.; et al. Influence of ethnic traditional cultures on genetic diversity of rice landraces under on-farm conservation in southwest China. J. Ethnobiol. Ethnomed. 2016, 12, 51. [Google Scholar] [CrossRef]
  36. Burke, M.B.; Lobell, D.B.; Guarino, L. Shifts in African crop climates by 2050, and the implications for crop improvement and genetic resources conservation. Glob. Environ. Chang. 2009, 19, 317–325. [Google Scholar] [CrossRef]
  37. Franzaring, J.; Holz, I.; Kauf, Z.; Fangmeier, A. Responses of the novel bioenergy plant species Sida hermaphrodita (L.) rusby and Silphium perfoliatum L. to CO2 fertilization at different temperatures and water supply. Biomass Bioenerg. 2015, 81, 574–583. [Google Scholar] [CrossRef]
  38. García, R.M.; Parra-Quijano, M.; Iriondo, J.M. A Multispecies Collecting Strategy for Crop Wild Relatives Based on Complementary Areas with a High Density of Ecogeographical Gaps. Crop Sci. 2017, 57, 1059–1069. [Google Scholar] [CrossRef]
  39. Yu, X.; Tao, X.; Liao, J.; Liu, S.; Xu, L.; Yuan, S.; Zhang, Z.; Wang, F.; Deng, N.; Huang, J.; et al. Predicting potential cultivation region and paddy area for ratoon rice production in China using Maxent model. Field Crops Res. 2022, 275, 108372. [Google Scholar] [CrossRef]
  40. Frieler, K.; Schauberger, B.; Arneth, A.; Balkovič, J.; Chryssanthacopoulos, J.; Deryng, D.; Elliott, J.; Folberth, C.; Khabarov, N.; Müller, C.; et al. Understanding the weather signal in national crop-yield variability. Earths Future 2017, 5, 605–616. [Google Scholar] [CrossRef] [PubMed]
  41. Feng, L.; Wang, H.; Ma, X.; Peng, H.; Shan, J. Modeling the current land suitability and future dynamics of global soybean cultivation under climate change scenarios. Field Crop. Res. 2021, 263, 108069. [Google Scholar] [CrossRef]
  42. Hanson, J.O.; Rhodes, J.R.; Riginos, C.; Fuller, R.A. Environmental and geographic variables are effective surrogates for genetic variation in conservation planning. Proc. Natl Acad. Sci. USA 2017, 114, 12755–12760. [Google Scholar] [CrossRef] [PubMed]
  43. Khoury, C.K.; Amariles, D.; Soto, J.S.; Diaz, M.V.; Sotelo, S.; Sosa, C.C.; Ramírez-Villegas, J.; Achicanoy, H.A.; Velásquez-Tibatá, J.; Guarino, L.; et al. Comprehensiveness of conservation of useful wild plants: An operational indicator for biodiversity and sustainable development targets. Ecol. Indic. 2019, 98, 420–429. [Google Scholar] [CrossRef]
  44. Winkler, K.; Fuchs, R.; Rounsevell, M.; Herold, M. Global land use changes are four times greater than previously estimated. Nat. Commun. 2021, 12, 2501. [Google Scholar] [CrossRef] [PubMed]
  45. Braunisch, V.; Coppes, J.; Arlettaz, R.; Suchant, R.; Schmid, H.; Bollmann, K. Selecting from correlated climate variables: A major source of uncertainty for predicting species distributions under climate change. Ecography 2013, 36, 971–983. [Google Scholar] [CrossRef]
  46. Grenouillet, G.; Buisson, L.; Casajus, N.; Lek, S. Ensemble modelling of species distribution: The effects of geographical and environmental ranges. Ecography 2011, 34, 9–17. [Google Scholar] [CrossRef]
  47. Franceschini, S.; Gandola, E.; Martinoli, M.; Tancioni, L.; Scardi, M. Cascaded neural networks improving fish species prediction accuracy: The role of the biotic information. Sci. Rep. 2018, 8, 4581. [Google Scholar] [CrossRef]
  48. Qin, Z.; Zhang, J.-E.; DiTommaso, A.; Wang, R.-L.; Wu, R.-S. Predicting invasions of Wedelia trilobata (L.) Hitchc. with Maxent and GARP models. J. Plant Res. 2015, 128, 763–775. [Google Scholar] [CrossRef]
  49. Luyssaert, S.; Jammet, M.; Stoy, P.C.; Estel, S.; Pongratz, J.; Ceschia, E.; Churkina, G.; Don, A.; Erb, K.; Ferlicoq, M.; et al. Land management and land-cover change have impacts of similar magnitude on surface temperature. Nat. Clim. Chang. 2014, 4, 389–393. [Google Scholar] [CrossRef] [Green Version]
Figure 1. (a) Correlation of 13 variables; (b) AUC with a single variable of ten-fold RLDMs, gray dots represent the AUC of each model fit with single variable and red dots represent the mean AUC of ten-fold RLDMs with single variable; (c) AUC of each rice landrace subgroup in ten-fold RLDMs, red dots represent the mean AUC and white dots represent the abnormal AUC; (d) Average ROC curve of each rice landrace subgroup in ten-fold RLDMs.
Sustainability 15 02765 g001
Figure 2. Large map (a)—predicted richness map of rice landrace subgroup distributions, combining eight potential distribution models. Different colors indicate the different number of rice landrace subgroups potentially overlapping in the same areas (~5 km2). Small maps (b)—predicted geographical distributions of each rice landrace subgroup, namely K2, K4, K5, and others of African rice, aromatic, aus, indica, and japonica of Asian rice.
Sustainability 15 02765 g002
Figure 3. Changing suitable areas of rice landrace under four future climate scenarios with ssp126 (a), ssp585 (b), ssp245 (c), and ssp370 (d) versus current conditions. Different colors indicate changes in the number of rice landrace subgroups potentially overlapping in the same areas (~5 km2).
Sustainability 15 02765 g003
Table 1. The predicted distribution area of each subgroup of rice landraces.
Crop Landrace SubgroupPredicted Distribution Area
Asian rice
(Oryza sativa L.)
aromaticCentral Pakistan, Nepal, Northeastern India, North Burma
ausCentral Pakistan, Northern and Northeastern India, Bangladesh, North Burma
indicaNortheastern India, Bangladesh, Laos, Cambodia, Southern Vietnam, Southern China
japonicaSoutheastern India, Southern Thailand, Southern Vietnam, Philippines, Southern and Central China, Korea
African rice
(Oryza glaberrima Steud.)
K2Northern Ghana, Northern Togo, Northern Benin, Central Nigeria
K4Gambia, Senegal, Guinea Peso, Southern Mali, Central Burkina Faso, Northern Nigeria
K5Guinea Peso, Western Guinea, Sierra Leone
othersSouthern Senegal, Guinea Peso, Sierra Leone, Northern Liberia, Eastern Nigeria
Disclaimer/Publisher’s Note: The statements, opinions and data contained in all publications are solely those of the individual author(s) and contributor(s) and not of MDPI and/or the editor(s). MDPI and/or the editor(s) disclaim responsibility for any injury to people or property resulting from any ideas, methods, instructions or products referred to in the content.

