Article

Enhancing Biogas Production of Co-Digested Cattle Manure with Grass Silage from a Local Farm in Landshut, Bavaria, through Chemical and Mechanical Pre-Treatment and Its Impact on Biogas Reactor Hydraulic Retention Time

by
Verónica Hidalgo-Sánchez
1,2,*,
Uwe Behmel
1,
Josef Hofmann
1 and
María Emma Borges
2,*
1
Department of Mechanical Engineering, University of Applied Sciences Landshut, 84036 Landshut, Germany
2
Department of Chemical Engineering, University of La Laguna, 38200 La Laguna, Spain
*
Authors to whom correspondence should be addressed.
Sustainability 2023, 15(3), 2582; https://doi.org/10.3390/su15032582
Submission received: 30 November 2022 / Revised: 15 January 2023 / Accepted: 19 January 2023 / Published: 31 January 2023

Abstract

:
Cattle manure usually contains a proportion of carbohydrates in the form of organic residues from incompletely digested feed and farm husbandry practices. These are not usually available for biogas production due to the long fermentation time. This paper investigates the optimal application of alkali, NaOH and KOH and mechanical pre-treatments to improve the degradation of the lignocellulosic content and the potential biogas yields from a local farm in Bavaria, Germany. Parameters such as temperature, pH, soluble chemical oxygen demand, organic acids, dry matter and volatile solids were analysed for this purpose. Alkali pre-treatments in 0.2, 0.1 and 0.05 M NaOH concentrations were tested in single mode and combined with shredding in batch experiments. The maximum increment of the soluble chemical oxygen demand during the pre-treatments took place during the first 50 h of experimentation, and it showed an improvement of 10,060.0 ± 8% mg/L s COD after the application of 0.2 M NaOH compared to the untreated substrate, which had an initial value of 2145.0 ± 8% mg/L s COD. Pre-treatments with 0.1 and 0.05 M NaOH concentrations showed similar s COD increments, with an additional 6860.0 ± 8% mg/L s COD and 8505.0 ± 8% mg/L s COD, respectively. The pH values varied strongly after the addition of the pre-treatment chemicals, with a continuous pH of 12 by 0.2 M NaOH during the 7 days of pre-treatment. Batch biogas experiments were done by applying 0.05 M NaOH and 0.05 M KOH pre-treatments in single mode and combined with shredding. The chemically pre-treated substrates showed a faster biogas production with an advantage of 18 days in comparison to the untreated cattle manure by a biogas yield of 350.0 NL/kg VS. All experiments were done under mesophilic conditions.

1. Introduction

According to the current energy politics in the European Union and the Federal Republic of Germany, one of the principal goals is the improvement of the circular economy and renewable sources in the energy supply. The recycling and re-utilisation of agricultural residues and animal manure in the form of biogas and liquid bio-methane/CNG as an active energy source in the fields of traffic, heating and cooling are an important part of the renewal energy mix planned for the time frame between 2030 and 2040. Additionally, the improvement of biogas efficiency systems and the leakage rate of digestate storage through the reduction of undesired methane losses is also considered to be an active measure to decrease greenhouse gas emissions [1].
Biogas and biomethane are versatile energy sources, as they are used to produce heat, electricity combined with heat through cogeneration systems or biofuel in the form of Power to X. Easy to store, they can contribute to the coverage of the energy supply without interruptions during the base loads of the energy demand.
The object of this research is to analyse the applicability of chemical and mechanical pre-treatment as widely used pre-treatments [2] to a farm substrate in situ and to evaluate the improvement of the biogas yields based on the fermentation of residues from the cattle husbandry from the farm. To aim for the economic viability of the application of these pre-treatments, a study applying different NaOH concentrations: 0.2, 0.1 and 0.05 M, was done. The mechanical pre-treatment was also solely applied according to the studies about the biogas yields improvements on dependency on the lignocellulose fibre length, to avoid unnecessary energy consumption during shredding of the substrate, as mechanical pre-treatments are considered uneconomical and costly [3].

1.1. Lignocelluloses

Lignocellulose is the fibrous material compound of cross-linked polysaccharides, glycosylated proteins and lignin, that forms the cell walls of plants [4,5]. The primary cell plant walls consist of cellulose, pectin and hemicellulose [6], in which the pectic matrix of polysaccharides entrenches the cellulose bundles together [7]. The secondary walls consist of cellulose, hemicellulose, lignin [6,8] and some proteins, terpenic oils, fatty acids/esters and inorganic materials, mainly based on N, P and K [9]. Hemicellulose and cellulose are available for fermentation to bioenergies after hydrolysis [10].
Figure 1 graphically represents the structure of lignocelluloses. Lignin, which consists of a three-dimensional polymer of propyl phenol, is embedded in and bound to the hemicellulose. It provides rigidity to the structure [9], tightness and resistance against microbial attacks and oxidative stress [11]. Cellulose, which consists of linear high molecular weight polymers of β-D-glucose connected by glycosidic bonds [12], is the main structural constituent in plant cell walls, and it is found in an organised fibrous structure [13]. Cellulose is present in crystalline and in amorphous configurations, which is more susceptible to enzymatic degradation [7]. Hemicellulose is composed of various 5- and 6-carbon sugars, such as arabinose, galactose, glucose, mannose and xylose [14]. The molecular chains of hemicellulose are much shorter than those of cellulose, which has side groups that consist of different sugars.
The composition of lignocellulose depends on the plant species, age and growth conditions [16]. Distribution of cellulose, hemicelluloses and lignin as well as the content of the different sugars of the hemicelluloses and/or the ratio of monomers in lignin vary significantly in different plants [13,17,18]. For example, hardwood contains greater amounts of cellulose, whereas wheat straw and leaves have more hemicellulose [4]. Table 1 shows the lignocellulosic composition of some common agricultural and energy crops.

1.2. Anaerobic Co-Digestion of Cattle Manure and Grass Silage

Agricultural residues like cattle manure and grass silage can be decomposed under anaerobic conditions into biogas and biomethane. Anaerobic digestion (AD) is an effective way to upgrade biological waste, producing energy in form of biogas. In addition, when animal manure is combined with biological substrates rich in carbon, like cereal straw, the digestate of the AD can be added to the soil of the farm as an important source of carbon and nutrients [27]. The AD also reduces the pathogens contained in the cattle manure [28] and its odour [27] as an additional advantage of the process. The AD of manure provides low biogas yields because the main energy content is removed during animal digestion [29]. Anaerobic digestion combining two or more raw substrates, co-digestion [30], is considered a way to improve the biogas yields, as the different substrates present positive synergism and complement nutrients [31], solving imbalanced nutrition, poor buffering capacity and ineffective microorganisms associated with mono digestion [29].

1.3. Pretreatments

The energy content of liquid manure, slurry and solid manure is low compared to corn silage, the common biogas substrate; therefore, the goal is to tap the energy content of lignocellulose. To accomplish this, it is necessary to make the lignocellulose structure accessible to the bacteria. This is not easy to achieve, as it has a special biological resistance, which hinders the energy recovery of lignocelluloses. The biodegradability and recalcitrance of lignocellulosic biomass can be influenced by several structural and compositional properties. These include the crystallinity of the cellulose, the available surface area for access to biologically active agents, the degree of cellulose polymerisation, the presence of lignin and hemicellulose, as well as the degree of hemicellulose acetylation [19]. The purpose of pre-treatment is to alter these properties to improve the accessibility of the biomass to enzymes as well as bacteria and enable a revalorisation of the lignocelluloses [10,32] during the first step of the biogas process; the hydrolysis. Hydrolysis is considered the limiting step, as it requires long periods [33], so the applied pre-treatments increase the typical yields of biogas production by improving the hydrolysis during AD.
There are many different types of biological, physical and chemical pre-treatments. Considering the applicability of pre-treatments in large-scale projects, the chemical pre-treatment seems to have advantages compared to other methods, as it is easy to handle, the chemicals are accessible, and it is an effective method [34]. Furthermore, chemical pre-treatments are well-known methods for the first extraction of cellulose and hemicellulose for biomaterials, biochemicals and bioenergy [32]. Because of this greater accessibility and simpler and more manageable technologies in practice also for larger scale projects, chemical and mechanical pre-treatments have been selected and investigated in single and combined modes.

1.3.1. Mechanical Pretreatment

Mechanical pre-treatment is effective for the reduction of particle size, which increases the available specific surface for biological activity during AD. Mechanical pre-treatments enable a decrystallisation of cellulose [10], and the substrate’s water retention capacity and viscosity also improve [35]. As a consequence, there is an increase in biogas production of up to 25% from mechanically pre-treated lignocellulosic silage materials [35].
Bruni et al., reported an improvement of the biological methane potential in mL CH4/g VS of 8% for a fibre size reduction of up to 2 mm [36]. These increments vary depending on the type of substrate, the kind of mechanical pre-treatment, as well as the duration and energy consumption during the pre-treatment.

1.3.2. Chemical Pretreatment

Chemical pre-treatments relate to the application of chemicals, e.g., alkalis, acids, oxidising agents, organic solvents or ionic liquids [16]. Pang et al., showed improvement of the biogas yield up to 48.5% in corn stover pre-treated with 6% NaOH [34]. Pre-treated corn stover with 2% NaOH (w/w) co-digested with cattle manure results in 25.4 to 32.01% higher methane yields, compared to untreated substrates [37]. Some studies suggest an improvement of the total biogas production by 45% with wheat straw pre-treated with 6% KOH [23]. Bruni et al., show an improvement of the methane yield per gram VS of 59% by pre-treating the digested manure biofibres with 6% CaO [36], with the advantage that the dissociated Ca2+ ions have a lower inhibition effect during the biogas production than the K+ and the Na+ ions [38]. Two chemicals in three different concentrations were applied for this study: NaOH and KOH.

2. Materials and Methods

2.1. Substrate and Inoculum

The substrate was analysed directly after its collection in a local farm near the university in Landshut. It consisted of a matrix of solid cattle manure and grass silage fibres from animal feeding and bedding. The grass silage was stored once a year after harvesting and used on demand. Before storage, a mill cuts the grass fibres down to an average fibre length of 2 mm.
The inoculum was acquired from a local biogas plant in Buch am Erlbach, Bavaria, Germany, from a biogas plant containing two reactors. The applied inoculum was obtained after 120 days of anaerobic digestion, going once through a first hydrolytic reactor and a second anaerobic main reactor. The regular input substrates of the biogas plant were cattle manure, corn, whole crop silage, grass silage and sugar beet.

2.2. Pretreatment and Gas Fermentation: Experimental Conditions and Analyzed Parameters

Two pre-treatment studies were done to investigate the optimal chemical and mechanical pre-treatment duration. The first study considered one week for the pre-treatment. After the first study, and according to the obtained results, the second study considered a pre-treatment time of 3 days. The anaerobic digestion of the pre-treated materials from the second study was set directly after the pre-treatment experiments for 60 days. Both phases of the experiment ran under batch and mesophilic conditions at a constant incubator temperature of 37 ± 1 °C and under the continuous effect of an Edmund Bühler SM 30B agitator.
The alkali NaOH and KOH, as well as the mechanical (shredding) pre-treatments, took place in gas-tight 2-L HDPE vessels. The pH was adjusted after the chemical pre-treatments with a 10% (w/w) HCl solution to ensure an adequate pH range from 5 to 8.5 for the AD microorganisms [2]. After that the pH adjustment, the anaerobic biogas experiments were carried out in gas-tight 1-L Xylem MF/1000 digesters equipped with WTW OxyTop®-IDS pressure sensors for biogas applications. The pressure sensors were connected via Bluetooth® to a Xylem Multi 3620 data logger for the monitoring and logging of the pressure variation during the biogas production with ±1% of measurement accuracy within a pressure range from 500 to 1500 hPa. To avoid biological inhibition during the fermentation, the 1-L digesters were depressurised each time 350 hPa was reached [39].
The sample´s temperature and pH were measured using a Hach HQ40d portable meter. According to the real operation parameter of dry matter (DM), the pre-treatment, and the gas experiments were filled with a batch of 450 mL at a loading rate of 8% dry matter (DM). The inoculum was added following the rate stipulated in VDI 4630.
The soluble chemical oxygen demand (s COD) and the equivalent organic acids were analysed using a Hach DR3900 spectrophotometer and Hach LCK cuvette tests after centrifuging the probes at 8000 RPM for 10 min with a Hettich EBA 200 centrifuge. Mechanical pre-treatment consisting of shredding was carried out with a Brown 7 MQ 7000X food industry hand blender. Sodium hydroxide and potassium hydroxide were applied in 50% (w/w) solutions manufactured by Roth. DM and volatile solids (VS) were determined according to the DIN EN 15935.
Temperature, pH, s COD and equivalent organic acids were analysed at the beginning of the pre-treatment, after the pre-treatment and at the beginning and the end of the batch biogas experiments. Once the batch biogas experiment was finished, the gas composition was also analysed by a Thermo Scientific Trace™, Waltham, MA, USA, 1310 gas chromatograph.

3. Results

3.1. Substrate

Throughout the year, the cattle manure dry matter varied from 16% to 24%, depending on rainfall and air humidity, ambient temperature and feeding as well as bedding grass silage quality and amount. During the weeks with higher ambient temperatures and less rain, concentrations of up to 24% DM were found, and in the cold and wet months, the cattle manure had low concentrations of up to 16% DM.
Table 2 shows the composition of the substrate, cattle manure mixed with lignocelluloses, during the winter. The exposed cattle manure in Table 2 contains 35.2% of hemicellulose and cellulose in dry matter, which results in a higher biogas yield after pre-treatment.

3.2. Study of the Effect of Mechanical Pre-Treatment before Shredding and Chemical NaOH Pre-Treatment

The main parameter analysed for evaluation of the pre-treatment efficiency and its effect on the lignocellulosic matrix contained in the cattle manure was the s COD. It provides information about the dissolved organic material and about the degree of oxidation of the carbon particles contained in the substrate and thus about the energy content, but this is not an exact parameter, as 3 to 10% of these carbon atoms are used for microbiological cell growth. There are also other compounds like nitrites, bromides, iodides, metal ions and sulphur compounds, which can also be oxidised and therefore affect the measurements [40,41,42].
Figure 2 shows a schematic display of the 1-L experiment vessels in the incubator. The experiment consists of four sequences; 1, 2, 3 and 4. Each sequence is repeated three times, with vessels 1.1, 1.2 and 1.3 and their equivalents with the other sequences.
Table 3 shows the experiment´s parameters and which kind of pre-treatment was applied per experimental sequence. Sequence 1 is done without any pre-treatment. Sequence 2 is with chemical pre-treatment. Sequence 3 is mechanically pre-treated. Sequence 4 is with chemical and mechanical pre-treatment. Table 3 also illustrates the energy input per shredding pre-treatment and the average cattle manure weight per sequence. The experiment took place for seven days under a constant temperature of 37 ± 1 °C.
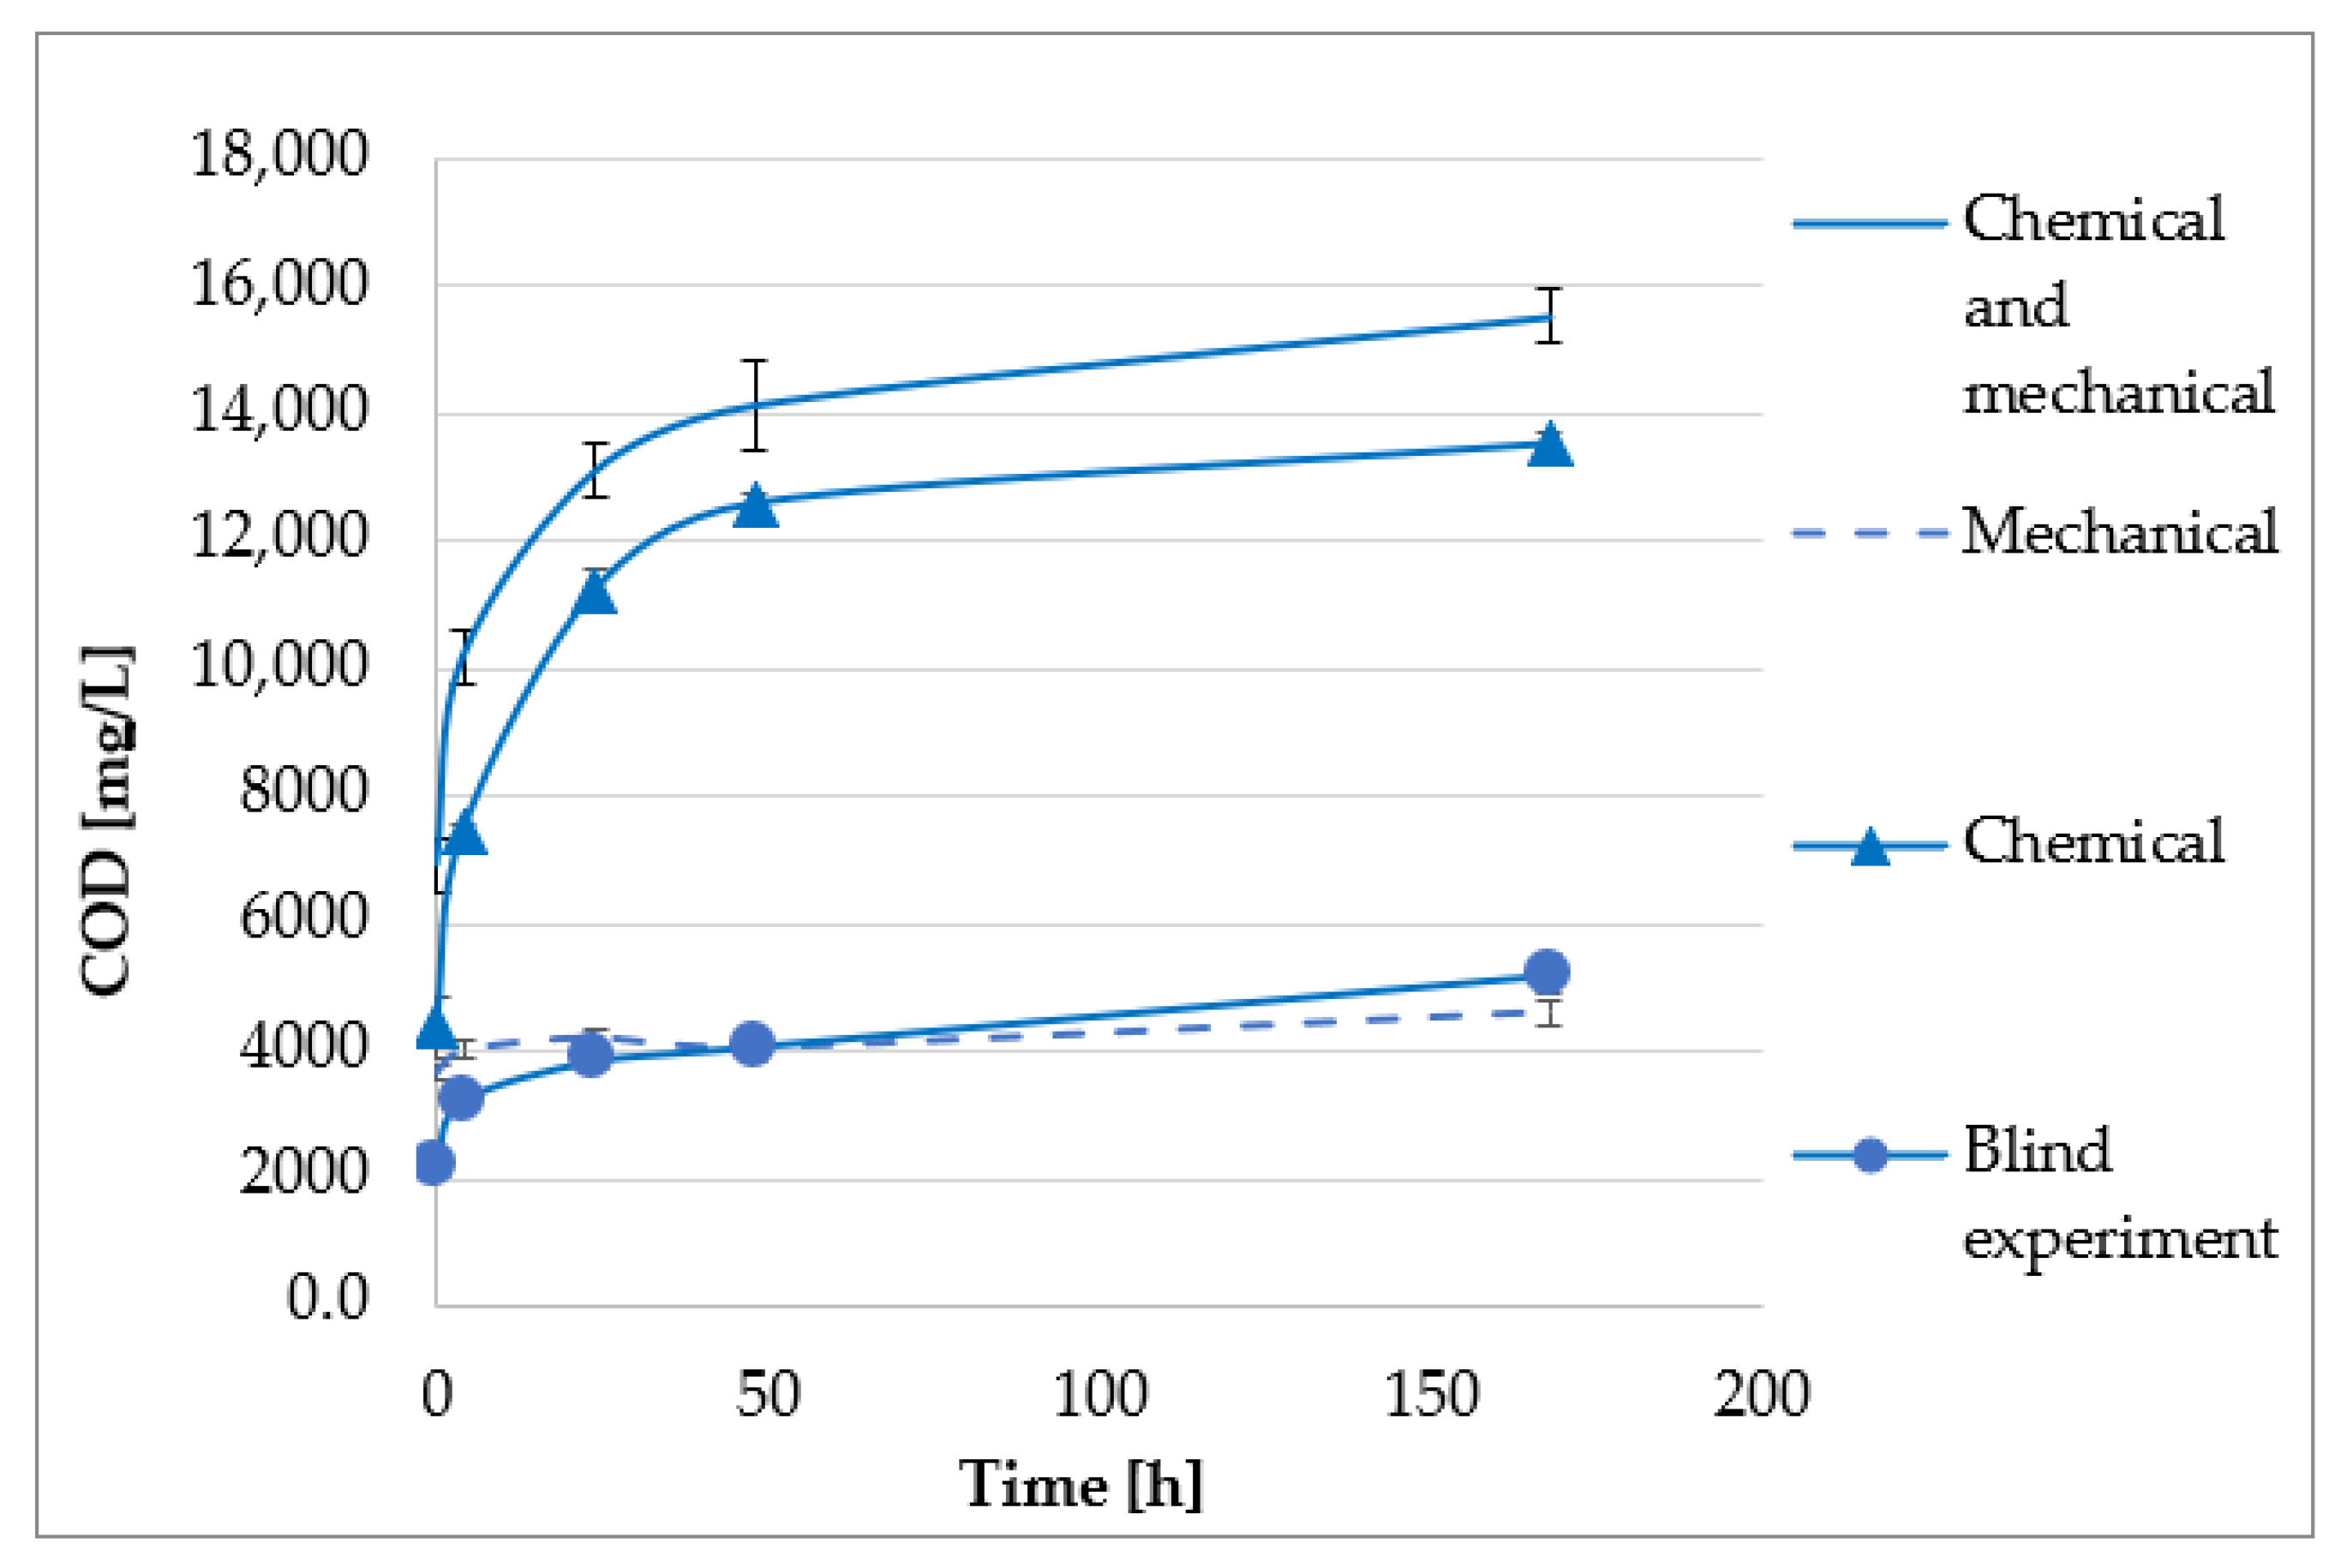
This initial study confirms a considerable increase of the s COD by the application of 0.2 M-NaOH solution, with an increase of up to 160% of the s COD compared to the untreated cattle manure. The combination of chemical and mechanical pre-treatments by shredding the cattle manure provides an additional increase of 30% of the s COD. Figure 3 shows the resulting increment of the s COD among the pre-treatments. The applied energy during the shredding was 0.154 Wh/g DM. The samples had 18.20 ± 1.33% g DM and a total of 16.03 ± 1.14% g VS. The highest increase in the s COD took place during the first 50 h of pre-treatment. This allowed the adjustment of the HRT of the hydrolysis process to 50 h, and in consequence, the dimensioning of the hydrolysis reactor volume in case of an application in higher-scale facilities.
According to the literature, shredding the cattle manure also provides the solubilisation of lignocelluloses producing an s COD increment. The low s COD improvement shown in Figure 3 in the mechanically pre-treated vessels 3.1, 3.2 and 3.3 is most likely the result of lower amounts of lignocellulose in the cattle manure and from the low energy consumption and short duration of shredding.
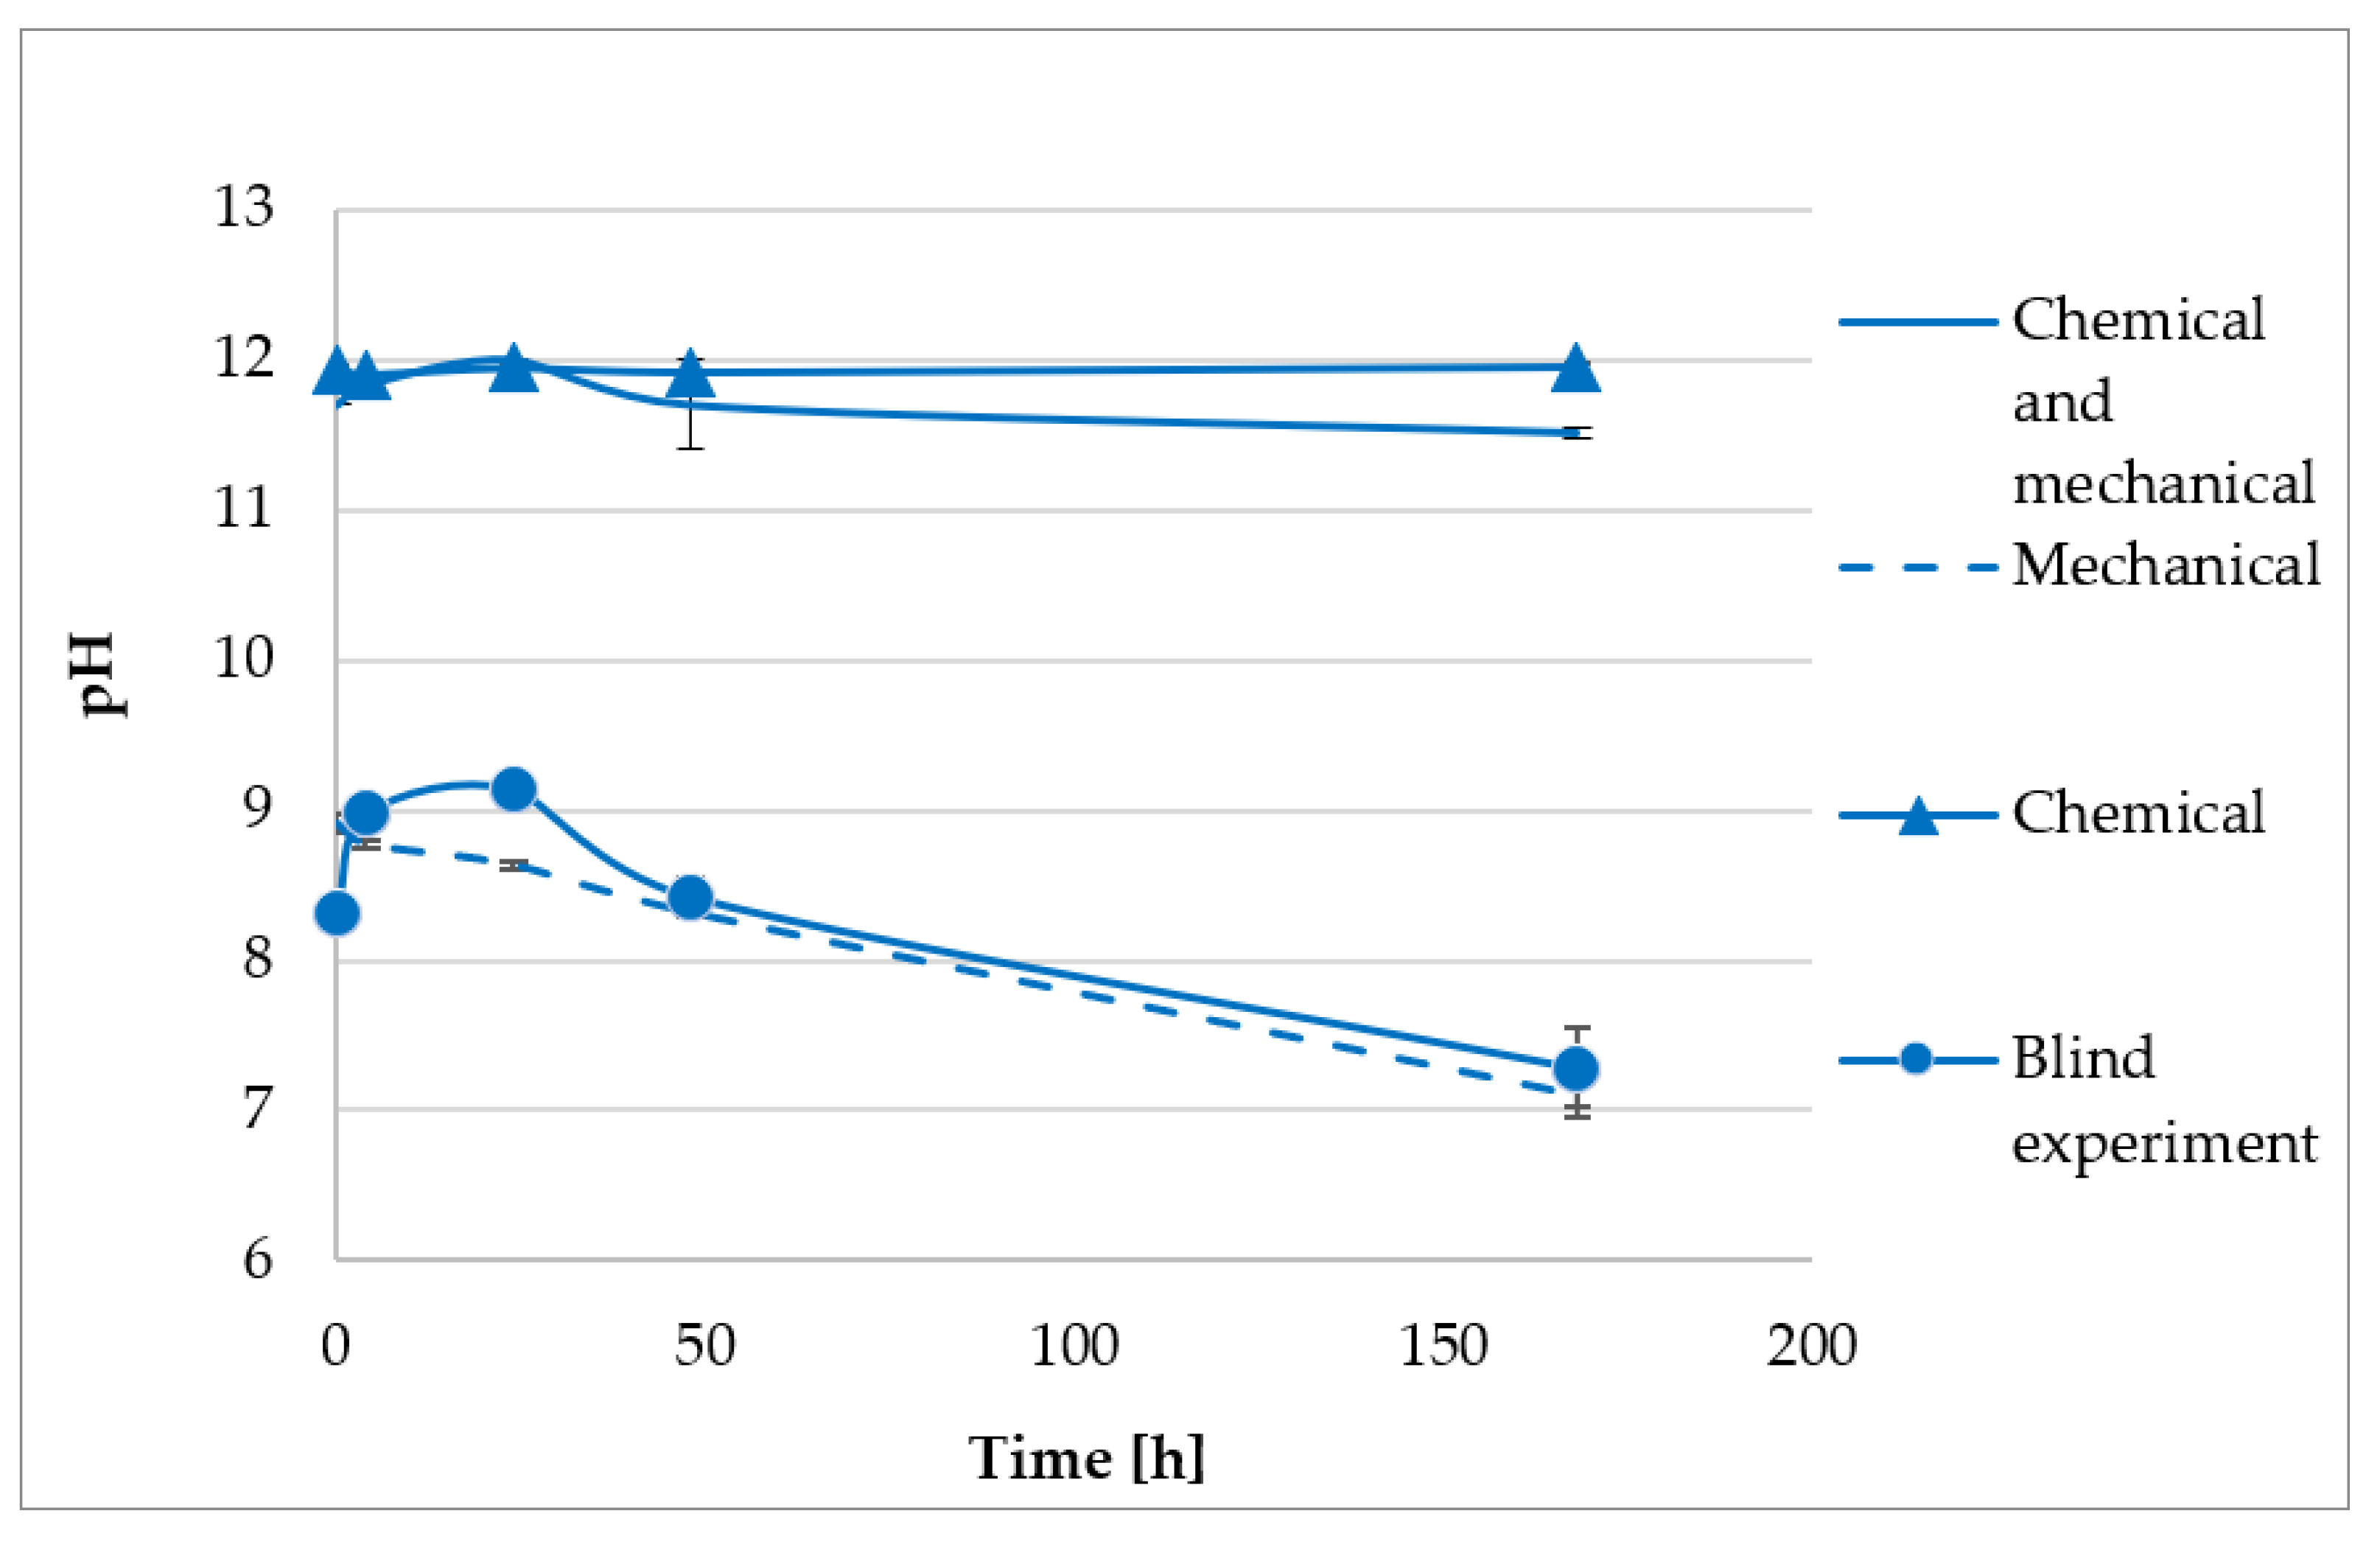
Figure 4 shows the pH variations during the experiment. In the chemical pre-treatment vessels 2.1, 2.2 and 2.3, the average pH remained at 12 without any buffering effect from the cattle manure. At this NaOH concentration, a pH regulation before the gas fermentation is necessary to provide the appropriate pH for the biology of the biogas process. In the experiment sets without chemical pre-treatments, vessels 1.1, 1.2, 1.3 and 3.1, 3.2, 3.3 showed a decrease of the pH from values between 8.5 and 8.9 to 7.3 and 7.1. It can be assumed that in the samples without chemical treatment biological activity, the pH decreases because of initial acidogenesis.
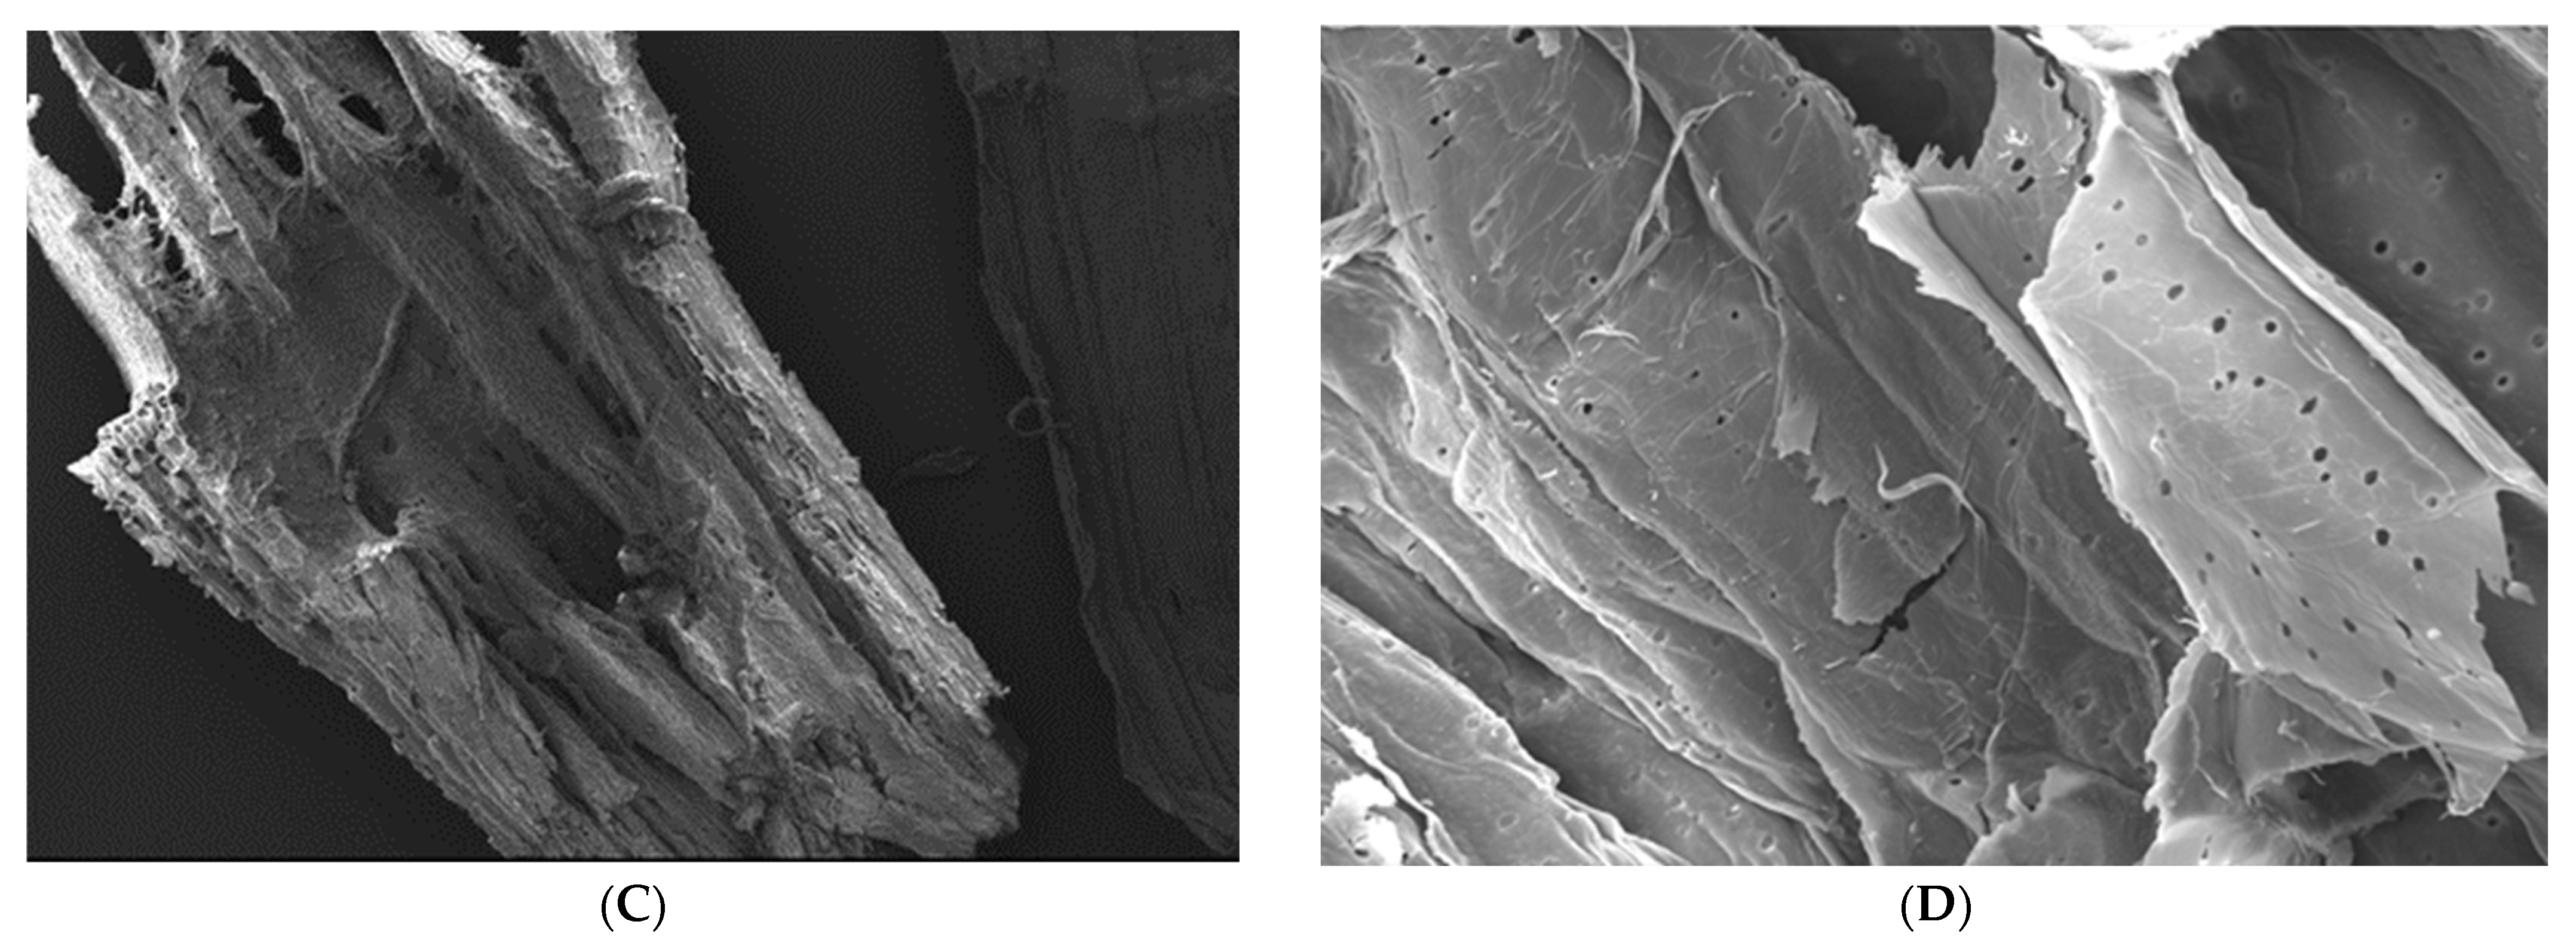
Figure 5A,B are SEM images of untreated straw. In Figure 5C,D, it is possible to observe slight damage in the straw surface after applying the 0.2 M NaOH chemical pre-treatment. This slight damage to the lignocellulosic structures provides a higher surface and consequently, better biological accessibility to the hemicelluloses for the fermentation to biogas.

3.3. Experiments Reproducibility

The experiment shown in Table 3 has been repeated three times each to explore the reproducibility of the experimentation. Due to the cattle manure inhomogeneity, possible variations in the composition of up to 20% are allowed [42] within the same cattle manure batch. The composition of cattle manure also varies over a year due to different weather, temperature, humidity and seasonal grass harvest.
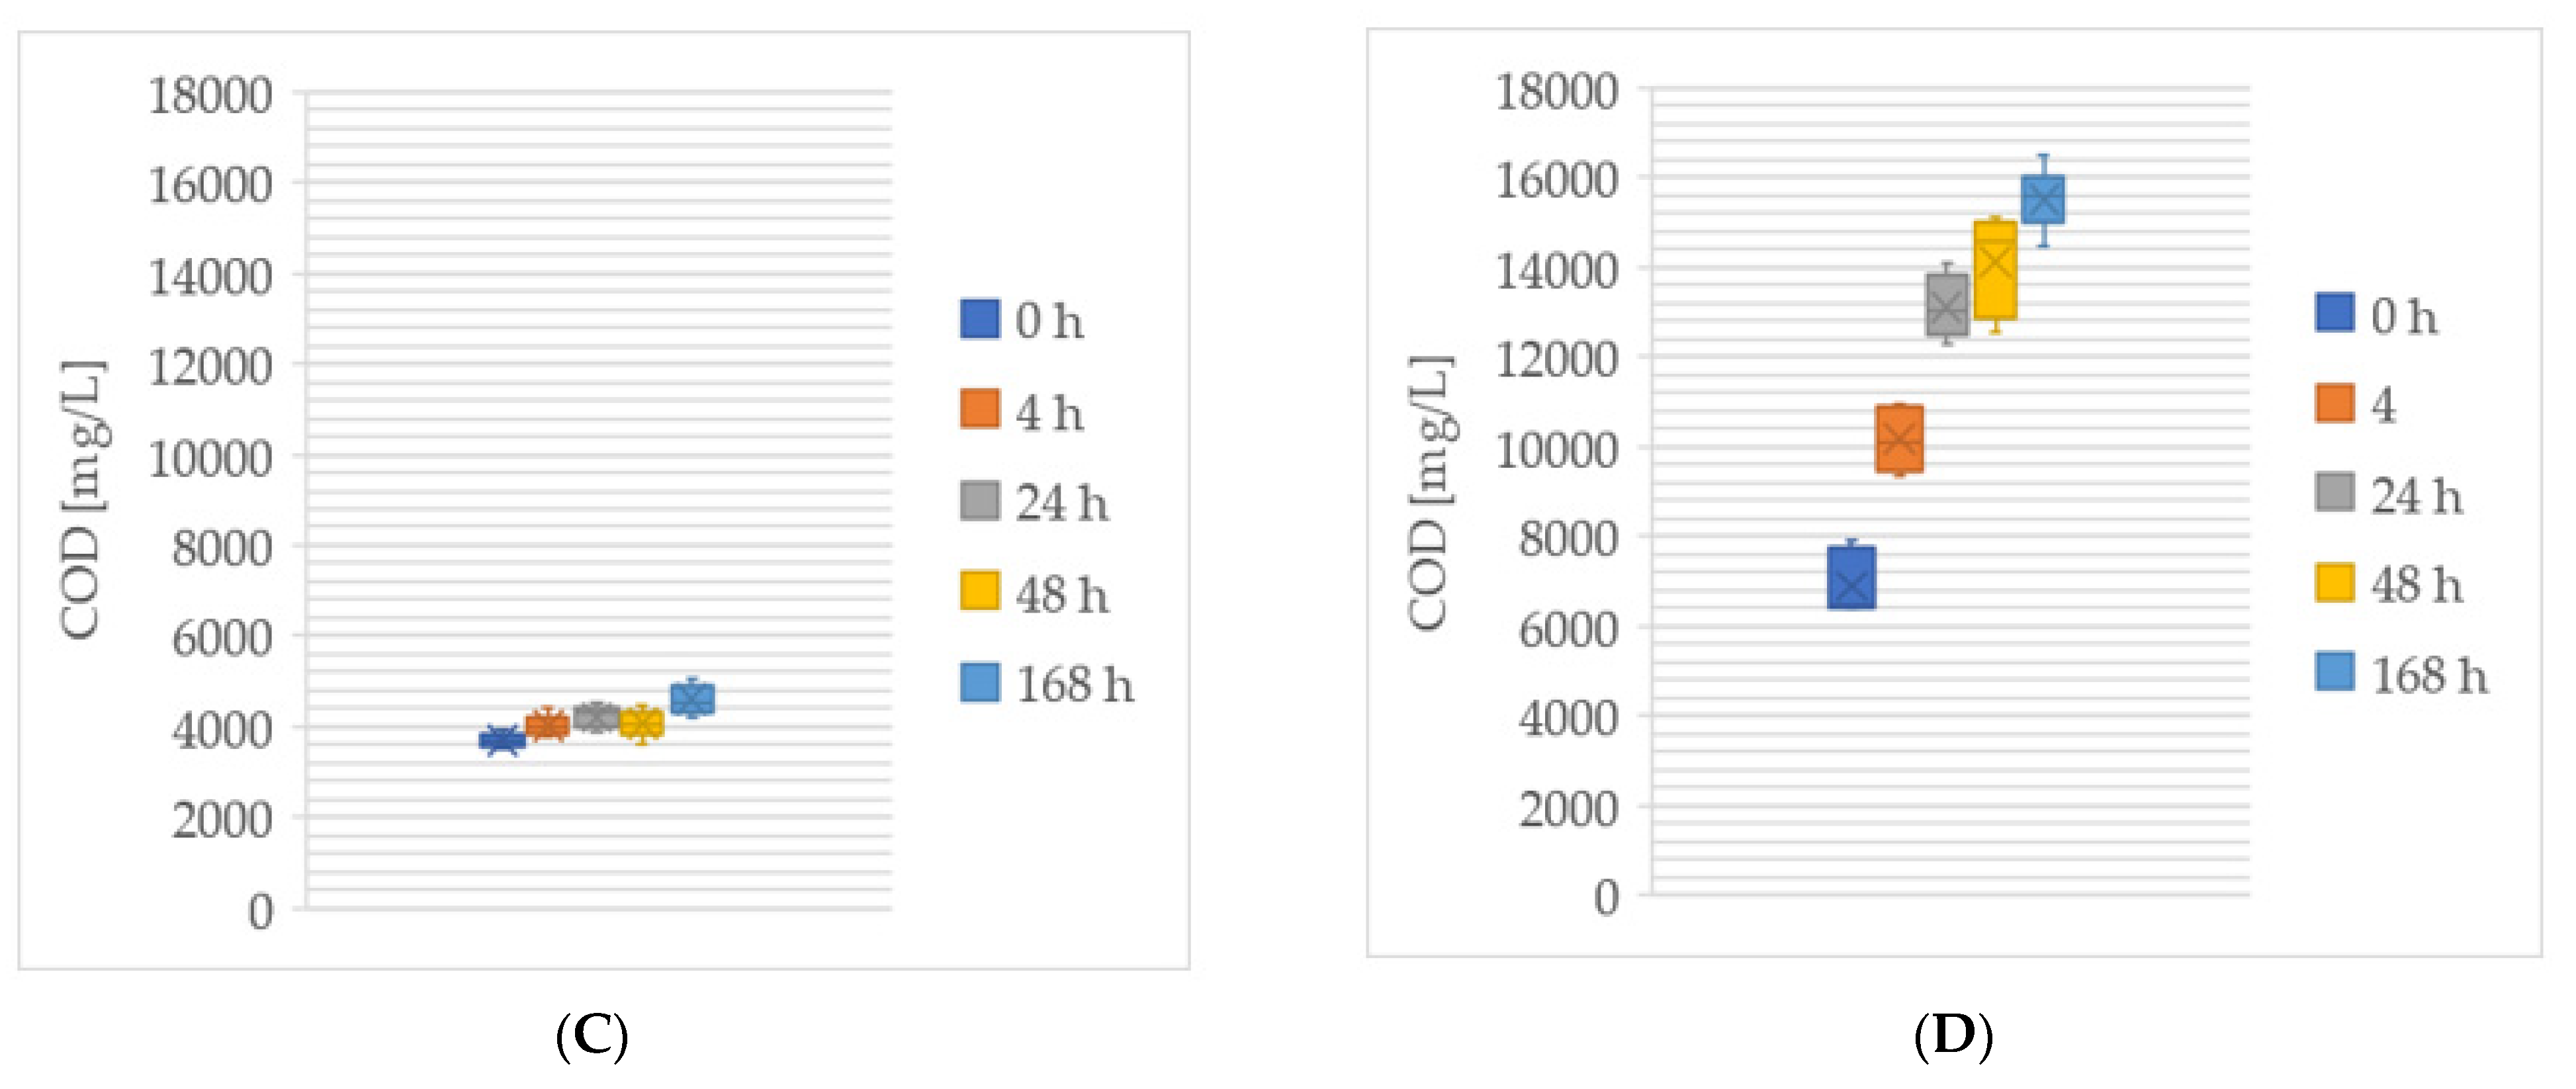
A resulting cattle manure DM of 19% and 80% for the VS has also shown good reproducibility with errors of less than ±1% within the same sample with a CI = 95%. The sample collection was according to the recommendations of the LfL for agricultural fertilisers [43]. The pH and the s COD repetitions also put out a maximum error rate of 8% by a CI = 95%.
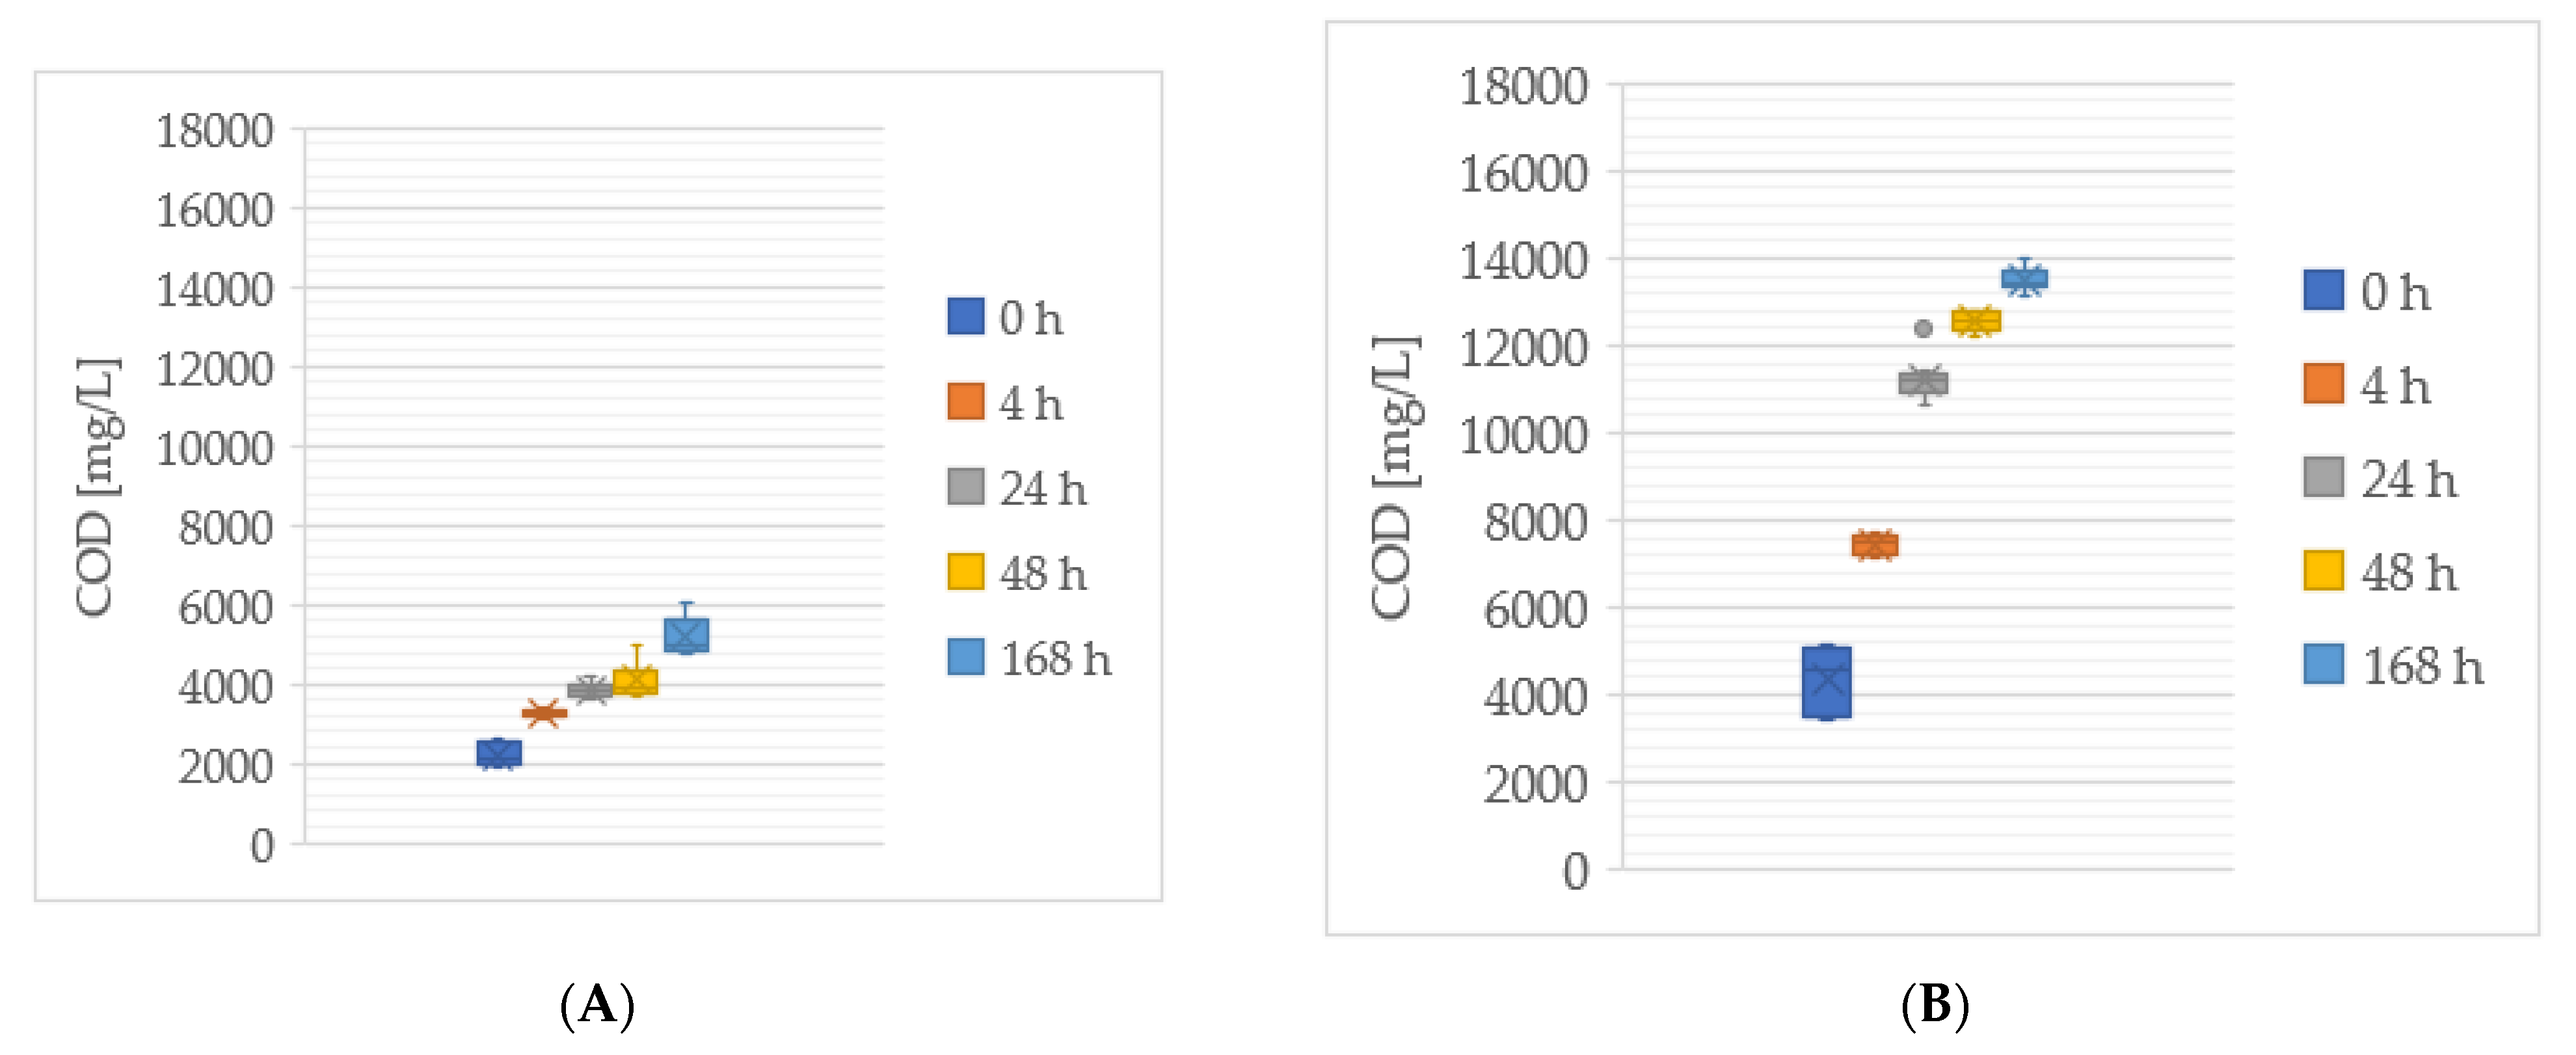
Figure 6 shows the numerical spreading of the s COD measurement repetitions over the digestion time of 7 days.

3.4. Study of the Effect of NaOH Concentration on the Chemical Pretreatment with Mechanical Shredding

Looking for the most efficient cost-effect-relation for the pre-treatment, three different NaOH concentrations and their resulting s COD increases during the pre-treatment were investigated: 0.2, 0.1 and 0.05 M. The duration of shredding pre-treatment was selected according to empirical laboratory experiments, which showed a resulting maximal fibre length of 5 cm according to Ferreira et al. [44], who found higher methane production in order of 10.4% by milling wet straw to fibre lengths of 3–5 mm. The corresponding energy consumption of the shredding procedure was 5.55 Wh or 27,703.0 kWh/t cattle manure with a DM of 26.85 ± 2.42%, which corresponded to 0.10 Wh/g DM.
Table 4 shows the experimental parameters of this study. The three chemical concentrations were tested in single mode and combined with mechanical shredding pre-treatment. There were also three blind tests: A.1, B.1 and C.1.
Figure 7 displays the s COD difference after running the experiment for 24 h and 48 h. According to Table 4, A.1 is without chemical or mechanical (shredding) pre-treatment. A.2 is with 0.2 M NaOH chemical pre-treatment. A.3 is with mechanical pre-treatment. A.4 is with both pre-treatments with a chemical concentration of 0.2 M NaOH. The experiment series B and C are similar, but with chemical concentrations of 0.1 M and 0.05 M NaOH, respectively. The highest s COD increase is presented after 48 h of 0.2 M NaOH pre-treatment, with an increment of 10,060 ± 8% mg/L compared to the untreated substrate, with 2145 ± 8% mg/L s COD. It is also possible to observe that combining shredding with 0.1 M and 0.05 M NaOH produces similar s COD increments, with an additional 6860 ± 8% mg/L s COD in the case of 0.1 M and 8505 ± 8% mg/L s COD in the case of 0.05 M. To optimise the economic efficiency for possible applications at higher scales, the concentration of 0.05 M was selected for further experimentation. Figure 7 also illustrates how the effect of the shredding was almost imperceptible, probably due to the short pre-treatment time and low pre-treatment duration, with an energy consumption of 0.10 Wh/g DM.

3.5. Study of Biogas Production with Mechanical and Chemical NaOH and KOH Pretreatments

Biogas production was also investigated by applying the results of the pre-treatment studies. Six samples were chemically pre-treated with 0.05 M NaOH and 0.05 M KOH to compare the effect of KOH vs. NaOH and in combination with shredding by the same energy consumption of 0.10 Wh/g DM. After the pre-treatment, the anaerobic fermentation was immediately started and ran over sixty days.
The biogas setup consisted of seven batches, including a batch with a blind non-pre-treated substrate and one batch with just inoculum. To evaluate the entire process from the pre-treatment to the biogas fermentation, the biogas yields, the pH, s COD, the total organic acids and the final biogas composition have been analysed.
Table 5 illustrates the experimentation parameters for the gas fermentation of each batch. The experiment was done following VDI 4630 [42], and it was run at constant temperature conditions of 37 °C ± 1 °C and under the effect of a shaker.
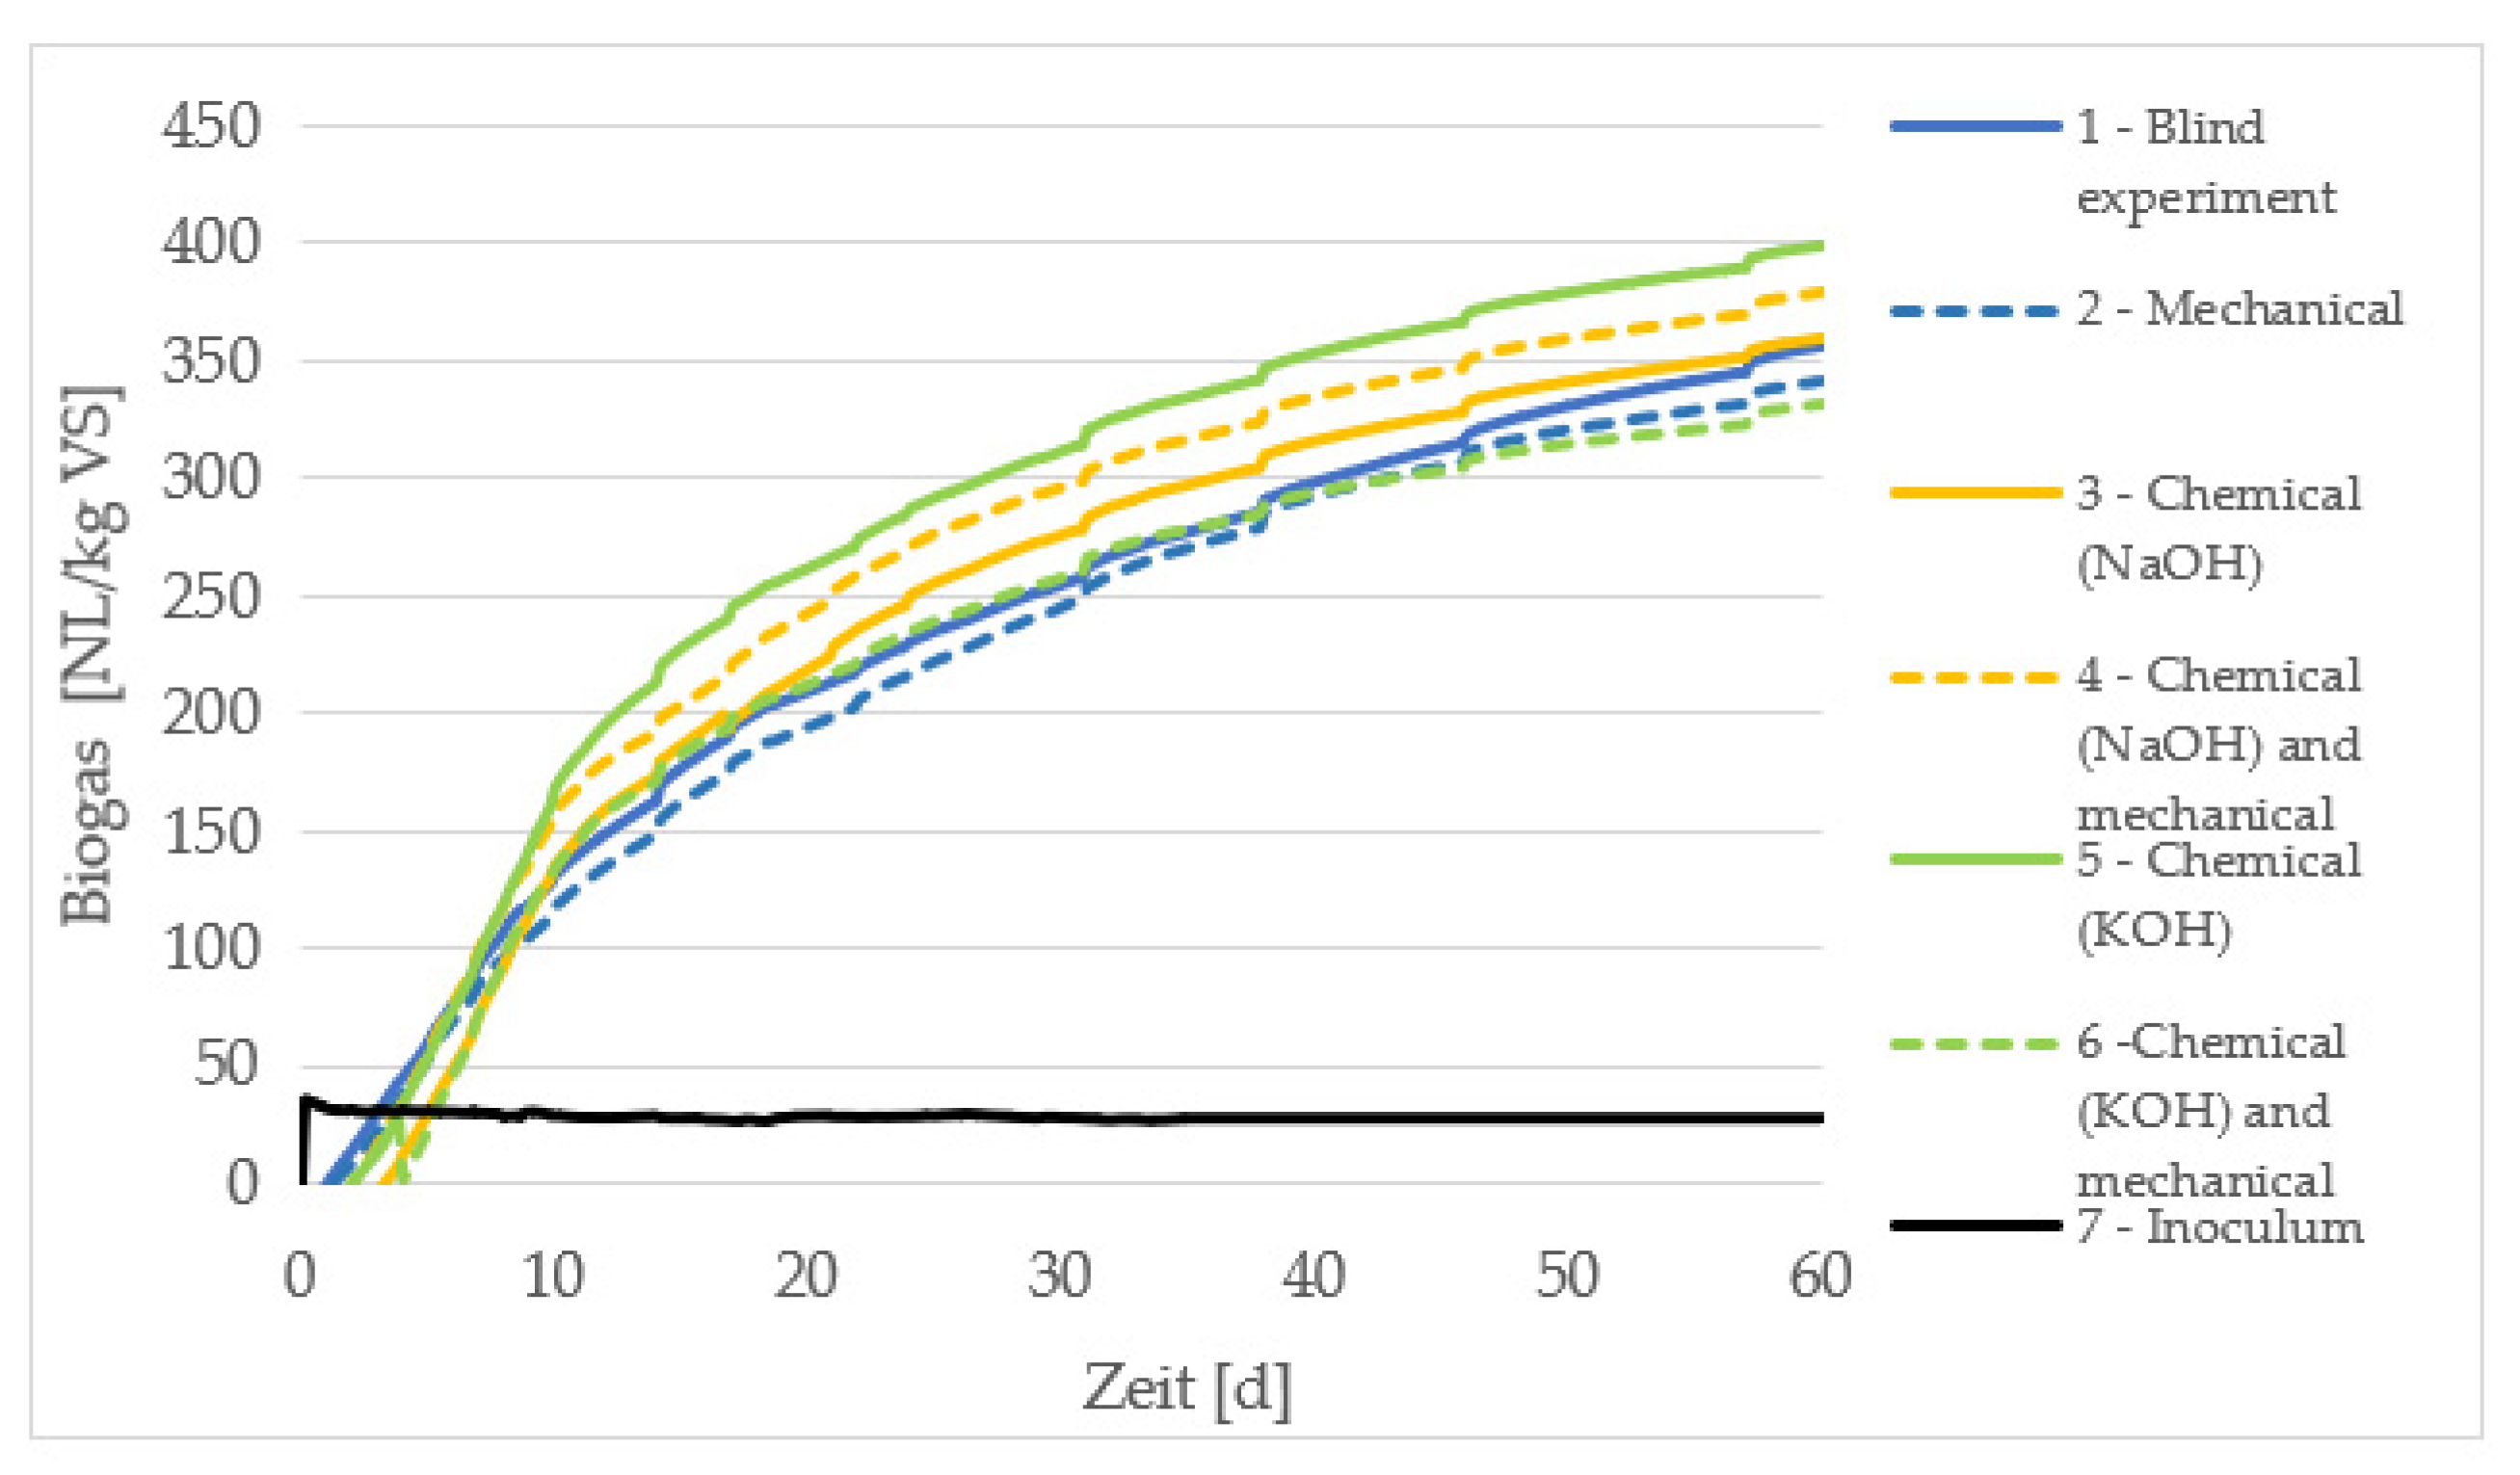
Figure 8 shows the specific produced biogas rate in NL per kg of VS. At the end of the experiment, the accumulated biogas production rates do not fluctuate significantly between the different pre-treatment methods, with a tendency of approximation. Notably, the chemically pre-treated batches 3,4 and 5 show faster biogas production at the beginning of the anaerobic digestion, due to the already largely hydrolysed lignocellulosic materials. This fact allows shorter retention times in the biogas reactor, having an impact on the plant’s scale and economic costs. Batch 5 pre-treated with 0.05 M KOH shows the highest biogas production rate and reaches the same biogas output 18 days earlier than the untreated batch 1 by 350 NL/kg VS; pre-treated batch 5 reaches this specific biogas rate at 39 days, and the non-pre-treated batch (1) reached the same biogas yield at 57 days. After 60 days, the biogas production rate differed between batches 1 and 5 by 11%, and they differed by 22% after 27 days of fermentation, so both biogas amounts converge in production at the same time. Batch 6 should present higher biogas yields, similar to the other chemical pre-treated batches, but the resulting lower biogas production during this experiment could be the result of lower fibre content in the batch.
According to Henry’s law, higher amounts of CO2 are absorbed in the aqueous phase during the biogas process at higher pressure levels [38]. After purging the setups during the biogas batch experiment, the absorbed CO2 in the aqueous phase is released, producing the peaks shown in the graphs of Figure 8.
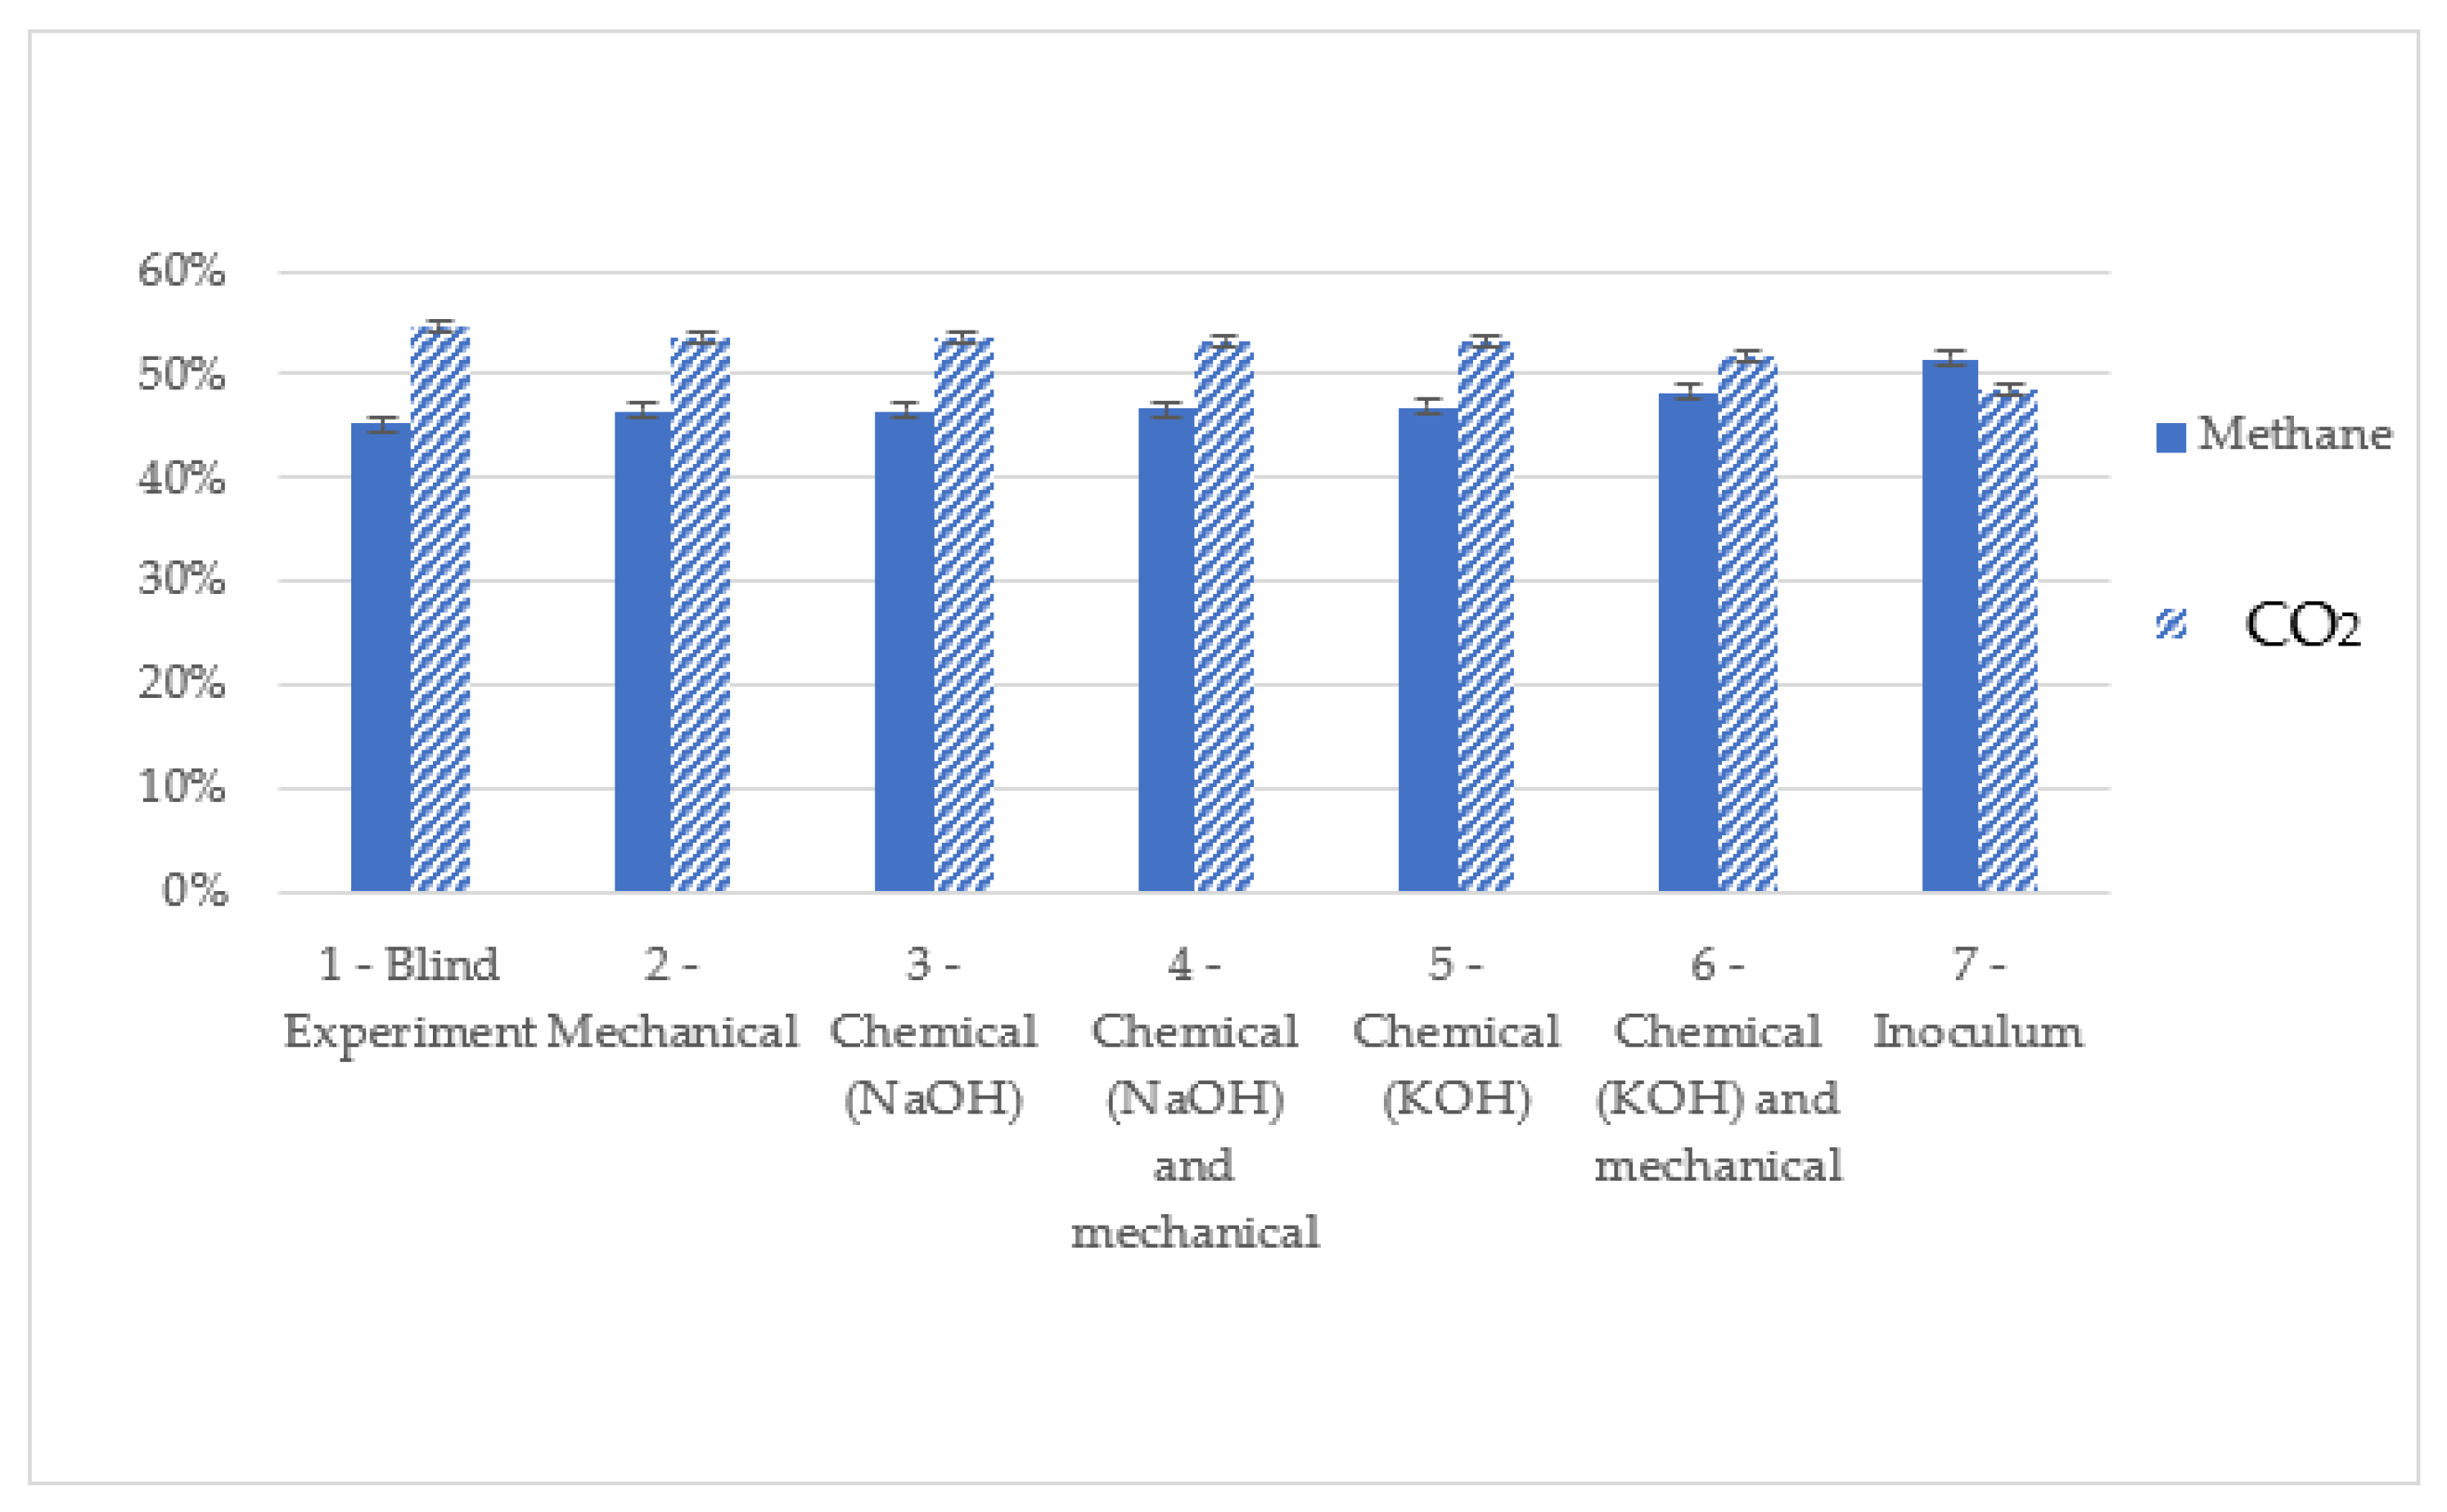
Figure 9 shows the gas composition after 60 days of experimentation. Almost all the sets present a slightly higher concentration of carbon dioxide than methane, with methane amounts between 45 and 51%.
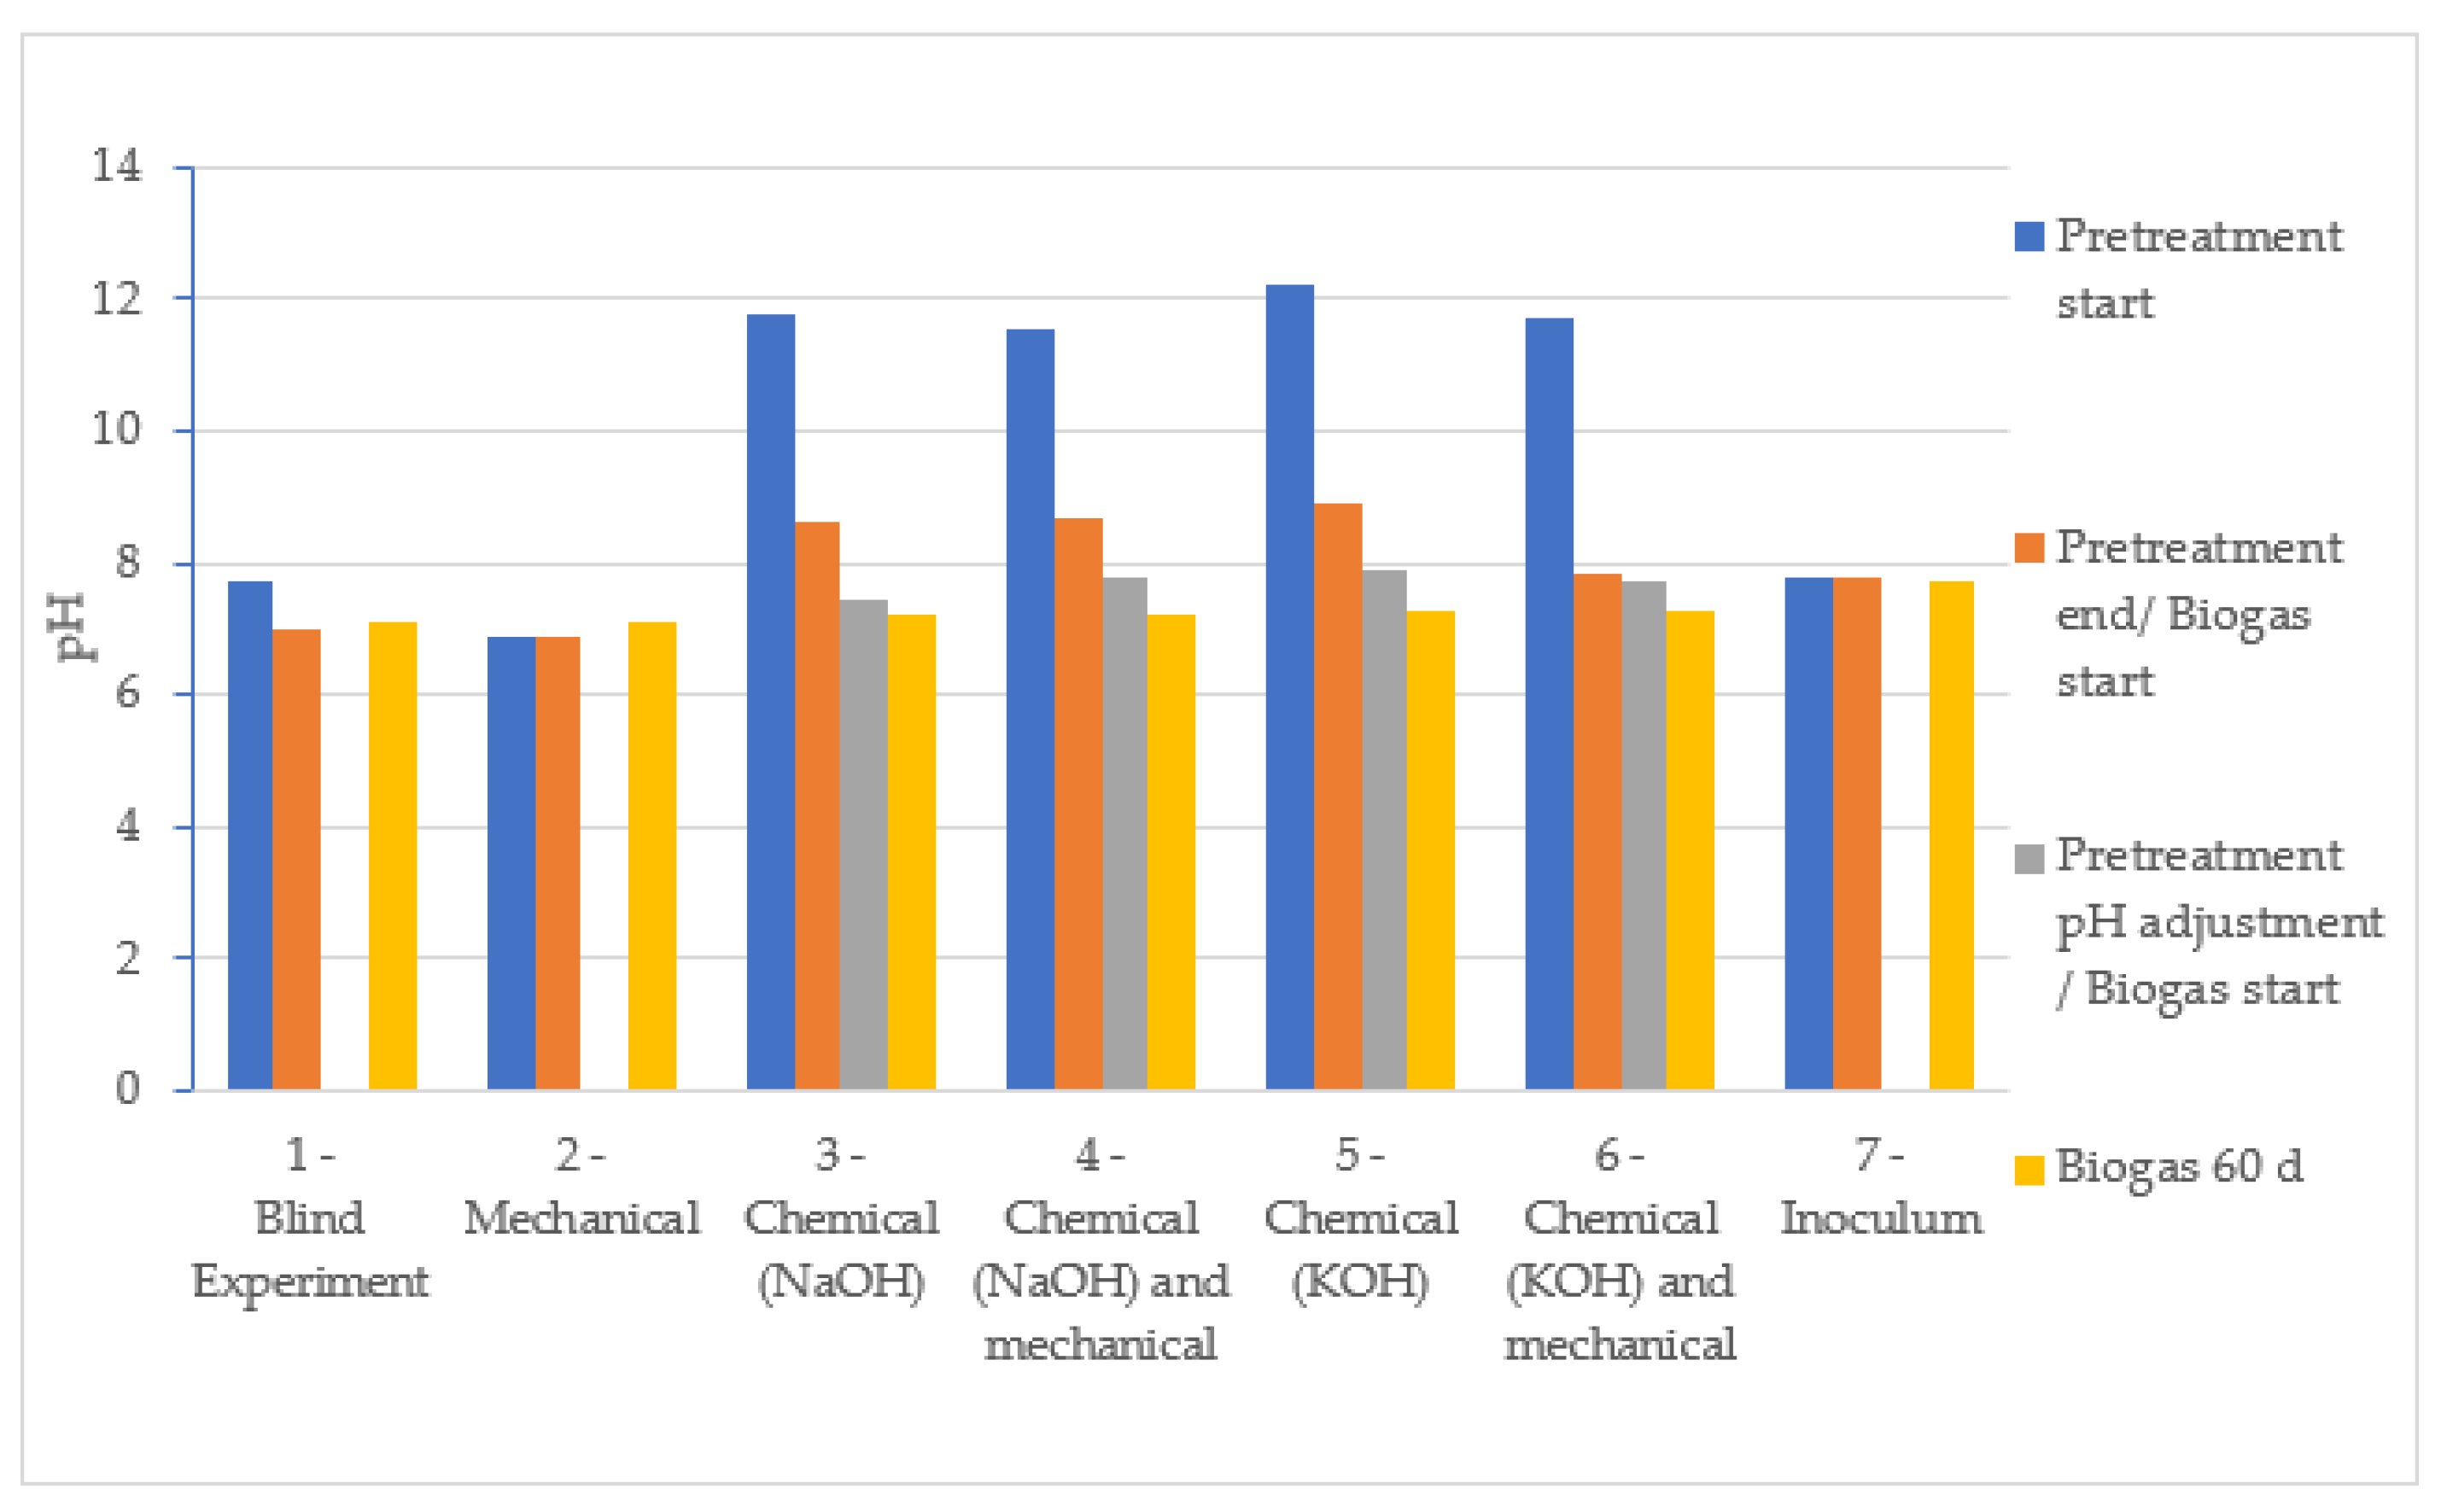
Figure 10 displays the pH at the beginning and the end of the experimental stages. During the four pre-treatment days, there was a certain pH regulation in batches 3, 4, 5 and 6, with chemical pre-treatments reflecting the buffering capacity of cattle manure, with a variety of pH values from 8.6–7.8 to 11.5–12. A pH adjustment was still necessary for the chemically pre-treated batches before adding the inoculum for the biogas fermentation to get the proper conditions for the biogas fermentation bacteria [2]. The non-pre-treated batch 1 shows a slight pH reduction during the pre-treatment. It suggests a certain biological activity, which transforms the solubilised organic matter during the pre-treatments into acids, driving the pH to a pH 7. During the anaerobic fermentation of biogas, all pH values remained stable, with values around 7.
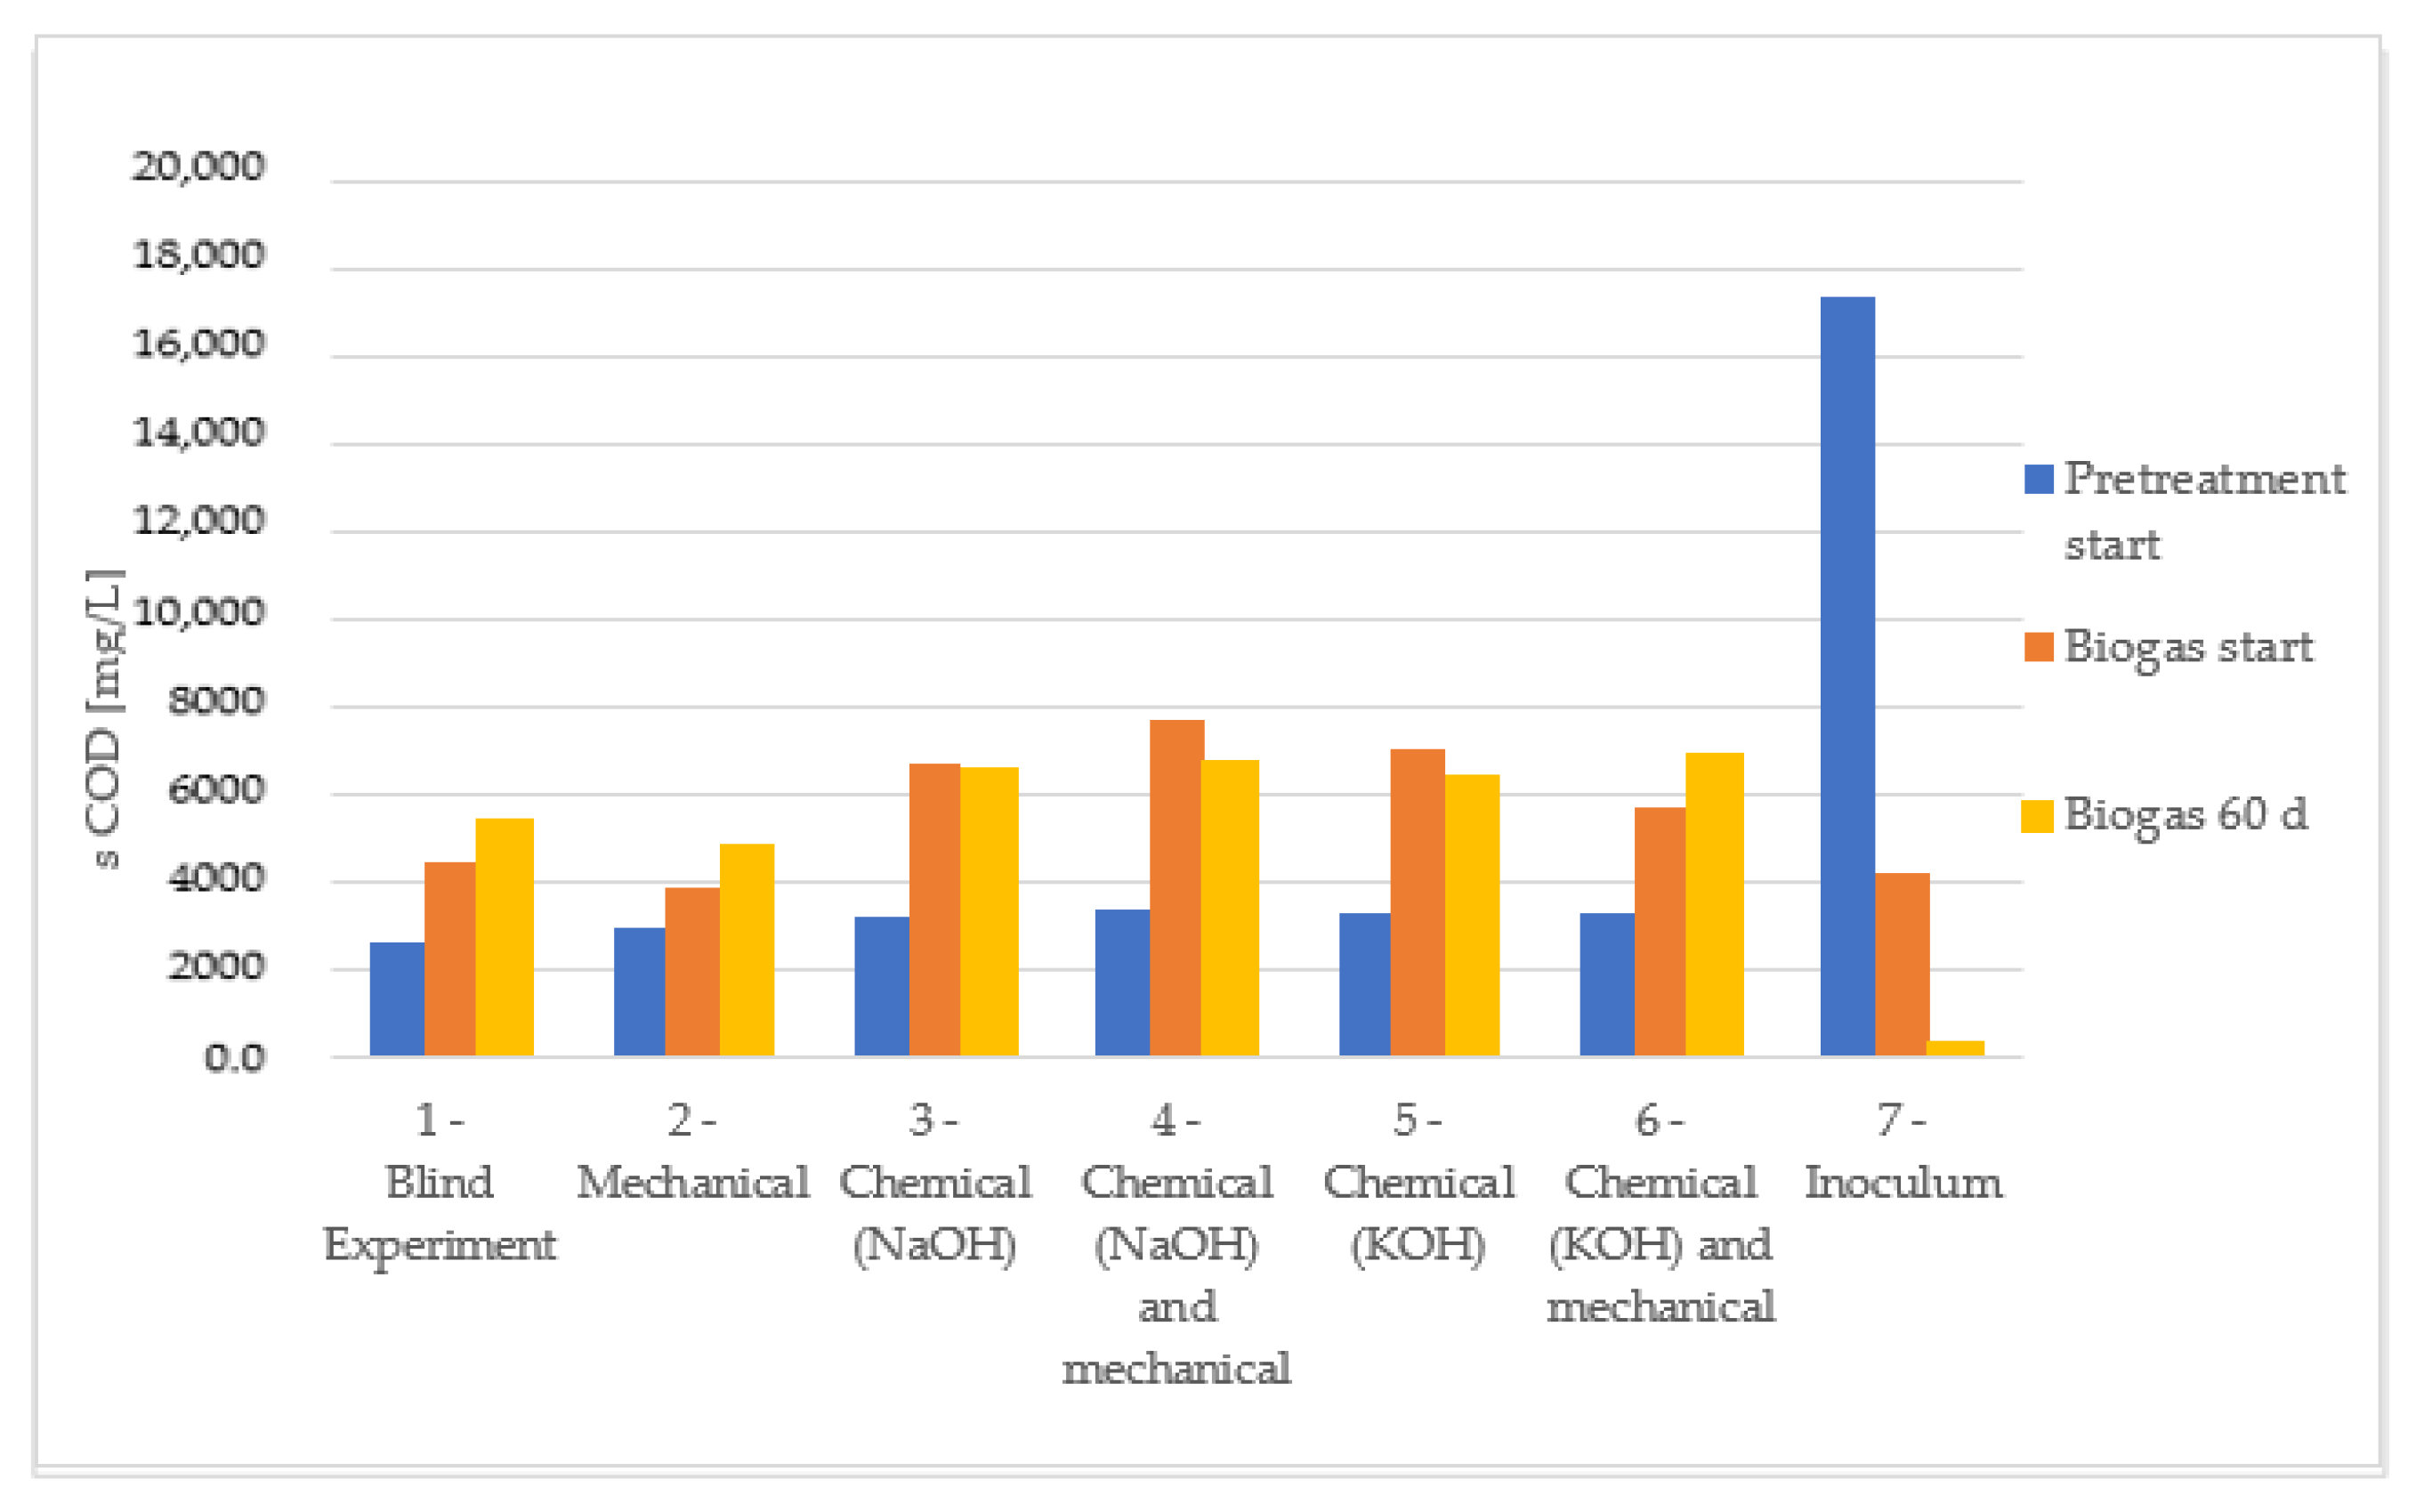
At the end of the biogas fermentation, there were high remaining s COD rates, which indicate a residual biogas potential. Figure 11 shows the s COD throughout the experiment. During the pre-treatment, the chemical pre-treated vessels 3,4,5 and 6 had markedly higher solubilisation of the organic materials than in the non-pre-treated batches 1 and 2, with rates between 3925 mg/L and 4300 mg/L s COD. Batches 1 and 2 showed low s COD increments, with 1795 mg/L s COD in batch 1 and 946 mg/L s COD in batch 2.
Batch 6 had a lower s COD increment during the pre-treatment compared to the other chemically pre-treated batches with 2400 mg/L s COD. This is probably an effect of lower lignocellulose content, which might also explain the slightly lower biogas production rates shown in Figure 8.
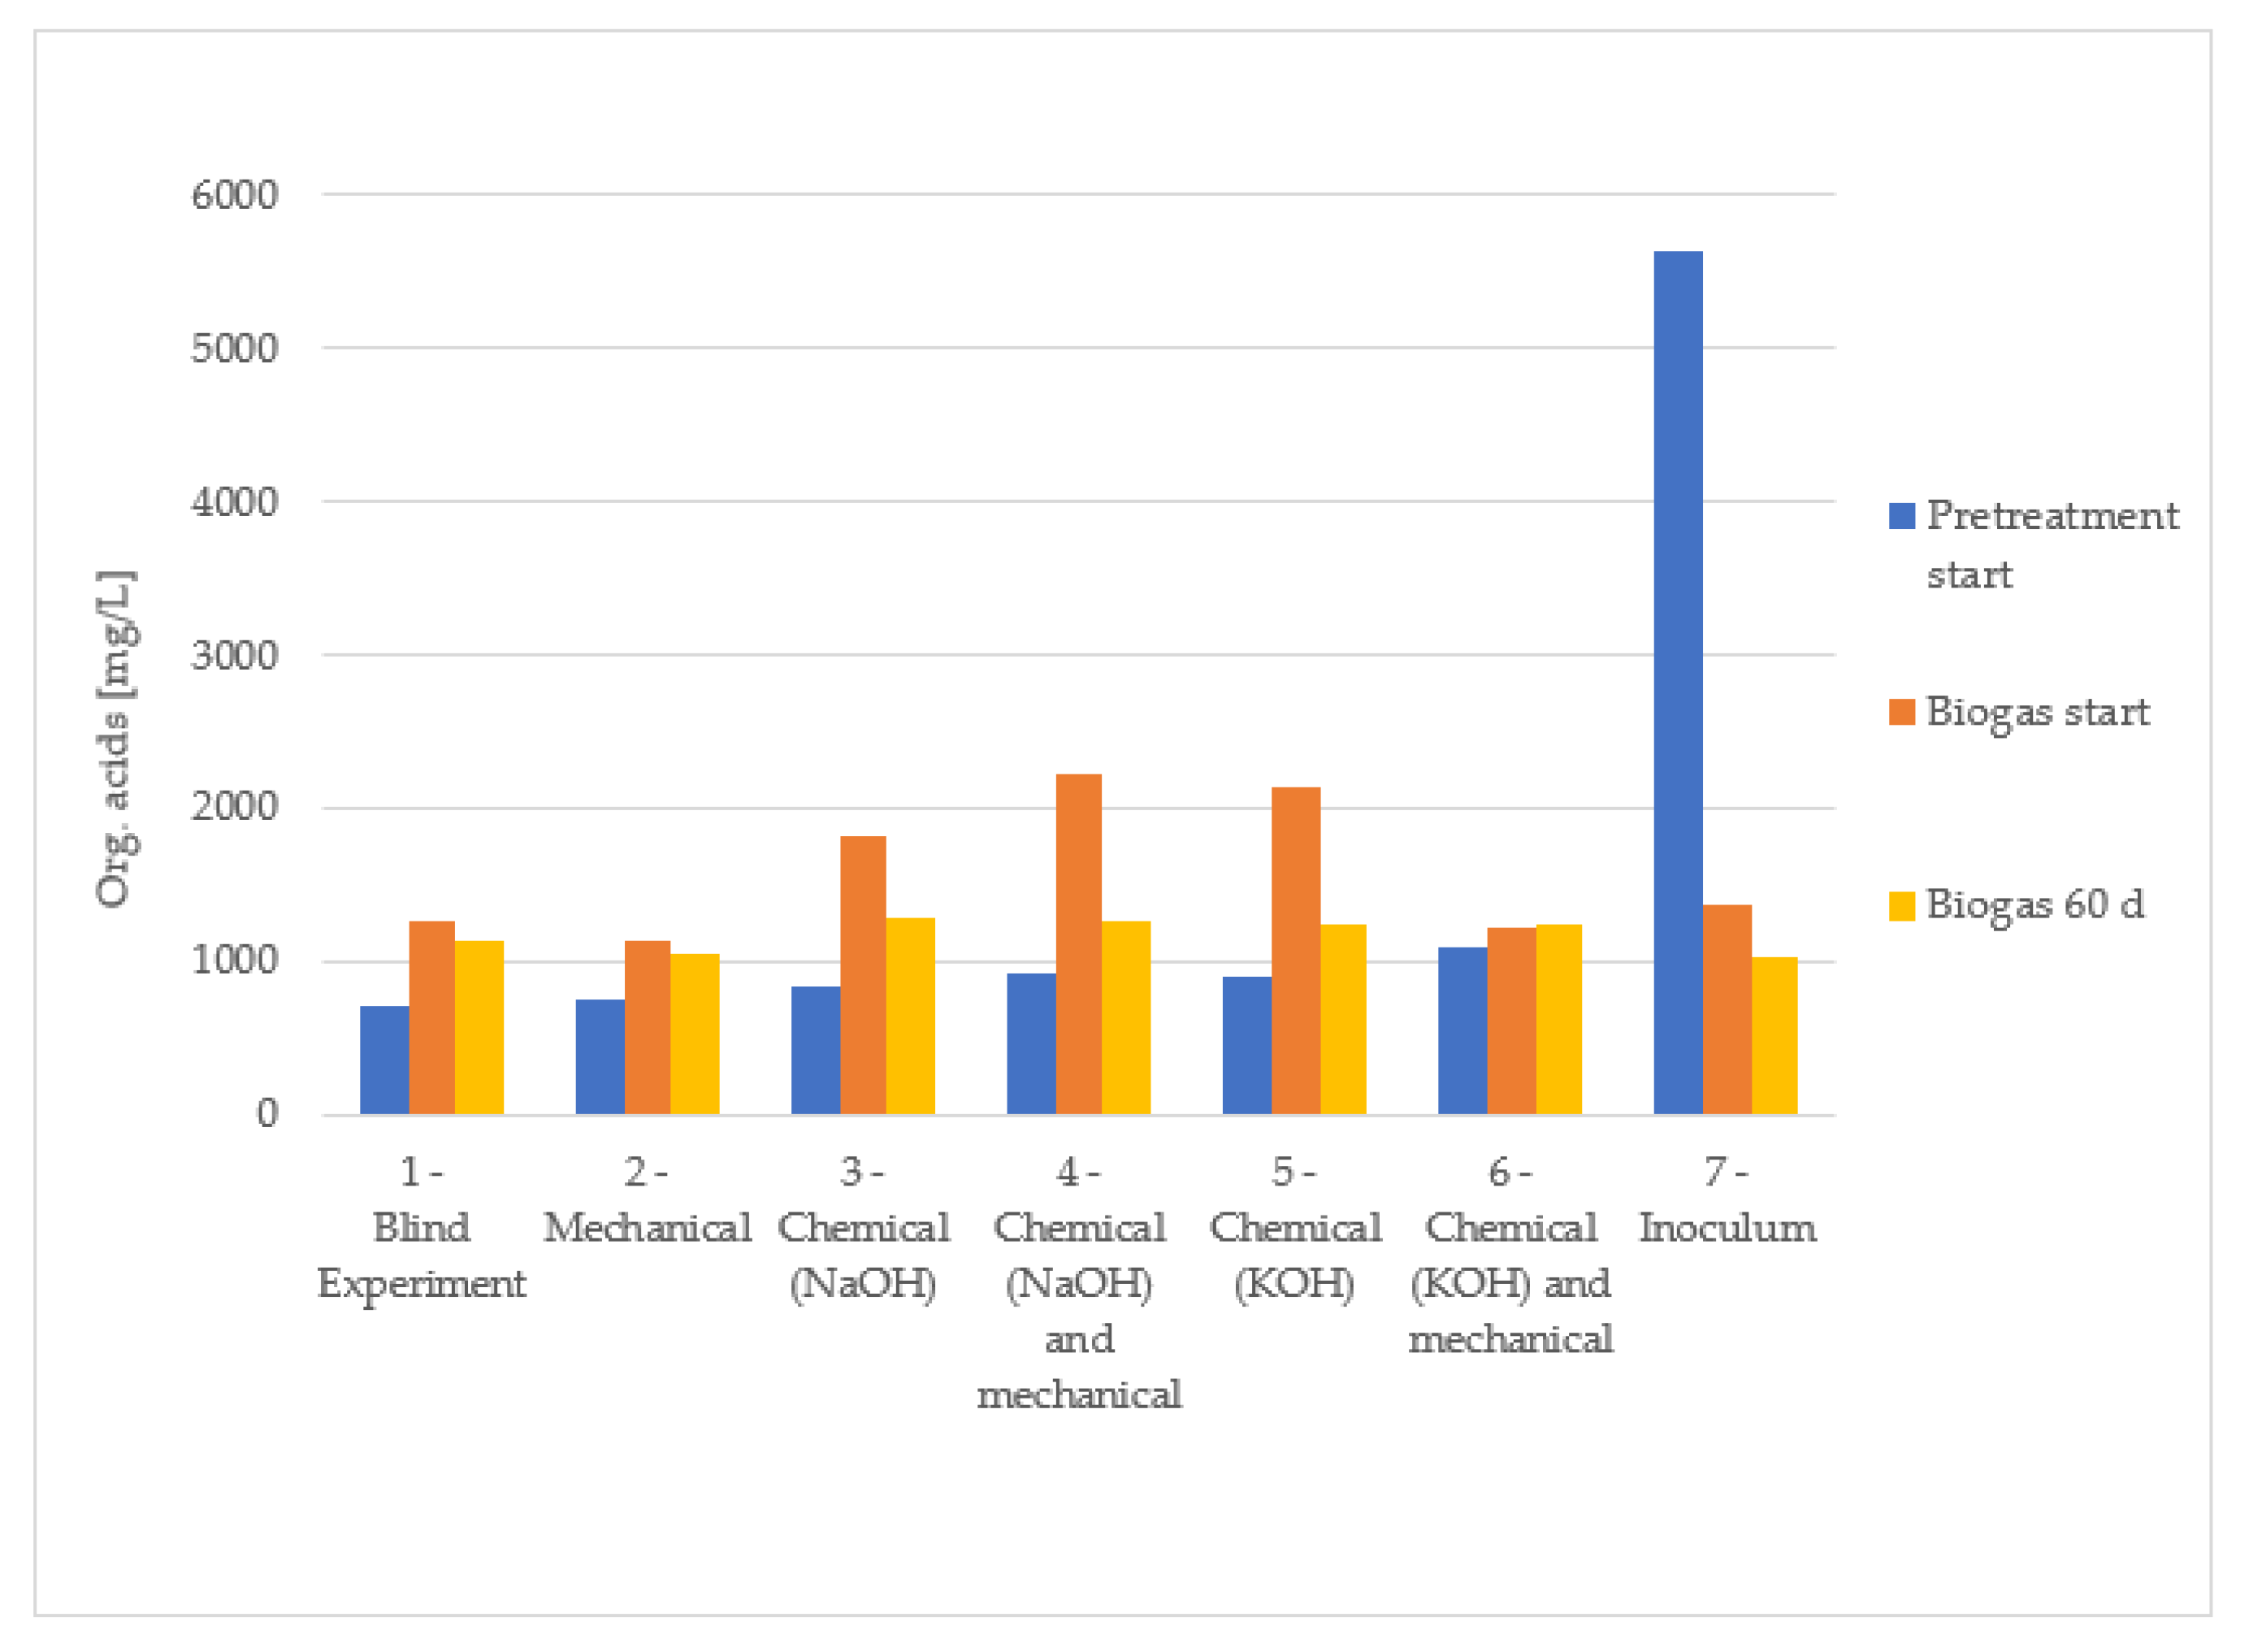
An important parameter concerning the stability of the biogas process is the total organic acids. In Figure 11, almost all the batches display stable total organic acid rates lower than 2000 mg/L, which characterises a stable biogas process [45]. The chemically pre-treated batches (3, 4 and 5) showed initial higher values compared to the other batches with more than 2000 mg/L. This follows the higher hydrolysed and solubilised organic materials during the same period shown in Figure 11 and with the pH decrease shown in Figure 10, in addition to the buffering capacity of cattle manure.
After the biogas fermentation, there were still residual rates of over 1000 mg/L of total organic acids, which proves a remaining microbial activity in all batches and a residual biogas potential.
The higher rate of organic acids of batches 3, 4 and 5 after the chemical pre-treatments could also explain why the biogas production rate of these batches is slightly lower than the biogas rate of the non-chemically pre-treated vessels during the first five fermentation days (see Figure 8), as the organic acids can initially inhibit the methanogenic bacteria’s activity. The initial inoculum-to-substrate ratio and working temperature can also influence the organic acids and other primary products of hydrolysis like the s COD [46].

4. Discussion

Chemical pre-treatments increased the solubilisation of the contained lignocelluloses in the cattle manure matrix in low 0.05 M NaOH and 0.05 M KOH concentrations, with increments between 40 and 62.5 mg/L s COD per g DM. This can also be observed in the higher organic acids amount after the hydrolysis shown in Figure 12, with increments up to 17 mg/L total organic acids per g DM. Consequently, a higher biogas production rate is expected.
After an initial slight inhibition of approximately 5 days in the chemical pre-treated batches, there is a faster biogas production with 350 NL Biogas/kg VS in the 0.05 M KOH pre-treated batch 5 vs. 290 NL Biogas/kg VS in the non-pre-treated batch 1 after 39 days of fermentation. Batch 1 reached the same biogas amount after 57 days of fermentation. This provides an advantage of 18 days from applying chemical KOH pre-treatment, which influences the HRT and the economic viability of the biogas plant in the case of application on higher scales. The accumulated biogas production rates of the non-pre-treated batch (1) also approached the biogas yields of the chemically pre-treated batches (3, 4 and 5) after 60 days of fermentation, so the expected total biogas rates after a completed process of fermentation were similar.

5. Conclusions

The dimensioning of biogas reactors with chemical pre-treatments applying concentrations of 0.05 M KOH in larger scales can be improved through the HRT and be consequently reduced by 18 days by sizing the reactor for 350 NL Biogas/kg VS, providing a positive economic impact on the expenses for materials, reactor size and on the surface as well as space demand. The following calculation example weighs in on the advantages.
If a biogas quantity of 350 L/kg VS is set as the yield time, this goal is reached after 57 days without alkaline pre-treatment and after 39 days with alkaline treatment. This results in a shortening of the retention time in the heated tank by 18 days. With a daily fermentation volume of 50 m³ of an 8% suspension, the fermenter can therefore be built 1000 m³ smaller. Correspondingly, 1000 m³ fewer fermenter contents need to be constantly heated, which should also reduce heat losses. With specific investment costs for fermenters of 200–400 €/m³ [47], this results in savings in investment costs of at least 200,000 € [48].
The mechanical shredding pre-treatment with an energy consumption of 0.10 Wh/g DM applied in single mode or in addition to the chemical pre-treatment does not confirm a significant advantage to either COD or the biogas yields.
Further investigations concerning the application of pre-treatments on larger scales are required regarding the process engineering and economic impact. Aspects like the dosage technique and application frequency of the pre-treatment chemicals, the limits of dry substance load in the reactor and medium viscosity, chemical compounds and their accumulation because of the chemical addition remain to be investigated.

Author Contributions

V.H.-S. contributed to the study’s writing, conception, methodology, investigation and validation. U.B. contributed to the study’s conception, methodology, investigation, validation and review. J.H. contributed to the study’s review, methodology, investigation, project administration and funding acquisition. M.E.B. contributed to the methodology, validation, review and editing. All authors have read and agreed to the published version of the manuscript.

Funding

This study was funded by the Bavarian Ministry for Economic Affairs, Research and Development Project “small biogas plant made of textile materials”.

Institutional Review Board Statement

Not applicable.

Informed Consent Statement

Not applicable.

Data Availability Statement

The data that support this study are available on request.

Acknowledgments

We wish to thank the whole department of Mechanical Engineering of the University of Applied Sciences in Landshut and the whole Department of Chemical Engineering at La Laguna University.

Conflicts of Interest

The authors declare no conflict of interest.

References

  1. Federal Ministry for Economic Affairs and Energy. Integrated National Energy and Climate Plan (NECP). In Pursuant to the Regulation of the European Parliament and of the Council on the Governance of the Energy Union and Climate Action, as at 10.06.2020; Federal Ministry for Economic Affairs and Energy: Berlin, Germany, 2020. [Google Scholar]
  2. Dar, R.A.; Parmar, M.; Dar, E.A.; Sani, R.K.; Phutela, U.G. Biomethanation of agricultural residues: Potential, limitations and possible solutions. Renew. Sustain. Energy Rev. 2021, 135, 110217. [Google Scholar] [CrossRef]
  3. Brodeur, G.; Yau, E.; Badal, K.; Collier, J.; Ramachandran, K.B.; Ramakrishnan, S. Chemical and physicochemical pretreatment of lignocellulosic biomass: A review. Enzym. Res. 2011, 2011, 787532. [Google Scholar] [CrossRef] [Green Version]
  4. Chandra, R.; Takeuchi, H.; Hasegawa, T. Methane production from lignocellulosic agricultural crop wastes: A review in context to second generation of biofuel production. Renew. Sustain. Energy Rev. 2012, 16, 1462–1476. [Google Scholar] [CrossRef]
  5. Zhao, X.; Zhang, L.; Liu, D. Biomass recalcitrance. Part II: Fundamentals of different pre-treatments to increase the enzymatic digestibility of lignocellulose. Biofuels Bioprod. Bioref. 2012, 6, 561–579. [Google Scholar] [CrossRef]
  6. Kalluri, U.C.; Yin, H.; Yang, X.; Davison, B.H. Systems and synthetic biology approaches to alter plant cell walls and reduce biomass recalcitrance. Plant Biotechnol. J. 2014, 12, 1207–1216. [Google Scholar] [CrossRef] [Green Version]
  7. Laureano-Perez, L.; Teymouri, F.; Alizadeh, H.; Dale, B.E. Understanding Factors that Limit Enzymatic Hydrolysis of Biomass. In Twenty-Sixth Symposium on Biotechnology for Fuels and Chemicals; Davison, B.H., Evans, B.R., Finkelstein, M., McMillan, J.D., Eds.; Humana Press: Totowa, NJ, USA, 2005; pp. 1081–1099. [Google Scholar]
  8. Ragauskas, A.J. Physicochemical Structural Changes of Cellulosic Substrates during Enzymatic Saccharification. JABB 2016, 1, 1–8. [Google Scholar] [CrossRef]
  9. Lange, J.-P. Lignocellulose conversion: An introduction to chemistry, process and economics. Biofuels Bioprod. Biorefining 2007, 1, 39–48. [Google Scholar] [CrossRef]
  10. Zheng, Y.; Zhao, J.; Xu, F.; Li, Y. Pretreatment of lignocellulosic biomass for enhanced biogas production. Prog. Energy Combust. Sci. 2014, 42, 35–53. [Google Scholar] [CrossRef]
  11. Hendriks, A.T.W.M.; Zeeman, G. Pretreatments to enhance the digestibility of lignocellulosic biomass. Bioresour. Technol. 2009, 100, 10–18. [Google Scholar] [CrossRef]
  12. Fengel, D.; Wegener, G. Wood: Chemistry, Ultrastructure, Reactions; De Gruyter: Berlin, Germany, 1984. [Google Scholar]
  13. Jørgensen, H.; Kristensen, J.B.; Felby, C. Enzymatic conversion of lignocellulose into fermentable sugars: Challenges and opportunities. Biofuels Bioprod. Biorefining 2007, 1, 119–134. [Google Scholar] [CrossRef]
  14. Galkin, M.V.; Samec, J.S.M. Lignin Valorization through Catalytic Lignocellulose Fractionation: A Fundamental Platform for the Future Biorefinery. ChemSusChem 2016, 9, 1544–1558. [Google Scholar] [CrossRef] [PubMed]
  15. Saini, A.; Aggarwal, N.K.; Sharma, A.; Yadav, A. Prospects for Irradiation in Cellulosic Ethanol Production. Biotechnol. Res. Int. 2015, 2015, 157139. [Google Scholar] [CrossRef]
  16. Xu, N.; Liu, S.; Xin, F.; Zhou, J.; Jia, H.; Xu, J.; Jiang, M.; Dong, W. Biomethane Production from Lignocellulose: Biomass Recalcitrance and Its Impacts on Anaerobic Digestion. Front. Bioeng. Biotechnol. 2019, 7, 191. [Google Scholar] [CrossRef]
  17. Pauly, M.; Keegstra, K. Plant cell wall polymers as precursors for biofuels. Curr. Opin. Plant Biol. 2010, 13, 305–312. [Google Scholar] [CrossRef]
  18. Zhao, X.; Zhang, L.; Liu, D. Biomass recalcitrance. Part I: The chemical compositions and physical structures affecting the enzymatic hydrolysis of lignocellulose. Biofuels Bioprod. Bioref. 2012, 6, 465–482. [Google Scholar] [CrossRef]
  19. Fernández-Cegrí, V.; La Angeles De Rubia, M.; Raposo, F.; Borja, R. Effect of hydrothermal pretreatment of sunflower oil cake on biomethane potential focusing on fibre composition. Bioresour. Technol. 2012, 123, 424–429. [Google Scholar] [CrossRef] [PubMed]
  20. Sambusiti, C.; Ficara, E.; Malpei, F.; Steyer, J.P.; Carrère, H. Benefit of sodium hydroxide pretreatment of ensiled sorghum forage on the anaerobic reactor stability and methane production. Bioresour. Technol. 2013, 144, 149–155. [Google Scholar] [CrossRef] [PubMed]
  21. Xu, P.; Cheng, S.; Han, Y.; Zhao, D.; Li, H.; Wang, Y.; Zhang, G.; Chen, C. Natural Variation of Lignocellulosic Components in Miscanthus Biomass in China. Front. Chem. 2020, 8, 595143. [Google Scholar] [CrossRef]
  22. Guan, R.; Li, X.; Wachemo, A.C.; Yuan, H.; Liu, Y.; Zou, D.; Zuo, X.; Gu, J. Enhancing anaerobic digestion performance and degradation of lignocellulosic components of rice straw by combined biological and chemical pretreatment. Sci. Total Environ. 2018, 637–638, 9–17. [Google Scholar] [CrossRef] [PubMed]
  23. Jaffar, M.; Pang, Y.; Yuan, H.; Zou, D.; Liu, Y.; Zhu, B.; Korai, R.M.; Li, X. Wheat straw pretreatment with KOH for enhancing biomethane production and fertilizer value in anaerobic digestion. Chin. J. Chem. Eng. 2016, 24, 404–409. [Google Scholar] [CrossRef]
  24. Mading Makur, M.; Duraisamy, R.; Birhanu, T. Clarifying Capacity of Eco-Friendly Nano Cao and Okra(AbelmoschusEsculentus) Extract on the Processing of Sugarcane Juice: A Review. IRJST 2019, 1, 21–30. [Google Scholar] [CrossRef]
  25. Alonso-Pippo, W.; Luengo, C.A.; Felfli, F.F.; Garzone, P.; Cornacchia, G. Energy recovery from sugarcane biomass residues: Challenges and opportunities of bio-oil production in the light of second generation biofuels. J. Renew. Sustain. Energy 2009, 1, 63102. [Google Scholar] [CrossRef]
  26. Maciej, W.; Maria, S.B. The quantity and quality of methanogenic microorganisms based on rRNA analysis and their relation to methane production. Afr. J. Microbiol. Res. 2013, 7, 3389–3395. [Google Scholar] [CrossRef] [Green Version]
  27. Croce, S.; Wei, Q.; D’Imporzano, G.; Dong, R.; Adani, F. Anaerobic digestion of straw and corn stover: The effect of biological process optimization and pre-treatment on total bio-methane yield and energy performance. Biotechnol. Adv. 2016, 34, 1289–1304. [Google Scholar] [CrossRef]
  28. Lebuhn, M.; Munk, B.; Effenberger, M. Agricultural biogas production in Germany—From practice to microbiology basics. Energy Sustain. Soc. 2014, 4, 1–21. [Google Scholar] [CrossRef] [Green Version]
  29. Bah, H.; Zhang, W.; Wu, S.; Qi, D.; Kizito, S.; Dong, R. Evaluation of batch anaerobic co-digestion of palm pressed fiber and cattle manure under mesophilic conditions. Waste Manag. 2014, 34, 1984–1991. [Google Scholar] [CrossRef] [PubMed]
  30. Wang, Y.; Zhang, S.; Song, J.; Sheng, C.; Shang, Z.; Wang, R.; Wang, X.; Yang, G.; Feng, Y.; Ren, G. Strategies to improve production of biomethane from organic wastes with anaerobic co-digestion: A systematic review. Biofuels Bioprod. Biorefining 2022, 16, 1388–1411. [Google Scholar] [CrossRef]
  31. Mata-Alvarez, J.; Macé, S.; Llabrés, P. Anaerobic digestion of organic solid wastes. An overview of research achievements and perspectives. Bioresour. Technol. 2000, 74, 3–16. [Google Scholar]
  32. Shen, X.; Sun, R. Recent advances in lignocellulose prior-fractionation for biomaterials, biochemicals, and bioenergy. Carbohydr. Polym. 2021, 261, 117884. [Google Scholar] [CrossRef]
  33. Cirne, D.G.; Lehtomäki, A.; Björnsson, L.; Blackall, L.L. Hydrolysis and microbial community analyses in two-stage anaerobic digestion of energy crops. J. Appl. Microbiol. 2007, 103, 516–527. [Google Scholar] [CrossRef]
  34. Pang, Y.Z.; Liu, Y.P.; Li, X.J.; Wang, K.S.; Yuan, H.R. Improving Biodegradability and Biogas Production of Corn Stover through Sodium Hydroxide Solid State Pretreatment. Energy Fuels 2008, 22, 2761–2766. [Google Scholar] [CrossRef]
  35. Tsapekos, P.; Kougias, P.G.; Angelidaki, I. Biogas production from ensiled meadow grass; effect of mechanical pretreatments and rapid determination of substrate biodegradability via physicochemical methods. Bioresour. Technol. 2015, 182, 329–335. [Google Scholar] [CrossRef] [PubMed]
  36. Bruni, E.; Jensen, A.P.; Angelidaki, I. Comparative study of mechanical, hydrothermal, chemical and enzymatic treatments of digested biofibers to improve biogas production. Bioresour. Technol. 2010, 101, 8713–8717. [Google Scholar] [CrossRef] [PubMed]
  37. Wei, Y.; Li, X.; Yu, L.; Zou, D.; Yuan, H. Mesophilic anaerobic co-digestion of cattle manure and corn stover with biological and chemical pretreatment. Bioresour. Technol. 2015, 198, 431–436. [Google Scholar] [CrossRef] [PubMed]
  38. Zhang, L.; Jahng, D. Enhanced anaerobic digestion of piggery wastewater by ammonia stripping: Effects of alkali types. J. Hazard. Mater. 2010, 182, 536–543. [Google Scholar] [CrossRef]
  39. Wetter, C.; Merbecks, R.; Florack, M.; Tiemann, M. Untersuchungen der Potentiellen Gasausbeute von Gärsubstraten für Biogasanlage mit Hilfe des OxiTop Control-Messsystem; Applikationsbericht für WTW.; Fachhochschule Münster: Münster, Germany, 2007. [Google Scholar]
  40. DIN 38414-8:1985; Schlamm und Sedimente (Gruppe S): Bestimmung des Faulverhantens. German Institute for Standardisation Registered Society (DIN e.V.): Berlin, Germany, 1985.
  41. Langhans, G.; Scholwin, F.; Nelles, M. (Eds.) Handbuch zur Bilanzierung von Biogasanlagen für Ingenieure—Band I.; Springer Fachmedien Wiesbaden: Wiesbaden, Germany, 2020. [Google Scholar]
  42. VDI 4630:2016-11; Fermentation of Organic Materials. Characterisation of the Substrate, Sampling, Collection of Material Data, Fermentation Test. VDI-Society of Process Engineering and Chemical Engineering: Düsseldorf, Germany, 2016.
  43. Bayerische Landesanstalt für Landwirtschaft (LfL). Anleitung zur Probenahme von Wirtschaftsdüngern; Interreg Baltic Sea Region: Rostock, Germany, 2019. [Google Scholar]
  44. Ferreira, L.C.; Nilsen, P.J.; Fdz-Polanco, F.; Pérez-Elvira, S.I. Biomethane potential of wheat straw: Influence of particle size, water impregnation and thermal hydrolysis. Chem. Eng. J. 2014, 242, 254–259. [Google Scholar] [CrossRef]
  45. Wichern, M.; Gehring, T.; Fischer, K.; Andrade, D.; Lübken, M.; Koch, K.; Gronauer, A.; Horn, H. Monofermentation of grass silage under mesophilic conditions: Measurements and mathematical modeling with ADM 1. Bioresour. Technol. 2009, 100, 1675–1681. [Google Scholar] [CrossRef]
  46. Schwarz, B. Final Report Utilisation of Straw-Based Energy Pellets and Poultry Manure in Biogas Plants with Self-Sustaining Digestate Upgrading—STEP, 2019; Strom-Forschung: Juelich, Germany, 2019. [Google Scholar]
  47. Wirtschaftlichkeit von Biogasanlagen—Opus4. Available online: https://opus4.kobv.de/opus4-slbp/frontdoor/deliver/index/docId/1301/file/biogas07.pdf (accessed on 19 January 2023).
  48. Behmel, U.; (University of Applied Sciences Landshut, Landshut, Germany). Personal Communication, 2022.
Figure 1. Lignocellulose structure and pre-treatment effect, adapted from Guan et al. [15].
Sustainability 15 02582 g001
Figure 2. Setup representation; the sequences 1, 2, 3 and 4 are repeated three times each, with the repetitions 1.1, 1.2 and 1.3; 2.1, 2.2 and 2.3; 3.1, 3.2 and 3.3; 4.1, 4.2 and 4.3.
Sustainability 15 02582 g002
Figure 3. The s COD during the 7 days of 0.2 M NaOH pre-treatment according to Table 3; energy consumption during the shredding was 0.154 Wh/g DM.
Sustainability 15 02582 g003
Figure 4. pH during the 7 days of pre-treatment according to Table 3; chemical concentration of 0.2 M NaOH and energy demand during the shredding 0.154 Wh/g DM.
Sustainability 15 02582 g004
Figure 5. (A,B) are non-pre-treated grass silage vs. (C,D) which are pre-treated grass silage after 72 h under the effect of a 0.2 M NaOH solution; own source; scanning electron microscope Zeiss Merlin Compact VP.
Sustainability 15 02582 g005aSustainability 15 02582 g005b
Figure 6. Box plot repetitions s COD for (A) blind vessels; (B) vessels with 0.2 M NaOH pre-treatment; (C) vessels with mechanical pre-treatment (shredded cattle manure); (D) vessels with 0.2 M NaOH chemical and mechanical pre-treatment (shredded cattle manure).
Sustainability 15 02582 g006aSustainability 15 02582 g006b
Figure 7. Increment of the s COD after 24 and 48 h of digestion time.
Sustainability 15 02582 g007
Figure 8. Cumulative biogas production [NL/ kg VS] according to Table 5 .
Sustainability 15 02582 g008
Figure 9. Biogas composition according to experiment shown on Figure 8.
Sustainability 15 02582 g009
Figure 10. pH variation throughout the pre-treatment and biogas fermentation according to experiment shown on Figure 8.
Sustainability 15 02582 g010
Figure 11. Soluble oxygen chemical demand throughout the pre-treatment and biogas fermentation according to experiment shown on Figure 8.
Sustainability 15 02582 g011
Figure 12. Organic acids throughout the pre-treatment and biogas formation.
Sustainability 15 02582 g012
Table 1. Lignocellulosic biomass structures.
Biomass Resource (Plant)Chemical Composition (w/w%)Reference
CelluloseHemicelluloseLignin
Untreated sunflower oil cake (SuOC)27714[19]
Ensiled sorghum25.9 ± 1.7912.9 ± 0.3220.7 ± 0.32[20]
Miscanthus sinensis37.66 ± 3.822.94 ± 3.7117.35 ± 1.29[21]
Rice Straw35.32 ± 0.56 28.92 ± 0.017.88 ± 0.20[22]
Wheat straw41.63 ± 0.428.29 ± 0.612.45 ± 0.3[23]
Sugarcane stalk5.522[24]
Sugarcane bagasse462723[25]
Silage maize18.3919.591.43[26]
Table 2. Substrate matrix characteristics.
Dry matter (%)16.36
Residue on ignition in DM (%)12.04
Crude fat in DM (%)0.98
Crude protein in DM (%)11.40
Sugar in DM (%)0.55
Crude fibre in DM (%)32.98
ADF in DM (%)49.50
ADL in DM (%)14.90
NDF in DM (%)60.10
Hemicellulose in DM (%)10.60
Cellulose in DM (%)34.60
Lignin in DM (%)2.86
Ammonium nitrogen (mg/kg)904.92
Copper in DM (mg/kg)23.14
Zinc in DM (mg/kg)125.30
Calcium in DM (%)2.41
Potassium in DM (%)4.31
Sodium in DM (%)0.889
Magnesium in DM (%)0.46
Table 3. Setup parameters.
Setup Vessels
Repetitions
Chemical
Pretreatment
NaOH
(0.2 M)
Mechanical
Pretreatment
Blender
(20 s, 1000 Watt)
Average Weigh
Cattle Manure Probe
(g)
1.1/1.2/1.3200.54 ± 0.06
2.1/2.2/2.3+201 ± 3083.697
3.1/3.2/3.3+200.377 ± 0.173
4.1/4.2/4.3++200.403 ± 0.117
Table 4. Experimentation parameters: NaOH Concentration for series A = 0.2 M; series B = 0.1 M; series C = 0.05 M.
VesselsNaOH
(0.2 M)
NaOH
(0.1 M)
NaOH
(0.05 M)
Schredder
(20 s, 1000 Watt)
Cattle Manure (g)
A.1201.77
A.2+201.44
A.3+200.13
A.4++200.19
B.1200
B.2+201.25
B.3+200
B.4++200.38
C.1200.78
C.2+200.94
C.3+201.47
C.4++201.81
Table 5. Biogas laboratory reactors and setup parameters.
Biogas Reactor1—
Substrate
without
Pretreatments
2—
Substrate with Mechanical Pretreatment
3—
Chemical NaOH
Pretreatment
4—Chemical NaOH and
Mechanical Pretreatment
5—
Chemical KOH Pretreatment
6—Chemical KOH and
Mechanical
Pretreatment
7—Inoculum
Fermentation batch (mL) inc. Inoculum477.69475.85480.81479.06476.00478.11471.99
Vf (m) -free gas volume in the test reactor672.31674.15669.19670.94674.00671.89678.01
Substrate and inoculum weight (g)146.96146.98147.19147.17147.22147.3396.97
DM fermentation batch (%)4.32%4.32%4.33%4.33%4.33%4.33%1.97%
VS fermentation batch (%)3.43%3.43%3.43%3.43%3.43%3.43%1.45%
Test temperature (°C)37373737373737
Water (g)335335335335335335375.02
Cattle Manure (g)5050505050500
Inoculum (g)96.9696.9897.1997.1797.2297.3396.97
DM cattle manure (%)23.05%23.05%23.05%23.05%23.05%23.05%23.05%
DM inoculum (%)9.61%9.61%9.61%9.61%9.61%9.61%9.61%
VS cattle manure of the wet mass (%)19.37%19.37%19.37%19.37%19.37%19.37%19.37%
VS inoculum of the wet mass (%)7.04%7.04%7.04%7.04%7.04%7.04%7.04%
Disclaimer/Publisher’s Note: The statements, opinions and data contained in all publications are solely those of the individual author(s) and contributor(s) and not of MDPI and/or the editor(s). MDPI and/or the editor(s) disclaim responsibility for any injury to people or property resulting from any ideas, methods, instructions or products referred to in the content.