Article

Decision Making Model for Identifying the Cyber Technology Implementation Benefits for Sustainable Residential Building: A Mathematical PLS-SEM Approach

by
Ahmed Farouk Kineber
1,2,*,
Ayodeji Oke
3,4,5,
Mohammed Magdy Hamed
6,
Ashraf Alyanbaawi
7,
Ali Elmansoury
8 and
Ahmed Osama Daoud
9
1
Department of Civil Engineering, College of Engineering in Al-Kharj, Prince Sattam Bin Abdulaziz University, Al-Kharj 11942, Saudi Arabia
2
Department of Civil Engineering, Canadian International College (CIC), 6th October City, Zayed Campus, Giza 12577, Egypt
3
Department of Quantity Surveying, Federal University of Technology, Akure 340110, Nigeria
4
CIDB Centre of Excellence, Faculty of Engineering and Built Environment, University of Johannesburg, Johannesburg 2092, South Africa
5
School of Social Sciences, Universiti Sains Malaysia, Penang 11800, Malaysia
6
Construction and Building Engineering Department, College of Engineering and Technology, Arab Academy for Science, Technology and Maritime Transport (AASTMT), B 2401 Smart Village, Giza 12577, Egypt
7
College of Science and Computer Engineering, Taibah University, Yanbu 46411, Saudi Arabia
8
Islamic Architecture Department, Faculty of Engineering & Islamic Architecture, Umm Al Qura University, Mecca 24382, Saudi Arabia
9
Civil Engineering Department, Faculty of Engineering, The British University in Egypt (BUE), El Sherouk City 11837, Egypt
*
Author to whom correspondence should be addressed.
Sustainability 2023, 15(3), 2458; https://doi.org/10.3390/su15032458
Submission received: 23 December 2022 / Revised: 11 January 2023 / Accepted: 27 January 2023 / Published: 30 January 2023
(This article belongs to the Special Issue Sustainable Management of Construction Projects)

Abstract

:
Sustainability principles should be implemented during all the phases of the decision-making process of constructing residential buildings to achieve maximum gains without compromising the function of such projects. This study identified and examined the benefits of implementing cyber technology in residential building projects, with a view to promoting the sustainability of such projects. The benefits of cyber technology were identified from previous studies, which were then contextually explored via survey questionnaires within the Nigerian building industry. The results from the exploratory factor analysis (EFA) technique showed that the cyber technology benefits could be categorized into five constructs, namely, planning, transparency, efficiency, productivity, and quality. In addition, partial least square structural equation modelling (PLS-SEM) was used to develop the benefits model. The results showed that transparency related benefits were crucial benefits for implementing cyber technology. The study’s results will serve as a reference for decision-makers looking to decrease costs and increase sustainability by using cyber technology in the Nigerian construction sector.

1. Introduction

Residential construction is one of the important community characteristics that define a country’s citizens’ high quality of life and well-being [1]. Residential buildings use over 40% of the world’s electricity and contribute up to one-third of global greenhouse gas emissions (GHG emissions) in both developed and developing countries [2]. Nonetheless, in a rapidly changing and urbanizing world, residential allocation cannot keep up with demand [3]. Rapid urbanization in emerging nations is limiting low-wage workers’ access to affordable homes in emerging as well as developed nations [4]. It is estimated that 828 million impoverished people in developing nations live in slums and inadequate housing. By 2020, it is anticipated that this number would increase to 1.4 billion [3,5,6]. In particular, in some developing countries, the construction industry still follows traditional labor-intensive industry practices, with high energy consumption, environmental pollution, safety risks, and low productivity in project delivery [7]. These regions have witnessed tremendous growth, which underscores the importance of residential architecture in guaranteeing a standard of life [8]. As a consequence, all governments have emphasized affordable housing construction by implementing many affordable housing regulations [1].
However, there is a dispute regarding whether low-income households can purchase residential constructions [3]. Estimates show that up to 30 percent of construction costs are wasted due to inefficiencies, errors, delays, and poor communications [9]. Design errors, changes, or updates to the design model may cause delays, and if they are not communicated in real time to the building site, there is a danger of cost and schedule overruns. Thus, real-time access to design model changes may assist project managers in making educated judgments. Moreover, adjustments performed on site must be reflected in the 0as-built model for buildings’ lifetime management. Currently, as-built models are manually updated after creation; as a result, they are susceptible to errors since not all changes are fully recorded.
The literature emphasizes the need of designing ecologically friendly and resource-efficient “sustainable buildings” [10]. Wolstenholme et al. [11] further advise changing the construction industry by embracing effective and sustainable building principles. Moreover, building experts are unable to quantify the environmental impacts of buildings as they occur during development [12]. Therefore, virtual models provide a substantial long-term advantage by facilitating the recording of as-built information, team cooperation, and visualization of building progress, but their application is currently mostly restricted to the preconstruction period [13]. Computer-aided design (CAD) models and building information models (BIM) are examples of virtual models. Extending the usage of these models throughout the building, operation, and maintenance stages of a facility’s lifetime may provide substantial additional benefits. Integration of virtual and real building models has been shown to increase information and knowledge management from design through construction and maintenance, hence boosting construction process control [14].
Several researchers, such as Chin et al. [15,16] and Sørensen [17], have sought to integrate virtual models and physical construction by using various data collecting methods (e.g., digital cameras, laser scanners, radio frequency identification tags). However, current methods do not allow for bidirectional integration or communication between virtual models and physical construction. This two-way integration and communication are crucial for improving facility feedback and control. Real-time, bidirectional coordination between virtual models and the physical structure is an effective method for giving feedback and control. Bi-directional coordination is the integration of virtual models and real artefacts in such a manner that modifications to one are automatically reflected in the other [18]. In addition, computing resources are, necessary, to integrate closely the virtual models and the physical structure to ensure bi-directional coordination, so that changes in one environment are automatically reflected in the other. This method is known as the cyber–physical systems approach. “Cyber-physical system” is used in the context of this study to refer to the integration and coordination of virtual models and physical constructions. Cyber–physical systems employ sensors to connect the cyber world (such as information, communication, and intelligence) to the physical world [19].
The cyber–physical systems approach will increase progress monitoring, construction process control, as-built documentation, and environmentally responsible building practices. In addition, it has been shown that developing cyber technologies, such as the Internet of Things, big data, cloud computing, and artificial intelligence, efficiently contribute to industrial intelligence, particularly in the construction sector [20]. In recent years, however, these technologies have steadily invaded several building sector domains to provide effective design optimization, performance assessment, resource management, risk monitoring, energy conservation, emission reduction, and project delivery [21]. Intelligent processes in the construction industry are still in their infancy and lag behind other industrial sectors, particularly in developing nations [22]. Meanwhile, novel technologies are only partly accepted in some domains, and there is macro-level research on their incorporation into the building industry. We formulated the following research question for this empirical investigation based on our arguments: What are the benefits of using cyber technology in the building industry? This research attempts to investigate the benefits of using cyber technology for attaining sustainability in residential architecture utilizing causal inference approaches, such as structural equation modelling (SEM).

2. Benefits of Cyber Technology Adoption

There are a lot of benefits for cyber technology adoption in the construction sector. These benefits are listed and summarized in Table 1 based on previous studies of different researchers. A systematic internet search was conducted via different databases—Scopus, Web of Science (WOS), JSTOR, and ProQuest—to review different research papers related to the research topic. This was conducted using specific keywords, either separately or in combination, such as ‘benefits’, ‘cyber technology’, ‘residential buildings’, ‘adoption’, and ‘implementation’.

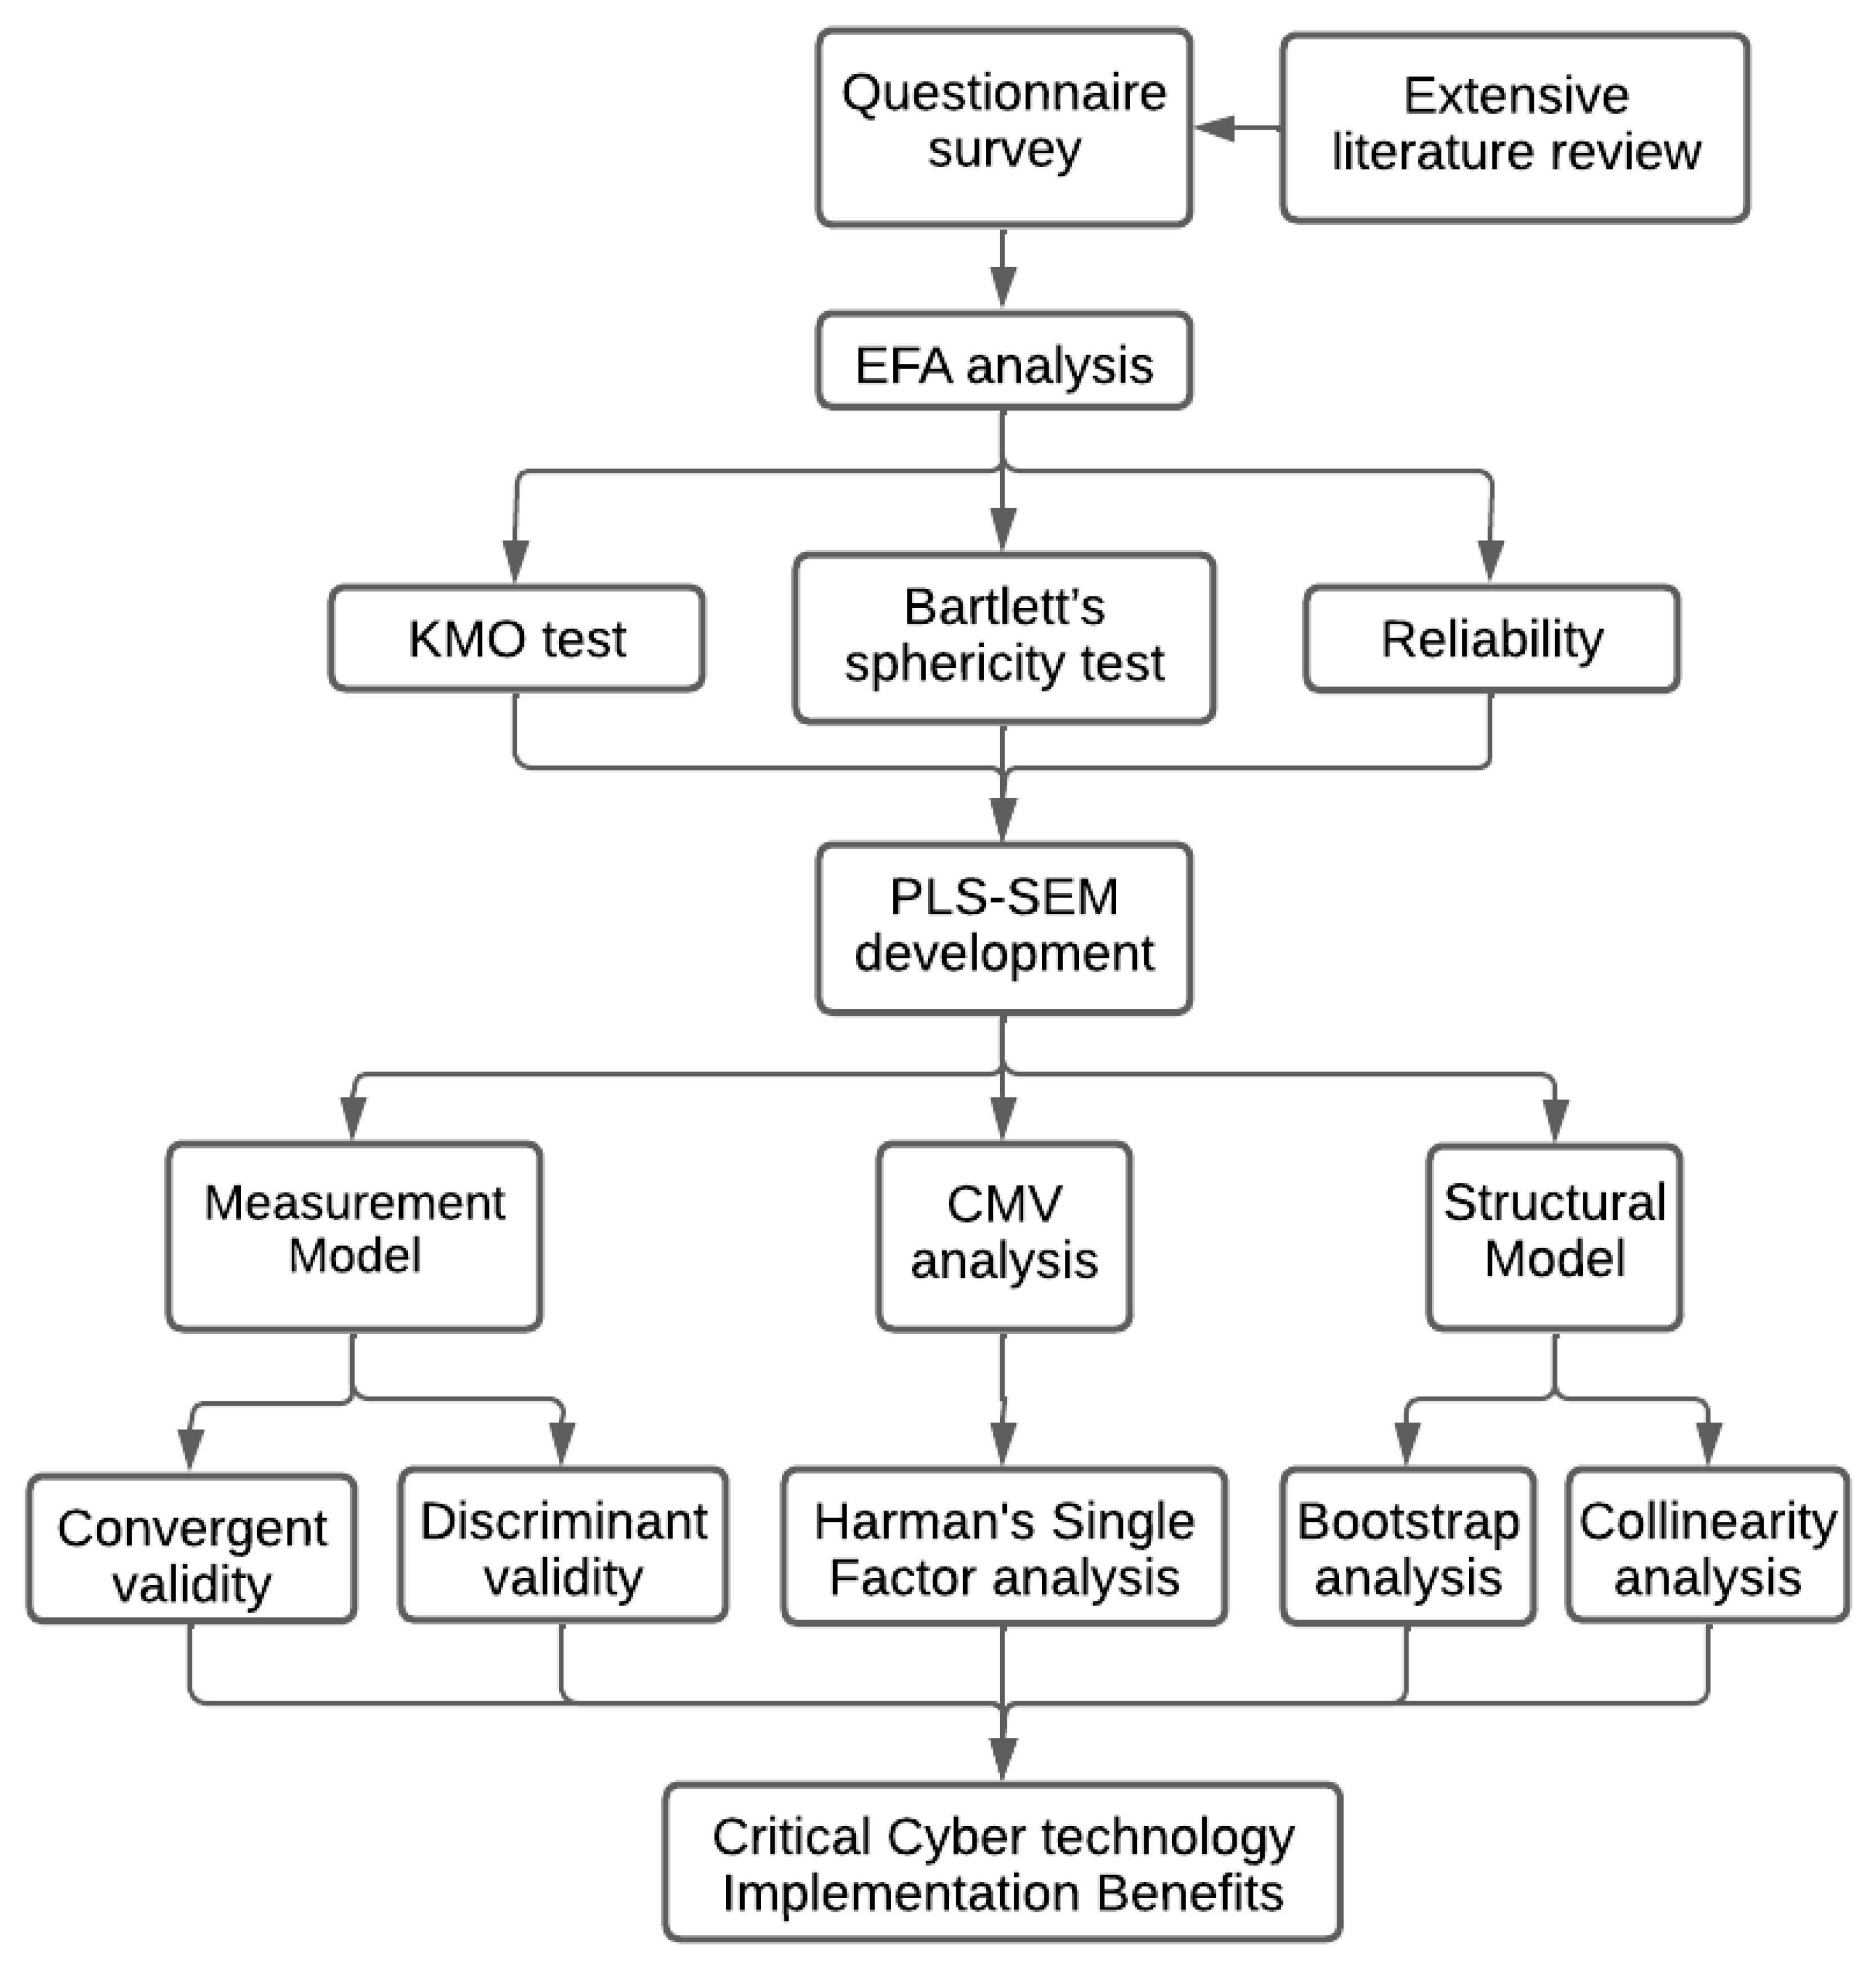
3. Research Methodology and Model Construction

From the literature assessment on the benefits of cyber technology, as shown in Figure 1, a list of 16 benefits was compiled and deemed acceptable for the adoption of cyber technology. Then, a questionnaire poll was conducted by distributing a list of cyber technology’s benefits to home construction specialists with appropriate industry expertise using an online hyperlink via google forms. The anonymity of the respondents was preserved by only asking about the respondents’ occupations and avoiding asking about their names. It was performed to verify the comprehensiveness and clarity of the cyber technology benefits in conjunction with the exploratory factor analysis (EFA) investigation of these variables and their categories.

3.1. Model Development

The partial least square structural equation modelling (PLS-SEM) has gained a great deal of interest in a variety of disciplines, including business research and the social sciences [36]. Recently, major SSCI publications have published several studies focusing on the PLS-SEM methodology [37,38,39]. The most recent version of the programme, SMART-PLS 3.2.7, was used to analyze the acquired data to estimate the importance of the cyber technological obstacles using SEM. Initially, PLS-SEM was recognised for its superior forecasting capabilities over covariance-based structural equation modelling (CB-SEM) [40] even though the differences between the two tactics are quite minor [41]. This study’s statistical analysis included the measurement and structural model assessment approach.

3.1.1. Common Method Variance

The common method bias (CMB) was calculated using the common method variance (CMV). CMB assists in elucidating the disparity (or mistake) in the conclusion of an analysis that is due to the measuring technique rather than the constructs represented by the measurements [42]. CMV might also be regarded as a variance overlap that could be attributable not just to constructs but also to the measuring instrument types that were used [42]. CMV is especially problematic when information, such as a self-administered questionnaire, is obtained from a specific source [43,44]. In some situations, self-reported data might exaggerate or reduce the number of examined links, causing problems [44,45]. Given that all data in this research are self-reported, subjective, and received from a single source, this may be significant. Consequently, it is essential to address these issues to identify any common procedure variances. As described in Harman’s experiment (1976), a rigorous, methodical, one-factor test was conducted [46]. The factor analysis revealed a single component that accounted for the bulk of the variation [44].

3.1.2. Construct Validity Analysis

Typically, the methodologies of confirmatory factor analysis (CFA) and exploratory factor analysis (EFA) are utilized for factor analysis. In this research, CFA is used to evaluate the structure underlying several variables in hypotheses or theories including such variables. On the other hand, EFA is used to collect information on relations and many variables and to reduce numerous variables to a small number of fundamental structures [47]. EFA is intended for interval data or ordinal data. A scatterplot graph demonstrates that the variables are partially or entirely interrelated. The strategy is used to minimize the number of factors to represent a collection of variables with a lesser number of variables. The formula is indicated below in Equation (1):
Xi = ai1F1 + ai2F2 + … + aimFm +ei
where ai are the factor loadings (or scores) for variable I, F is the factor to be analyzed, and ei is the part of the variable that cannot be explained by the factors.
In the present study, principal multivariate analytic techniques, such as EFA, which assisted the researcher in examining the major constructs or structure of cyber technology obstacles constructs, were used. It was utilized to test the constructs’ validity by analyzing the unidimensionality, reliability, and validity of the measurement items of particular constructs (i.e., measurement models). Principal component analysis (PCA) was chosen over principal axis factoring (PAF), picture factoring, maximum probability, and alpha factoring [48] because PCA is more accurate and less conceptually difficult. When there is no previous theory or model and preliminary solutions are obtained in EFA, PCA is recommended [47].
Thompson [48] observed that PCA is the default form in many statistical tools and is hence the method most often utilized in EFA. Varimax rotation was chosen over straight Oblimin or Promax because it aims to maximize load distribution across variables. Varimax is also appropriate for basic factor analysis and is a great general method that facilitates the elucidation of components. [49]. The 16 variables, along with the 119-sample size used in the current study, are considered suitable for factor analysis [50].

3.1.3. Measurement Model

The measurement model discloses the present link between items and their latent structure [51]. The subsequent subsections examined the convergent and discriminant validity of the measurement model in extensive detail.

Convergent Validity

Convergent validity is the level of concordance between two or more measures (benefits) of the same construct (group) [52]. It is known to be a subset of the construct’s validity. Using three tests, the convergent validity of the generated constructs in PLS may be assessed [53]: Cronbach’s alpha (α) composite reliability scores ( ρ c ), and average variance extracted ( A V E ). Nunnally and Bernstein [54] proposed a ρ c   value of 0.7 as the threshold of ‘modest’ reliability of the composite. For all types of study, scores over 0.70 and 0.60 for exploratory studies were deemed acceptable. [55]. AVE was the last examination. It is a typical metric used to evaluate the convergent validity of a model’s constructs, with values more than 0.50 indicating an acceptable convergent validity [55].

Discriminant Validity

Discriminant validity denotes that the phenomenon being assessed is empirically distinct and shows that no measures can identify the phenomenon being studied in SEM [56]. Campbell and Fiske [57] argued that for discriminatory validity to be proven, the similarity across measures need not be too great.

Structural Model Analysis

The purpose of this research was to model the importance of cyber technology’s benefits using SEM. The route coefficients between observed coefficients must be determined for this to occur. In this instance hypothesized one-way causal link (path relation) was proposed between £ (benefits of cyber technology constructs) and µ (benefits of cyber technology implementation). Here, the structural relationship between £, µ, and €1 formula in the structural model, which was identified as the inner relation, may be represented as the following linear Equation (2) [56]:
µ = β £+ €1
where (β) is the path coefficient linking benefits of cyber technology constructs and the residual variance at this structural level is supposed to reside in (€1). Here, β is the standardized regression weight, identical to the β weight of a multiple regression model. Its sign should agree with what the model forecasts and be statistically important. The matter now is how to establish the significance of the path coefficient, β. As with CFA, a bootstrapping technique available in the SmartPLS3.2.7 software was employed to evaluate the standard errors of the path coefficients. This was conducted with 5000 subsamples grounded on a suggestion made by Henseler et al. [36], which in turn defined the t-statistics for proposition testing. A total of four structural equations for cyber technology benefits constructs were formed for the PLS Model, representing the inner relations between the constructs and Equation (2).

4. Data Collection and Case Study

To explore the benefits of cyber technology, a broader variety of prospective residential building sector players in the Nigerian construction industry were asked to complete a questionnaire. This survey was composed of three major sections: the respondent’s demographic profile, the benefits of cyber technology (Table 1), and the open-ended questions (to add any benefits that the participants considered essential to be identified).
It was necessary to contact contractors, consultants, and clients. They might be further categorised by profession/occupation as follows: quantity surveyors, construction professionals, architects, and engineers. Respondents judged the benefits of cyber technology based on their knowledge and experience using a 5-point Likert scale, with 5 being extremely high, 4 being high, 3 being average, 2 being small, and 1 denoting no or a very small. This scale was used in some previous studies [57,58,59,60,61,62,63,64]. In this study, convenience sampling approaches were used. This is to guarantee that each member has an equal probability of being chosen. Therefore, the sample size was determined using the approach of purposive sampling. Due to the nature of the study, which seeks input from building industry specialists, this is the case. Moreover, the sample size that was used in this study was based on the methodological purpose analysis [65]. Yin [66] advised that the sample size for SEM should exceed 100. Due to the use of the SEM methodology, a total of 98 participants out of 119 were contacted in person (self-administered), yielding an approximate 82% response rate. This rate of return was deemed acceptable for this sort of investigation [67,68].

5. Data Analysis and Results

5.1. Common Method Bias

Common method bias is an error measurement (variance) that compromises the validity of the research. This indicates the systematic error variance of the measured and estimated variables [56]. This may be assessed using Harman’s single-factor evaluation of model structures, which reveals different structural measurements [28]. In this research, the single-factor test was utilized to assess the standard method’s variance [57]. If the total variance of the components is less than 50%, then the common method bias has no impact on the results [28]. The findings suggest that the first set of components accounts for 34.0% of the overall variance, indicating that the common method variance cannot impact the outcomes since it is less than 50% [28].

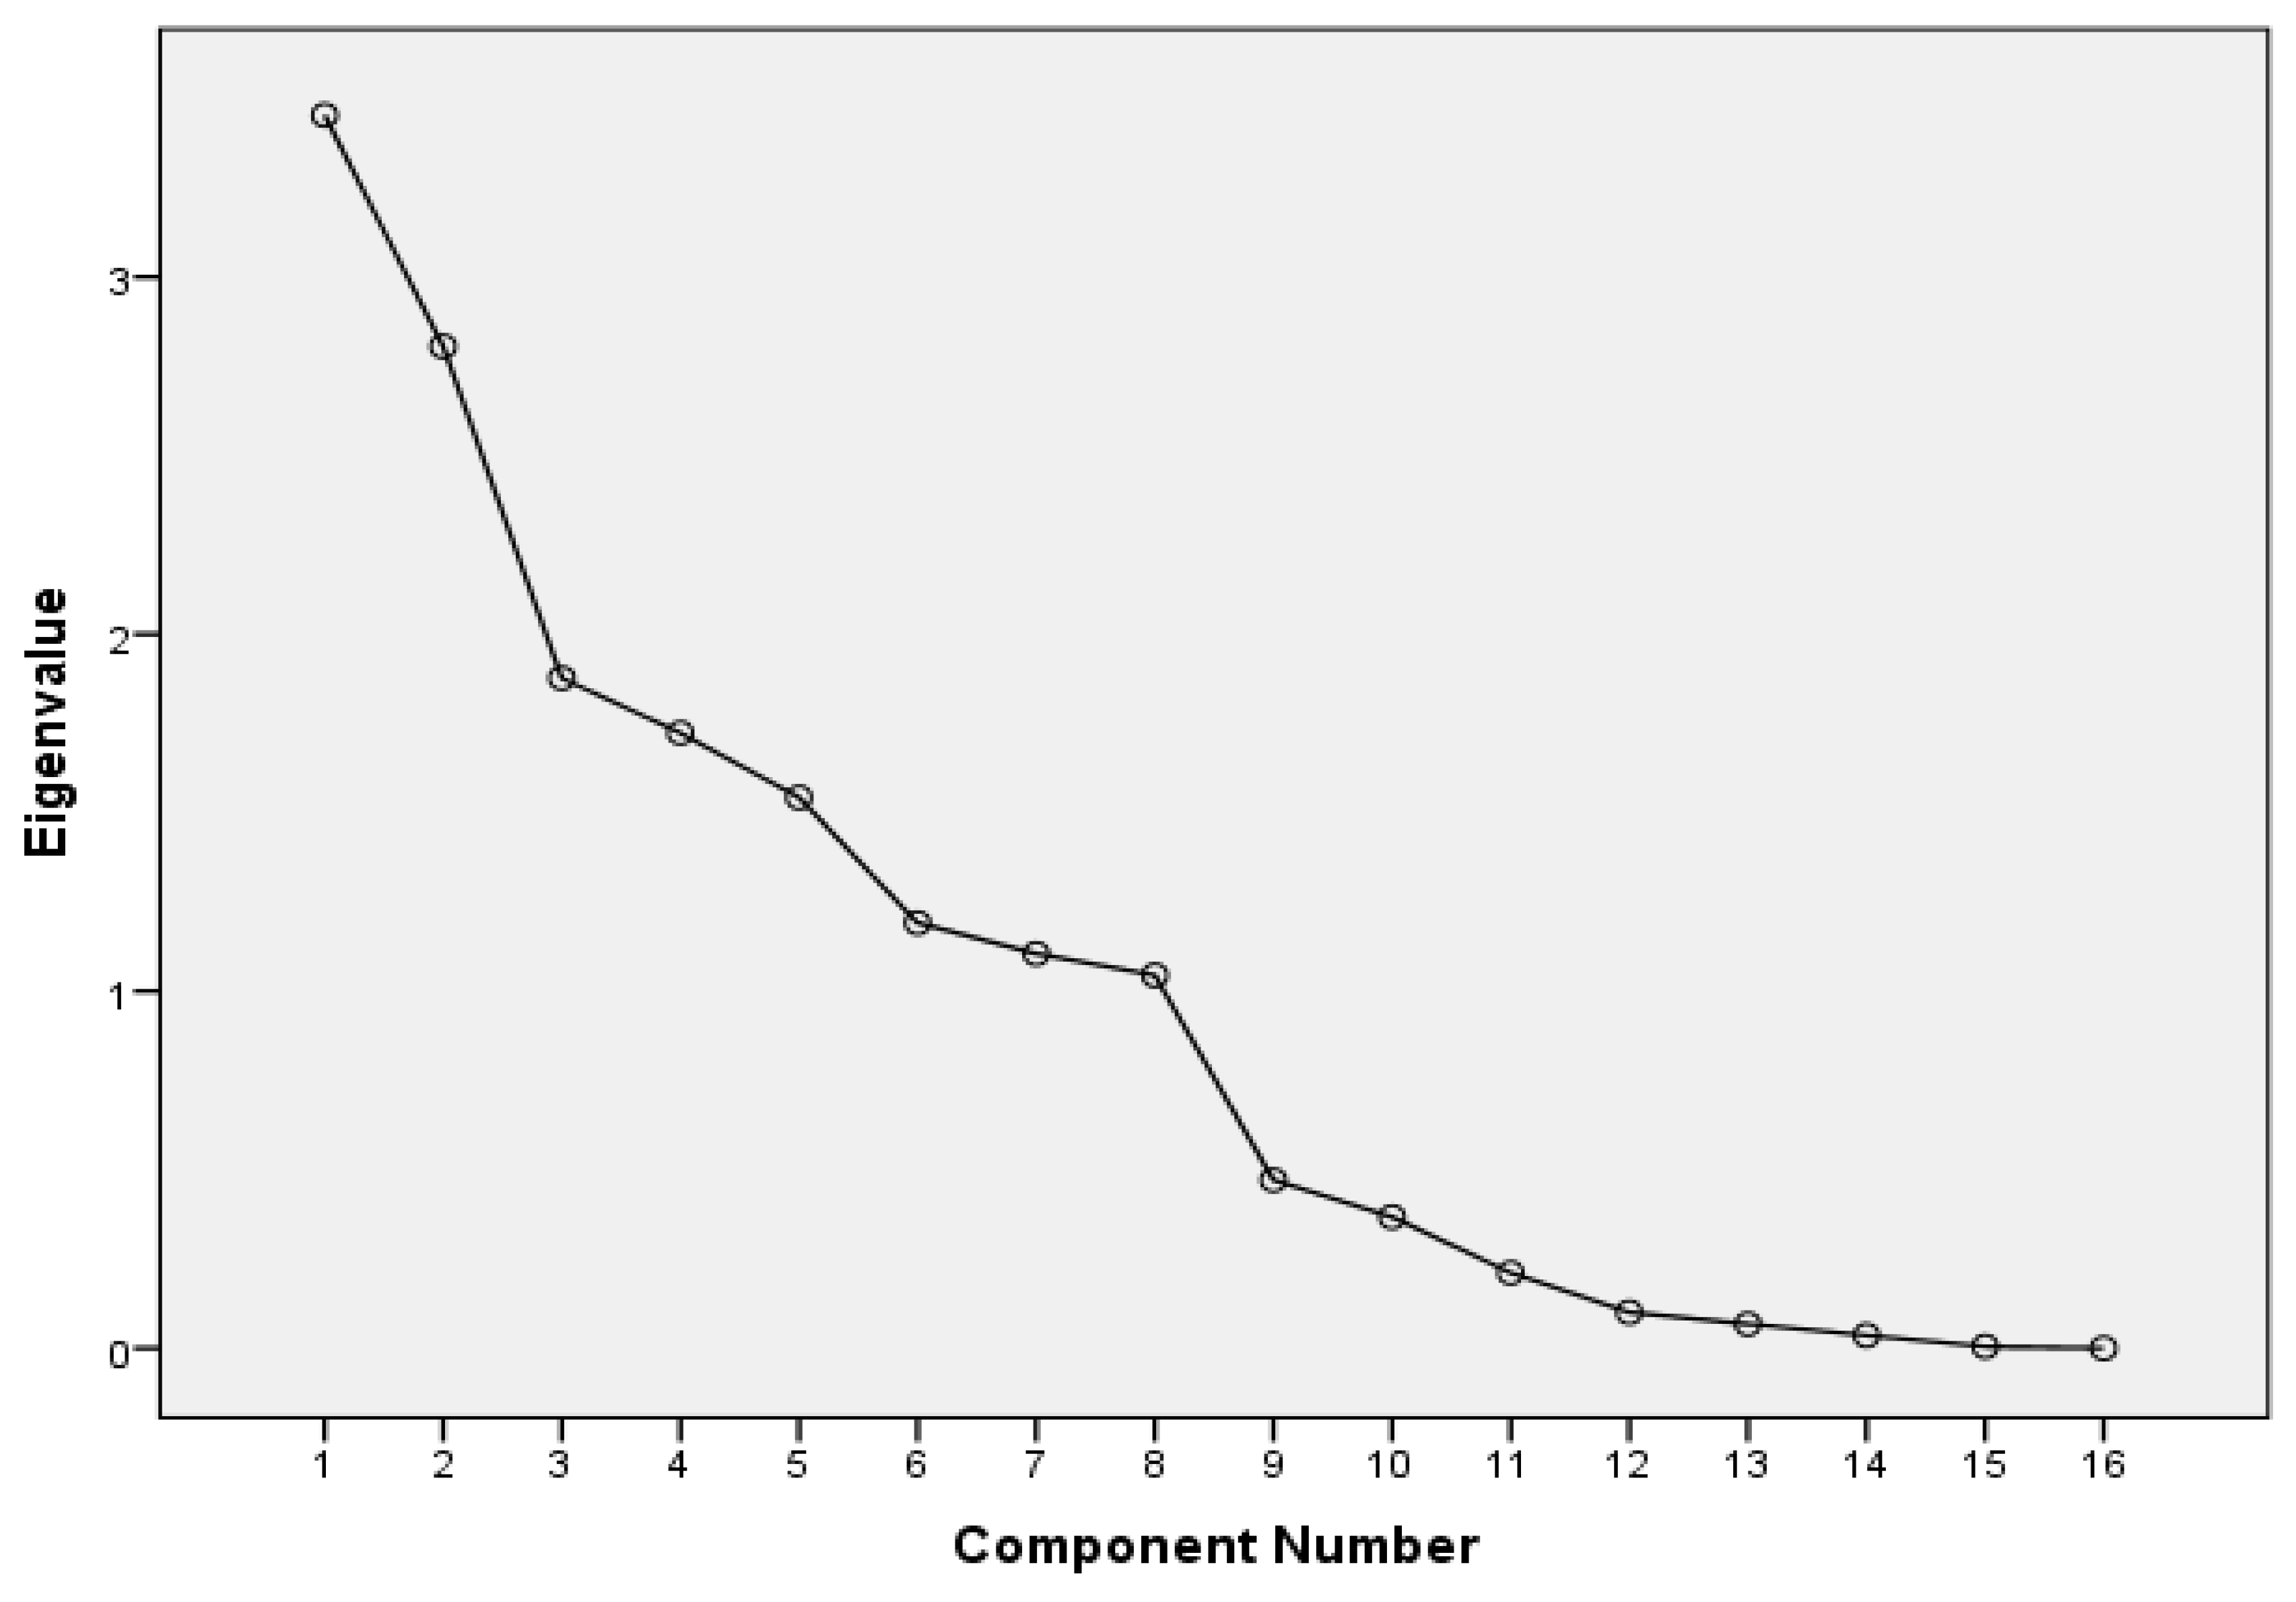
5.2. Exploratory Factor Analysis (Questionnaire I)

Utilizing exploratory factor analysis (EFA), the factorability structure of 16 items of the benefits of cyber technology was found. For connection, several well-known factorability characteristics have been used. Kaiser–Meyer–Olkin (KMO) is a factor homogeneity assessment that is often used to ensure that the partial correlations between variables are at their lowest [69]. The KMO index ranges from 0 to 1, with a value of at least 0.6 indicating a successful factor analysis [70]. The Bartlett sphericity test also confirms that the association matrix is the identity matrix, with p < 0.05 being statistically significant [71,72].
The KMO and Bartlett tests are shown in Table 2 for the different benefits of adopting cyber technology. The KMO metric shows whether or not the data supplied for the factor analysis are appropriate for the factor analysis. Bartlett’s test of sphericity determines whether or not the data under examination are suitable for factor analysis. The KMO coefficient is 0.724 (72.4%) which exceeds the minimum required value of 0.70 (70%). This indicates that the factors or benefits are more than enough for factor analysis. Moreover, the p-value of Bartlett’s test of sphericity (0.005) falls within the required 5% significance level of (p < 0.05) at a degree of freedom of 102 and an approximate chi-square of 149.825. This demonstrates that exploratory factor analysis is sufficient for the discovered data on cyber technology’s benefits. Examining the scree plot in Figure 2 reveals a distinct split at the eighth component. The number of components that should be created by the analysis is denoted by the point on the graph where the slope of the curve is levelling off. Observation reveals the existence of eight categories of components.
Table 3 shows the matrices of the eight extracted components about the various identified benefits of cyber technology. The matrices indicate the individual relationship (positive or negative) between each factor and each extracted component. In addition, total variance explained the benefits of cyber technology in the construction industry with the principal component analysis (PCA) extraction method. It reveals the presence of eight components with initial eigenvalues exceeding 1, explaining the 14.23%, 13.92%, 11.85%, 11.05%, 10.78%, 10.69%, 9.94%, and 9.68% variances, respectively (Table 4). Table 5 shows the rotated component matrix of the various benefits of cyber technology adoption in the construction industry. After 21 iterations, the rotation converged with the initial eigenvalues of 1. The highlighted matrices indicate the benefits that have the least variation concerning the initial eigenvalue.
Table 6 shows the factors/benefits that share a common attribute concerning the extracted components. Factors with the same/similar extraction coefficients are grouped in the components. Table 7 shows the various groupings of the benefits of the adoption of cyber technology in construction. The benefits are grouped according to the commonalities of their extraction coefficients. On the other hand, the factor loadings indicate the eigenvalues of each factor with the specified eigenvalue of 1. However, all loading factors are more significant than 0.5 except B4, B13, B9, and B16. Consequently, the accepted groups based on EFA analysis on all 16 items is 7, as follows planning, transparency, efficiency, productivity, and quality.
For the factors determined by EFA, reliability statistics are compiled. Based on the greatest loading of each variable in the structure matrix, variables for each phase of the factor have been established. According to Nunnally [73], for newly formed measurements, an alpha value of Cronbach larger than 0.6 is adequate. In contrast, when the normal value is 0.7, those more than 0.75 are considered to be very accurate. The findings of the alpha Cronbach values are thus suitable since they are more than 0.70. All object average correlations are greater than 0.3, indicating the existence of consistent internal variables [74].

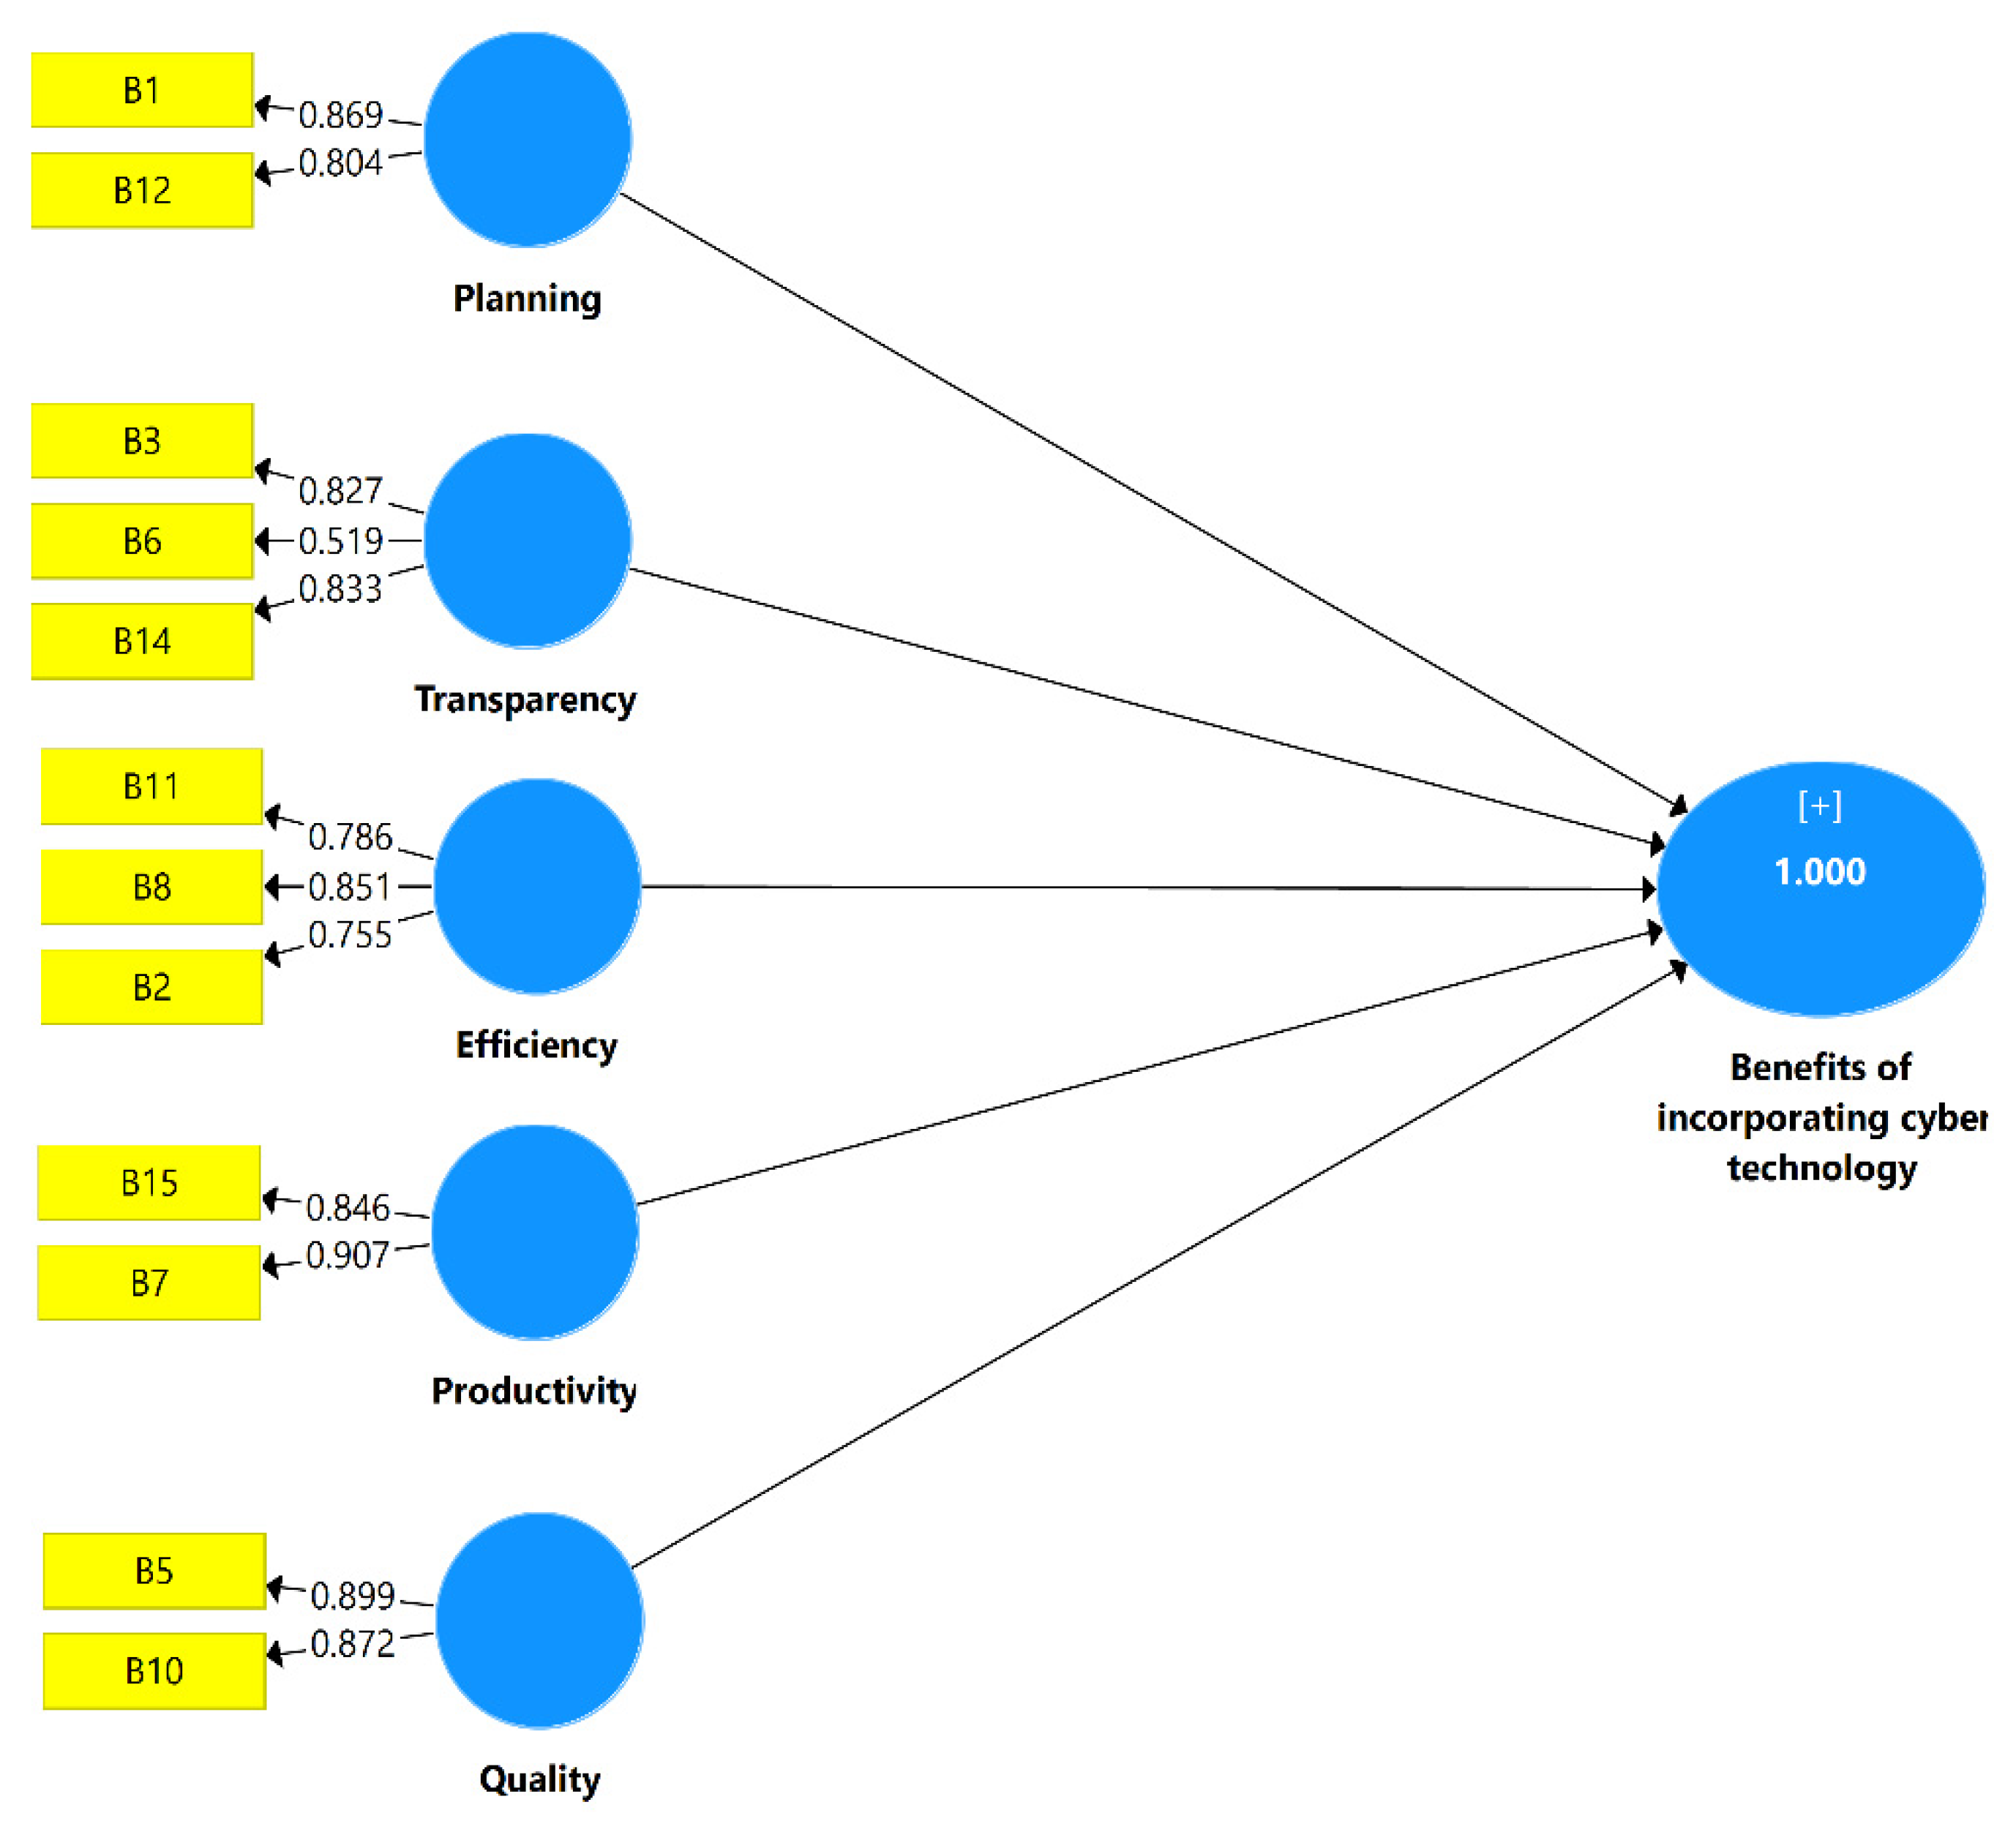
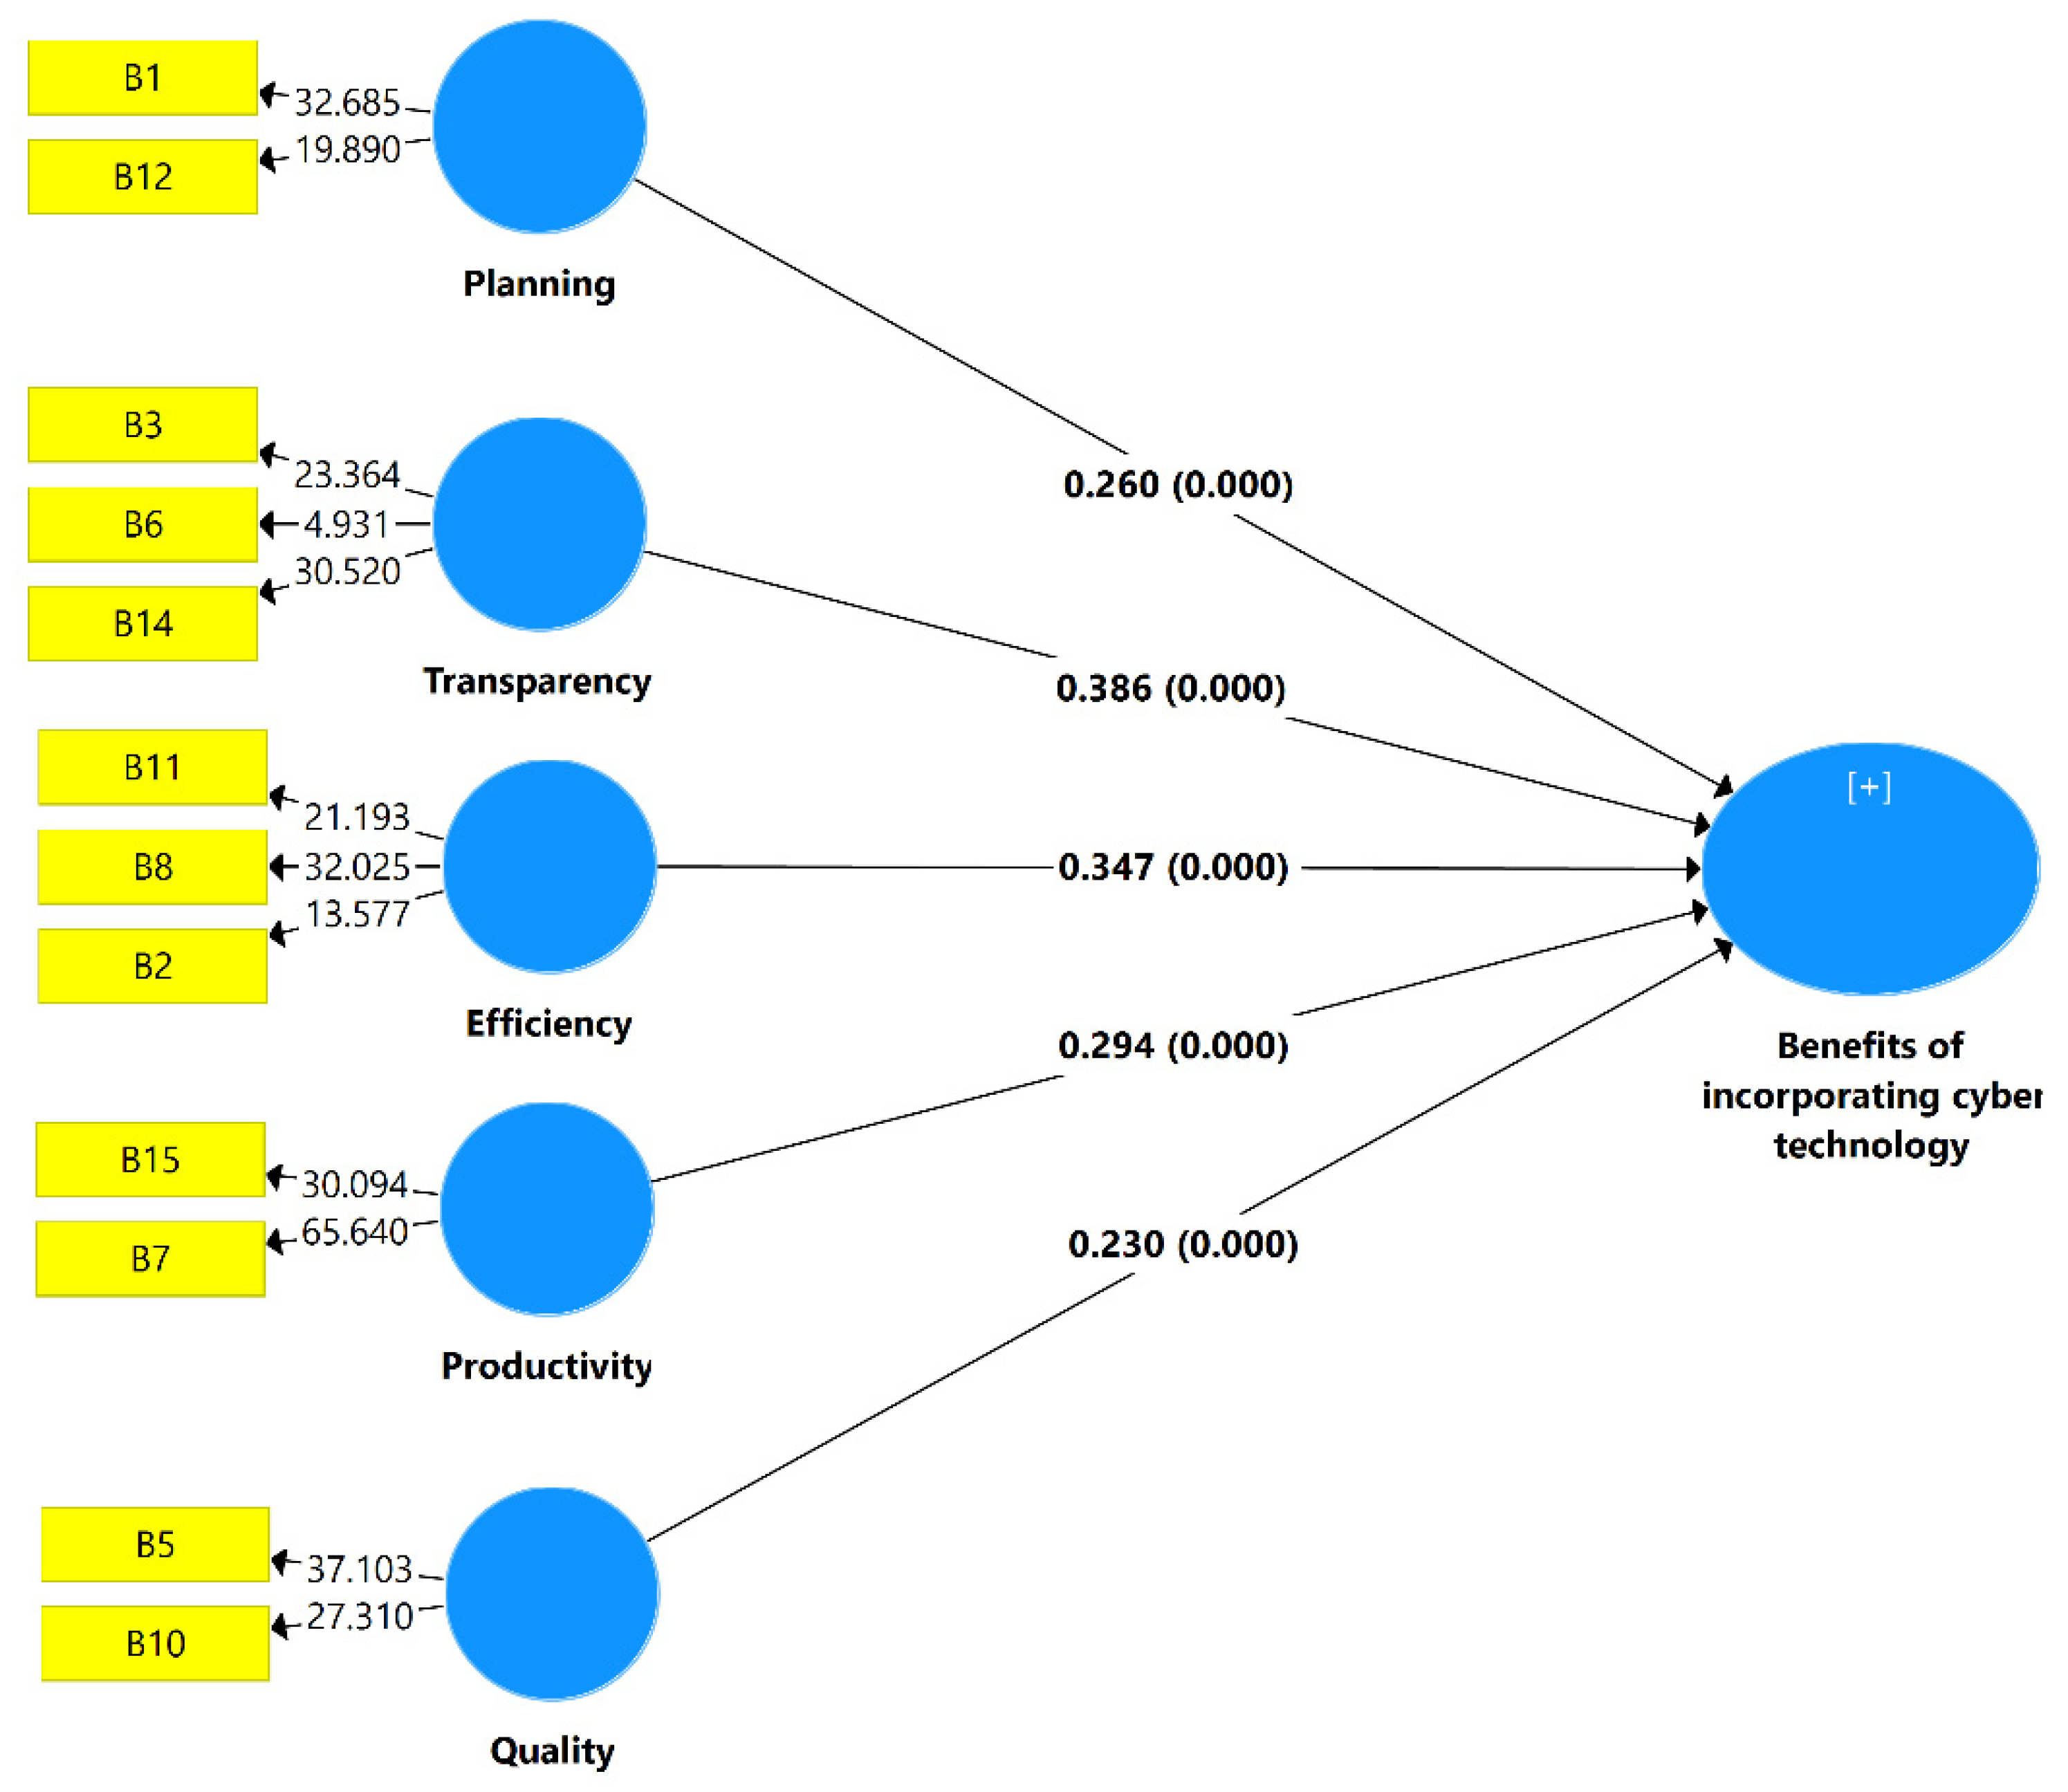
5.3. Measurement Model

Internal reliability, convergent validity, and discriminant validity must be assessed while evaluating reflecting measurement models (CSFs) in PLS-SEM. After establishing the reliability and validity of the measurement model, the structural model will be examined [75]. As illustrated in Table 8, all constructs in the model meet the threshold of α and     ρ c > 0.70 and, therefore, are acceptable [76].
In addition, as shown in Table 4, all structures have passed the AVE test. The appropriate AVE level should be more than 0.5 [53]. Using PLS algorithm 3.0, the estimated AVE values (Table 5) for all components in this investigation are more than 50%. These results indicate that the measurement model is internally convergent and consistent. This shows that the measuring components are appropriately measured for each construct (group) and do not assess any other construct in the study model. High outer loads on a structure suggest a tight connection between the key components of each structure. As a general rule, objects with very low outer loadings (below 0.4) must be routinely removed from the scale [41]. Figure 3 depicts the outside loadings of all measurement models. Consequently, all exterior loads are permitted.
The square root of the AVEs (Table 9) exceeded their correlations with all other constructs, indicating that neither construct is associated with the other. In addition, the data suggest that each predictor has the largest loading (Table 9) on the respective construct. Eventually, a high level of unidimensionality may be ensured for each construct.

5.4. Path Model Validation

Once it is discovered that the benefits of cyber technology constitute a formative construct, the collinearity among the construct’s formative objects is investigated by calculating the value of the variable inflation factor (VIF). All VIF values are substantially below 3.5, indicating that these subdomains separately contribute to the higher-order components. Additionally, the relevance of the route coefficients is predicted using a bootstrapping method. All findings are statistically significant at the 0.01 level for all pathways (Figure 4) [52].

6. Discussion

Despite widespread reliance on cyber technology in construction in many industrialised nations, its use in poorer ones is minimal. Nigeria, like many other developing nations, has had challenges and inconsistencies in construction standards. Although it is anticipated that new technologies will have a significant impact on the industry, it is still difficult to assess the implications and potential benefits of cyber technology, as well as its effects on the various stakeholders, critical components of the supply chain, and the various phases of the life cycle of construction projects [77]. This highlights the need for using cyber technology concepts to address these difficulties. Top management’s acceptance of cyber technology as an important platform/component of their projects will be greatly influenced by practitioners’ understanding of cyber technology and its essential building activities. The suggested model demonstrates that the five cyber technology component benefits have a significant influence on cyber technology deployment. This may improve the viability of residential construction projects. Therefore, by implementing cyber technology, construction companies may save costs and time, as well as improve quality without sacrificing project functions. The next part illustrates how the PLS-SEM model’s components may be used to rank the benefits of cyber technology.

6.1. Transparency

The significance of transparency is crucial. The PLS-SEM model suggests that the “transparency” component has the greatest influence on the benefits of cyber technology deployment, with an external coefficient of 0.386. This first primary component includes benefits such as aiding in the storage of construction lifecycle data, increasing professional communication, and enhancing transparency. Given the numerous parties involved in the construction process, Tang et al. [78] asserted that a large storage capacity sensing system is necessary because an as-built documentation system must be able to capture sufficient data or information for facility management as they are generated during the project. In this instance, a mobile PC with an embedded reader might be used to scan the tags for their identifiers, and as-built data could be appended or connected to the scanned component ID [27]. The tag IDs and accompanying information or documentation may be kept in the project database for future querying and reference. Depending on the component being monitored, operating and maintenance data may be included in enormous document files. With technologies such as cyber technologies, intercommunication and cooperation inside and outside the construction industry’s specialties are improved [79]. This is a significant improvement in building operations that mostly entail vertical communication [19], but this constrains the amount of progress that can be made on a building project. There is an evident need for efficiency in managing the building process, and cyber technologies provide possibly the finest opportunity to enhance the construction process via improved integration and transparency [18]. This justifies its inclusion in the building processes [80].

6.2. Efficiency

The second major component relates to “efficiency”. It includes benefits such as cost and time savings, reduced construction errors, and assistance with project monitoring. With an external coefficient of 0.347, the effect of “efficiency” on the benefits of cyber technology seems to be significant. This indicates that the success rate of deploying cyber technology is greater than the average (medium–high level). An important feature of construction delivery is the capacity to deliver building products on schedule and within budget [81]. Using cyber technology, this can be accomplished. According to Onyegiri et al. [25], cost and time efficiency are key benefits of building technology. Accuracy and efficiency are the primary objectives of integrating technology into building [31]. By simplifying building procedures to well-defined protocols, cyber technologies offer significant assistance to the accomplishment of this purpose. This minimizes the typical number of process mistakes [25]. In addition, on the topic of whether or not the prototype enhances progress monitoring, the evaluators praised the prototype systems and compared them favorably to the current manual method of providing status updates [27]. Nonetheless, a few of the assessors recommended more research into how to determine whether the installed components are genuinely in place, as opposed to just being in the correct spot (e.g., bolted or attached to the connecting member as in the case of steel placement). According to Bosche and Haas [82], there are already sensors that can monitor various placement scenarios (such as steel installation); hence, it may be preferable to employ placement sensors, since this will assist in determining whether components are positioned adjacently. The problem with this sort of sensor is that it only monitors one variable [25].

6.3. Productivity

The third major component relates to “productivity”. On the scale of cyber technology adoption benefits, this factor, which includes benefits such as information exchange and increased productivity and has an external coefficient of 0.29 and ranks third. According to Sabol (2007), the deployment of cyber technology has led to a rise in productivity. This is shown by the different achievements and developments made by individuals who have accepted this evolutionary innovation. In addition, the productivity of works has increased dramatically in comparison to earlier building methods [25]. Construction operations before the present make knowledge exchange among construction experts very difficult [26]. As a result of the intrinsic characteristics of cyber technologies, the use of cyber technologies facilitates the exchange of information among experts [83].

6.4. Planning

The fourth subscale on the scale of cyber technology adoption benefits relates to “planning”. Externally, it has a coefficient of 0.260. This includes benefits such as facilitating construction planning and optimising the intended output. The use of cyber technology in building planning and forecasting is also possible. Multiple construction sites may utilize RFID technologies (e.g., ultra-wideband, chirp spread spectrum), GPS and image-based technologies to collect near misses, close calls, the resources involved, and the site layout [34]. In the project planning phase, these data may be utilized to construct a generalised model that can be optimized to provide dependable and safety-conscious site layout designs [24]. This sort of CPS application promotes the continual collection and analysis of construction data to inform or enhance the planning phase of construction. The cyber–physical systems approach will increase progress monitoring, construction process control, as-built documentation, and environmentally responsible building practices [79]. Akanmu et al. [23] assessed that the output, which is the implementation of the design via efficient construction and maintenance, had been realized in full.

6.5. Quality

“Quality” is the final subscale on the scale of benefits for the deployment of cyber technology. Externally, it has a coefficient of 0.260. This includes benefits such as enhancing the quality and capturing issues in real-time. Cyber technologies improve upon conventional building techniques [23]. Traditional building methods have their drawbacks and downsides. According to Bhave et al. [24], cyber technologies enhance the quality of building processes and products. This is a significant advantage of the invention. Cyber technologies are very vital to the building sector [84]. According to You and Wu [19], it provides a potential for real-time, seamless information flow between the design and construction teams, allowing for swift decision-making in the construction industry.

7. Managerial Implications

Some important “signs” may be generated by reorganizing the benefits of cyber technology implementation. Building stakeholders may find these “signs” helpful in efficiently implementing cyber technology in their projects. Furthermore, this reorganization may be useful for developing a benchmark from which construction players can systematically and efficiently introduce cyber technology. Such a framework may play a significant role in the benefits identified in this study. This, we believe, will enhance productivity and sustainability in the Nigerian construction industry and other developing countries.
By addressing these benefits, stable, sustainable, and efficient construction can be attained within the Nigerian construction industry. Moreover, as most developing countries have similar construction practices, the results presented in this study may also catalyze the adoption of cyber technology in other developing countries. By extension, the reduction in project time and cost can translate to more success in the building industry when robotics is implemented. Notwithstanding the aforementioned gains, this study specifically contributes to knowledge in the building industry in the following ways:
  • A database of the benefits of the implementation of cyber technology and its different components has been presented;
  • Building owners and other key players in the building industry are offered a robust platform for assessing cyber technology implementation to enhance the planning and execution of building projects;
  • A sound scientific proof that provides adequate guidance on the adoption of cyber technology in Nigeria and other developing countries is showcased;
  • Most research efforts have been devoted to the implementation of construction cyber technology in developed nations. However, very limited studies are available for developing nations such as Nigeria. Therefore, our study has assessed the benefits of the implementation of cyber technology in Nigeria and the attendant benefits of enhancing the quality of local projects. Moreover, our study also highlighted the benefits of cyber technology, prominently minimizing construction costs, and efficient cost-spreading to make projects more profitable and successful;
  • A partial least square (PLS-SEM) prediction technique is proposed for assessing the implementation of cyber technology in the Nigerian construction industry and other developing countries. Therefore, decision-makers can rely on the results provided here to deploy robotics.

8. Theoretical Implications

The application of cyber technology for enhancing a project’s success is increasingly becoming popular in many enterprises. In the context of the Nigerian construction sector, our study has been able to provide a model to assess the benefits of implementing cyber technology. Furthermore, the different benefits of applying cyber technology are also analyzed. Likewise, our study provides an important link between the theoretical and practical applications of cyber technology. Therefore, our study is the first to have analyzed and assessed the various benefits of the implementation of cyber technology in the Nigerian construction sector. Furthermore, this study lays a good foundation for further research studies in assessing the benefits of the implementation and adoption of cyber technology in similar developing countries. With the comprehensive theoretical and mathematical analysis presented, the PLS-SEM technique has been applied to identify the five most important components of these benefits. Finally, the foundation laid in this study can be useful for policymakers in mapping out strategies for incorporating robotics into construction.

9. Conclusions

In a great number of nations, cyber technology is seen as a highly beneficial instrument for maximizing monetary value and boosting the goals and sustainability of a project. In contrast, the use of cyber technology in emerging nations is quite limited. Similar to several other emerging nations, Nigeria has seen disparities and anomalies in the quality of housing, especially large-scale projects. Cyber technology is suggested as a remedy for this issue. Therefore, this research has used SEM to estimate the importance of cyber technology’s benefits. EFA analysis has been applied to the identified benefits of cyber technology found via a literature study. The model is then experimentally validated using the PLS-SEM approach and data from 97 Nigerian construction industry experts. The model’s outputs will serve as a guide for construction experts in Nigeria and other poor nations in cutting costs and improving sustainability via the use of cyber technologies by identifying the most important benefits.

Author Contributions

Research Idea: A.F.K. Conceptualization, A.F.K.; methodology, A.F.K.; software, A.F.K.; validation, A.F.K.; formal analysis, A.F.K.; investigation, A.F.K.; resources, all authors.; data curation, all authors.; writing—original draft preparation, A.F.K.; writing—review and editing, all authors.; visualization, all authors.; supervision, A.F.K.; project administration, A.F.K.; funding acquisition, all authors. All authors have read and agreed to the published version of the manuscript.

Funding

This study is supported via funding from Prince Sattam bin Abdulaziz University project number (PSAU/2023/R/1444).

Institutional Review Board Statement

Not applicable.

Informed Consent Statement

Not applicable.

Data Availability Statement

Not applicable.

Conflicts of Interest

The authors declare no conflict of interest.

References

  1. Chan, A.P.; Adabre, M.A. Bridging the gap between sustainable housing and affordable housing: The required critical success criteria (CSC). Build. Environ. 2019, 151, 112–125. [Google Scholar] [CrossRef]
  2. Sbci, U. Buildings and climate change: Summary for decision-makers. In United Nations Environmental Programme, Sustainable Buildings and Climate Initiative; UNEP: Paris, France, 2009; pp. 1–62. [Google Scholar]
  3. Gan, X.; Zuo, J.; Wu, P.; Wang, J.; Chang, R.; Wen, T. How affordable housing becomes more sustainable? A stakeholder study. J. Clean. Prod. 2017, 162, 427–437. [Google Scholar] [CrossRef]
  4. Dezhi, L.; Yanchao, C.; Hongxia, C.; Kai, G.; Hui, E.C.-M.; Yang, J. Assessing the integrated sustainability of a public rental housing project from the perspective of complex eco-system. Habitat Int. 2016, 53, 546–555. [Google Scholar] [CrossRef]
  5. Al-Saadi, R.; Abdou, A. Factors critical for the success of public? private partnerships in UAE infrastructure projects: Experts’ perception. Int. J. Constr. Manag. 2016, 16, 1–15. [Google Scholar] [CrossRef]
  6. Bezuidenhout, L. From Welfare to Community Development-The Role of Local Congregations as Agents of Development in the Mangaung Metropolitan Area; University of the Free State: Bloemfontein, South Africa, 2019. [Google Scholar]
  7. Chan, A.P.C.; Darko, A.; Olanipekun, A.O.; Ameyaw, E.E. Critical barriers to green building technologies adoption in developing countries: The case of Ghana. J. Clean. Prod. 2018, 172, 1067–1079. [Google Scholar] [CrossRef]
  8. Durdyev, S.; Ismail, S.; Ihtiyar, A.; Abu Bakar, N.F.S.; Darko, A. A partial least squares structural equation modeling (PLS-SEM) of barriers to sustainable construction in Malaysia. J. Clean. Prod. 2018, 204, 564–572. [Google Scholar] [CrossRef]
  9. Dimakis, N.; Filippoupolitis, A.; Gelenbe, E. Distributed Building Evacuation Simulator for Smart Emergency Management. Comput. J. 2010, 53, 1384–1400. [Google Scholar] [CrossRef] [Green Version]
  10. Kineber, A.F.; Othman, I.; Oke, A.E.; Chileshe, N.; Buniya, M.K. Identifying and Assessing Sustainable Value Management Implementation Activities in Developing Countries: The Case of Egypt. Sustainability 2020, 12, 9143. [Google Scholar] [CrossRef]
  11. Wolstenholme, A.; Austin, S.; Bairstow, M.; Blumenthal, A.; Lorimer, J.; McGuckin, S.; Davies, R. Never Waste a Good Crisis: A Review of Progress Since Rethinking Construction and Thoughts for Our Future; Loughborough Publications: Leicestershire, UK, 2009. [Google Scholar]
  12. Russell-Smith, S.V.; Lepech, M.D. Cradle-to-gate sustainable target value design: Integrating life cycle assessment and construction management for buildings. J. Clean. Prod. 2015, 100, 107–115. [Google Scholar] [CrossRef]
  13. Jiao, Y.B. The Design of the Logistics Information Sharing Platform Based on Cloud Computing. Adv. Mater. Res. 2013, 734–737, 3220–3223. [Google Scholar] [CrossRef]
  14. Shen, W.; Hao, Q.; Mak, H.; Neelamkavil, J.; Xie, H.; Dickinson, J.; Xue, H. Systems integration and collaboration in architecture, engineering, construction, and facilities management: A review. Adv. Eng. Inform. 2010, 24, 196–207. [Google Scholar] [CrossRef] [Green Version]
  15. Chin, S.; Yoon, S.; Choi, C.; Cho, C. RFID+4D CAD for Progress Management of Structural Steel Works in High-Rise Buildings. J. Comput. Civ. Eng. 2008, 22, 74–89. [Google Scholar] [CrossRef]
  16. Golparvar-Fard, M.; Savarese, S.; Peña-Mora, F. Interactive Visual Construction Progress Monitoring with D4 AR—4D Augmented Reality—Models. In Construction Research Congress 2009: Building a Sustainable Future; ASCE: Reston, VA, USA, 2009; pp. 41–50. [Google Scholar]
  17. Sørensen, E. The Materiality of Learning: Technology and Knowledge in Educational Practice; Cambridge University Press: Cambridge, UK, 2009. [Google Scholar]
  18. Akanmu, A.; Anumba, C.; Messner, J. Active Monitoring and Control of Light Fixtures during Building Construction and Operation: Cyber-Physical Systems Approach. J. Arch. Eng. 2014, 20, 04013008. [Google Scholar] [CrossRef]
  19. You, Z.; Wu, C. A framework for data-driven informatization of the construction company. Adv. Eng. Informatics 2019, 39, 269–277. [Google Scholar] [CrossRef]
  20. Chen, B.; Wan, J.; Shu, L.; Li, P.; Mukherjee, M.; Yin, B. Smart factory of industry 4.0: Key technologies, application case, and challenges. Ieee Access 2017, 6, 6505–6519. [Google Scholar] [CrossRef]
  21. Kaewunruen, S.; Sresakoolchai, J.; Ma, W.; Phil-Ebosie, O. Digital Twin Aided Vulnerability Assessment and Risk-Based Maintenance Planning of Bridge Infrastructures Exposed to Extreme Conditions. Sustainability 2021, 13, 2051. [Google Scholar] [CrossRef]
  22. Oesterreich, T.D.; Teuteberg, F. Understanding the implications of digitisation and automation in the context of Industry 4.0: A triangulation approach and elements of a research agenda for the construction in-dustry. Comput. Ind. 2016, 83, 121–139. [Google Scholar] [CrossRef]
  23. Akanmu, A.; Anumba, C.; Messner, J. Integrating virtual models and physical construction. In Proceedings of the 6th International Conference on Innovation in Architecture, Engineering and Construction; Pennsylvania State University: State College, PA, USA, 2010; pp. 393–402. [Google Scholar]
  24. Bhave, A.; Garlan, D.; Krogh, B.; Rajhans, A.; Schmerl, B. Augmenting software architectures with physical components. In ERTS2 2010, Embedded Real Time Software & Systems; HAL: Bengaluru, India, 2010. [Google Scholar]
  25. Onyegiri, I.; Nwachukwu, C. Information and communication technology in the construction industry. Am. J. Sci. Ind. Res. 2011, 2, 461–468. [Google Scholar] [CrossRef]
  26. Akanmu, A.A.; Anumba, C.J.; Messner, J.I. An RTLS-based approach to cyber-physical systems inte-gration in design and construction. Int. J. Distrib. Sens. Netw. 2012, 8, 596845. [Google Scholar] [CrossRef] [Green Version]
  27. Akanmu, A.; Anumba, C.; Messner, J. Scenarios for cyber-physical systems integration in construction. J. Inf. Technol. Constr. 2013, 18, 240–260. [Google Scholar]
  28. Chen, H.-M.; Chang, K.-C.; Lin, T.-H. A cloud-based system framework for performing online viewing, storage, and analysis on big data of massive BIMs. Autom. Constr. 2016, 71, 34–48. [Google Scholar] [CrossRef]
  29. Wollschlaeger, M.; Sauter, T.; Jasperneite, J. The Future of Industrial Communication: Automation Networks in the Era of the Internet of Things and Industry 4.0. IEEE Ind. Electron. Mag. 2017, 11, 17–27. [Google Scholar] [CrossRef]
  30. Liu, Y.; Xu, X. Industry 4.0 and Cloud Manufacturing: A Comparative Analysis. J. Manuf. Sci. Eng. 2017, 139, 034701. [Google Scholar] [CrossRef]
  31. Al-Rakhami, M.; Alsahli, M.; Hassan, M.M.; Alamri, A.; Guerrieri, A.; Fortino, G. Cost efficient edge intelligence framework using docker containers. In Proceedings of the 2018 IEEE 16th Intl Conf on Dependable, Autonomic and Secure Computing, 16th Intl Conf on Pervasive Intelligence and Computing, 4th Intl Conf on Big Data Intel-ligence and Computing and Cyber Science and Technology Congress (DASC/PiCom/DataCom/CyberSciTech), Athens, Greece, 12–15 August 2018; IEEE: Piscataway, NJ, USA; pp. 800–807. [Google Scholar]
  32. Gu, W.; Foster, K.; Shang, J.; Wei, L. A game-predicting expert system using big data and machine learning. Expert Syst. Appl. 2019, 130, 293–305. [Google Scholar] [CrossRef]
  33. de Soto, B.G.; Georgescu, A.; Mantha, B.; Turk, Ž.; Maciel, A. Construction Cybersecurity and Critical Infrastructure Protection: Significance, Overlaps, and Proposed Action Plan. Preprints 2020, 2020050213. [Google Scholar] [CrossRef]
  34. Queiroz-Sousa, P.O.; Salgado, A.C. A Review on OLAP Technologies Applied to Information Networks. ACM Trans. Knowl. Discov. Data 2019, 14, 1–25. [Google Scholar] [CrossRef]
  35. You, Z.; Feng, L. Integration of Industry 4.0 Related Technologies in Construction Industry: A Framework of Cyber-Physical System. IEEE Access 2020, 8, 122908–122922. [Google Scholar] [CrossRef]
  36. Henseler, J.; Hubona, G.; Ray, P.A. Using PLS path modeling in new technology research: Updated guidelines. Ind. Manag. Data Syst. 2016, 116, 2–20. [Google Scholar] [CrossRef]
  37. Banihashemi, S.; Hosseini, M.R.; Golizadeh, H.; Sankaran, S. Critical success factors (CSFs) for integration of sustainability into construction project management practices in developing countries. Int. J. Proj. Manag. 2017, 35, 1103–1119. [Google Scholar] [CrossRef]
  38. Lee, C.; Hallak, R. Investigating the moderating role of education on a structural model of restaurant performance using multi-group PLS-SEM analysis. J. Bus. Res. 2018, 88, 298–305. [Google Scholar] [CrossRef]
  39. Hult, G.T.M.; Hair, J.F.; Proksch, D.; Sarstedt, M.; Pinkwart, A.; Ringle, C.M. Addressing Endogeneity in International Marketing Applications of Partial Least Squares Structural Equation Modeling. J. Int. Mark. 2018, 26, 1–21. [Google Scholar] [CrossRef]
  40. Hair, J.F., Jr.; Matthews, L.M.; Matthews, R.L.; Sarstedt, M. PLS-SEM or CB-SEM: Updated guidelines on which method to use. Int. J. Multivar. Data Anal. 2017, 1, 107–123. [Google Scholar] [CrossRef]
  41. Hair, J.F.; Ringle, C.M.; Sarstedt, M. PLS-SEM: Indeed a silver bullet. J. Mark. Theory Pract. 2011, 19, 139–152. [Google Scholar] [CrossRef]
  42. Podsakoff, P.M.; MacKenzie, S.B.; Lee, J.-Y.; Podsakoff, N.P. Common method biases in behavioral research: A critical review of the literature and recommended remedies. J. Appl. Psychol. 2003, 88, 879–903. [Google Scholar] [CrossRef] [PubMed]
  43. Glick, W.H.; Jenkins, G.D., Jr.; Gupta, N. Method versus substance: How strong are underlying rela-tionships between job characteristics and attitudinal outcomes? Acad. Manag. J. 1986, 29, 441–464. [Google Scholar] [CrossRef]
  44. Strandholm, K.; Kumar, K.; Subramanian, R. Examining the interrelationships among perceived envi-ronmental change, strategic response, managerial characteristics, and organizational performance. J. Bus. Res. 2004, 57, 58–68. [Google Scholar] [CrossRef]
  45. Williams, L.J.; Cote, J.A.; Buckley, M.R. Lack of method variance in self-reported affect and perceptions at work: Reality or artifact? J. Appl. Psychol. 1989, 74, 462. [Google Scholar] [CrossRef]
  46. Podsakoff, P.M.; Organ, D.W. Self-Reports in Organizational Research: Problems and Prospects. J. Manag. 1986, 12, 531–544. [Google Scholar] [CrossRef]
  47. Williams, B.; Onsman, A.; Brown, T. Exploratory factor analysis: A five-step guide for novices. Australas. J. Paramed. 2010, 8. [Google Scholar] [CrossRef] [Green Version]
  48. Thompson, B. Exploratory and Confirmatory Factor Analysis: Understanding Concepts and Applications; American Psychological Association: Washington, DC, USA, 2004; p. 10694. [Google Scholar]
  49. Costello, A.B.; Osborne, J. Best practices in exploratory factor analysis: Four recommendations for getting the most from your analysis. Pract. Assess. Res. Eval. 2005, 10, 7. [Google Scholar]
  50. Kineber, A.F.; Massoud, M.M.; Hamed, M.M.; Alhammadi, Y.; Al-Mhdawi, M.K.S. Impact of Overcoming BIM Implementation Barriers on Sustainable Building Project Success: A PLS-SEM Approach. Buildings 2023, 13, 178. [Google Scholar] [CrossRef]
  51. Al-Ashmori, Y.Y.; Othman, I.; Rahmawati, Y.; Amran, Y.H.M.; Sabah, S.H.A.; Rafindadi, A.D.; Mikić, M. BIM benefits and its influence on the BIM implementation in Malaysia. Ain Shams Eng. J. 2020, 11, 1013–1019. [Google Scholar] [CrossRef]
  52. Hulland, J. Use of partial least squares (PLS) in strategic management research: A review of four recent studies. Strateg. Manag. J. 1999, 20, 195–204. [Google Scholar] [CrossRef]
  53. Fornell, C.; Larcker, D.F. Evaluating structural equation models with unobservable variables and meas-urement error. J. Mark. Res. 1981, 18, 39–50. [Google Scholar] [CrossRef]
  54. Nunnally, J.C.; Bernstein, I. Psychometric Theory McGraw-Hill New York. In The Role of University in the Development of Entrepreneurial Vocations: A Spanish Study; McGraw-Hill: New York, NY, USA, 1978. [Google Scholar]
  55. Wong, K.K.-K. Partial least squares structural equation modeling (PLS-SEM) techniques using SmartPLS. Mark. Bull. 2013, 24, 1–32. [Google Scholar]
  56. Alkilani, S.G.R.Z. Performance Measurement and Improvement Model for Small and Medium Contractors in Developing Countries. Ph.D. Thesis, School of Construction Management and Property, The University of New South Wales, Kensington, Australia, 2018. [Google Scholar]
  57. Kineber, A.F.; Oke, A.E.; Elseknidy, M.; Hamed, M.M.; Kayode, F.S. Barriers to the Implementation of Radio Frequency Identification (RFID) for Sustainable Building in a Developing Economy. Sustainability 2023, 15, 825. [Google Scholar] [CrossRef]
  58. Al-Mekhlafi, A.-B.A.; Isha, A.S.N.; Chileshe, N.; Abdulrab, M.; Kineber, A.F.; Ajmal, M. Impact of Safety Culture Implementation on Driving Performance among Oil and Gas Tanker Drivers: A Partial Least Squares Structural Equation Modelling (PLS-SEM) Approach. Sustainability 2021, 13, 8886. [Google Scholar] [CrossRef]
  59. Buniya, M.; Othman, I.; Durdyev, S.; Sunindijo, R.; Ismail, S.; Kineber, A. Safety Program Elements in the Construction Industry: The Case of Iraq. Int. J. Environ. Res. Public Health 2021, 18, 411. [Google Scholar] [CrossRef]
  60. Buniya, M.K.; Othman, I.; Sunindijo, R.Y.; Kineber, A.F.; Mussi, E.; Ahmad, H. Barriers to safety program implementation in the construction industry. Ain Shams Eng. J. 2020, 12, 65–72. [Google Scholar] [CrossRef]
  61. Kineber, A.F.; Oke, A.E.; Alyanbaawi, A.; Abubakar, A.S.; Hamed, M.M. Exploring the Cloud Computing Implementation Drivers for Sustainable Construction Projects—A Structural Equation Modeling Approach. Sustainability 2022, 14, 14789. [Google Scholar] [CrossRef]
  62. Rady, M.; Kineber, A.F.; Hamed, M.M.; Daoud, A.O. Partial Least Squares Structural Equation Modeling of Constraint Factors Affecting Project Performance in the Egyptian Building Industry. Mathematics 2023, 11, 497. [Google Scholar] [CrossRef]
  63. Kineber, A.F.; Othman, I.; Oke, A.E.; Chileshe, N.; Zayed, T. Exploring the value management critical success factors for sustainable residential building—A structural equation modelling approach. J. Clean. Prod. 2021, 293, 126115. [Google Scholar] [CrossRef]
  64. Kineber, A.F.; Othman, I.B.; Oke, A.E.; Chileshe, N. Modelling the relationship between value management’s activities and critical success factors for sustainable buildings. J. Eng. Des. Technol. 2021. [Google Scholar] [CrossRef]
  65. Badewi, A. Investigating Benefits Realisation Process for Enterprise Resource Planning Systems. Ph.D. Thesis, Cranfield University, Cranfield, UK, 2016. [Google Scholar]
  66. Yin, R.K. Case Study Research: Design and Methods, 4th ed.; Applied social research methods series; 2009; Volume 5. [Google Scholar]
  67. Kothari, C. Research Methodology Methods and Techniques 2nd Revised edition New Age International publishers. Retrieved Febr. 2009, 20, 2018. [Google Scholar]
  68. Wahyuni, D. The research design maze: Understanding paradigms, cases, methods and methodologies. J. Appl. Manag. Account. Res. 2012, 10, 69–80. [Google Scholar]
  69. Sharma, S. Applied Multivariate Techniques; John Wiley and Sons: Hoboken, NJ, USA, 1996. [Google Scholar]
  70. Tabachnick, B.G.; Fidell, L.S.; Ullman, J.B. Using Multivariate Statistics; Pearson: Boston, MA, USA, 2007. [Google Scholar]
  71. Tavakol, M.; Dennick, R. Making sense of Cronbach’s alpha. Int. J. Med. Educ. 2011, 2, 53. [Google Scholar] [CrossRef]
  72. Pallant, J. SPSS Survival Manual, 3rd ed.; McGrath Hill: New South Wales, Australia, 2007; Volume 15. [Google Scholar]
  73. Nunnally, J.C. Psychometric Theory 3; Tata McGraw-Hill Education: New York, NY, USA, 1994. [Google Scholar]
  74. Field, A. Discovering Statistics Using SPSS (3. Baskı); Sage Publications: New York, NY, USA, 2009. [Google Scholar]
  75. Hair, J.F.; Black, W.C.; Babin, B.J.; Anderson, R.E.; Tatham, R.L. Multivariate Data Analysis; Upper Saddle River; Pearson Prentice Hall: Hoboken, NJ, USA, 2006; Volume 6. [Google Scholar]
  76. Hair, J.F., Jr.; Hult, G.T.M.; Ringle, C.; Sarstedt, M. A Primer on Partial Least Squares Structural Equation Modeling (PLS-SEM); Sage Publications: Thousand Oaks, CA, USA, 2016. [Google Scholar]
  77. Mantha, B.R.; de Soto, B.G. Cyber security challenges and vulnerability assessment in the construction industry. In Proceedings of the Creative Construction Conference 2019, Budapest, Hungary, 29 June–2 July 2019; pp. 29–37. [Google Scholar]
  78. Tang, L.-A.; Yu, X.; Kim, S.; Han, J.; Hung, C.-C.; Peng, W.-C. Tru-Alarm: Trustworthiness Analysis of Sensor Networks in Cyber-Physical Systems. In Proceedings of the 2010 IEEE International Conference on Data Mining, Sydney, NSW, Australia, 13–17 December 2010; IEEE: Piscataway, NJ, USA; pp. 1079–1084. [Google Scholar]
  79. Fan, X.; Fan, K.; Wang, Y.; Zhou, R. Overview of cyber-security of industrial control system. In Proceedings of the 2015 international conference on cyber security of smart cities, industrial control system and communications (SSIC), Shanghai, China, 5–7 August 2015; IEEE: Piscataway, NJ, USA; pp. 1–7. [Google Scholar]
  80. Gu, J.-C.; Ling, Z.-H.; Zhu, X.; Liu, Q. Dually Interactive Matching Network for Personalized Response Selection in Retrieval-Based Chatbots. 2019, 1845–1854. [Google Scholar] [CrossRef] [Green Version]
  81. El-Omari, S.; Moselhi, O.J.A. Integrating automated data acquisition technologies for progress re-porting of construction projects. Autom. Constr. 2011, 20, 699–705. [Google Scholar] [CrossRef] [Green Version]
  82. Bosche, F.; Haas, C. Automated retrieval of 3D CAD model objects in construction range images. Autom. Constr. 2008, 17, 499–512. [Google Scholar] [CrossRef]
  83. Liu, C.; Xu, X. Cyber-physical machine tool–the era of machine tool 4.0. Procedia Cirp 2017, 63, 70–75. [Google Scholar] [CrossRef]
  84. Demiralp, G.; Guven, G.; Ergen, E. Analyzing the benefits of RFID technology for cost sharing in construction supply chains: A case study on prefabricated precast components. Autom. Constr. 2012, 24, 120–129. [Google Scholar] [CrossRef]
Figure 1. Research design.
Sustainability 15 02458 g001
Figure 2. The scree plot of loadings of the benefits of cyber technology in the construction industry.
Sustainability 15 02458 g002
Figure 3. The PLS-SEM model.
Sustainability 15 02458 g003
Figure 4. Path model.
Sustainability 15 02458 g004
Table 1. Summary of the benefits of cyber technology adoption in the construction sector.
CodeVARIABLES[23][24][25][26][27][28][29][30][31][20][32][33][34][35]
B1Construction Planning** * * *
B2Project Monitoring* ** *
B3Storage of construction life cycle data * * * *
B4Saves Time and Cost** * * * *
B5Increase in quality* ** * *
B6Increased collaboration among the professionals * *
B7Increased productivity * * * * *
B8Reduced construction error * * * *
B9Increased revenue** * * *
B10Captures challenges in real time * *
B11Cost and time efficiency* * * *
B12Maximizes the desired outcome * * *
B13It aids in competitive advantage* ** * * *
B14Improved transparency* * *
B15Information sharing* * * ** *
B16It ensures reduced paperwork* * * ** **
Table 2. KMO and Bartlett’s test coefficients of the benefits.
Kaiser–Meyer–Olkin (KMO) Measure of Sampling Adequacy.0.724
Bartlett’s Test of SphericityApprox. Chi-Square149.825
df.102
Sig.0.005
Table 3. Benefits component matrix.
BenefitsComponent
12345678
F10.1730.1820.7730.041−0.312−0.307−0.197−0.067
F20.1310.389−0.3530.6370.0490.4140.1010.192
F30.1450.0590.4970.628−0.390−0.1650.3450.090
F4−0.6920.3430.314−0.2310.2490.2830.151−0.010
F5−0.706−0.472−0.030−0.2500.054−0.0360.308−0.190
F60.736−0.4920.2340.0710.2190.1670.1640.005
F70.5030.2320.092−0.0340.563−0.0080.174−0.486
F8−0.220−0.4530.2960.1460.3710.411−0.2580.420
F9−0.4460.400−0.3190.3840.258−0.261−0.438−0.018
F100.477−0.528−0.3700.169−0.2990.2750.173−0.115
F11−0.2080.395−0.241−0.420−0.402−0.0050.3430.446
F120.0630.7670.2910.1890.2950.0840.2660.146
F130.6210.0800.159−0.5010.343−0.0800.0910.365
F140.3560.1980.241−0.292−0.3750.454−0.511−0.036
F150.2970.730−0.184−0.217−0.2070.2940.040−0.334
F160.7010.121−0.400−0.0710.126−0.413−0.1160.258
Extraction Method: Principal component analysis.
Table 4. Benefits total variance explained.
ComponentInitial EigenvaluesRotation Sums of Squared Loadings
Total% of
Variance
Cumulative
%
Total% of
Variance
Cumulative %
13.45321.58221.5822.27714.23114.231
22.80617.53639.1182.22713.91928.150
31.87711.72950.8471.89711.85440.004
41.72310.77061.6171.76711.04551.049
51.5429.63971.2561.72410.77861.827
61.1917.44478.7011.71010.68772.514
71.1056.90685.6071.5909.93782.451
81.0456.52992.1351.5499.68492.135
Table 5. Benefits’ rotated component matrix.
BenefitsFactors Component
12345678
Aids construction planningF10.0620.209−0.0090.0340.759−0.3690.1020.353
Helps in the storage of construction lifecycle dataF20.049−0.008−0.1460.0230.0190.946−0.0050.011
Increase in qualityF3−0.087−0.0400.1330.0090.9280.253−0.018−0.145
Aids project monitoringF4−0.5510.738−0.065−0.080−0.176−0.047−0.143−0.013
Increased collaboration among the professionalsF5−0.630−0.0320.058−0.124−0.279−0.413−0.152−0.482
Increased productivityF60.316−0.2770.686−0.2440.1150.0560.4730.019
Saves a lot of time and costF70.2450.2780.2500.361−0.1180.0790.741−0.047
Reduced construction error F8−0.1580.0880.096−0.916−0.1140.0770.0920.068
Increased revenueF90.0270.179−0.911−0.025−0.1120.1920.070−0.128
Captures challenges in real timeF100.024−0.7870.4220.048−0.0740.2590.0730.000
Cost and time efficiencyF110.0600.2300.1040.302−0.1160.050−0.858−0.015
Maximizes the desired outcomeF120.1340.7660.0060.1870.2400.4440.0670.007
It aids in competitive advantageF130.7090.3120.519−0.050−0.144−0.1630.0330.119
Improved transparencyF140.043−0.0430.1310.0360.021−0.033−0.0320.946
Information sharingF150.0410.2120.0430.740−0.1430.303−0.0070.487
It ensures reduced paperworkF160.922−0.195−0.0100.189−0.0870.0610.030−0.038
Extraction Method: Principal component analysis. Rotation Method: Varimax with Kaiser Normalization. Rotation converged in 11 iterations.
Table 6. Commonalities of the benefits to the extracted components.
Commonalities
BenefitsExtraction
F10.892
F20.944
F30.966
F40.908
F50.911
F60.935
F70.912
F80.862
F90.946
F100.861
F110.892
F120.900
F130.966
F140.908
F150.945
F160.930
Extraction Method: Principal component analysis.
Table 7. Component factor/benefits groups.
S/NComponent FactorsCodeBenefitsFactor Loadings
1Component 1B1Aids construction planning0.759
B12Maximizes the desired outcome0.766
2Component 2B3Helps in the storage of construction lifecycle data0.946
B6Increased collaboration among the professionals0.068
B14Improved transparency0.946
3Component 3B11Cost and time efficiency0.602
B8Reduced construction error0.096
B2Aids project monitoring0.738
4Component 4B4 *Saves a lot of time and cost0.341
5Component 5B13 *It aids in competitive advantage0.309
B9 *Increased revenue0.192
6Component 6B15Information sharing0.740
B7Increased productivity0.686
7Component 7B16 *It ensures reduced paperwork0.322
8Component 8B5Increase in quality0.928
B10Captures challenges in real time0.522
* These items were excluded due to low-loading.
Table 8. The result of convergent validity.
ConstructsCronbach’s AlphaComposite
Reliability
AVE
Planning0.7740.8240.701
Transparency0.7010.7780.549
Efficiency0.7610.8400.628
Productivity0.7030.8690.769
Quality0.7250.8790.784
Table 9. Discriminant validity.
Constructs EfficiencyPlanningProductivityQualityTransparency
Efficiency0.799
Planning0.120.837
Productivity0.2980.2340.877
Quality0.2470.1150.2250.885
Transparency0.2550.6180.3830.2330.741
Disclaimer/Publisher’s Note: The statements, opinions and data contained in all publications are solely those of the individual author(s) and contributor(s) and not of MDPI and/or the editor(s). MDPI and/or the editor(s) disclaim responsibility for any injury to people or property resulting from any ideas, methods, instructions or products referred to in the content.

