Article

Exploring Pedestrian Satisfaction in Old and New Town: An Impact-Asymmetry Analysis

1
School of Landscape Architecture, Northeast Forestry University, Harbin 150040, China
2
School of Architecture and Urban Planning, Huazhong University of Science and Technology, Wuhan 430074, China
3
CAUPD Beijing Planning and Design Consultants Co., Ltd., Hainan Branch, Haikou 570100, China
4
Northwest Electric Power Design Institute Co., Ltd. Institutional, Xian 710075, China
5
Heilongjiang Province Urban Planning Survey and Design Institute, Harbin 150040, China
*
Author to whom correspondence should be addressed.
Sustainability 2023, 15(3), 2414; https://doi.org/10.3390/su15032414
Submission received: 12 November 2022 / Revised: 12 January 2023 / Accepted: 25 January 2023 / Published: 29 January 2023

Abstract

:
In the context of the global construction of low-carbon cities and residents’ pursuit of healthy living, the improvement in the urban walking environment has gradually been emphasized in the field of planning and transportation research. Using Harbin, China, as an example, this paper combines gradient boosting decision trees (GBDTs) and impact-asymmetry analysis (IAA) methods to explore the differences in residents’ preferences for the pedestrian environment needs in old and new urban areas, analyze the asymmetric relationship between walking environment factors and overall satisfaction, and provide a sound basis for the renewal and reconstruction of the walking environment in old urban areas and the improvement of the walking environment in new urban areas. The factors affecting the pedestrian environment in the old and new urban areas are similar and different, with the aesthetics and safety and the aesthetics and comfort of the pedestrian environment having a greater impact on the old and new urban areas, respectively. According to the results of the IAA, the old city should focus on improving green landscaping, street furniture, the uncivilized behavior of pedestrians, pavement encroachment, barrier-free facilities, and the speed of motor vehicles; the new city should focus on improving the building facade effect, the uncivilized behavior of pedestrians, and green landscaping.

1. Introduction

With the rapid social and economic development and the increasing improvement of people’s living standards, people are increasingly pursuing healthy living environments and lifestyles. Walking as a low-carbon, healthy, and safe way to travel is also increasingly valued as a short-distance alternative to the car, which can alleviate traffic congestion, greenhouse gas emissions, energy consumption, and other problems, and is significant to sustainable urban development. Walking has been hailed by the WHO as the best exercise in the world, reducing the risk of chronic diseases such as diabetes, hypertension, obesity, and coronary heart disease [1,2,3]. Simultaneously, walking is essential in promoting neighborhood communication, enhancing residents’ sense of belonging, and meeting their spiritual needs [4,5].
The street is the most important pedestrian space in the city, and the quality of its environment directly impacts the pedestrian experience [6]. With motor vehicle ownership rising annually, and the number of people driving motor vehicles increasing, car-driven transport has become the dominant mode of development [7,8], with pedestrian scale gradually being replaced by car scale, thus neglecting the construction of the pedestrian environment [9]. An unfriendly walking environment can lead to inequitable access to green spaces and affect the physical and mental health of residents in disadvantaged communities [10]. Among the newly built enclosed settlements and the traditional unit-based settlements, the enclosed settlements have better access to green spaces, and most of the enclosed settlements have green areas or gardens to meet the needs of the residents close to the natural environment. In contrast, the old settlements rely almost entirely on the parks outside the settlements or the only greenery on the pavements for access to the natural environment. The distance to the parks and the quality of the greenery on the pavements are particularly important for the residents of the old settlements. The unfriendly walking environment will also lead to a long distance for people to reach the bus station, making it difficult for people to meet their needs for work, resulting in unequal employment opportunities for people, and further leading to a more serious income difference [11]. Inadequate safety of the walking environment, inadequate pavement facilities, and poor walking comfort can force people to take detours for a better walking environment [12,13,14]. This fails to protect the rights and interests of pedestrians and also affects the development of the city to a certain extent. Therefore, it is imperative to improve the quality of service in the pedestrian environment. In order to formulate a reasonable response to the optimization of the pedestrian environment, the differentiation of the pedestrian environment between new and old urban areas must be addressed in urban regeneration. Differences exist between new and old urban areas regarding neighborhood scale, road network density, population structure, and the standard and level of pavement construction. In the absence of unified standards for pedestrian environment optimization, it is necessary to investigate the demand preferences of residents in new and old urban areas for a pedestrian environment. The interrelationship between different factors of the travel environment and the satisfaction of residents in the new and old urban areas should be analyzed to improve the overall satisfaction of walking trips, and to study the countermeasures for the differentiation of the walking environment in the new and old urban areas.
This study compares residents’ satisfaction with the pedestrian environment in the new and old urban areas of Harbin, China, integrating gradient boosting decision trees and impact asymmetric analysis to answer the following questions: (1) Which factors of the pedestrian environment are critical to residents’ satisfaction? (2) Do these factors affect residents’ satisfaction in a non-linear manner? (3) Which factors require prioritization for improvement in order to increase resident satisfaction? To what level of improvement? (4) What are the differences in the improvement of factors in the old and new urban areas?
This study makes two contributions to pedestrian satisfaction research. First, it revealed that there were different pedestrian satisfaction factors in the new and old urban areas. The old urban area residents paid greater attention to the walking environment’s safety and aesthetics, whereas the new urban area residents paid greater attention to the walking environment’s comfort and aesthetics. Second, by combining GBDTs with IAA, it was found that most walking environment factors had a non-linear relationship with resident satisfaction, which challenges the linear assumptions that had been commonly assumed in previous studies. The factor asymmetry highlighted a priority for walking environment improvements.

2. Literature Review

Lu (2013) used the Walkability Index to analyze the impact of the layout of daily service facilities on walkability in Shanghai’s Pujiang Road and make suggestions for improving the layout of daily service facilities to improve residents’ satisfaction [15]. Zhao et al. (2014) used 34 typical pavements around Beijing underground stations as examples and constructed an evaluation method for the pedestrian level of service based on pedestrian demand using orderly logistic regression analysis. The significance of the model indicates that environmental conditions, pedestrian flow rate, frequency of obstacles, and separation of motor vehicles from pavements significantly impact the pavement service level [16]. Kim, Park, and Lee (2014) evaluated the effect of the pedestrian environment on pedestrian satisfaction using multilevel models in Seoul, Korea. The results showed that intersection density, hilliness, and the presence of bus stops significantly affected pedestrian satisfaction [17]. Chen et al. (2017) explored the influence of neighborhood construction environmental variables on various types of pedestrian activities through correlation analysis, a base model based on logistic regression equations, and a prediction model based on multiple linear stepwise regression equations using 21 living neighborhoods in the central city of Shanghai as examples, and the analysis results showed that environmental variables such as population density, the density of shops along the streets, and the density of bus routes had significant effects on residents’ pedestrian movement [18]. Zhou (2017) studied 16 pedestrian spaces in Melbourne, Australia, selecting 12 factors affecting the pedestrian environment, and conducting a Spearman correlation analysis between these factors and the number of pedestrians. The analysis concluded that the pavement signage system, the number of public transport stops, the number of dining facilities, the number of shops, and the number of pavement seats were the main factors affecting the pedestrian environment [19]. Ji and Zhang (2020) used the Shaocheng District of Chengdu City as an example to analyze the correlation between urban spatial form indicators and walk score. The results showed that accessibility, intersection density, road density, and functional mix strongly influence walkability [20]. Tan, Cao, and Yang (2020) took the Nan’an District, in Chongqing City, as an example. Using correlation analysis and logistic regression analysis to evaluate data from 2738 field survey studies from 10 residential streets, the study found 9 kinds of pedestrian environment factors that significantly affect residents’ walking trips: the density of pedestrian access, the density of bus routes, the near-line rate of roadside buildings, the average pedestrian access distance, a square area within a 500 m walking distance, the distance to the nearest garden, the green shade ratio, the density of street intersections, and the mixed proportion of differently aged residential buildings [21]. Long et al. (2021) constructed an index system for evaluating the pedestrian environment of urban streets, combining street images and virtual audits to evaluate the pedestrian environment of 12,740 urban streets in 71 urban vitality centers in China, showing that the majority of cities still have deficiencies in safety, convenience, and aesthetics [22]. According to recent studies related to improving pedestrian walkability, there is less research related to differentiating the pedestrian environment in new and old urban areas in cities; the improvement measures proposed in previous studies may not be applicable to new and old urban areas under different construction backgrounds. Most studies are based on linear assumptions, ignoring the potential non-linearity of service factors on the actual perception of pedestrians. According to the three-factor theory (Figure 1), factors of service and overall satisfaction can be divided into three different forms: One is linear, where the good or poor performance of the factors directly affects the overall satisfaction showing a correspondingly high or low level. The other two are non-linear, in which when the factor performs poorly it causes a significant reduction in overall satisfaction; when it performs well it barely affects overall satisfaction. This category is considered to be the basic factor that should exist as a matter of course, meeting such factors will reduce dissatisfaction. Another type has little or no effect on overall satisfaction when it performs poorly. When it performs well, the overall satisfaction will be significantly improved; such factors are considered to be “value-adding” exciting factors and meeting such factors will bring surprise and happiness. This classification of factors for service attributes makes the results of linear regression somewhat flawed. In addition, judging the significance of a factor’s impact based on its p-value ignores the actual impact of the factor itself; a statistically significant impact does not necessarily mean that a critical impact exists, and factors with a larger actual impact effect on overall satisfaction tend to need more attention [23,24,25].
Recent research focused on satisfaction with slow-moving transport has employed a GBDT to calculate the service attribute impacts on satisfaction. The GBDT relies on the relative influence of the independent variable rather than the p-value to determine the independent variables’ significances [26], with its response depending on the independent variable values on the upper level [27], which assists in resolving the multicollinearity problems found in traditional regression analysis and provides more accurate predictions [28]. When the GBDT is combined with impact asymmetric analysis, the need for factor improvements becomes clearer. Dong et al. (2019) used impact asymmetric analysis to compare pedestrian satisfaction within gated and open communities, finding that there were significant differences in the walkability factors, most of which generally had non-linear effects on resident satisfaction. Consequently, because of the factor asymmetry and the demand differences, different improvement measures were suggested for the gated and open communities [29]. Wu, Cao, and Ding (2020) used GBDT and impact asymmetric analysis to examine public transport services and found that passenger satisfaction and many BRT service factors had non-linear effects; therefore, they provided priority improvement measures based on the factor asymmetries and impact degrees [30]. Fang et al. (2021) combined a GBDT model and impact asymmetric analysis to identify the public transport service factors that affected passenger satisfaction, and found an asymmetric relationship between the bus service elements and passenger satisfaction, for which they provided optimized respective countermeasures for retaining choice and ensuring captive riders [31]. Lan et al. (2022) also used a GBDT and impact asymmetric analysis to assess the satisfaction of older people and found that as most public transport service factors were asymmetrically related, the public transport optimization measures needed to be based on the factors’ influence ranges and asymmetric properties [32]. Therefore, GBDT/impact asymmetric analysis combinations have been widely used to study people’s satisfaction with slow-moving traffic. Similarly, to provide reasonable optimization countermeasures for new and old urban areas in Harbin, China, this study employed a GBDT and impact asymmetric analysis to investigate the non-linear influence of the pedestrian environment service factors on resident satisfaction.

3. Research Method

3.1. Impact-Asymmetry Analysis

IAA is based on the three-factor theory. First, each perceived factor is recoded into two sets of dummy variables according to the level of satisfaction scores in the scale by Penalty-Reward-Contrast Analysis [33], indicating the high- and low-level performances of the service factor, respectively. Subsequently, regression analysis is conducted on these two pairs of dummy variables and dependent variables (by default, high levels of performance generate rewards and low levels of performance generate penalties) to produce two pairs of regression coefficients, the Reward Index (RI) and the Penalty Index (PI). The RIOS (Range of the impact on overall satisfaction) and IA index (impact-asymmetry index) of factors are calculated as follows:
Range of the impact on overall satisfaction (RIOS) = RI + |PI|
Satisfaction-generating potential (SGP) = RI/RIOS
Dissatisfaction-generating potential (DGP) = |PI|/RIOS
Impact-asymmetry index (IA index) = SGP − DGP
The IA index divides attributes into the following five categories according to the threshold [34] (Table 1). The satisfiers and delighters are equivalent to the exciting factor of the three factors, the dissatisfiers and frustrators are equivalent to the basic factor of the three factors, and the hybrids are equivalent to the performance factor of the three factors. The asymmetry of delighters is stronger than that of satisfiers, which will not affect the overall satisfaction when they are not delivered but will make people feel more satisfied when they are delivered. The frustrator is the extreme attribute of the dissatisfiers. After delivery, the overall satisfaction is almost no longer improved; if not delivered, people will feel more dissatisfied.
These five categories of attributes indicate priorities for improvement. Poorly performing factors of the frustrator and dissatisfier have a higher priority for improvement than poorly performing factors of the delighter and satisfier, as the former two can negatively impact overall satisfaction. In contrast to the three-factor theory, the IAA also considers the practical impact of the factors on overall satisfaction; for a dissatisfier and a satisfier, which have almost the same practical impact and are both underperforming, the dissatisfier has a higher priority for improvement. However, if the practical impact of the underperforming satisfier far exceeds that of the underperforming dissatisfier, then this satisfier has a higher priority for improvement. IAA considers how to improve overall satisfaction more productively.

3.2. Gradient Boosting Decision Trees Model

The GBDT model is a tree-based integration method that constructs a number of individual decision trees and then combines the results of these decision trees [35]. It aims to explain the prediction error through continuous iterations to bring the final result closer to the true value and minimize the loss function until it remains stable or reaches a minimum value [29]. The final output of the gradient boosting decision tree model is:
F m ( x ) = F m 1 ( x ) + ξ j = 1 J γ j m I ( x R j m ) ,   0 < ξ 1 #
where γ j m is the individual optimal value for each region R j m , I = 1 when x R j m , otherwise I = 0 . ξ is the contraction parameter, also called the learning rate.
For a single decision tree T, the relative importance of the predictor x k in predicting the response is estimated using the following equation:
I k 2 ( T ) = t = 1 J 1 τ ^ t 2 I ( ν ( t ) = k )
J terminal node T is the sum of the non-terminal nodes t , x k is the split variable associated with node t , τ ^ t 2 is the reduction in squared loss after using predictor x k . For the set of decision trees { T m } 1 M , which can be obtained by gradient boosting, from the average of all trees in the Formula (2) we get:
I k 2 = 1 M m = 1 M I k 2 ( T m )

4. Data and Variables

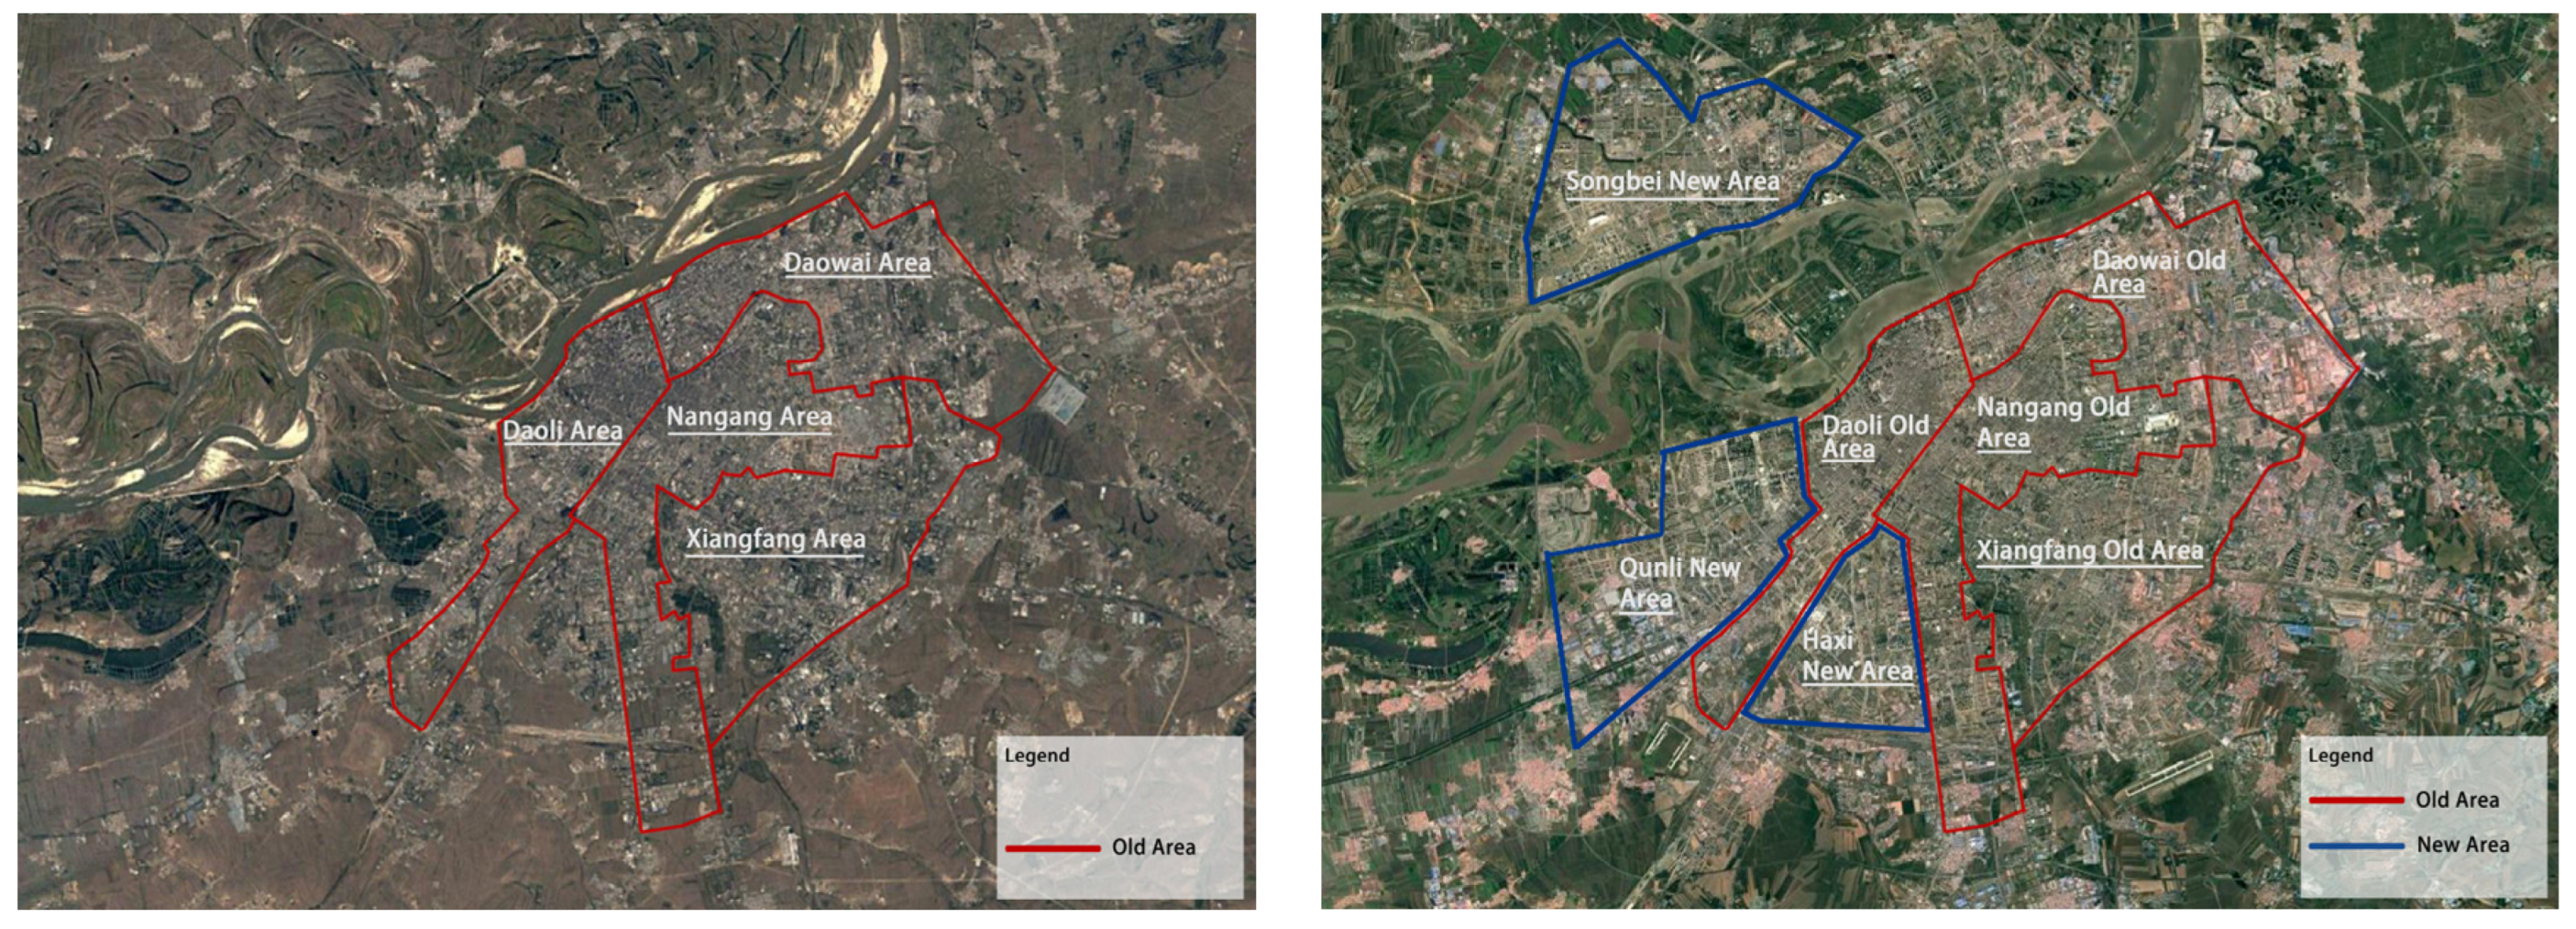
The main urban area of Harbin is divided into the new urban area and the old urban area according to the year of construction. The new urban areas were all built after 2003, and this was used as the boundary to divide the new and old urban areas. Using Google Earth to generate historical remote sensing images of the main urban area in 2003 and 2022, respectively, and using the old urban area in 2003 as a reference for comparison, the new urban area of Harbin was determined based on the construction boundary of the new urban area (Figure 2). The old urban area is the traditional four administrative districts of Harbin, namely: Daoli District, Nangang District, Xiangfang District, and Daowai District; the new urban areas are the newly constructed Songbei administrative district and the new Qunli and Haxi new districts, which are based on the Daoli and Nangang districts, respectively.
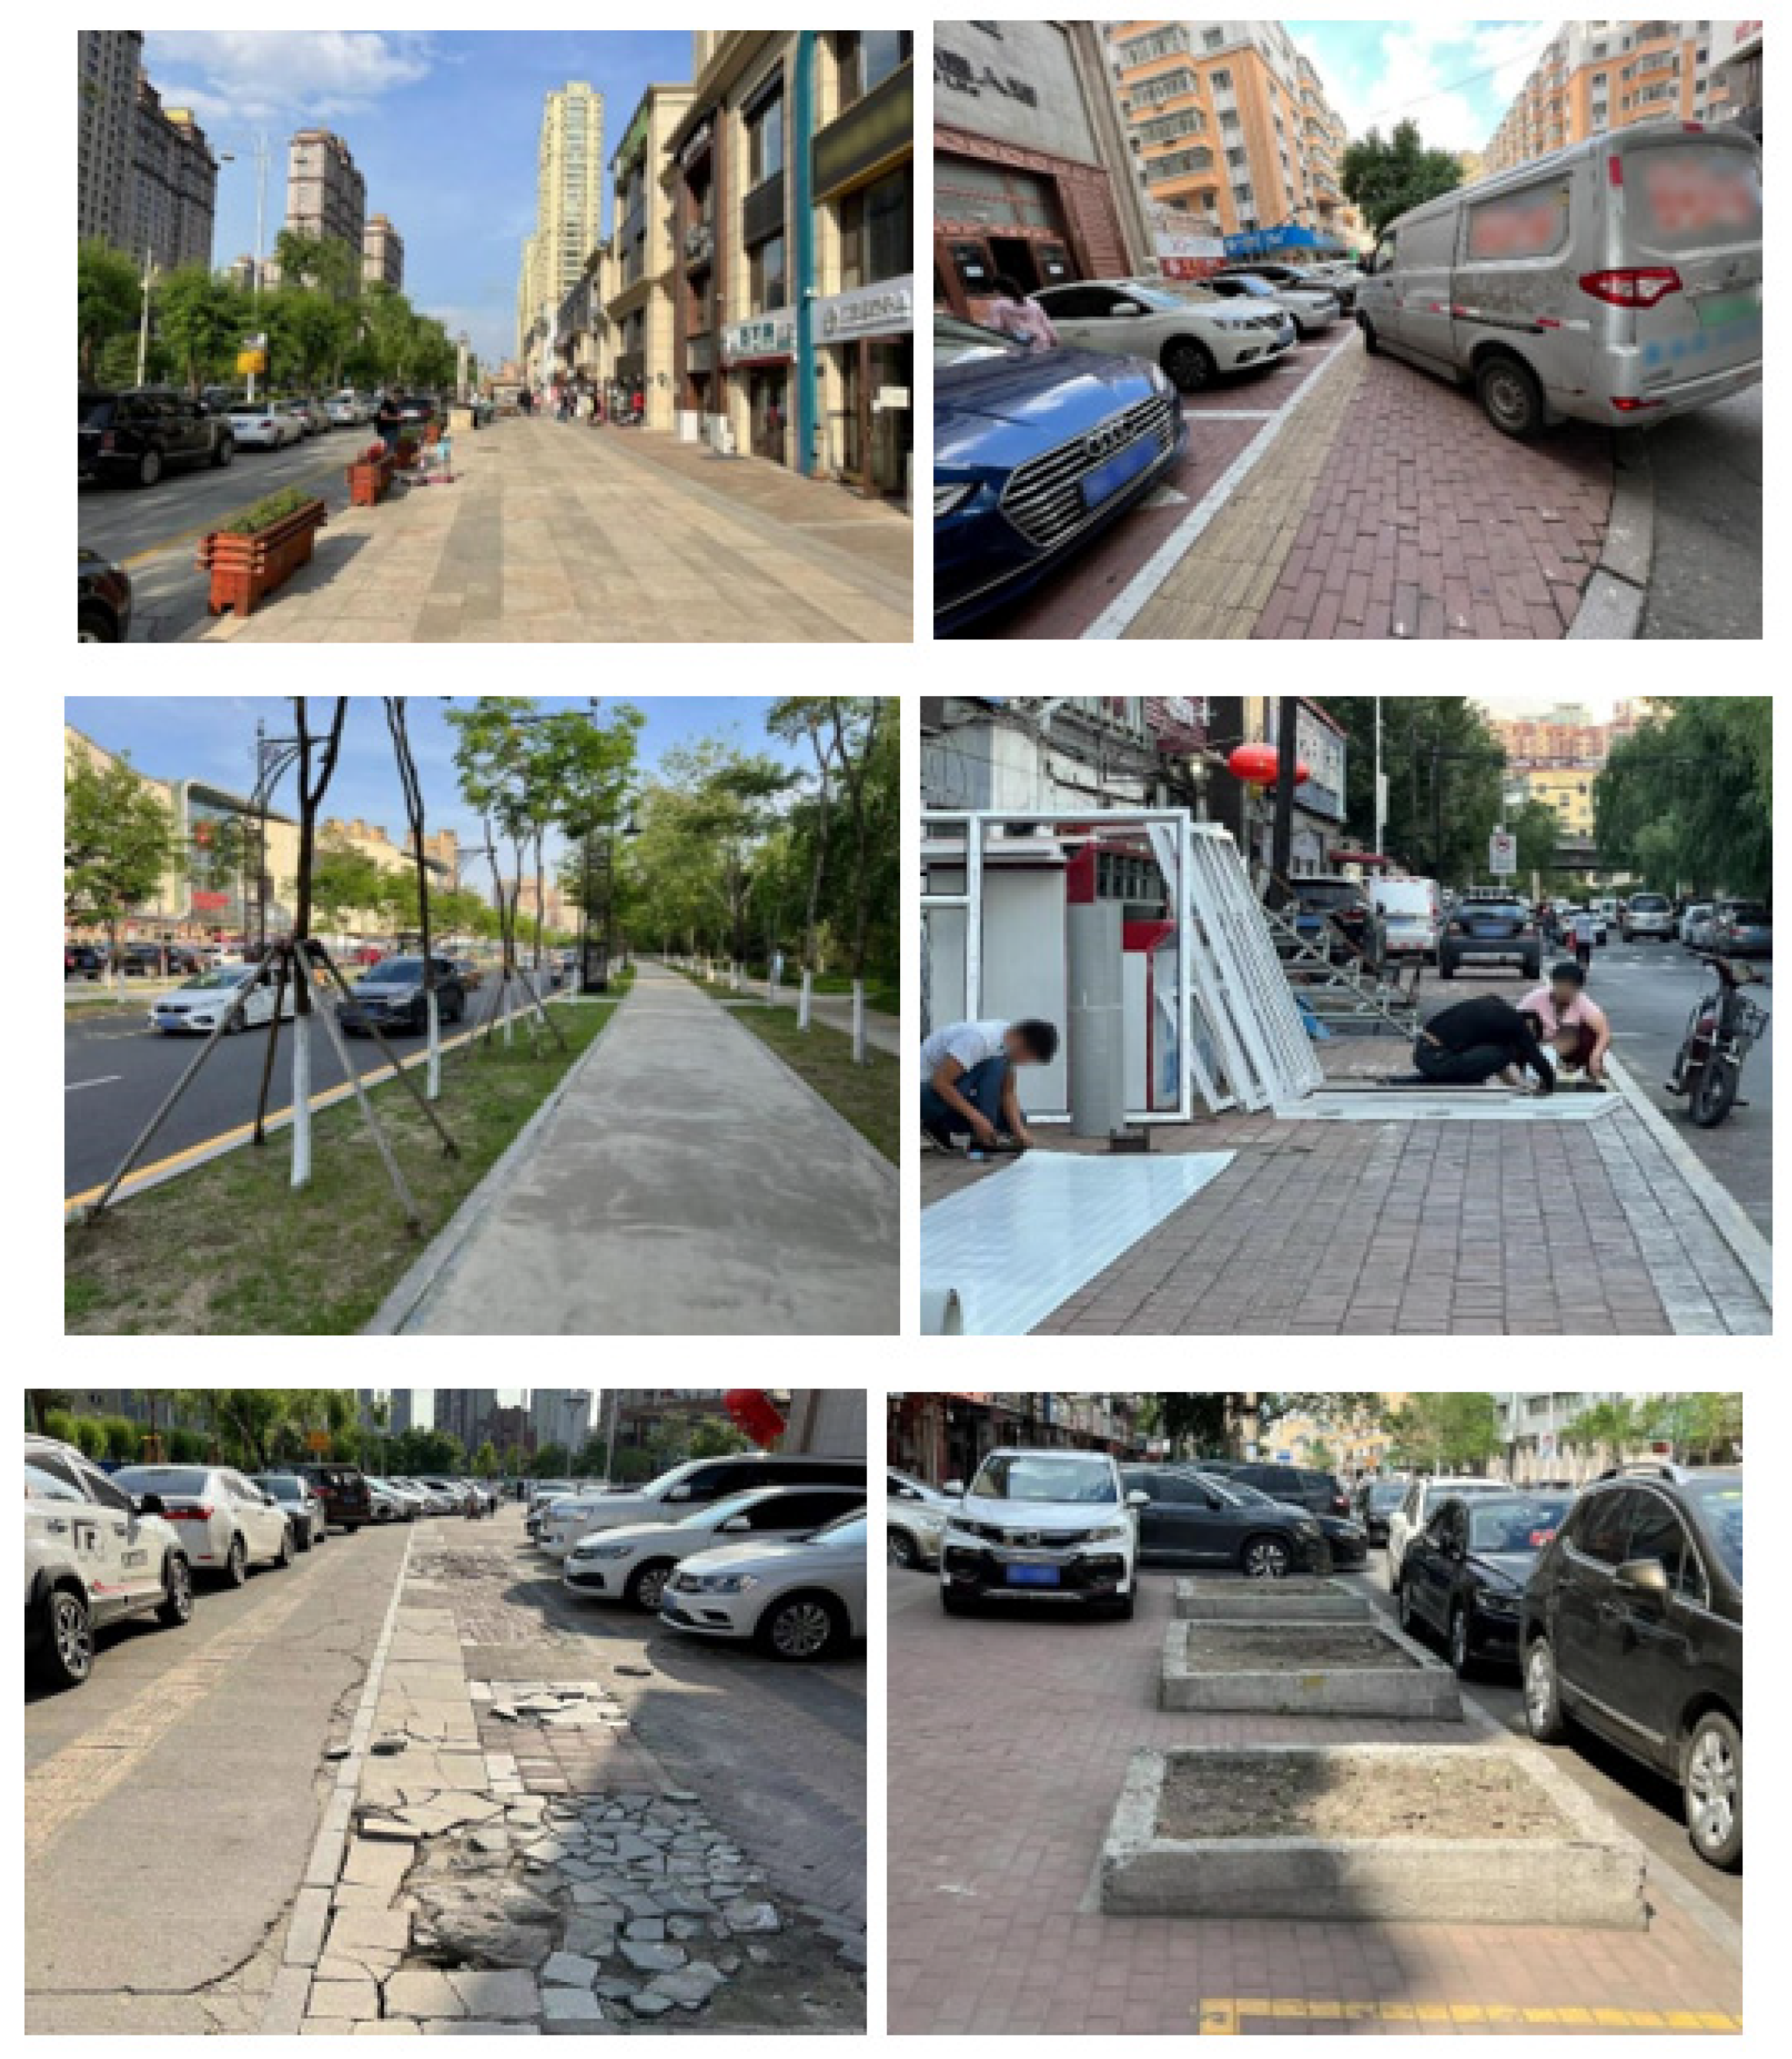
The research team conducted field research in the old and new urban areas of Harbin from July to September 2021 (Figure 3). Through interviews with local residents and site visits, key information was recorded and integrated, and a questionnaire on satisfaction with the pedestrian environment was developed based on the actual demands provided by residents and the precise distillation of the literature, and it was combined with the “Standard for urban pedestrian and bicycle transport system planning” (GB/T 51439–2021) [36]. A pre-study was conducted in October–November 2021, and the questionnaire statements and wording were revised and improved based on the feedback from residents. The research questionnaire consists of three sections: satisfaction with the factors of the walking environment, overall satisfaction with the walking environment, and basic information about the residents. The walking environment evaluation index system covers 4 categories of primary indicators, 11 categories of secondary indicators, and 30 categories of tertiary indicators (Table 2). In addition, it uses a 7-level Likert scale, with 1–7 being very dissatisfied–very satisfied, to enable respondents to evaluate both the factors of the walking environment and overall satisfaction based on their real own perceptions.
The research team sent out questionnaires randomly in different locations in the old and new urban areas. Between April and May 2022, a total of 926 research questionnaires were collected, excluding 29 invalid questionnaires; there were 897 remaining valid questionnaires and the valid return rate of the questionnaires was 96.9%, of which a total of 577 questionnaires were sent out in the old urban areas and 320 in the new urban areas. We attempted to balance the two variables of gender and age, so there is little difference between these two variables in the old and new urban areas (Table 3). The educational level of respondents in the new urban area was better than that in the old urban area, and the proportion of working people was higher than that in the old urban area.

5. Results

5.1. Attribute Importance

When applying the GBDT in the framework of Penalty-Reward-Contrast Analysis, the satisfaction scores of the 30 factors of the walking environment are first converted into dummy variables, with satisfaction scores 1–3 as low performance and recoded as −1, 4 as reference indicators and recoded as 0, 5–7 as high performance and recoded as 1. Using the two pairs of recoded dummy variables as independent variables, residents’ overall satisfaction with the walking environment as a dependent variable, and residents’ basic information as control variables, the GBDT model was constructed separately for the old and new urban areas using the “gbm2.1.8” package in R. To improve the accuracy of the model, the learning rate of the model was set to 0.001, and five-fold cross-validation was conducted to avoid over-fitting problems. The optimal number of iterations for the old and new urban areas are 3485 and 2785, respectively, with cross-test errors of 0.89 and 0.79, respectively.
Table 4 shows the relative influence of the factors of the walking environment, considering factors with a relative influence greater than 2% as relatively important; however, the relative influence of the pavement encroachment in the old city is 1.9%, nearly 2%, and its satisfaction score is the lowest of all the factors in the old city. This indicates that residents of the old city are very dissatisfied with its perception. Therefore, this factor was considered, and finally, 13 factors from the old city and 12 factors from the new city are included in the analysis. In the old city, the factors that have a greater influence on overall satisfaction are uncivilized behavior of pedestrians (12.8%), green landscaping (11.6%), building elevation effect (7.8%), street furniture (7.3%), and barrier-free facilities (5.7%); in the new city, the factors that have a greater influence on overall satisfaction are building facade effect (24.5%), cleanliness of pavements (14.7%), and green landscaping (9.8%). Moreover, the relative influence of human–vehicle conflict (speed of motor vehicles, separation of footpaths, pavement encroachment) in the old city is great, accounting for 8.7% in total. The pavement quality (anti-slip effect of pavement, levelness of pavement, and waterlogging of pavements) has a significant influence on the new city, accounting for 6.7% in total.
The factor of uncivilized behavior of pedestrians is most important in the old urban areas, due to the high population density in the old urban areas and the heavy encroachment on the pavements, the effective width for pedestrians to pass on the already narrow pavement is even narrower and pedestrian contact is more intensive, so uncivilized behavior of pedestrians such as uncivilized dog walking and spitting has a greater impact on the residents of the old urban areas. The building facade vertically encloses the pedestrian space, and this streetscape factor significantly influences pedestrian perception. For new urban areas, where the constructed environment is relatively new, the effect of the building facade is more in line with today’s aesthetic needs, and the architectural style and plaque design are more innovative and unique. This factor has a greater influence on the pedestrian perception of new town residents because this factor is significantly more important in new urban areas than other factors, it dilutes the relative influence values of other factors. The impact of green landscaping on the pavement is almost identical in the old and new urban areas, indicating the importance of this factor in both the new and old urban areas. The cleanliness of pavements is higher in newer urban areas, where the level of hygiene is better than in older urban areas, and that residents of new urban areas are more concerned about the cleanliness of their walking environment. Street furniture and barrier-free facilities are more important to residents of old urban areas, where there are more elderly people than in new urban areas. The conflict between pedestrians and vehicles in the old city is greater because the planning of the old city was not comprehensive enough in the early stages of planning for the gradual increase of cars in the long term. The lack of separation facilities between the pavement and the carriageway makes the speed of cars more obvious to the residents’ perception, especially on rainy days when the vehicles are moving faster, and splashing water and other problems affecting the safety of pedestrians will increase. Parking facilities are lacking, resulting in serious encroachment of cars on the pavement; hence, pedestrians must walk on the carriageway. Therefore, the conflict between cars and pedestrians in the old city has a greater impact. The quality of the pavement significantly impacts the new urban areas. Since in the early days people chose areas of higher ground to build up urban areas, the new urban areas have lower ground compared to the old ones and have poor vertical drainage, resulting in more waterlogging. When the pavements were constructed, a large number of reflective paving blocks were laid to make the pavements more aesthetically pleasing. However, the anti-slip nature of the pavements in winter was lost. The majority of the parking in the new town is located on the inside of the pavement, before the shops, so the paving blocks on the pavement are often run over by cars, resulting in uneven paving blocks. In conclusion, these differences are the result of the different structures of the population, the time of construction, and the level and standard of construction in the old and new urban areas.

5.2. Improvement Priorities

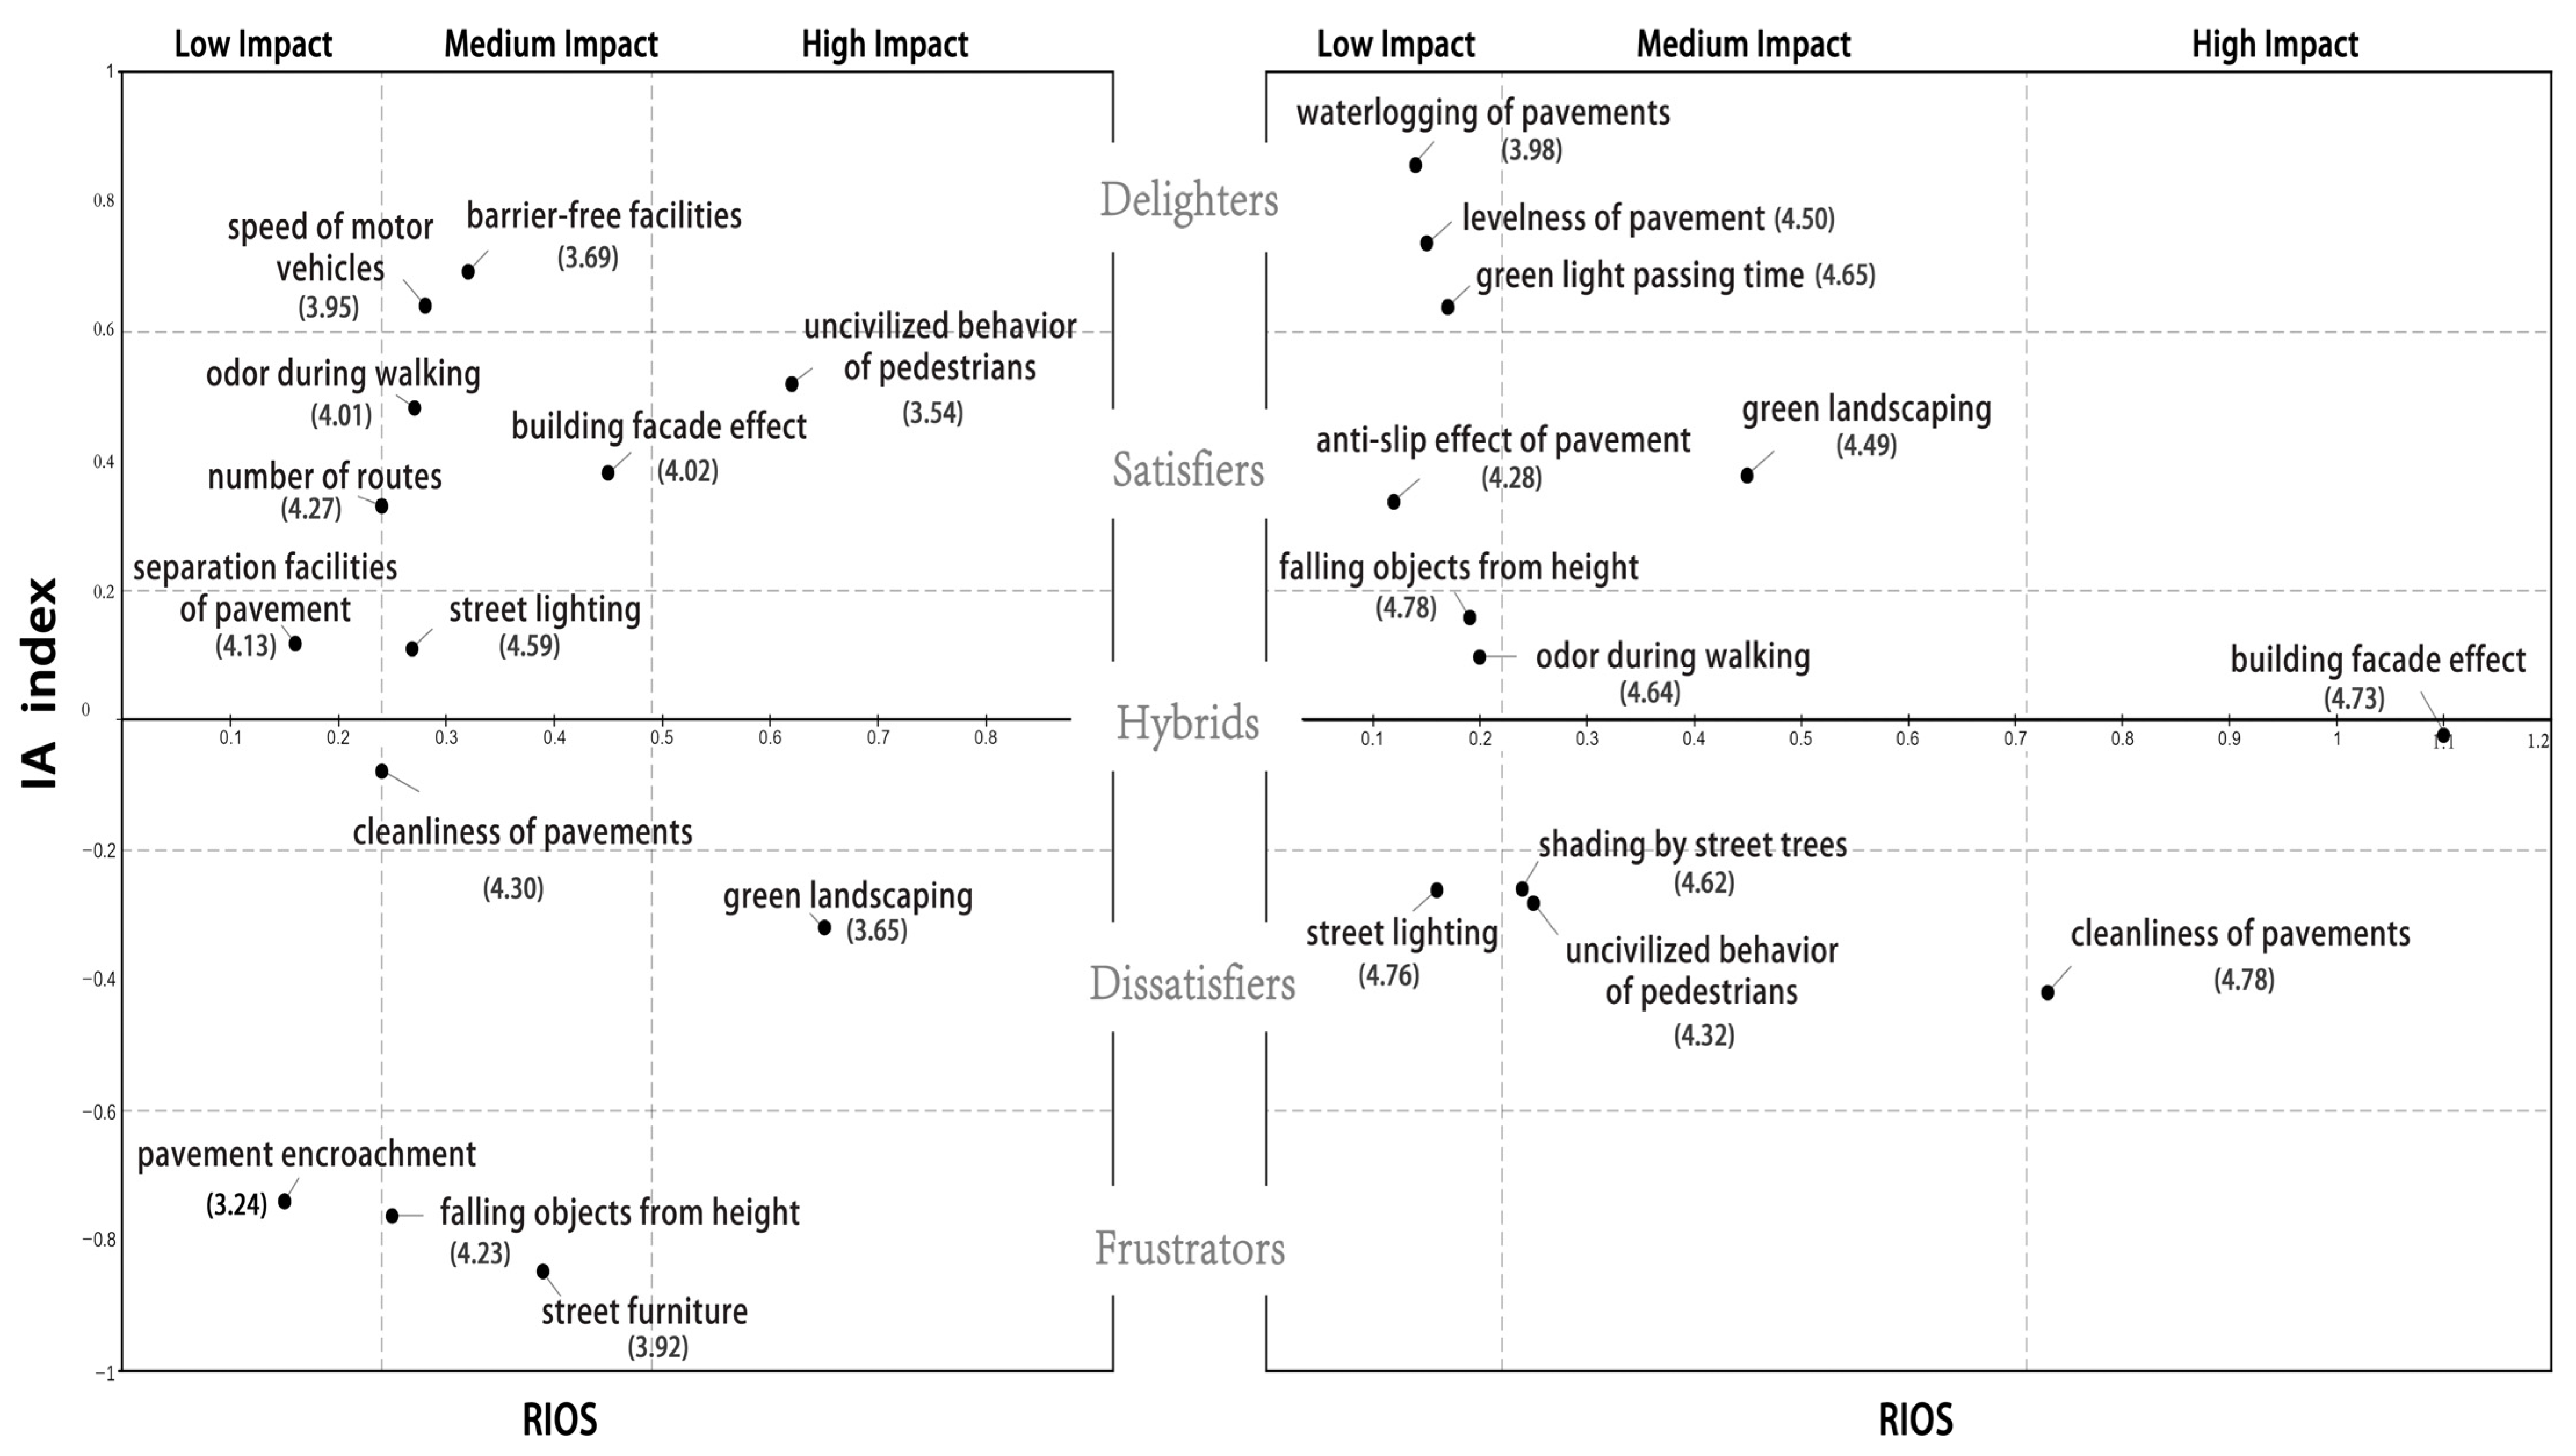
The GBDT model calculates predicted overall satisfaction scores for factors at low, neutral, and high performance, expressed as possd, possn, and posss, respectively. RI = posss-possn; PI = possn-possd. The RIOS and IA index were calculated for each factor based on the RI and PI (Table 5). We found that most factors of the pedestrian environment had a non-linear effect on the overall satisfaction of residents in both the old and new urban areas, accounting for 75% and 77%, respectively. An impact asymmetric analysis chart was developed using the RIOS and IA index for the old town and new town, respectively (Figure 4). In order to more effectively improve residents’ overall satisfaction with the pedestrian environment, the prioritization of factors for improvement should consider the range of impact, asymmetric attributes, and the performance of the factors [37], using the average of satisfaction scores for the 30 factors covering the walking environment to measure the current performance of each factor [24]. The overall mean value of satisfaction with factors of the pedestrian environment in the old town was 4.17, and in the new town it was 4.49. In order to more visually compare the relative magnitude of each factor’s range of influence, the RIOS was divided into high, medium, and low ranges of influence according to the following formula:
(1)
High-impact range: RIOS > (RIOS [average value] + RIOS [maximum value])/2
(2)
Medium-impact range: (RIOS [average value] + RIOS [minimum value])/2 ≤ RIOS ≤ (RIOS [average value] + RIOS [maximum value])/2
(3)
Low-impact range: (RIOS [average value] + RIOS [minimum value])/2 < RIOS
The two factors that have a high impact on overall satisfaction with the pedestrian environment in the old town are the uncivilized behavior of pedestrians and the green landscaping. Both perform poorly and are the first factors that require improvement in the old town. Green landscaping is a dissatisfier, and this factor currently negatively impacts overall satisfaction; it must be improved to the extent that it meets the basic needs of the residents. However, the uncivilized behavior of pedestrians is a satisfier that has little to no negative impact on the overall satisfaction of old town residents, and when it is demonstrated to a degree above the level expected by residents it can significantly increase their overall satisfaction. In addition, there are two factors with high impact ranges in the new town area: building facade effect and cleanliness of pavements. The building facade effect is a hybrid, its aesthetics or lack of aesthetics linearly affects overall satisfaction, and has the greatest impact in the new town, indicating that the streetscape factor of the effect of the building facade effect has a clear dominant effect on the pedestrian satisfaction of new town residents. Therefore, the performance of this factor needs to continue to be enhanced in order to please pedestrians. Cleanliness of pavements is a dissatisfier, performs above average, and, in line with the asymmetry of the dissatisfier, this factor should be brought up to the basic needs of residents; this factor is currently performing relatively well and should therefore continue to be maintained.
There are nine factors in the medium range of influence for the old town, of which street furniture, barrier-free facilities, speed of motor vehicles, odor during walking, and the building facade effect have low satisfaction scores and should receive attention. Street furniture is a frustrator, the extreme attribute of a dissatisfier, which, when performed poorly can make residents feel very dissatisfied. Therefore, this factor should be improved first, and in order to optimize investment, it should be improved to ensure it meets the basic needs of residents. Barrier-free facilities and the speed of motor vehicles are delighters, the extreme attribute of a satisfier, and have a limited impact on overall satisfaction when they perform poorly. When these two factors perform above residents’ expected levels, they will significantly increase their overall satisfaction. Odor during walking and the building facade effect are satisfiers, similar to the delighter; however, the effect of improvement is weaker than the delighter, so the order of improvement should be placed after the two delighters. There are three medium-impact factors in the new town, of which uncivilized behavior of pedestrians is a dissatisfier and a poor performer, which affects the overall satisfaction of new town residents. Therefore, this requires improvement to bring it up to the basic level of residents’ needs in order to eliminate their dissatisfaction. The green landscaping is a satisfier; it is performing at an average level and must be brought to a level where it exceeds residents’ expectations to significantly improve overall satisfaction. Shading by street trees is performing relatively well and does not require further improvement.
There are two low-impact factors in the old town, both of which have low satisfaction scores. Pavement encroachment has the lowest score of all factors, indicating that this factor performs the worst in the old town and that it is a frustrator that causes strong dissatisfaction among residents. However, it has a low impact, so it should be front-loaded in the order of improvement, but not the primary improvement, and it is sufficient to raise this factor to meet the normal access of residents. Separation facilities of pavements are a hybrid and can be improved after other important factors have been improved. There is a greater proportion of low-impact factors in the new city: seven in total. This is because the overall pedestrian environment in the new city is better, so that there are fewer factors with a large impact. The three factors of waterlogging of pavements, levelness of pavement, and anti-slip effect of pavement have low satisfaction scores and are all tertiary indicators of pavement quality and are all excitement attributes. These factors should be raised above the level of expectation of residents, but the impact of improvement on overall satisfaction is not significant, so these three factors can be considered for final improvement.

6. Conclusions

This study constructed a perceptual evaluation system based on the safety, convenience, comfort, and aesthetics of the walking environment; integrated impact asymmetric analysis and a GBDT; analyzed the differences in the preferences of residents’ needs for the walking environment in the new and old urban areas of Harbin, China; and provided reasonable priorities for the improvement of the walking environment in the new and old urban areas. The results of the study show that:
First, both green landscaping and building facade effects have a strong influence on satisfaction with the pedestrian environment in both old and new urban areas, indicating that both residents in old and new urban areas are more concerned with the pedestrian streetscape. In addition, human–vehicle conflict, uncivilized behavior of pedestrians, street furniture, and barrier-free facilities in old urban areas significantly influence the overall satisfaction of residents. The cleanliness of pavements and pavement quality significantly impact the satisfaction of the residents of the new urban areas, indicating that residents in old urban areas focus more on the aesthetics and safety of pavements, while residents in new urban areas are more concerned with aesthetics and comfort. This reflects the differences in the needs of the residents of the old and new towns for a pedestrian environment.
Second, it provides a prioritization of the different pedestrian environment needs of the old and new urban areas for improvement. The study found that the pedestrian environment in old urban areas should receive more attention. Green landscaping, street furniture, and the uncivilized behavior of pedestrians in old urban areas should be considered the primary factors for pedestrian environment improvement. The next priority is to improve pavement encroachment, barrier-free facilities, the speed of motor vehicles in the old city, the building facade effect, the uncivilized behavior of pedestrians, and green landscaping in the new city. Finally, improvements are then made to the effectiveness of the building facade effect, odor during walking, separation facilities of the pavement in the old city, the anti-slip effect of the pavement, waterlogging of pavements, and the levelness of the pavement in the new city. The improvement based on the asymmetry of these factors can significantly improve the overall satisfaction of residents in the case of limited resources, so as to optimize the economy and effectiveness of investment.
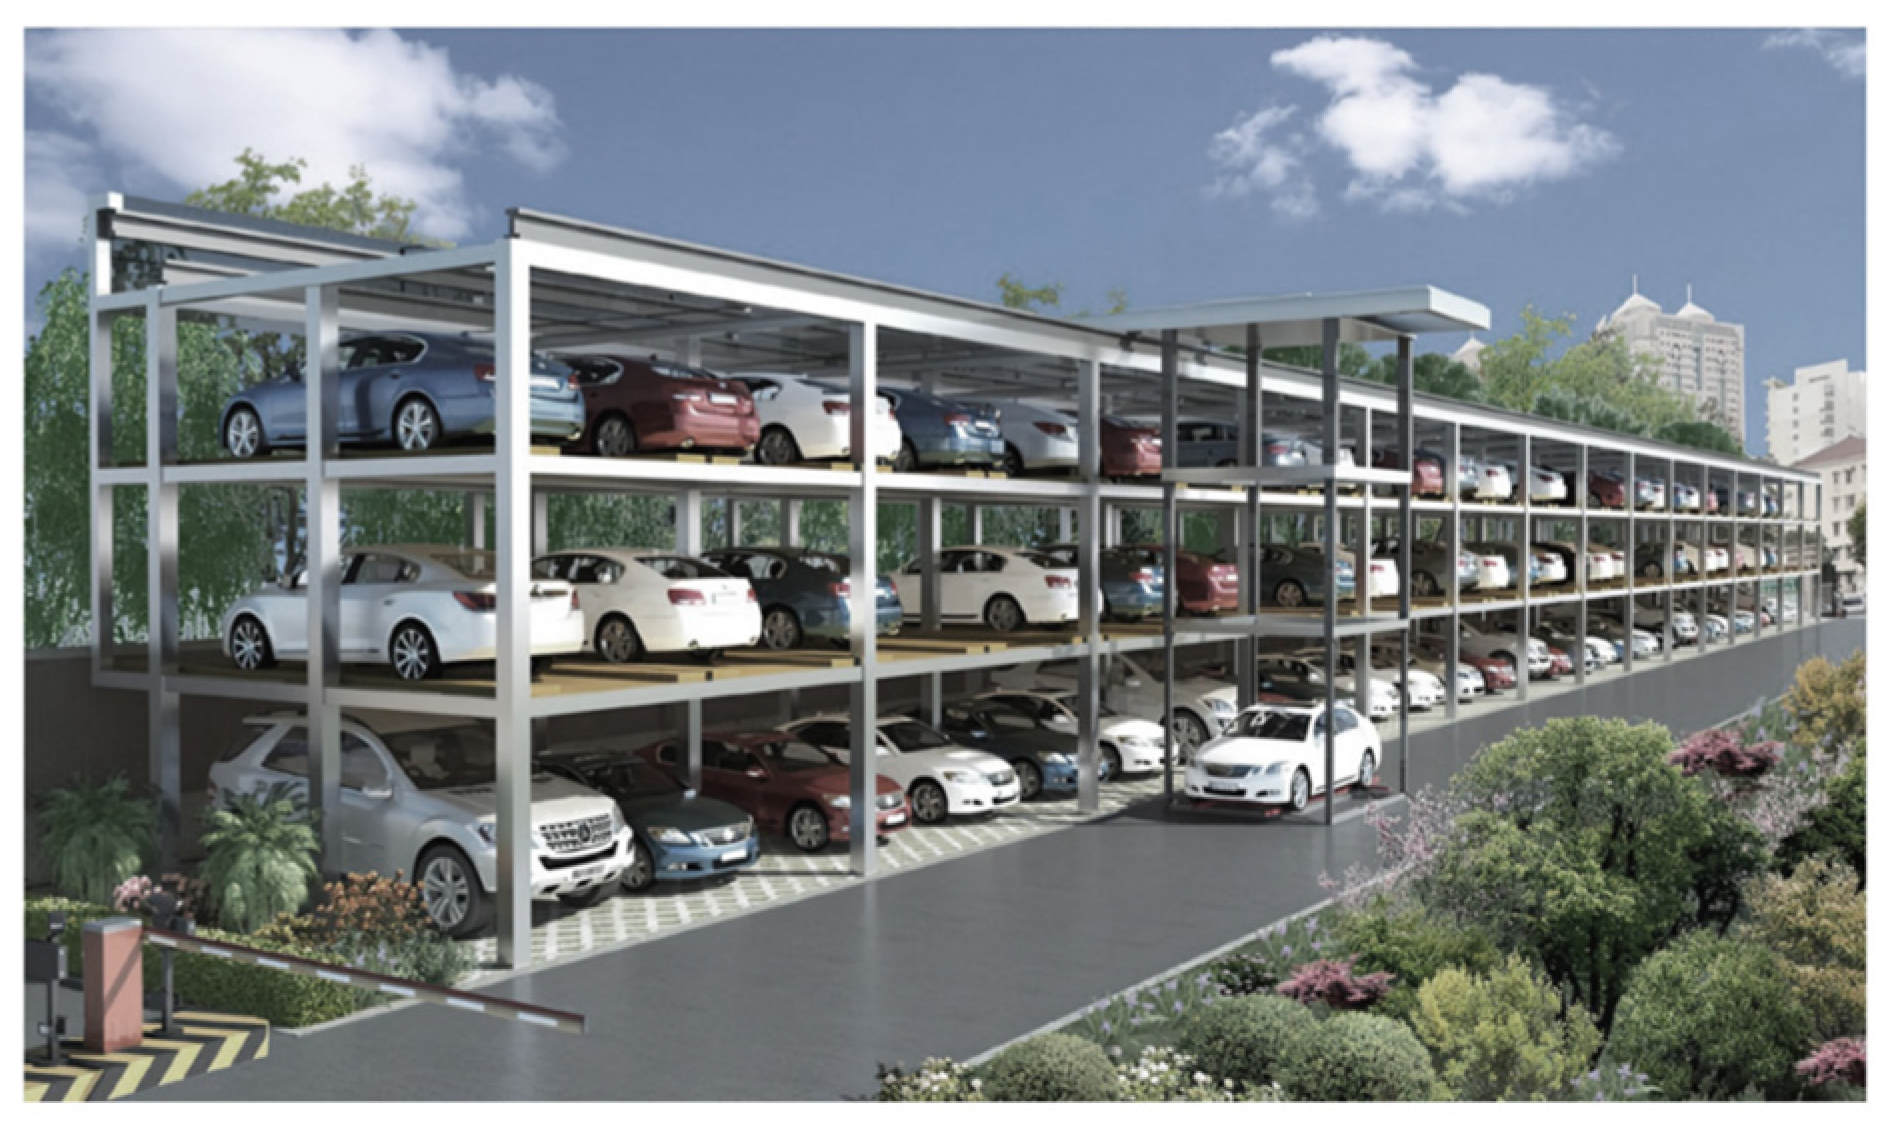
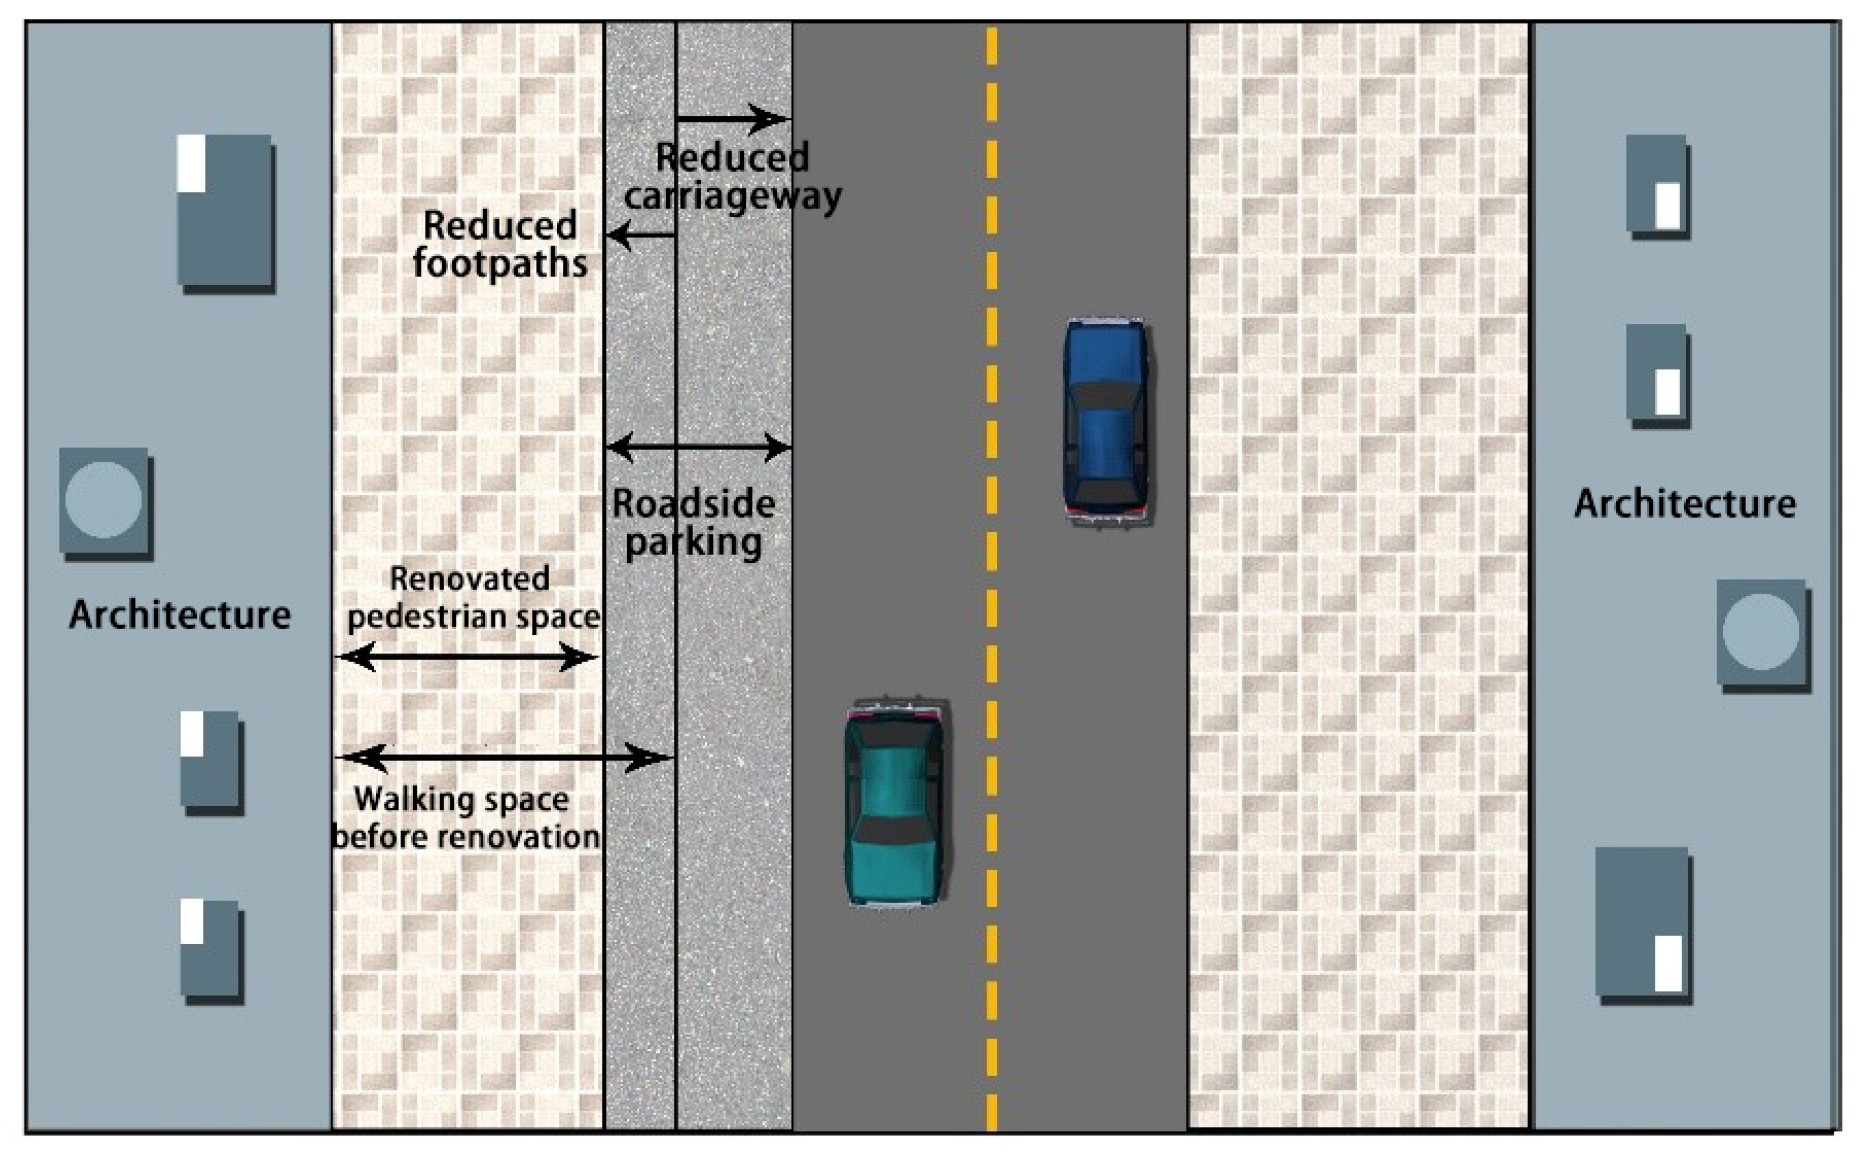
Third, Harbin should promote a pedestrian-first strategy by enhancing residents’ sense of identity and belonging by beautifying the pedestrian streetscape and raising their awareness of environmental protection. Further, strengthening the infrastructure development and environmental governance of pavements in old urban areas will protect the rights of pedestrians. In areas where car encroachment on the pavement is more serious, three-dimensional car parks can be built to solve the problem of lack of space for parking in old urban areas (Figure 5), or parking strips can be created to reduce the encroachment on the pavement and, simultaneously, they can play a role in separating the carriageway from the pavement (Figure 6). For narrow pavements that cannot be reduced, the curb height should be 20–30 cm and there should be sufficient street trees to act as a barrier. New towns should switch to nonslip, hard-wearing, and highly permeable paving blocks for pavements to ensure pedestrian comfort.
Fourth, the majority of pedestrian environment factors, 75% and 77% in the old and new urban areas, respectively, had non-linear relationships with overall resident satisfaction, which negated the linear assumptions adopted in previous studies. These results also provide new considerations for linear studies that only consider improvements to the factors that have significant impacts but ignore the current factor performances, that is, factors with high impact do not always require improvements, and the rationale for factor improvements should consider the current factor-performance levels and the actual non-linear impacts that people perceive.
The asymmetrical impact of factors should be considered in the planning of future pedestrian environments, otherwise, the improvement of pedestrian environment factors will deviate from the actual needs of the residents. This paper identifies the improvement factors and priorities of the pedestrian environment in the new and old urban areas, and the analysis should be used as a starting point for improving the pedestrian environment. In addition, due to the limitations of impact asymmetric analysis, there is no clear theoretical guidance on the thresholds for attribute classification, and different choices of thresholds may result in different classifications of factors. However, recent studies have identified 0.2 and −0.2 as thresholds to distinguish between linear and non-linear impacts [29,30,31].

Author Contributions

Conceptualization, D.F. and L.H.; methodology, D.F., L.H. and J.L.; validation, L.H. and S.S.; formal Analysis, L.H. and S.S.; investigation, L.H., D.F., Q.Z., L.Z. and S.S.; resources, D.F. and X.W.; writing—original draft preparation, L.H.; writing—review and editing, L.H.; visualization, D.F. and J.L.; supervision, D.F. and J.L.; project administration, D.F. and X.W. All authors have read and agreed to the published version of the manuscript.

Funding

This research received no external funding.

Institutional Review Board Statement

Not applicable.

Informed Consent Statement

Informed consent was obtained from all subjects involved in the study.

Data Availability Statement

The basic data are available from the first author upon request.

Acknowledgments

The authors are grateful to Xinyu Cao at the University of Minnesota for his methodology and guidance on the paper, and the authors would like to thank the anonymous reviewers for their valuable comments on the improvement of the manuscript. The authors are also grateful to the students who helped in distributing the questionnaire.

Conflicts of Interest

The authors declare no conflict of interest.

References

  1. Gibson, J.M.; Rodriguez, D.; Dennerlein, T.; Mead, J.; Hasch, T.; Meacci, G.; Levin, S. Predicting urban design effects on physical activity and public health: A case study. Health Place 2015, 35, 79–84. [Google Scholar] [CrossRef]
  2. Frank, L.D.; Andresen, M.A.; Schmid, T.L. Obesity relationships with community design, physical activity, and time spent in cars. Am. J. Prev. Med. 2004, 27, 87–96. [Google Scholar] [CrossRef]
  3. Van Dyck, D.; Cardon, G.; Deforche, B.; Sallis, J.F.; Owen, N.; De Bourdeaudhuij, I. Neighborhood SES and walkability are related to physical activity behavior in Belgian adults. Prev. Med. 2010, 50, S74–S79. [Google Scholar] [CrossRef]
  4. Rundle, A.G.; Sheehan, D.M.; Quinn, J.W.; Bartley, K.; Eisenhower, D.; Bader, M.M.D.; Lovasi, G.S.; Neckerman, K.M. Using GPS data to study neighborhood walkability and physical activity. Am. J. Prev. Med. 2016, 50, E65–E72. [Google Scholar] [CrossRef]
  5. Todd, M.; Adams, M.A.; Kurka, J.; Conway, T.L.; Cain, K.L.; Buman, M.P.; Frank, L.D.; Sallis, J.F.; King, A.C. GIS-measured walkability, transit, and recreation environments in relation to older Adults’ physical activity: A latent profile analysis. Prev. Med. 2016, 93, 57–63. [Google Scholar] [CrossRef] [Green Version]
  6. Muraleetharan, T.; Hagiwara, T. Overall level of service of urban walking environment and its influence an pedestrian route choice behavior—Analysis of pedestrian travel in Sapporo, Japan. Transp. Res. Rec. 2007, 2002, 7–17. [Google Scholar] [CrossRef]
  7. Rye, T.; Hrelja, R. Policies for reducing car traffic and their problematisation. Lessons from the mobility strategies of British, Dutch, German and Swedish cities. Sustainability 2020, 12, 8170. [Google Scholar] [CrossRef]
  8. Su, C.; Lu, J.; Xu, P. Analysis of urban transport carbon emissions and low-carbon development mode: A case study of Shanghai. J. Highw. Transp. Res. Dev. 2012, 29, 142–148. [Google Scholar]
  9. Zeyu, W. Experience and enlightenment of street space construction in Melbourne Central District from a humanistic perspective. Shanghai Urban Plan. Rev. 2020, 99–104. [Google Scholar] [CrossRef]
  10. Gray, S.F.; Kellas, A. Covid-19 Has Highlighted the Inadequate, and Unequal, Access to High Quality Green Spaces. Bmj Opin. 2020, 3. Available online: https://www.bristolhealthpartners.org.uk/news/covid-19-has-highlighted-the-inadequate-and-unequal-access-to-high-quality-green-spaces/ (accessed on 11 November 2022).
  11. Liu, D.; Kwan, M.P.; Kan, Z.H. Assessing job-access inequity for transit-based workers across space and race with the Palma ratio. Urban Res. Pract. 2021, 15, 746–772. [Google Scholar] [CrossRef]
  12. Kweon, B.S.; Rosenblatt-Naderi, J.; Ellis, C.D.; Shin, W.H.; Danies, B.H. The effects of pedestrian environments on walking behaviors and perception of pedestrian safety. Sustainability 2021, 13, 8728. [Google Scholar] [CrossRef]
  13. Yuan, L.; Xiaohan, G.; Linchuan, Y.; Jing, G. Research on walking environment satisfaction of residents based on ordered probit model—A Case Study of Gulangyu. Chin. Landsc. Archit. 2020, 36, 90–94. [Google Scholar] [CrossRef]
  14. Villaveces, A.; Nieto, L.A.; Ortega, D.; Rios, J.F.; Medina, J.J.; Gutierrez, M.I.; Rodriguez, D. Pedestrians’ perceptions of walkability and safety in relation to the built environment in Cali, Colombia, 2009–2010. Inj. Prev. 2012, 18, 291–297. [Google Scholar] [CrossRef] [Green Version]
  15. Yintao, L. Walkability evaluation based on people’s use of facilities by walking. Urban Plan. Forum 2013, 5, 113–118. [Google Scholar]
  16. Zhao, L.; Bian, Y.; Rong, J.; LIU, X.M. Pedestrian LOS of urban sidewalks based on orderly logistic regression. J. Transp. Syst. Eng. 2014, 14, 131–138. [Google Scholar] [CrossRef]
  17. Kim, S.; Park, S.; Lee, J.S. Meso- or micro-scale? Environmental factors influencing pedestrian satisfaction. Transp. Res. D 2014, 30, 10–20. [Google Scholar] [CrossRef]
  18. Chen, Y.; Wang, Q.; Xi, W.; Mao, J. Influence Of spatial form on pedestrians. Planners 2017, 33, 74–80. [Google Scholar]
  19. Zhou, X. The analysis of influential sactors in urban walking environment: An empirical study on 16 walking spaces of Melbourne, Australia. Planners 2017, 33, 197–202. [Google Scholar]
  20. Ji, X.; Zhang, K. Quantitative study on walkability based on urban spatial morphology: Taking Chengdu Shaocheng area as an example. J. Xi’an Univ. Archit. Technol. Nat. Sci. Ed. 2020, 52, 563–571. [Google Scholar] [CrossRef]
  21. Tan, S.; Cao, F.; Yang, J. The study on spatial elements of health-supportive environment in residential streets promoting residents’ walking trips. Int. J. Environ. Res. Public Health 2020, 17, 5198. [Google Scholar] [CrossRef]
  22. Long, Y.; Li, L.; Li, S.; Chen, L.; Pan, Z.; Yao, Y.; Chen, M.; Wang, Y.; Quan, J.; Zhang, L.; et al. Measurment of street Walking Environment Index for urban vitality centers in Chinese cities. S. Archit. 2021, 114–120. [Google Scholar] [CrossRef]
  23. Oh, M.; Kim, S.; Choi, Y.; Pratt, S. Examination of benefits sought by hiking tourists: A comparison of impact-range performance analysis and impact asymmetry analysis. Asia Pac. J. Tour. Res. 2019, 24, 850–864. [Google Scholar] [CrossRef]
  24. Mikulic, J.; Prebezac, D. Evaluating hotel animation programs at Mediterranean sun-and-sea resorts: An impact-asymmetry analysis. Tour. Manag. 2011, 32, 688–696. [Google Scholar] [CrossRef]
  25. Chen, P.-Z.; Liu, W.-Y. Assessing management performance of the national forest park using impact range-performance analysis and impact-asymmetry analysis. For. Policy Econ. 2019, 104, 121–138. [Google Scholar] [CrossRef]
  26. Back, K.-J.; Lee, C.-K. Determining the Attributes of Casino Customer Satisfaction: Applying Impact-Range Performance and Asymmetry Analyses. J. Travel Tour. Mark. 2015, 32, 747–760. [Google Scholar] [CrossRef]
  27. Elith, J.; Leathwick, J.R.; Hastie, T. A working guide to boosted regression trees. J. Anim. Ecol. 2008, 77, 802–813. [Google Scholar] [CrossRef] [PubMed]
  28. Ding, C.; Wu, X.; Yu, G.; Wang, Y. A gradient boosting logit model to investigate driver’s stop-or-run behavior at signalized intersections using high-resolution traffic data. Transp. Res. C 2016, 72, 225–238. [Google Scholar] [CrossRef]
  29. Dong, W.; Cao, X.; Wu, X.; Dong, Y. Examining pedestrian satisfaction in gated and open communities: An integration of gradient boosting decision trees and impact-asymmetry analysis. Landsc. Urban Plan. 2019, 185, 246–257. [Google Scholar] [CrossRef]
  30. Wu, X.; Cao, X.; Ding, C. Exploring rider satisfaction with arterial BRT: An application of impact asymmetry analysis. Travel Behav. Soc. 2020, 19, 82–89. [Google Scholar] [CrossRef]
  31. Fang, D.; Xue, Y.; Cao, J.; Sun, S. Exploring satisfaction of choice and captive bus riders: An impact asymmetry analysis. Transp. Re. D 2021, 93, 102798. [Google Scholar] [CrossRef]
  32. Lan, J.; Xue, Y.; Fang, D.; Zheng, Q. Optimal strategies for elderly public transport service based on impact-asymmetry analysis: A case study of Harbin. Sustainability 2022, 14, 1320. [Google Scholar] [CrossRef]
  33. Albayrak, T.; Caber, M. Penalty-Reward-Contrast Analysis: A review of its application in customer satisfaction research. Total Qual. Manag. Bus. Excell. 2013, 24, 1288–1300. [Google Scholar] [CrossRef]
  34. Lai, I.K.W.; Hitchcock, M. Sources of satisfaction with luxury hotels for new, repeat, and frequent travelers: A PLS impact-asymmetry analysis. Tour. Manag. 2017, 60, 107–129. [Google Scholar] [CrossRef]
  35. Ding, C.; Cao, X.; Wang, Y. Synergistic effects of the built environment and commuting programs on commute mode choice. Transp. Res. Pt. A Policy Pract. 2018, 118, 104–118. [Google Scholar] [CrossRef]
  36. GB/T 51439-2021; Standard for Urban Pedestrian and Bicycle Transport System Planning. China Architecture Publishing&Media Co., Ltd.: Beijing, China. Available online: http://www.gbstandards.org/GB_standard_english.asp?code=GB/T%2051439-2021 (accessed on 1 October 2021).
  37. Mikulić, J.; Prebežac, D. Prioritizing improvement of service attributes using impact range-performance analysis and impact-asymmetry analysis. Manag. Serv.Qual. Int. J. 2008, 18, 559–576. [Google Scholar] [CrossRef]
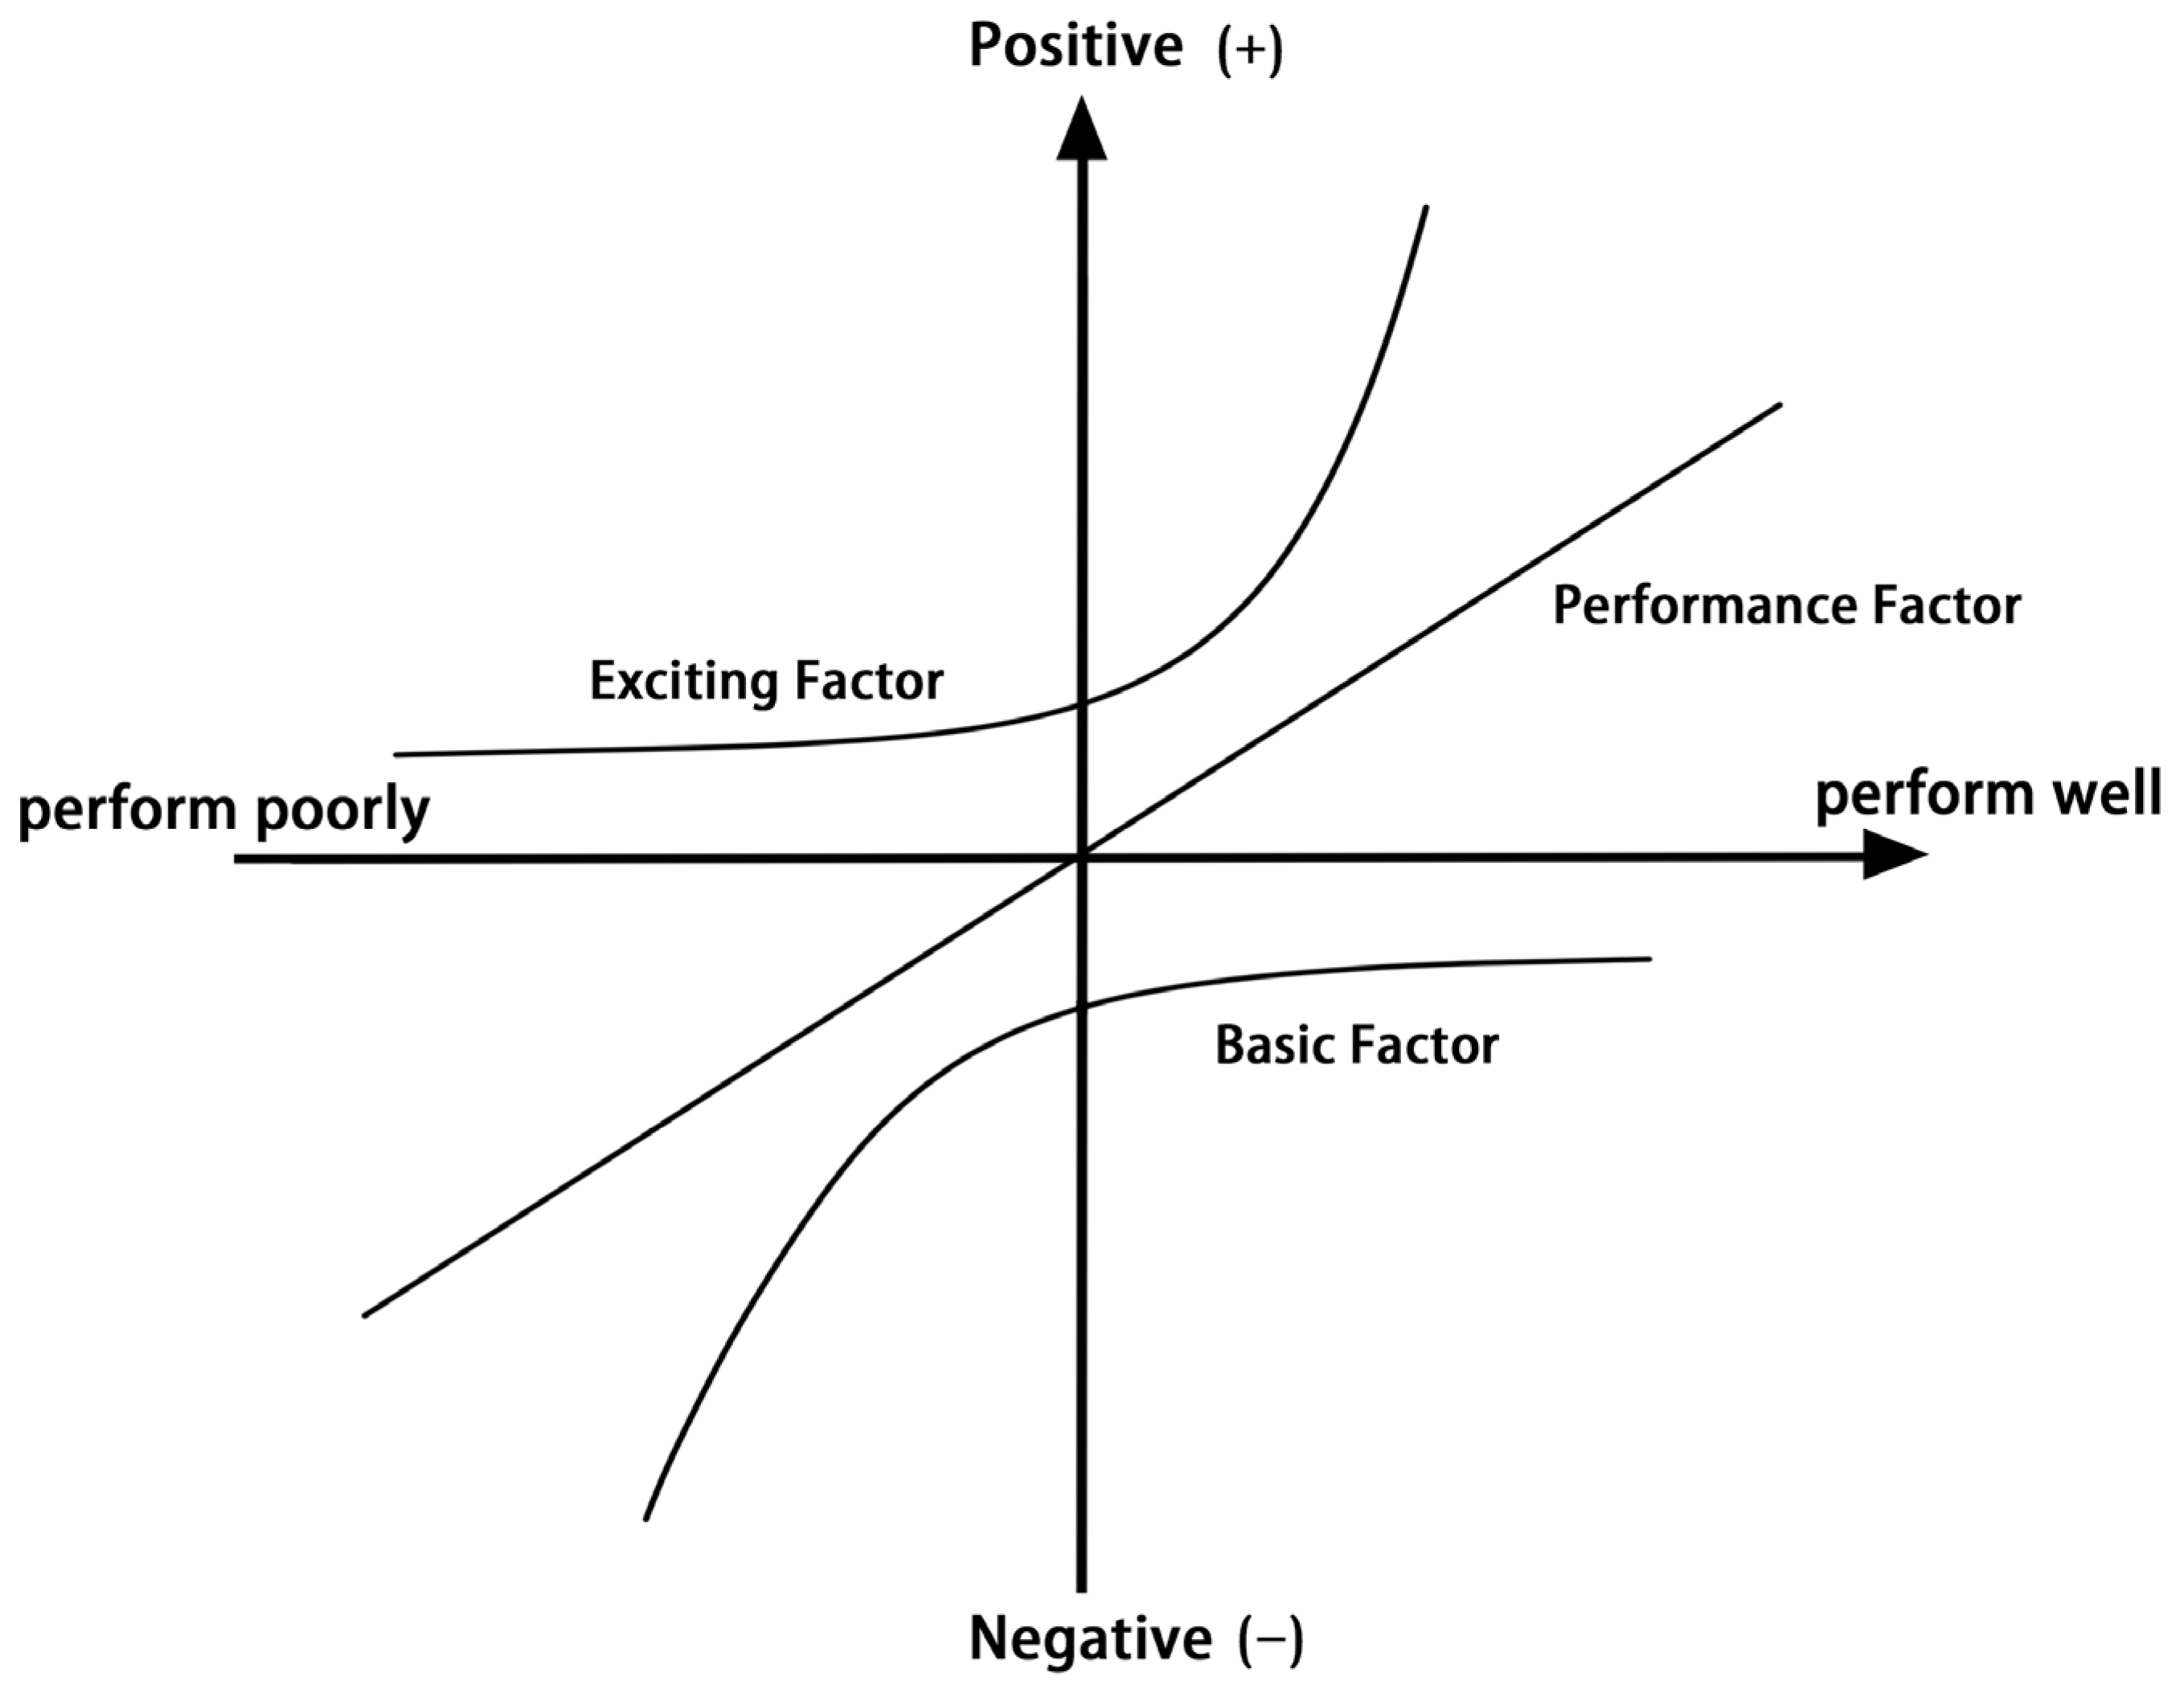
Figure 1. Three-factor theory.
Sustainability 15 02414 g001
Figure 2. Remote sensing images of the main urban city of Harbin, China, in 2003 (left) and 2022 (right).
Sustainability 15 02414 g002
Figure 3. Contrast of the pedestrian environment in the new (left) and old (right) urban areas.
Sustainability 15 02414 g003
Figure 4. The impact-asymmetry analysis graph of pedestrian environment factors in the new and old urban areas. Note: the average satisfaction of each factor is shown in brackets.
Sustainability 15 02414 g004
Figure 5. Three-dimensional parking.
Sustainability 15 02414 g005
Figure 6. Creation of a parking strip.
Sustainability 15 02414 g006
Table 1. Classification of attributes for impact-asymmetry analysis.
Three-FactorCategoriesCategories BasisDelineated ThresholdsFeatures
Exciting factorDelighterReward >> penaltyIA index ≥ 0.6Significant increase in overall satisfaction after delivery
SatisfierReward > penalty0.6 > IA index > 0.2Increase in overall satisfaction after delivery
Performance factorHybridReward ≈ penalty0.2 ≥ IA index ≥ −0.2Satisfaction or not, the overall satisfaction increases and decreases accordingly
Basic factorDissatisfierReward < penalty−0.2 > IA index > −0.6Decrease in overall satisfaction when not delivered
FrustratorReward << penalty−0.6 ≥ IA indexSignificantly decreases overall satisfaction when not delivered
Table 2. Pedestrian environment evaluation indicator system.
First-Level IndicatorSecondary IndicatorsTertiary Indicators
SafetyHuman–vehicle conflictSpeed of motor vehicles
Yield to pedestrians
Non-motorized vehicle interference
Separation facilities of pavement
Pavement encroachment (cars, merchant stalls, etc.)
Public securityFalling objects from a height
The safety of walking at night (fear of robbery, theft, etc.)
Safety facilitiesStreet lighting
Barrier-free facilities
ConvenienceRoad network structureNumber of routes available (walk to shops, markets, banks, etc.)
Crossing facilities (zebra crossings, flyovers, underpasses, etc.)
Pavement managementGreen light passing time
Timeliness of snow removal
Distance to service facilitiesWalking distance to the event venue (plazas, parks, etc.)
Walking distance to bus stop
Walking distance to service facilities (food markets, pharmacies, banks, supermarkets, restaurants, etc.)
ComfortPavement qualityAnti-slip effect of pavement
Width of pavement
Levelness of pavement
Waterlogging of pavements
Pavement pollutionCleanliness of pavements
Noise during walking (construction, machinery operation, etc.)
Odor during walking (smoke from restaurants, odor from rubbish heaps, etc.)
Pavement greeneryShading by street trees
Hearing birds chirping while walking
AestheticsPedestrian streetscapeBuilding facade effect (style of the building, building facade decoration, shop plaque design, etc.)
Green landscaping (flowers, greenery, etc.)
Street furniture (seats, litter bins, street signs, etc.)
Social atmosphereUncivilized behavior of pedestrians (spitting, walking dogs without a leash, etc.)
Recreational activities for residents
Note: The pedestrian roads studied in this paper are municipal roads, excluding internal roads in places such as parks and residential areas.
Table 3. Demographics of respondents.
CharacteristicsClassificationOld Town (%)New Town (%)
GenderMale43.245.9
Female56.854.1
Age18–3436.240.9
35–4939.237.5
50–6415.713.9
65–948.97.7
Education levelElementary school or lower12.14.1
Middle school12.217.1
High school/vocational high school27.214.7
Bachelor’s degree/associate degree37.741.6
Graduate degrees10.822.5
OccupationStudents18.714.8
Office workers39.148.1
Individual workers13.710.5
Freelancers12.515.1
Retirees11.95.5
Others4.16.0
Table 4. The relative influence of pedestrian environment factors on overall satisfaction.
RankOld Urban Areas FactorsRelative Influence (%)New Urban Area FactorsRelative Influence (%)
1Uncivilized behavior of pedestrians12.8Building facade effect24.5
2Green landscaping11.6Cleanliness of pavements14.7
3Building facade effect7.8Green landscaping9.8
4Street furniture7.3Falling objects from height4.3
5Barrier-free facilities5.7Uncivilized behavior of pedestrians3.9
6Speed of motor vehicles4.6Street lighting3.4
7Falling objects from height4.4Shading by street trees2.9
8Cleanliness of pavements4.1Levelness of pavement2.7
9Street lighting4.0Odor during walking2.7
10Odor during walking3.8Green light passing time2.3
11Number of routes available2.3Waterlogging of pavements 2.0
12Separation facilities of pavement2.2Anti-slip effect of pavement2.0
13Pavement encroachment1.9
Note: the factors are ranked according to their relative influence on overall satisfaction, and the factors with a relative influence value less than 2% (except for the pavement encroachment) are not listed.
Table 5. Impact-asymmetry analysis of pedestrian environment factors.
Walking Environment FactorsSGPDGPRIOSIA IndexClassificationMean Satisfaction
Old town
Green landscaping0.380.620.65−0.24Dissatisfier3.65
Uncivilized behavior of pedestrians0.760.240.620.52Satisfier3.54
Building facade effect0.690.310.450.38Satisfier4.02
Street furniture0.080.920.39−0.84Frustrator3.92
Barrier-free facilities0.840.160.320.68Delighter3.69
Speed of motor vehicles0.820.180.280.64Delighter3.95
Street lighting0.550.440.270.12Hybrid4.59
Odor during walking0.740.260.270.48Satisfier4.01
Falling objects from height0.120.880.25−0.76Frustrator4.23
Cleanliness of pavements0.460.540.24−0.08Hybrid4.30
Number of routes available0.670.330.240.34Satisfier4.27
Separation facilities of pavement0.56 0.44 0.160.12Hybrid4.13
Pavement encroachment 0.130.870.15−0.74Frustrator3.24
New town
Building facade effect0.490.511.1−0.02Hybrid4.73
Cleanliness of pavements0.290.710.73−0.42Dissatisfier4.78
Green landscaping0.690.310.450.38Satisfier4.49
Uncivilized behavior of pedestrians0.360.640.25−0.28Dissatisfier4.32
Shading by street trees0.370.630.24−0.26Dissatisfier4.62
Odor during walking0.550.450.20.1Hybrid4.64
Falling objects from height0.580.420.190.16Hybrid4.78
Green light passing time0.820.180.170.64Delighter4.65
Street lighting0.370.630.16−0.26Dissatisfier4.76
Levelness of pavement0.870.130.150.74Delighter4.5
Waterlogging of pavements0.930.070.140.86Delighter3.98
Anti-slip effect of pavement0.670.330.120.34Satisfier4.28
Disclaimer/Publisher’s Note: The statements, opinions and data contained in all publications are solely those of the individual author(s) and contributor(s) and not of MDPI and/or the editor(s). MDPI and/or the editor(s) disclaim responsibility for any injury to people or property resulting from any ideas, methods, instructions or products referred to in the content.