Article

Elaboration and Characterization of a Biochar from Wastewater Sludge and Olive Mill Wastewater

1
Laboratory of Biotechnology, Conservation and Valorisation of Natural Resources (LBCVNR), Faculty of Sciences Dhar El Mahraz, Sidi Mohamed Ben Abdallah University, Fez 30000, Morocco
2
Laboratory of Electrochemistry, Modelisation and Environnment Engineering, Faculty of Sciences Dhar El Mahraz, Sidi Mohamed Ben Abdallah University, Fez 30000, Morocco
3
Laboratory of Functional Ecology and Environment, Faculty of Sciences and Technology, Sidi Mohamed Ben Abdellah University, Fez 30000, Morocco
4
Laboratory of Applied Organic Chemistry, Faculty of Sciences and Technology, Sidi Mohamed Ben Abdellah University, Imouzzer Street, Fez 30000, Morocco
5
Department of Botany and Microbiology, College of Science, King Saud University, Riyadh 11451, Saudi Arabia
6
Genetics and Bioengineering, Faculty of Engineering and Natural Sciences, International University of Sarajevo, 71210 Sarajevo, Bosnia and Herzegovina
*
Author to whom correspondence should be addressed.
Sustainability 2023, 15(3), 2409; https://doi.org/10.3390/su15032409
Submission received: 4 January 2023 / Revised: 15 January 2023 / Accepted: 23 January 2023 / Published: 29 January 2023
(This article belongs to the Section Resources and Sustainable Utilization)

Abstract

:
The objective of this study is to valorize two waste products which, until now, caused major problems concerning their management and impacts on the environment and health. This study concerns the sludge of the wastewater treatment station of the city of Fez-Morocco and the olive mill wastewater, which are produced, respectively, in quantities of around 51,100 t/year and 514,350 m3/year, by pyrolysis for the production of biochar. The obtained biochar was characterized by physicochemical and spectroscopic analyses. The results show that the biochar is close to neutrality and is characterized by an important organic and mineral load; further, it is endowed with a porous surface, which could facilitate the adsorption of different polluting substances, composed mainly by micropores. It is mainly composed of alcohol, phenol, carboxyl and phenyl groups, as well as other mineral elements including silica and calcite. The composition, structure and morphology of the biochar thus prepared recommend its use in various fields, such as the treatment of pollutants, organic amendment, the reinforcement of polymers and as a secondary building material.

1. Introduction

Population growth, industrialization, agricultural development and unthinking modernization are among the main sources of environmental pollution [1,2] in the form of the excessive amounts of solid and liquid waste generated and not treated or recovered [3], which can directly impact human health and the environment.
In addition, according to the United Nations Organization (UNO), by 2030, the need for water will increase by almost 50% [4], which will lead to the reduction of water resources and make it more difficult to access [5]. However, this crisis can also influence other sectors; in particular, the needs of the agricultural sector.
On the one hand, the quantities of wastewater produced from different sources—domestic, industrial, commercial or agricultural [6]—further aggravate the environmental situation.
In this regard, the National Office of Electricity and Drinking Water (NOEDW) aims to increase the number of wastewater treatment stations (WWTS) to 164 by 2023 for a total capacity of nearly 530,000 m3/d [7], to treat and minimize the impact of wastewater on the environment. This is accompanied by the production of huge quantities of foul-smelling sludge. The forecasts are for a national production of 300,000 tons/year by 2025 and 500,000 tons in 2030 (ONEP, Morocco) [8], with a quantity of approximately 150 to 200 kg/year per inhabitant equivalent [9]. Hence, there is need for well thought out management of these wastes due to their increasing volume and the risks of pollution they generate [8].
In Morocco, no national program (PNA, DMA, DD...) encourages the definition of a regulation on the management of sludge from wastewater treatment stations [10]. Currently, they are either dumped or recovered (73%) by spreading on agricultural land as an organic amendment despite their high pollution load and dryness [11,12].
On the other hand, Morocco is among the Mediterranean countries producing olive oil; it currently has a cultivated area of 998,000 hectares and an annual yield of 1,143,000 tons of olives generating 514,350 m3 of olive mill wastewater [13]. According to the latest statistics of the Regional Directorate of Agriculture of Fez-Meknes, the region Fez-Meknes monopolizes more than 36% of the national production of olives accompanied by 185,166 m3 of olive mill wastewater [14], of which less than 30% is transformed into solid waste by natural evaporation. The rest is discharged into rivers, causing serious environmental and technical problems that arise from the malfunction of wastewater treatment stations during the period of olive crushing (November-February); this is due to the production’s high acidity and large loads of settleable, non-biodegradable organic matter, including polyphenols [14].
There are several studies on the treatment and valorization of these two types of waste, in particular on the production of biochar which is a solid material resulting from a pyrolysis, a thermal treatment [15] based on the action of heat in an inert atmosphere (no oxidation or addition of other reagents) which allows us to obtain a carbonaceous solid, i.e., the biochar, an oil and a gas, i.e., the wood distillate [15,16]. Pyriolysis starts at a relatively low temperature level (200 °C) and continues up to about 1000 °C or more.
Indeed, the biochar could be made from different sources, e.g., animal matter such as manure chicken [17,18], bovine bones [19], fish waste [20] such as shellfish [21] and fish scales [22], or vegetal waste [23,24], wood waste [25,26] or biomass [27].
In addition, the biochar can be used in many fields, especially in agriculture; in fact, it can be used to promote soil fertility and increase agricultural yields [28] as well as reduce salt stress [29] and detoxify the soils for the cultivation of lettuce [16,30].
The objective of this investigation is the elaboration of a biomaterial “biochar” based on olive mill wastewater and the sludge of wastewater treatment stations, and the determination of its physicochemical and spectroscopic characteristics that determine the areas of its further use outside the realm of agriculture.

2. Materials and Methods

2.1. Materials

To realize this work, we used sludge supplied by the wastewater treatment station of the city of Fez (STEP) which was stabilized by anaerobic digestion, dehydrated by filter band and brought to 80% of dryness by solar drying. The olive mill wastewater was issued from a traditional olive crushing industry in the industrial quarter DOKKARAT of the city of Fez.
Both wastes are conditioned, transported, stored and analyzed according to the standards approved by AFNOR NF EN 14742 [31] for sludge and enacted by Rodier for wastewater [32].

2.2. Preparation of Biochar

In a 100 L forced action mixer, Soroto model, a mass of sludge of 80% dryness was mixed for 15 min with a volume of OM wastewater in order to reproduce a dryness of 50% mixture of sludge and OM wastewater and to enrich the mixture in carbon owing to the richness of the OM wastewater in organic and mineral matters. The obtained mixture was dried again naturally or in a forced way in order to increase again its dryness to 80%. The dry powder was slowly pyrolyzed, in the absence of oxygen, at 500 °C for 4 h in a tubular furnace opening to 1700 °C, model HTRV-A 17/70/250. The cooled product constitutes the biochar. This last one was analyzed by analytical and spectroscopic methods to foresee its use in the depollution of the environments.
It should be noted that in the case where the olive mill wastewater was supplied from a modern crushing unit where there is the addition of water in the crushing process, it is necessary to take into account the dilution factor in order to obtain the expected results or to reach the desired concentrations in carbon rate and/or mineral matter in the finished product, i.e., the biochar.

2.3. Physicochemical Characterization of Biochar

The physicochemical characterization of the biochar was carried out by determining the pH (ISO 10390-2005) with a pH meter type HANNA pH 209, the electrical conductivity (ISO 11256-1994) with a conductivity meter type HANNA EC 214, the humidity of the dry matter (ISO 11465-1993) with an oven type BOXUN, the organic matter (NF EN 13039-2011) with a muffle furnace type Barustead Thermolyne 1400 °C. Total organic carbon and mineral matter was deduced from the value of organic matter by a calculation according to AFNOR standards. Total nitrogen Kjeldhal (ISO 11261-1995) was determined with a SELECTA nitro-pro type distiller, fat content (NF EN ISO 734-1, 2000), and polyphenol content was determined according to the Folin–Ciocalteu method (ISO 14502-1-March 2005) with a spectrophotometer model UV-1800PC UV/VIS.
Trace elements and metallic trace elements are determined by inductively coupled plasma atomic emission spectrometry (ICP-AES) model Activa of Horiba Jobin-Yvon, equipped with an argon plasma.
It should be noted that the fat (MG), polyphenols (Phy) and metallic trace elements (ETM) were analyzed to verify the non-toxicity of the biochar because the raw materials which constitute it are waste.

2.4. Surface Chemical Characterization of Biochar

This was accomplished by evaluating the point of zero charge (PZC), performed by the method developed by Kalay et al. [33]. The porous texture was studied by the adsorption of methylene blue (BM) according to Pelekani and Snoeyink [34]. The measurement of the indices of methylene blue was performed by spectrophotometry reported by Hameed et al. [35] Iodine was determined by ASTM D4607- 94 [36], deduced from the AWWA standard defined by Robinson and Hansen [37]. The type of surface functions were analyzed by Boehm’s method [38], extracted from the work of Baudu et al. [39].

2.5. Spectroscopic Characterization of Biochar

Spectroscopic characterization was accomplished by analysis of the biochar by Fourier transform infrared spectroscopy (FTIR), X-ray diffraction (XRD) and scanning electron microscopy (SEM) coupled with an EDX probe and UV spectroscopy.
FTIR analysis was performed using a Bruker (Germany) Vertex 70 IR-TF spectrophotometer, in the range of 400–4000 cm−1, using the ATR mode, and accumulating 16 scans with a resolution of 4 cm−1.
The DRX diffractogram of the PM powder was obtained by PAN-Critical X’ Pert Pro X-ray diffractometer equipped with a monochromatic Cu-Kα source (1.54 Å), operating at a voltage of 40 kV and a filament current of 30 mA to assess the crystallinity of the biochar. The DRX was recorded with a continuous scan from 5° to 80° with a scan step time of 34 s. Abundant chemical components in the material are predicted by processing via the International Diffraction Data Center (IDDC) powder diffraction database.
Scanning electron microscopy (SEM) was used to determine the surface morphology of the biochar, and via an environmental scanning electron microscope equipped with an EDX probe, model QUANTA 200 coupled to energy dispersive spectroscopy (EDS) at an accelerating voltage of 15 kV.
Thermogravimetry (TGA) was used to determine the absolute mass loss of biochar as a function of temperature. It was operated using a LINSEIS STA PT1600 instrument. A mass sample of 18.9 mg was introduced into an alumina crucible supported on a balance located in the instrument’s oven. The analysis was performed in an air atmosphere with a ramp of 10 °C/min in the temperature range of 30 °C to 1000 °C.

3. Results and Discussions

3.1. Physicochemical Characterization of the Biochar

Physicochemical analyses (Table 1) show that biochar is almost neutral and non-toxic [40] due to its negligible load of polyphenols, fatty matter (FM) and metallic trace elements (Table 2). It has a high dryness (80%), an important mineral composition favoring ionic exchange and heat transfer and thus can be used as a thermal conductor [41] or as an addition to the manufacture of construction materials such as bricks and paving stones.
In addition to its richness in trace elements (Table 2), including calcium (64.01 mg/g), sodium (25.34 mg/g), potassium (22.59 mg/g), magnesium (18.65 mg/g), iron (7.47 mg/g), aluminum (4.44 mg/g), potassium (3.70 mg/g) and the presence, in decreasing order, of chromium, zinc, copper and silver, the biochar has an average organic composition (Table 1) of which more than half is in the form of organic carbon and almost 1% in total nitrogen Kjeldhal, leading to a C/N ratio between 10 and 15. This margin is recommended for its use as an organic soil amendment in difficult climates, i.e., those poor in mineral and organic elements.
The result obtained corroborates several research works that have shown the fertilizing efficiency of biochar in combination with other organic amendments [42,43,44].
The acquired results could indicate the use of this biochar as an organic amendment because of its richness in trace elements (Ca, Na, P, Mg, K, Fe, Zn, Mn, Cu, Zn and Ag) for soils poor in these elements.

3.2. Surface Characterization of Biochar

3.2.1. Zero Charge Point pHpzc of Biochar

The pH of zero charge (pHpzc) corresponds to the pH of the solution for which the curve C, representing the final pH versus the initial pH of the solution (Figure 1), crosses the first bisector B (final pH = initial pH).
It is relative to the pH of the aqueous solution in which the biochar exists under a neutral electric potential. It is equal to 5.80, thus explaining why the biochar surface is positively charged for pH of the medium lower than this value; it is thus protonated and acidic. In addition, for a pH of a medium higher than the pHpzc, the biochar surface is negatively charged and becomes deprotonated and basic. This type of surface could be favorable for the adsorption of anionic pollutants (pH < pHpzc), as well as cationic (pH > pHpzc).

3.2.2. Specific Surface of Biochar by the Methylene Blue Method (BM)

The mesoporous volume of biochar was estimated by adsorption experiments of the cationic dye BM. The adsorption isotherm was established by stirring 0.5 g of biochar for 6 h in 50 mL of BM solution at initial concentrations ranging from 20 to 100 mg/L. The mixture was centrifuged at 6000 rpm. The absorbance of the filtrate leads by extrapolation to the residual concentration of the BM at equilibrium (Qe) via the following equation:
Qe = (Co − Ce) × V/m
with Qe (mg/g) and Ce (mg/L) denoting, respectively, the amount of substance adsorbed per gram of biochar and the concentration of BM in solution at equilibrium.
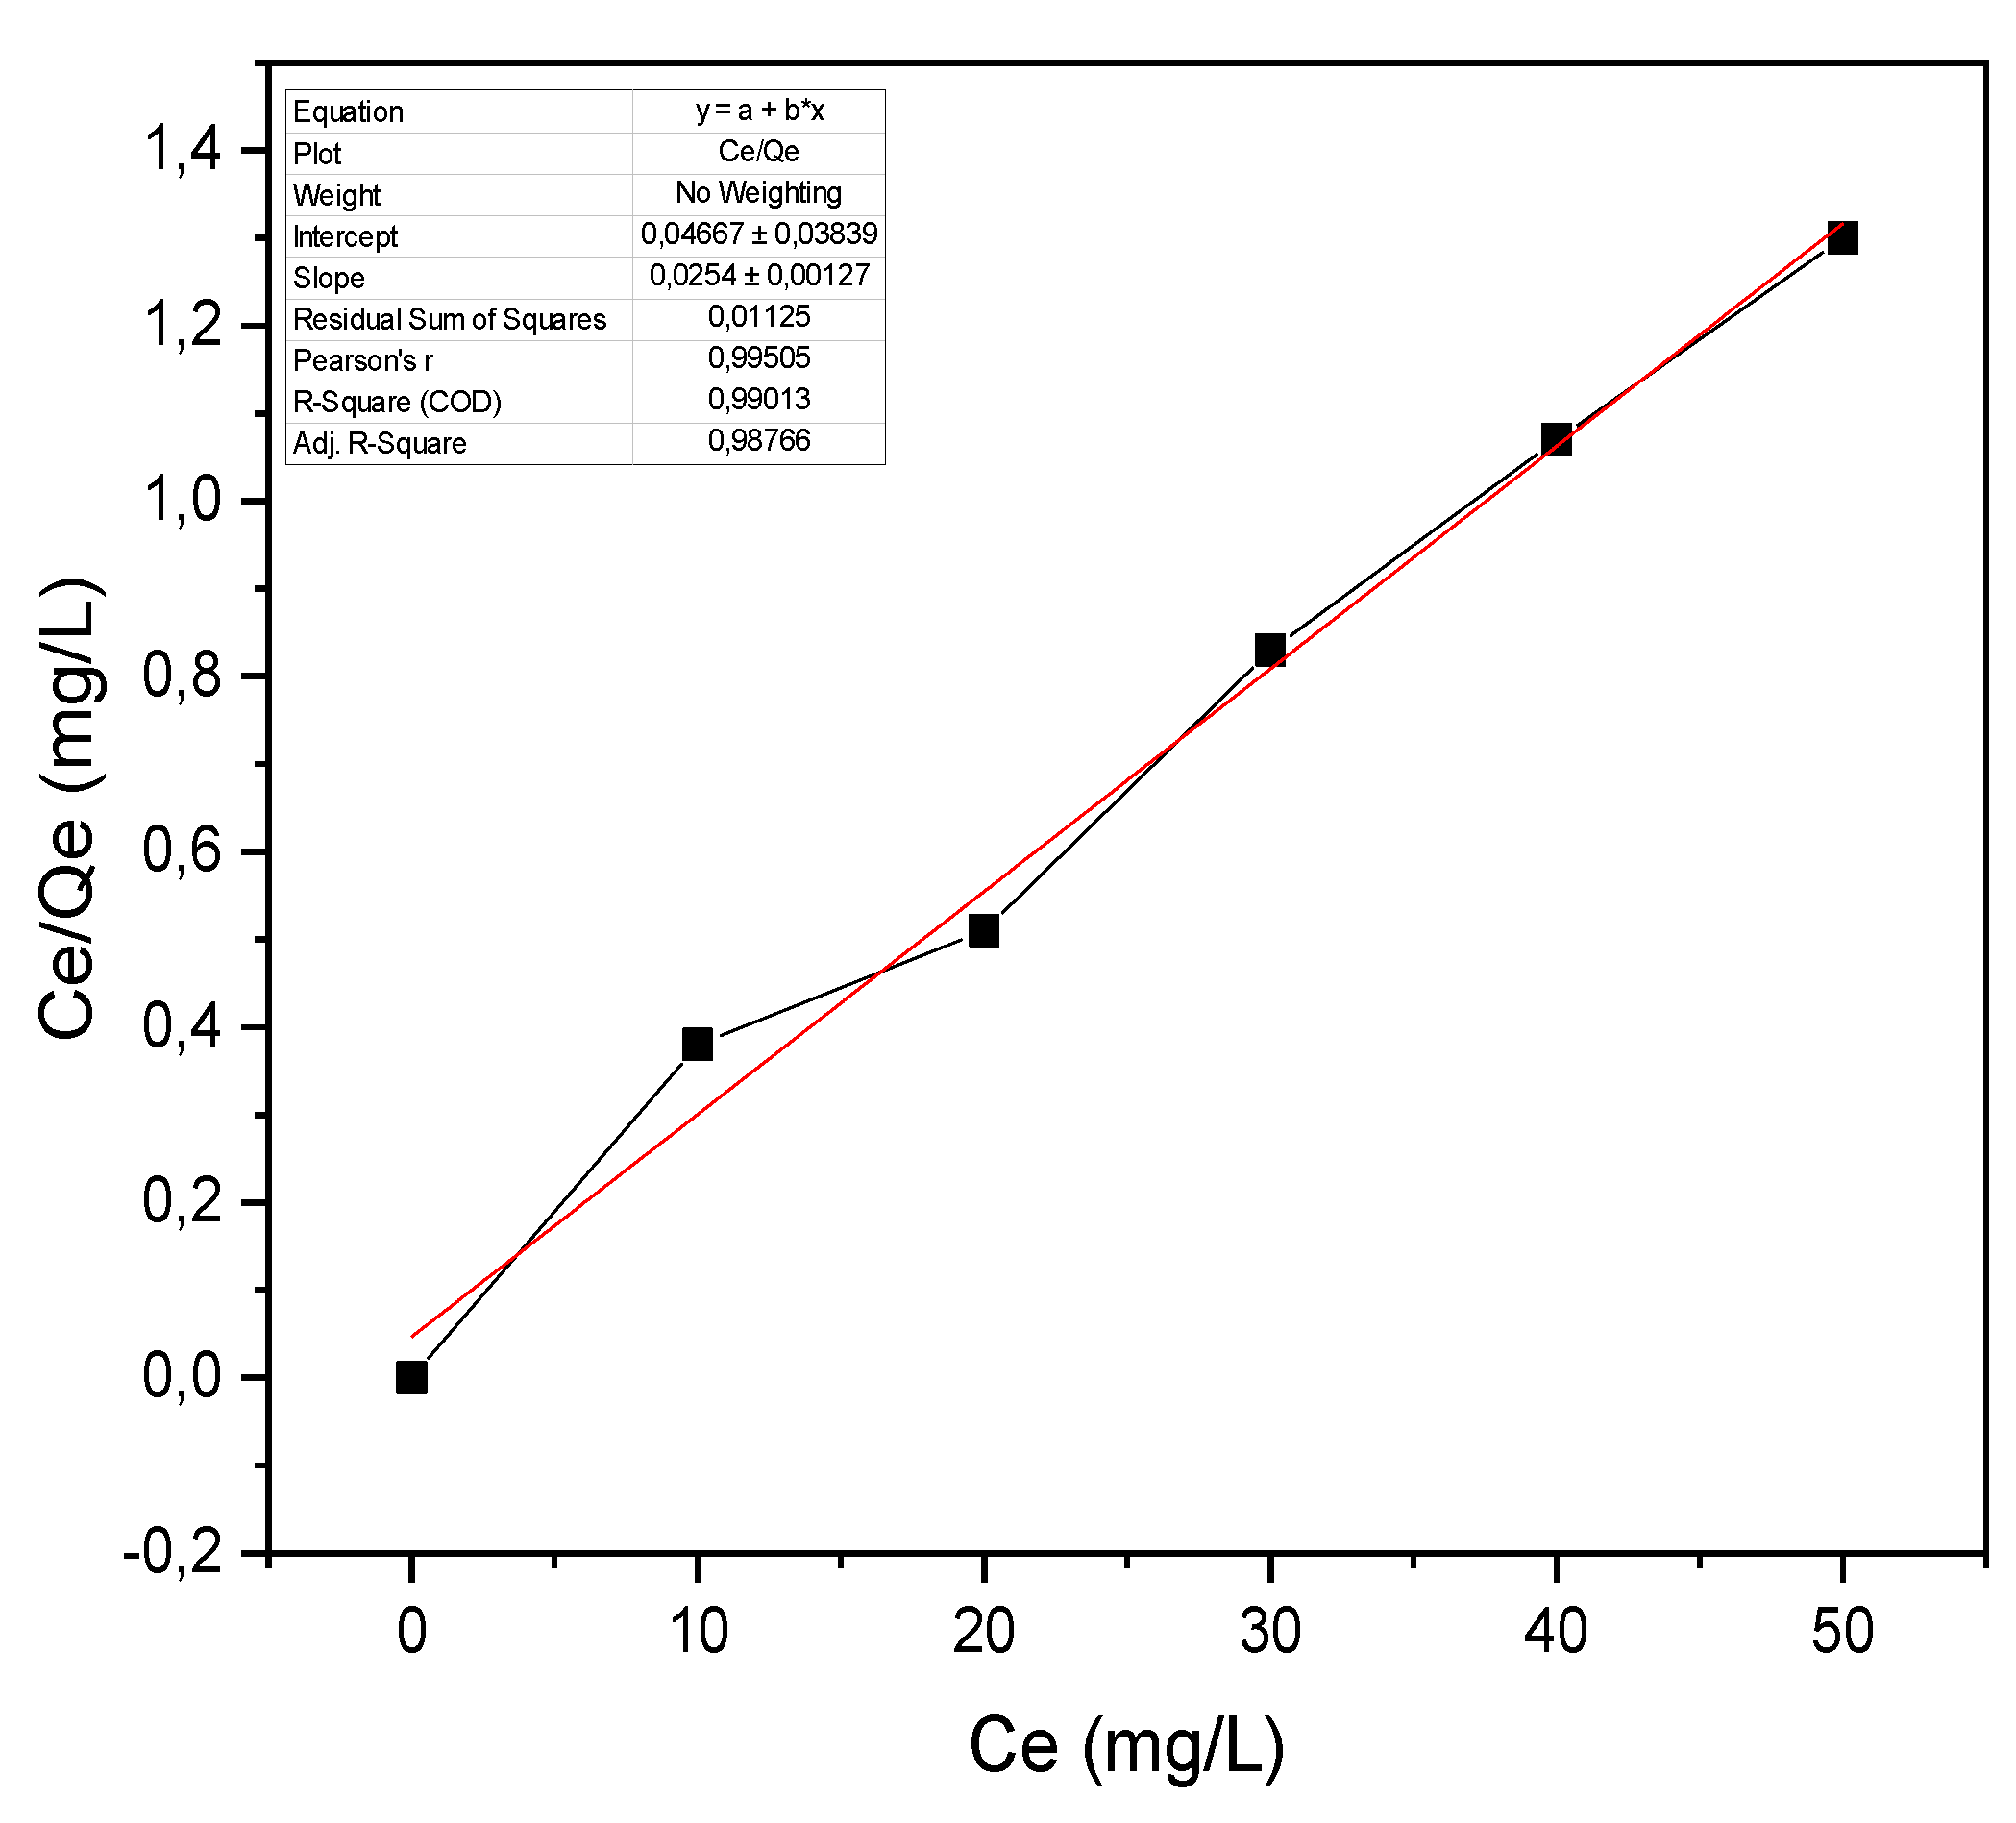
The adsorption isotherm of BM was simulated by the linear equation of the Langmuir model [45]:
C e Q e = 1 K L Q max + C e Q max
with Ce (mg·L−1): residual solution concentration at adsorption equilibrium;
Qe (mg·g−1): amount of adsorbate adsorbed at equilibrium;
KL (L·mg−1): adsorption equilibrium constant, of the BM/biochar couple, of the Langmuir model;
Qmax (mg·g−1): maximum amount of BM adsorbed.
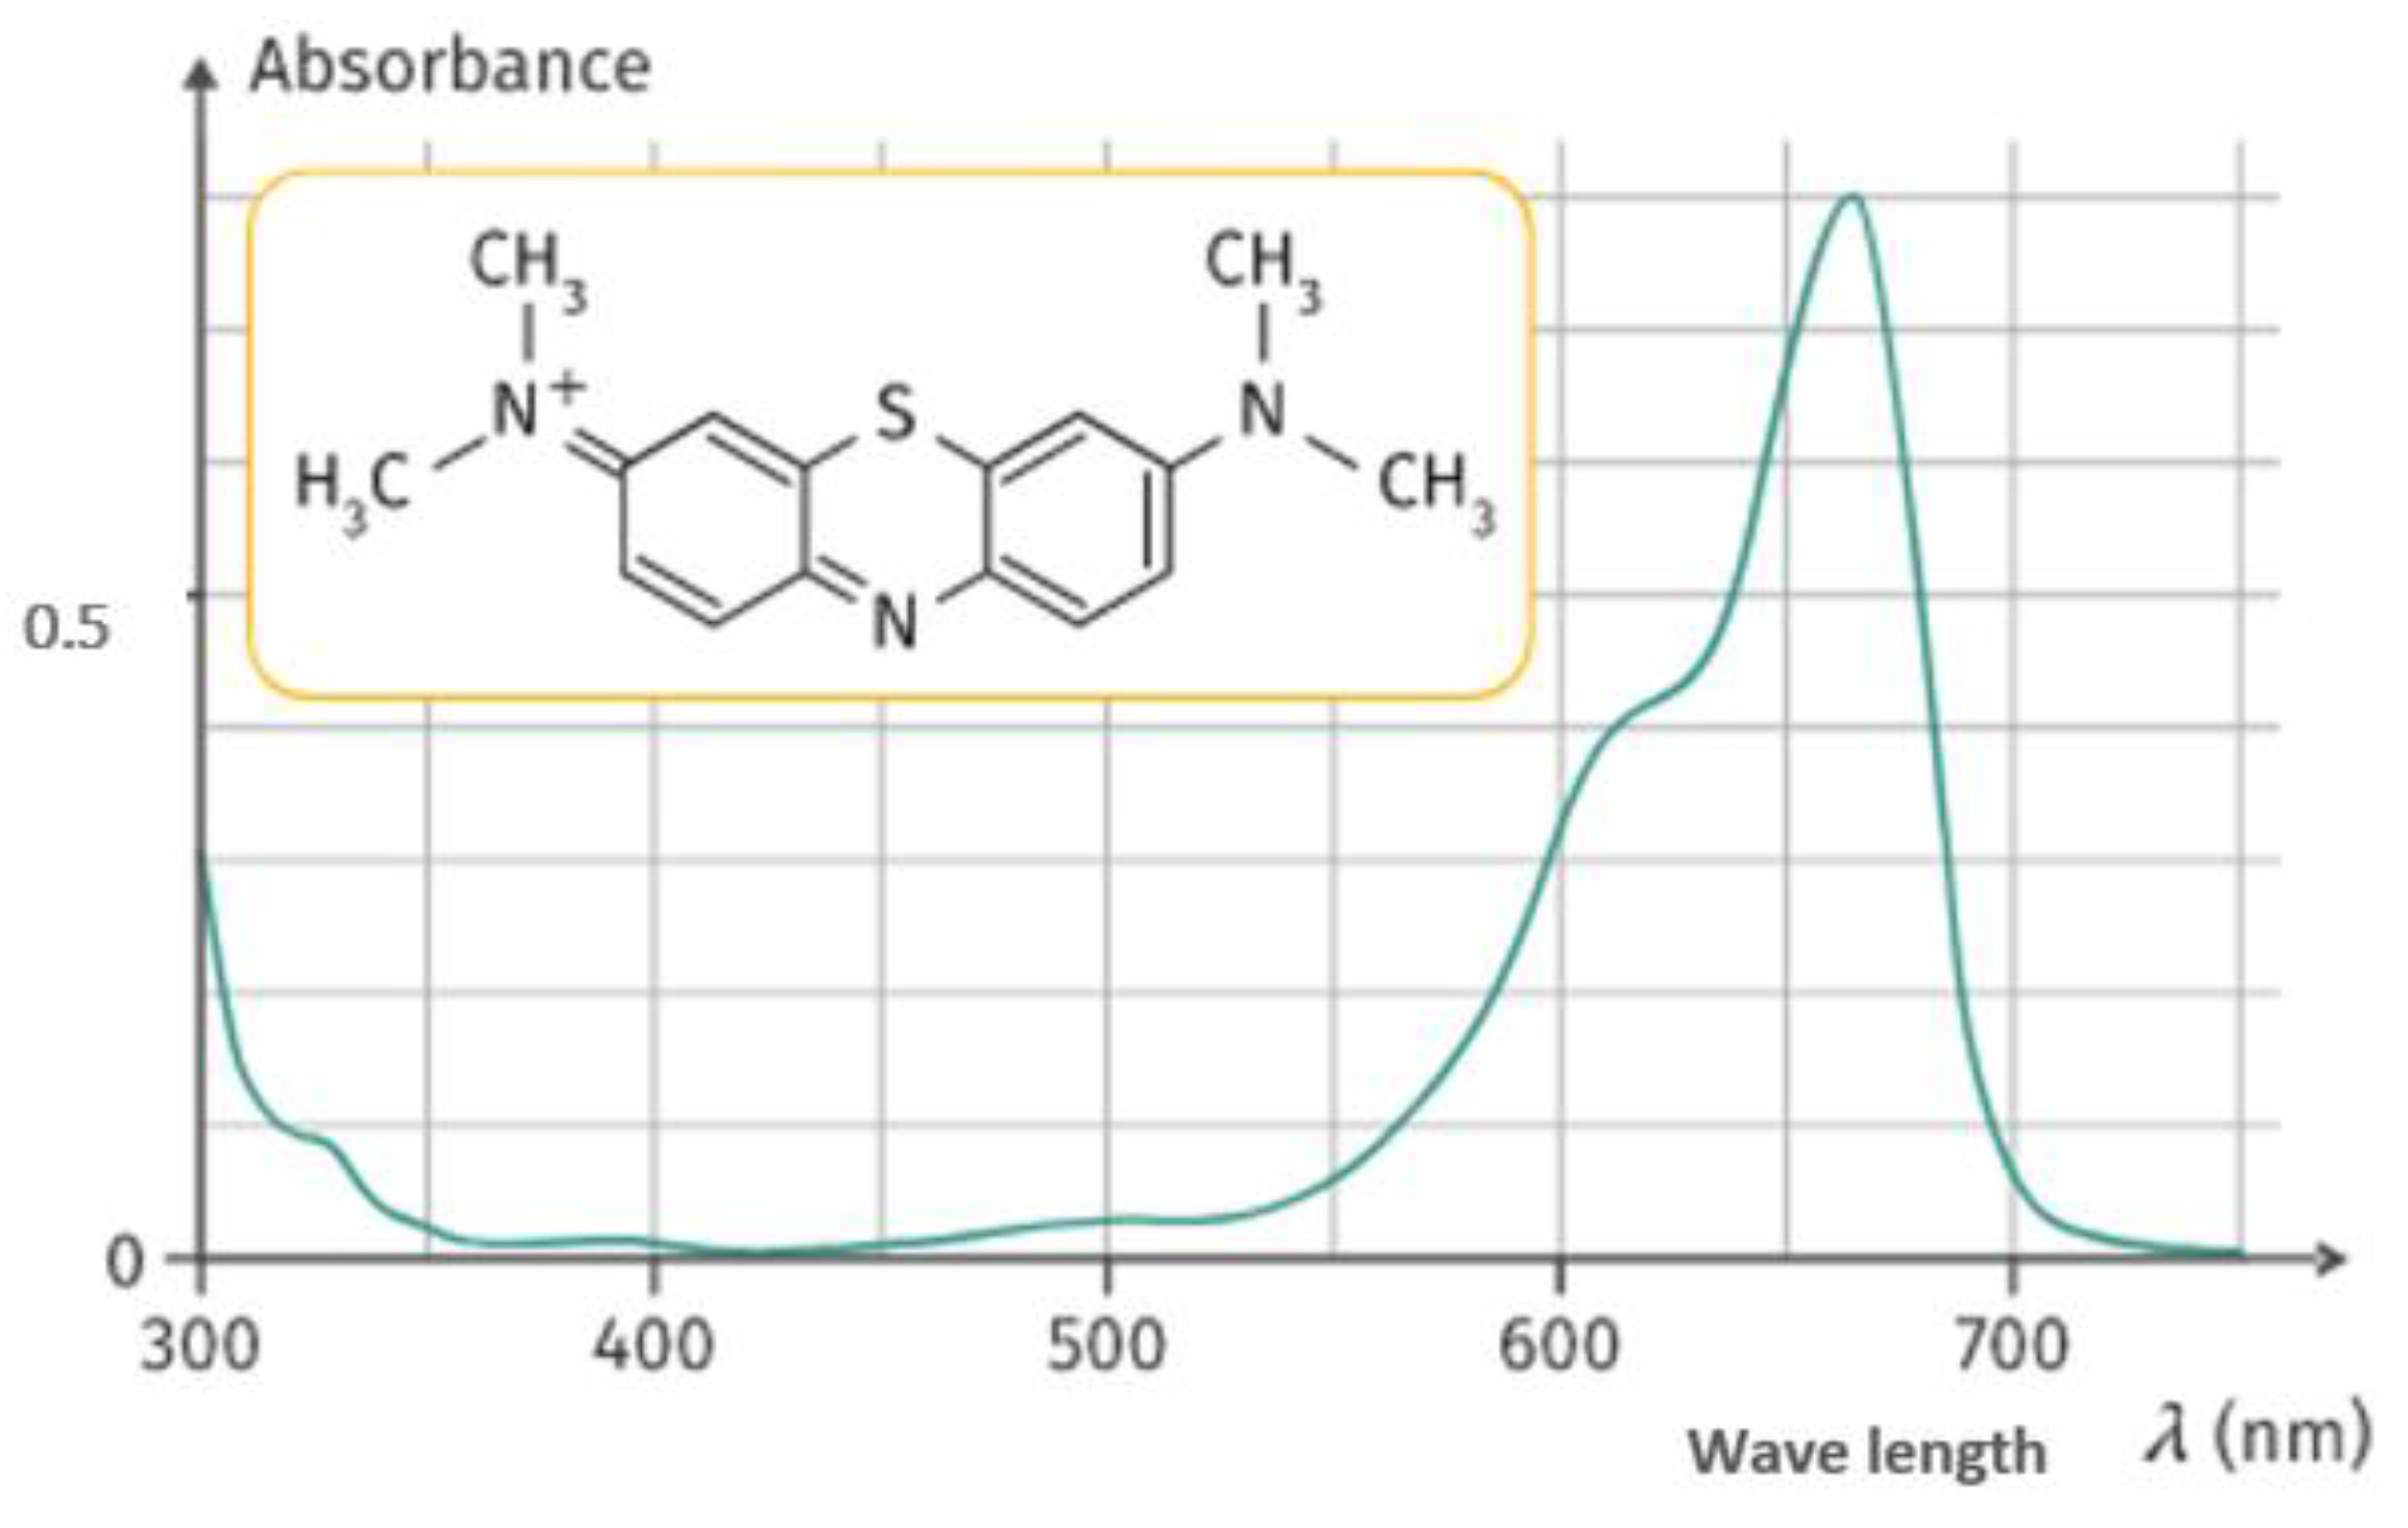
The wavelength of the dye absorption maximum (Figure 2) is 663 nm.
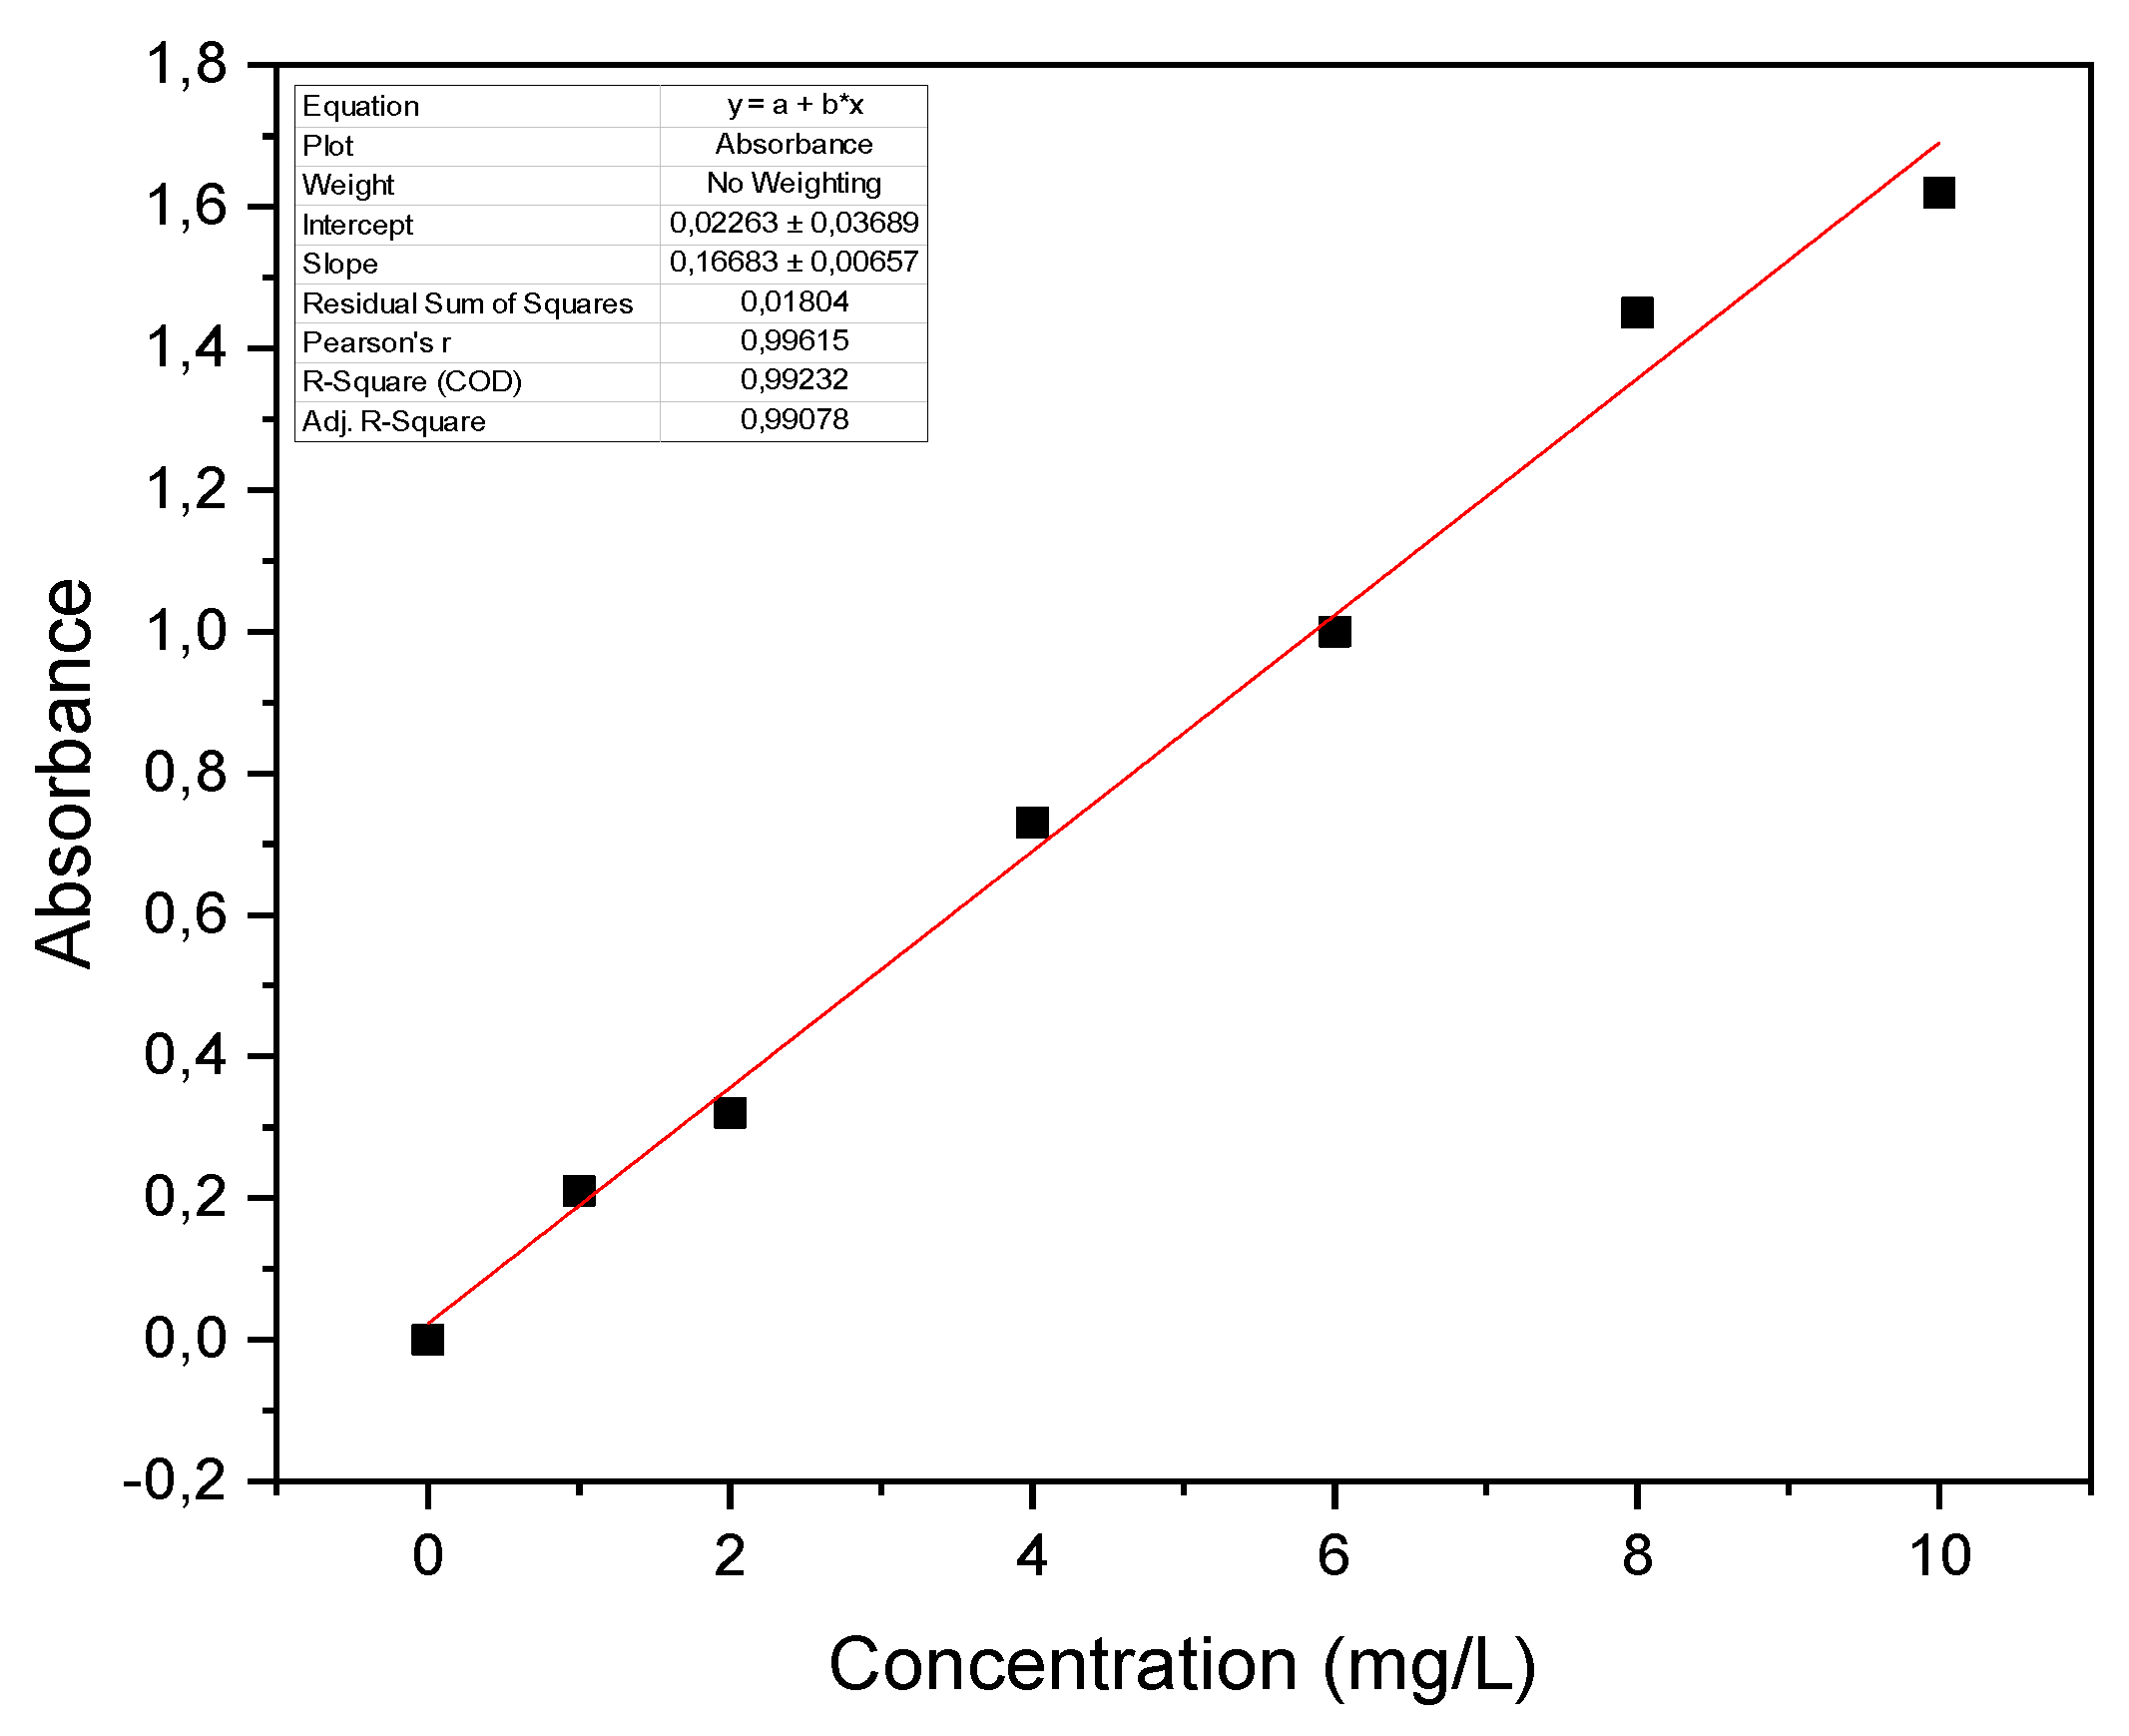
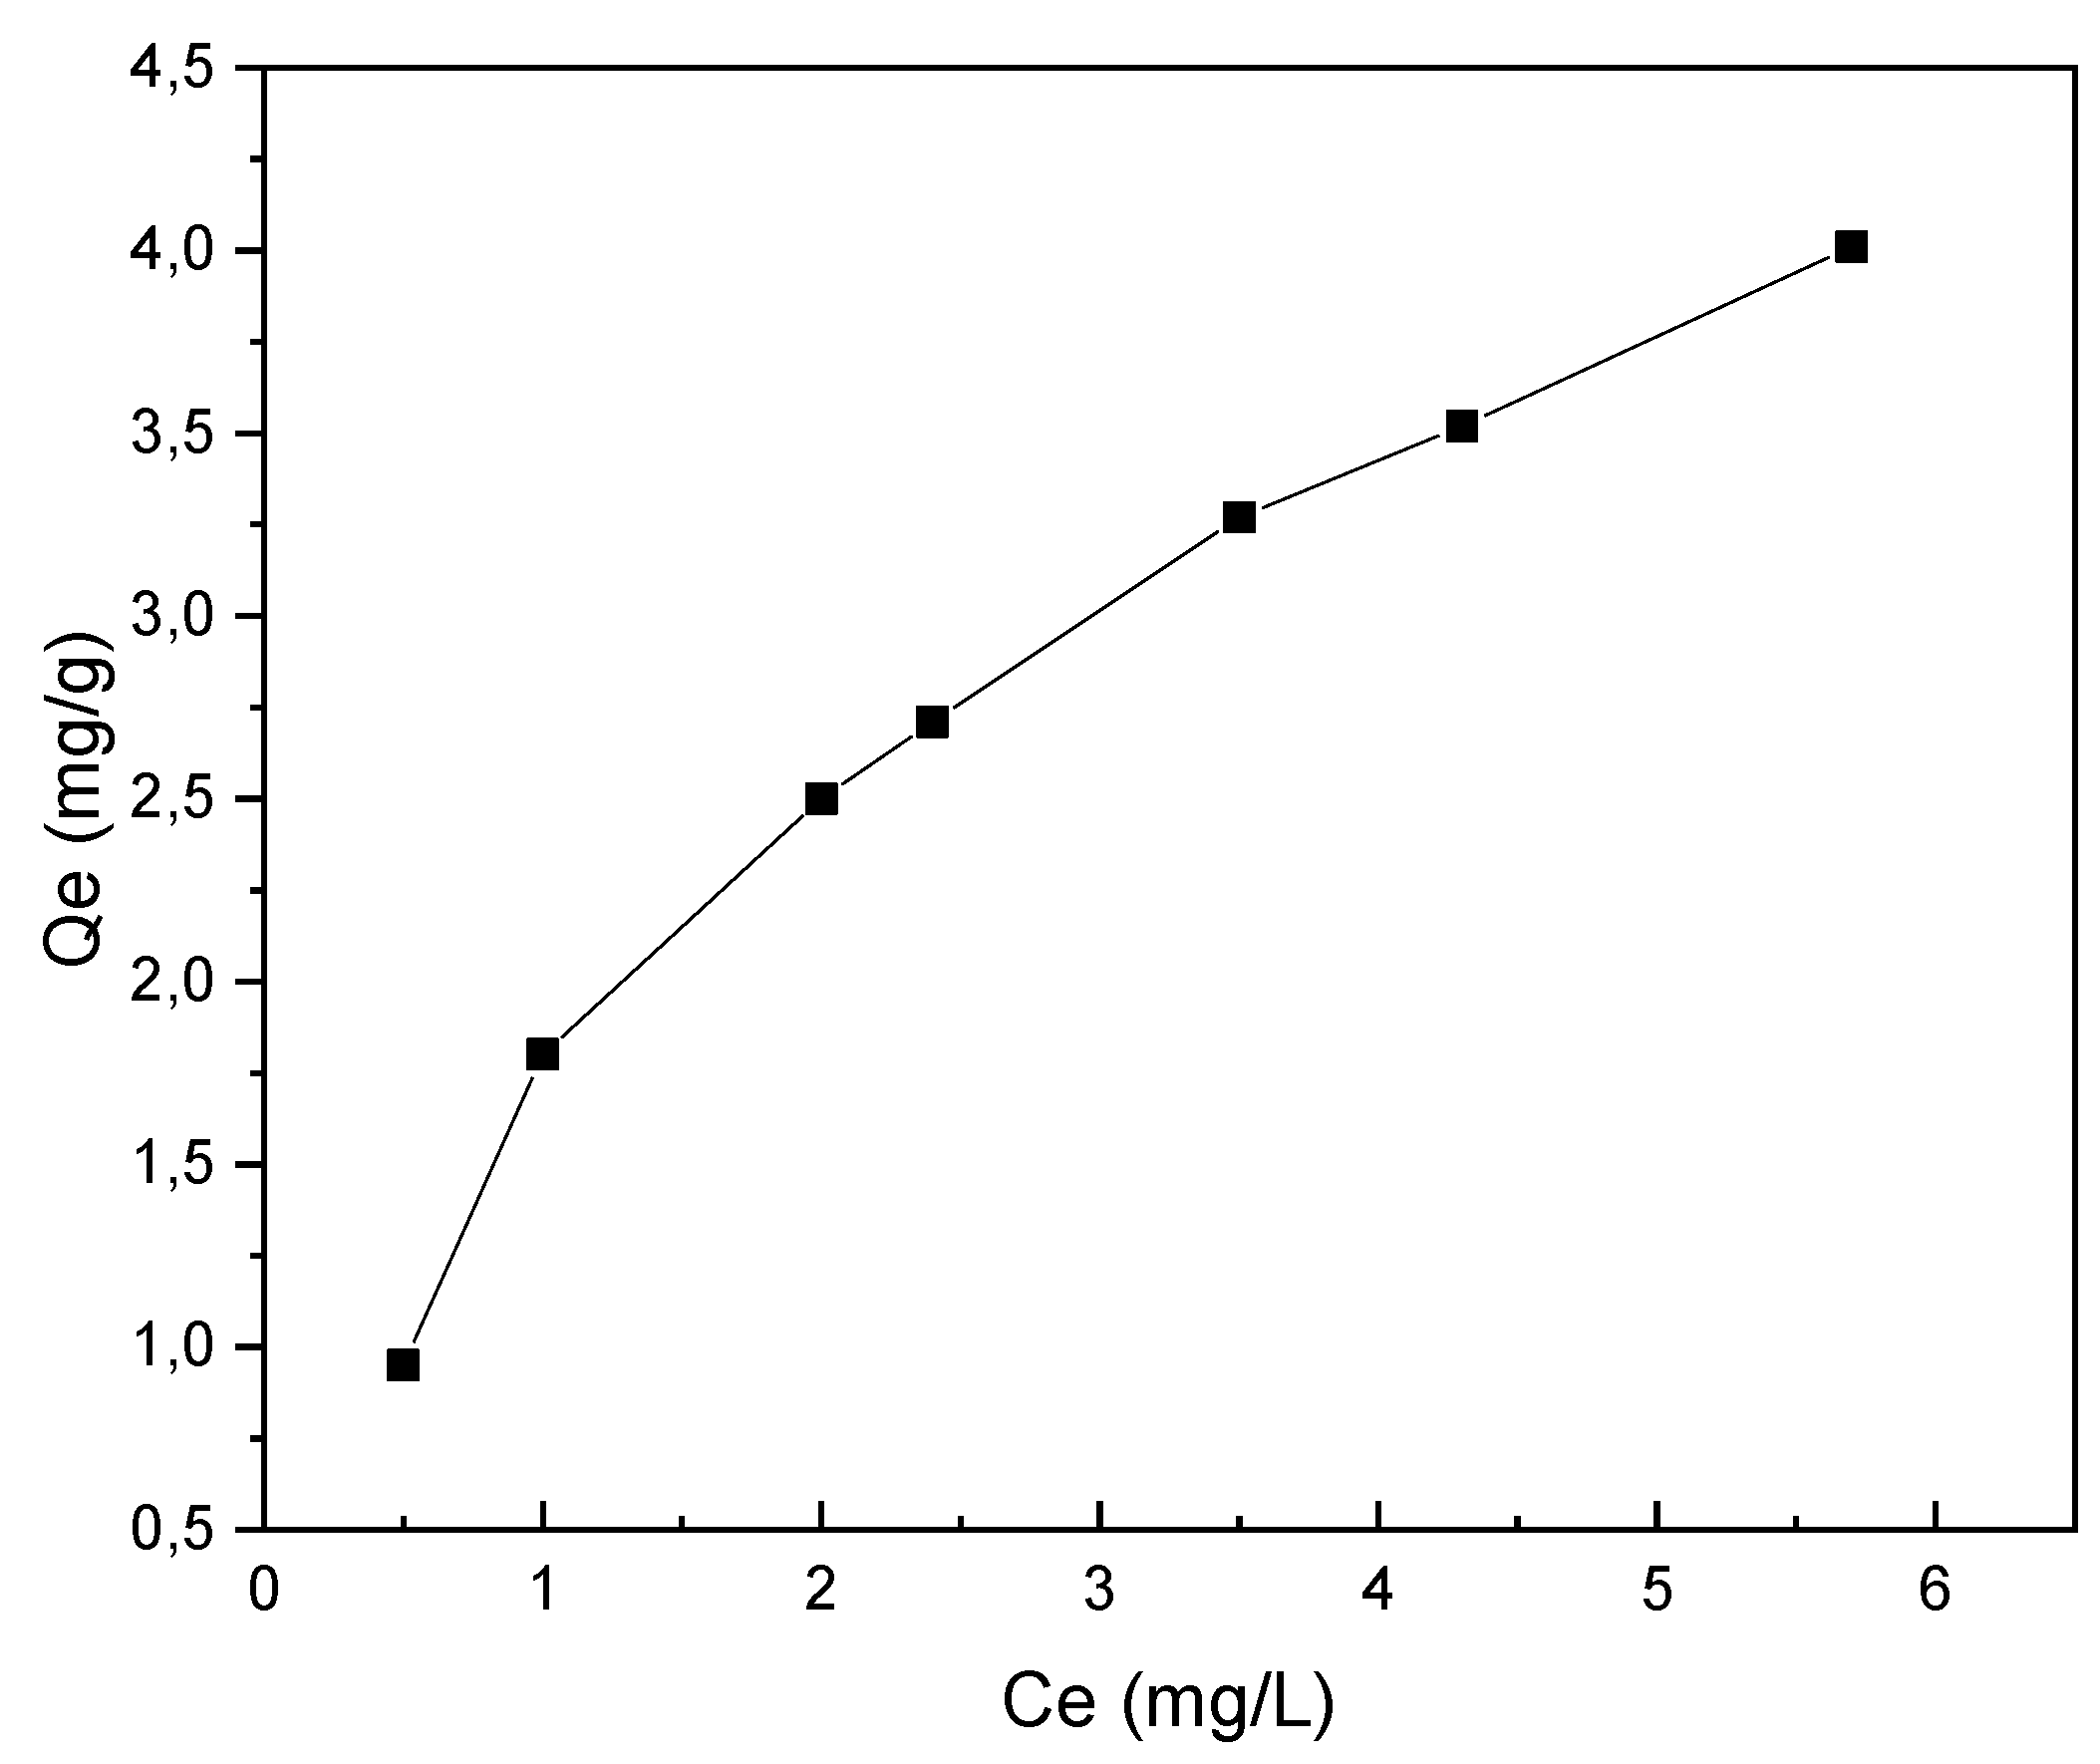
The calibration curve for methylene blue for concentrations between 0 and 10 mg/L is as follows (Figure 3), the equilibrium isotherm and Langmuir isotherm are presented in Figure 4 and Figure 5, respectively.
The specific surface area of the biochar covered by the BM molecule (SBM) is evaluated from the Qmax of the adsorbed BM following the equation:
S BM = Q max A BM ( 6.02 × 10 23 M BM )
with:
ABM: molecular surface area of BM = 1.30 nm2 [46];
MBM: molar mass of BM = 319.85 g·mol−1;
Qe: Quantity adsorbed at equilibrium (mg·g−1);
Ce: Concentration of the solution at equilibrium (mg·L−1).
The calculated surface area of the studied biochar is 694.71 m2/g. This encourages its exploitation as an adsorbent material for environmental pollutants.

3.2.3. Methylene Blue Index (MBI)

The IBM of the elaborated biochar is evaluated by measuring the absorbance at 620 nm via a spectrometer of a diluted filtrate obtained by the stirring of 1 g of biochar in 25 mL of methylene blue solution of concentration 1.20 g/L for 30 min (Hameed et al., 2007), and expressed in mg of adsorbed methylene blue per g of biochar according to the expression:
I BM   =   [ ( C i C r × m b m b ) ] × V
with:
Ci: Initial concentration of the solution (1.2 g/L);
Cr: Residual concentration after 30 min of agitation (mg/L): Mb: Mass of biochar (1 g);
V: Volume of BM (25 mL).
The IBM of the biochar is 9.2 mg/g, proving that the mesoporous surface is capable of adsorbing some molecules of medium size (2–50 nm) and sizes larger than 50 nm.

3.2.4. Iodine Index (Ii)

Ii is obtained by stirring 0.2 g (Mb) of biochar in 10 mL of 5% hydrochloric acid, boiled for 30 s, to which was added 20 mL (Vads) of 0.1 N iodine (C0) while maintaining stirring for 30 s. The mixture was then filtered. Of the filtrate, 10 mL ( V I 2 ) is titrated with 0.1 N sodium thiosulfate (Cn) in the presence of starch starch.
Ii is the amount of iodine absorbed (mg) per g of biochar) according to the equation:
I i   ( mg · g 1 ) = [ C 0 C n V n 2 V I 2 ]   M I 2 V ads M b
with:
Vn: Volume of sodium thiosulfate at equivalence (mL);
MI2: Molar mass of iodine (254 g·mol−1).
The Ii of the studied biochar reveals that it is microporous (462.35 mg·g−1). This explains why the internal surface of the micropores of this material could retain small molecules (<2 nm) [46] of polluting water, atmosphere or soil.

3.2.5. Surface Chemical Characteristics of Biochar

Oxygen and basic group contents are determined by mixing 0.15 g of the biochar with 50 mL of a 0.1 mol·L−1 aqueous solution of each reagent (NaOH, Na2CO3, NaHCO3, NaOC2H5, HCl). The solutions are stirred for 48 h and then filtered. Of each filtrate, 30 mL is determined by pH-metry. The basic solutions are assayed by HCl (0.1 mol∙L−1), the acidic solution by NaOH (0.1 mol·L−1).
The results show that the content of oxygenated functional groups in the biochar is 9.6%. The corresponding Boehm assays (Table 3) exhibit fewer basic groups (lactones and carbonyls) than acidic groups (carboxyl’s and phenolics), indicating its slightly acidic character.

3.3. Spectroscopic Characterization

3.3.1. Fourier Transform Infrared

The analysis by Infrared spectroscopy was carried out in order to determine the functional groups, and the bonds developed during the preparation of the biochar. The FTIR spectrum (Figure S1) was scanned between 4000 and 500 cm−1 and confirms the existence of several chemical functions: O-H C=O, C=C, Si-O et CaCO3.
The infrared spectrum results of the biochar show a bond at 3300 cm−1 of low intensity corresponding to the O-H stretching vibration, probably attributed to the polyphenols commonly found in olive mill wastewater [47,48]. The band observed near 1750 cm−1 is probably related to C=O stretching, due to the carboxylic and carboxylate form. Moreover, the peak around 1450 cm−1 could be attributed to the C=C vibrational mode of the phenyl groups; this is qualitatively confirmed with those deduced from the study of surface functions revealing the notable presence of lactone and phenol functions. While the pronounced peaks around 1000 cm−1 can be attributed to the elongation vibrations of C-O bonds characteristic of alcohols, this peak can also be attributed to the elongation vibrations of Si-O bonds in silica [49]. The peak extending to 860 cm−1 is due to the presence of calcite (CaCO3) [50].

3.3.2. X-ray Diffraction

The diffractogram of biochar presented in Figure S2 relates that the main diffraction peaks are located in the 2θ zone from 20° to 70°. Indexing of the most intense peaks revealed the presence of three crystalline phases corresponding to calcium carbonate (CaCO3), silicon dioxide (SiO2) and dolomite (CaMg (CO3)2), respectively, identified via comparison with database files reference code ICDD 01-086-0174, ICDD 01-078-1252 and COD 96-900-3514.
The peaks of CaCO3, in Rhombohedral form, are located at 2θ = 20.89, 23.14, 26.68, 29.47, 30.99, 36.06, 39.52, 41.22, 43.26, 47.58, 48.59 and 50.20°. Those of SiO2, in the hexagonal crystal form, are located at 2θ = 20.89, 23.14, 26.68, 29.47, 30.99, 36.06, 39.52, 41.22, 43.26, 47.58, 48.59 and 50.20°. On the other hand, the peaks of CaMg (CO3)2, crystallized in hexagonal form, are located at 20.89, 23.14, 26.68, 29.47, 30.99, 36.06, 39.52, 43.26, 47.58, 48.59 and 50.20. The result obtained is in agreement with a study of phosphorus adsorption on a biochar substrate moistened with olive mill wastewater [51].

3.3.3. Scanning Electron Microscopy Coupled to an EDX Probe

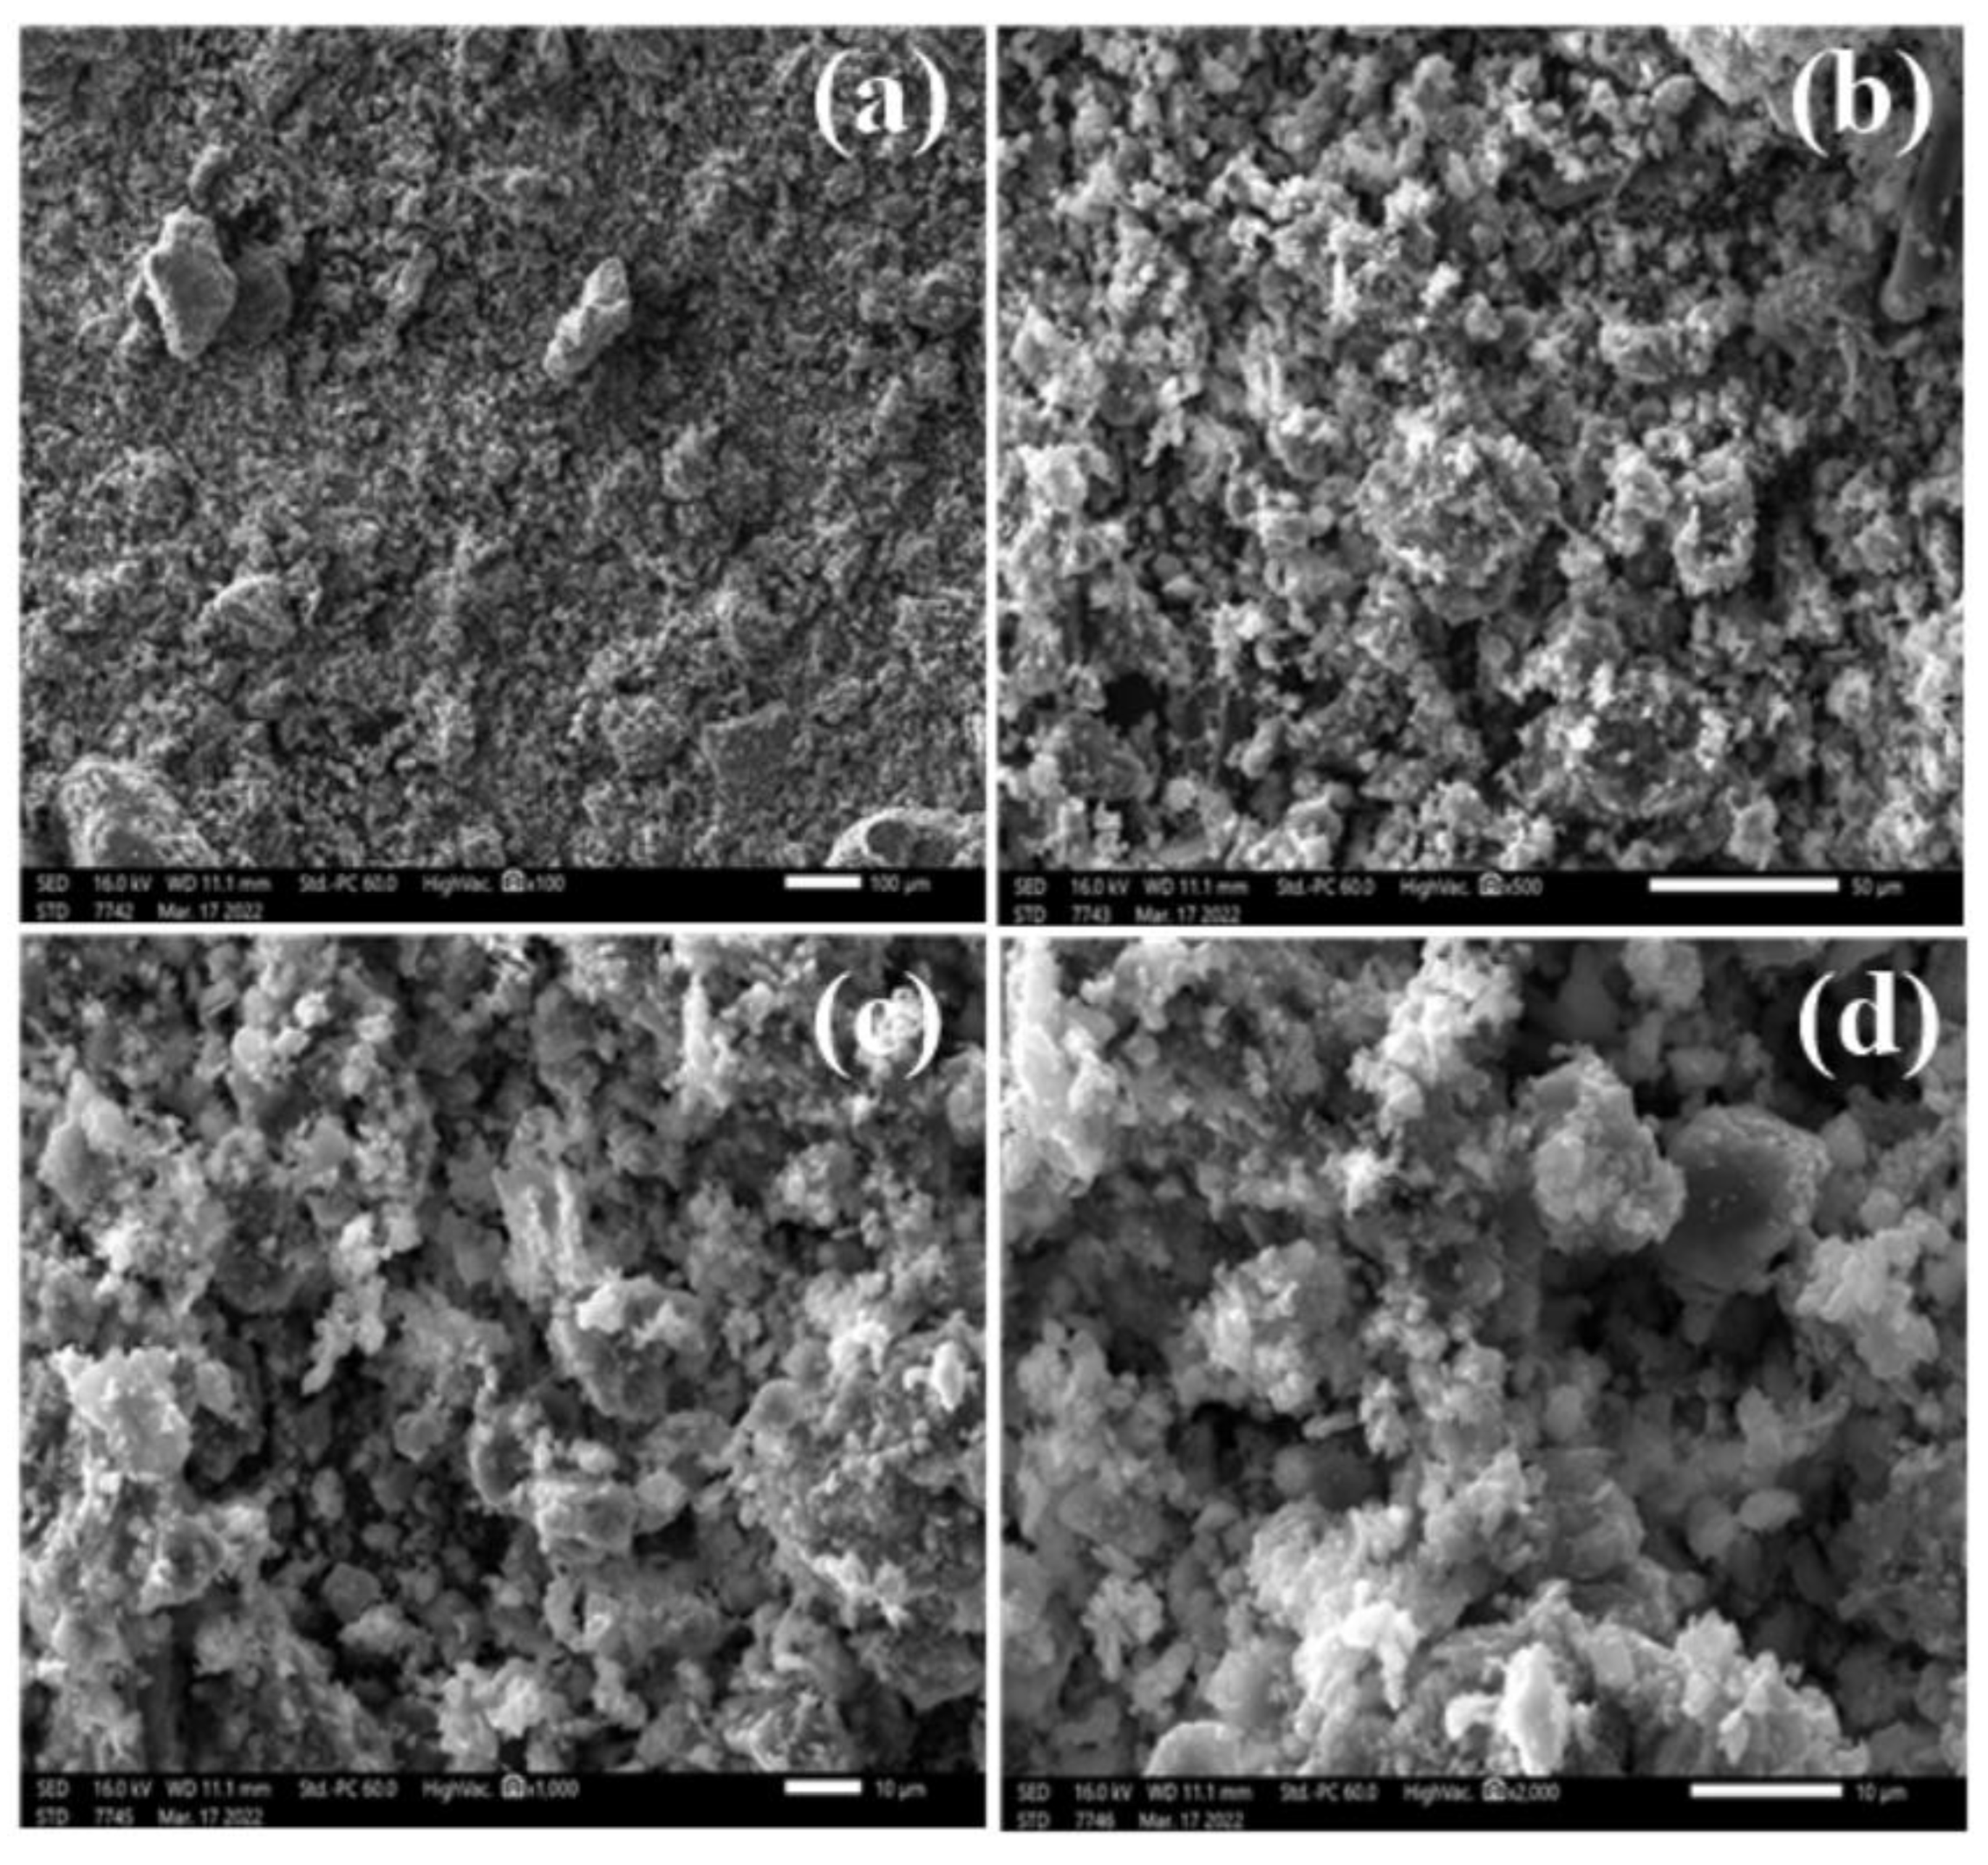
SEM images at different magnifications (Figure 6) show that the surface of the BY1B biochar is composed of condensed aggregates of small, spaced particles. Moreover, the visible, rough and irregular surface of the material reveals its porous nature.
This character is considered as a factor that favors the adsorption of pollutants from the environment by ion exchange mechanisms, and that leads to the fixation of cationic or anionic particles. Indeed, several studies have used biochar as an adsorbent to remove medical substances such as levofloxacin from aquatic environments as well as the reduction of heavy metals such as arsenic, phosphate, lead and copper and the decolorization of wastewater from textile industries. Furthermore, the biochar has the potential to have a beneficial effect on soil contaminated by hydrocarbons [30,52,53].
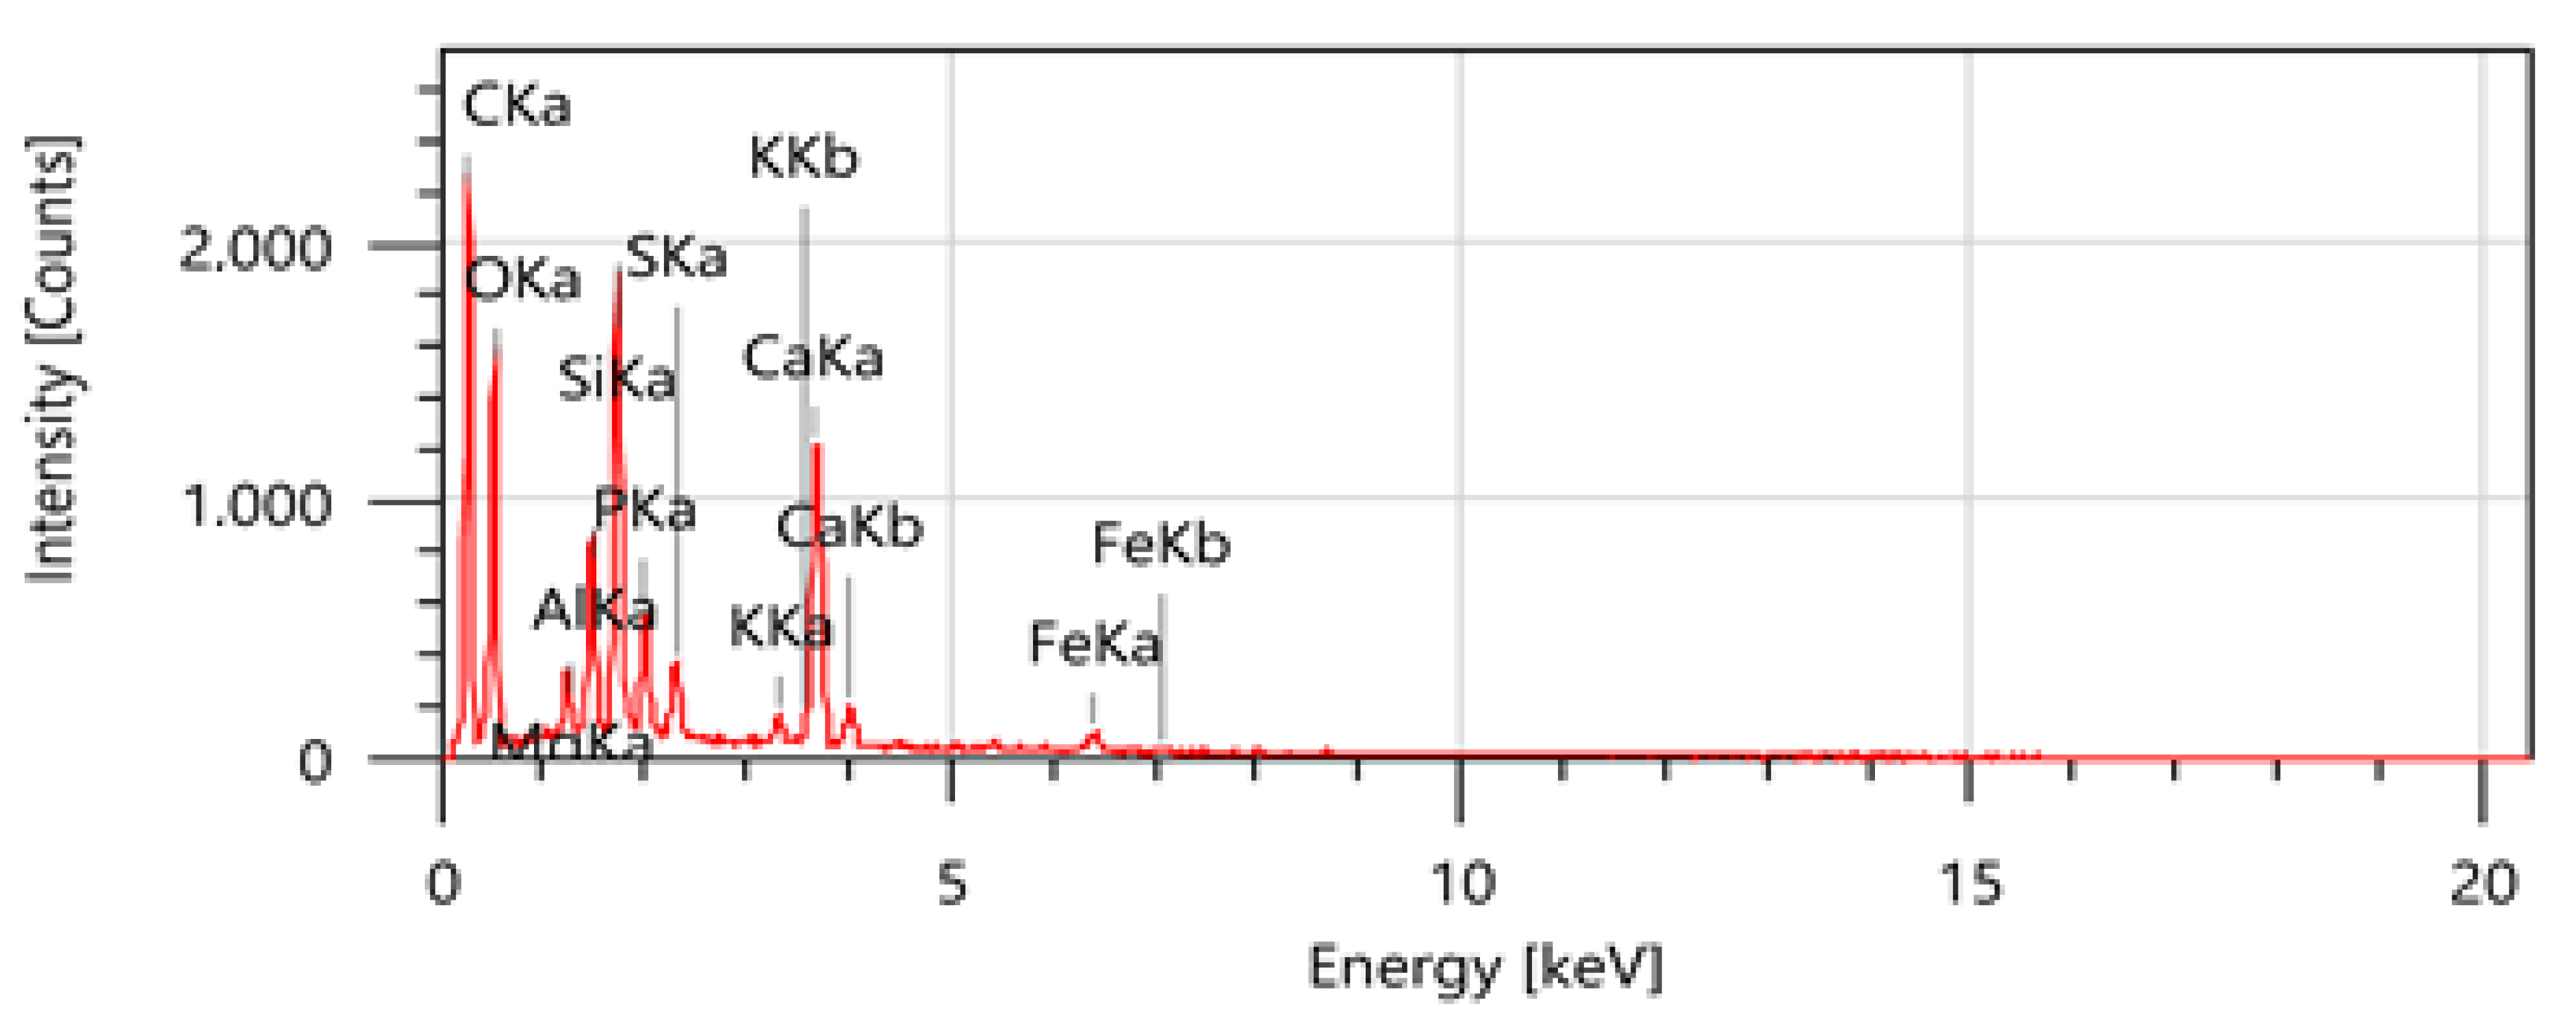
Elemental chemical microanalysis of the biochar surface allows for the quantification of its major composition in mass and atomic content [54]. This is presented in the EDX spectrum (Figure 7) and Table 4.
The spectrum relates the presence of intense peaks related to the elements carbon, oxygen, silicon, phosphorus, sulfur, calcium, aluminum, iron and potassium.
The major mass percentages of biochar are noted for carbon, oxygen, calcium and silicon at 43.59% and 29.24%, 10.26%, 6.60%, respectively. The other elements, adding up to 10.31%, constituted, in descending order, aluminum, phosphorus, iron, sulfur, potassium and magnesium.
The same ranking was recorded for the atomic percentage; the elements strongly present are carbon with 57.90, oxygen with 29.15, calcium with 4.08 and silicon with 3.75. The other elements—aluminum, phosphorus, sulfur, magnesium, iron—constitute the remaining 5.12%.
The results obtained seem to be due to the presence of different oxides, such as Al2O3, FeO, MgO, CaO, SiO2, Na2O, K2O, etc.

3.3.4. Thermal Analysis

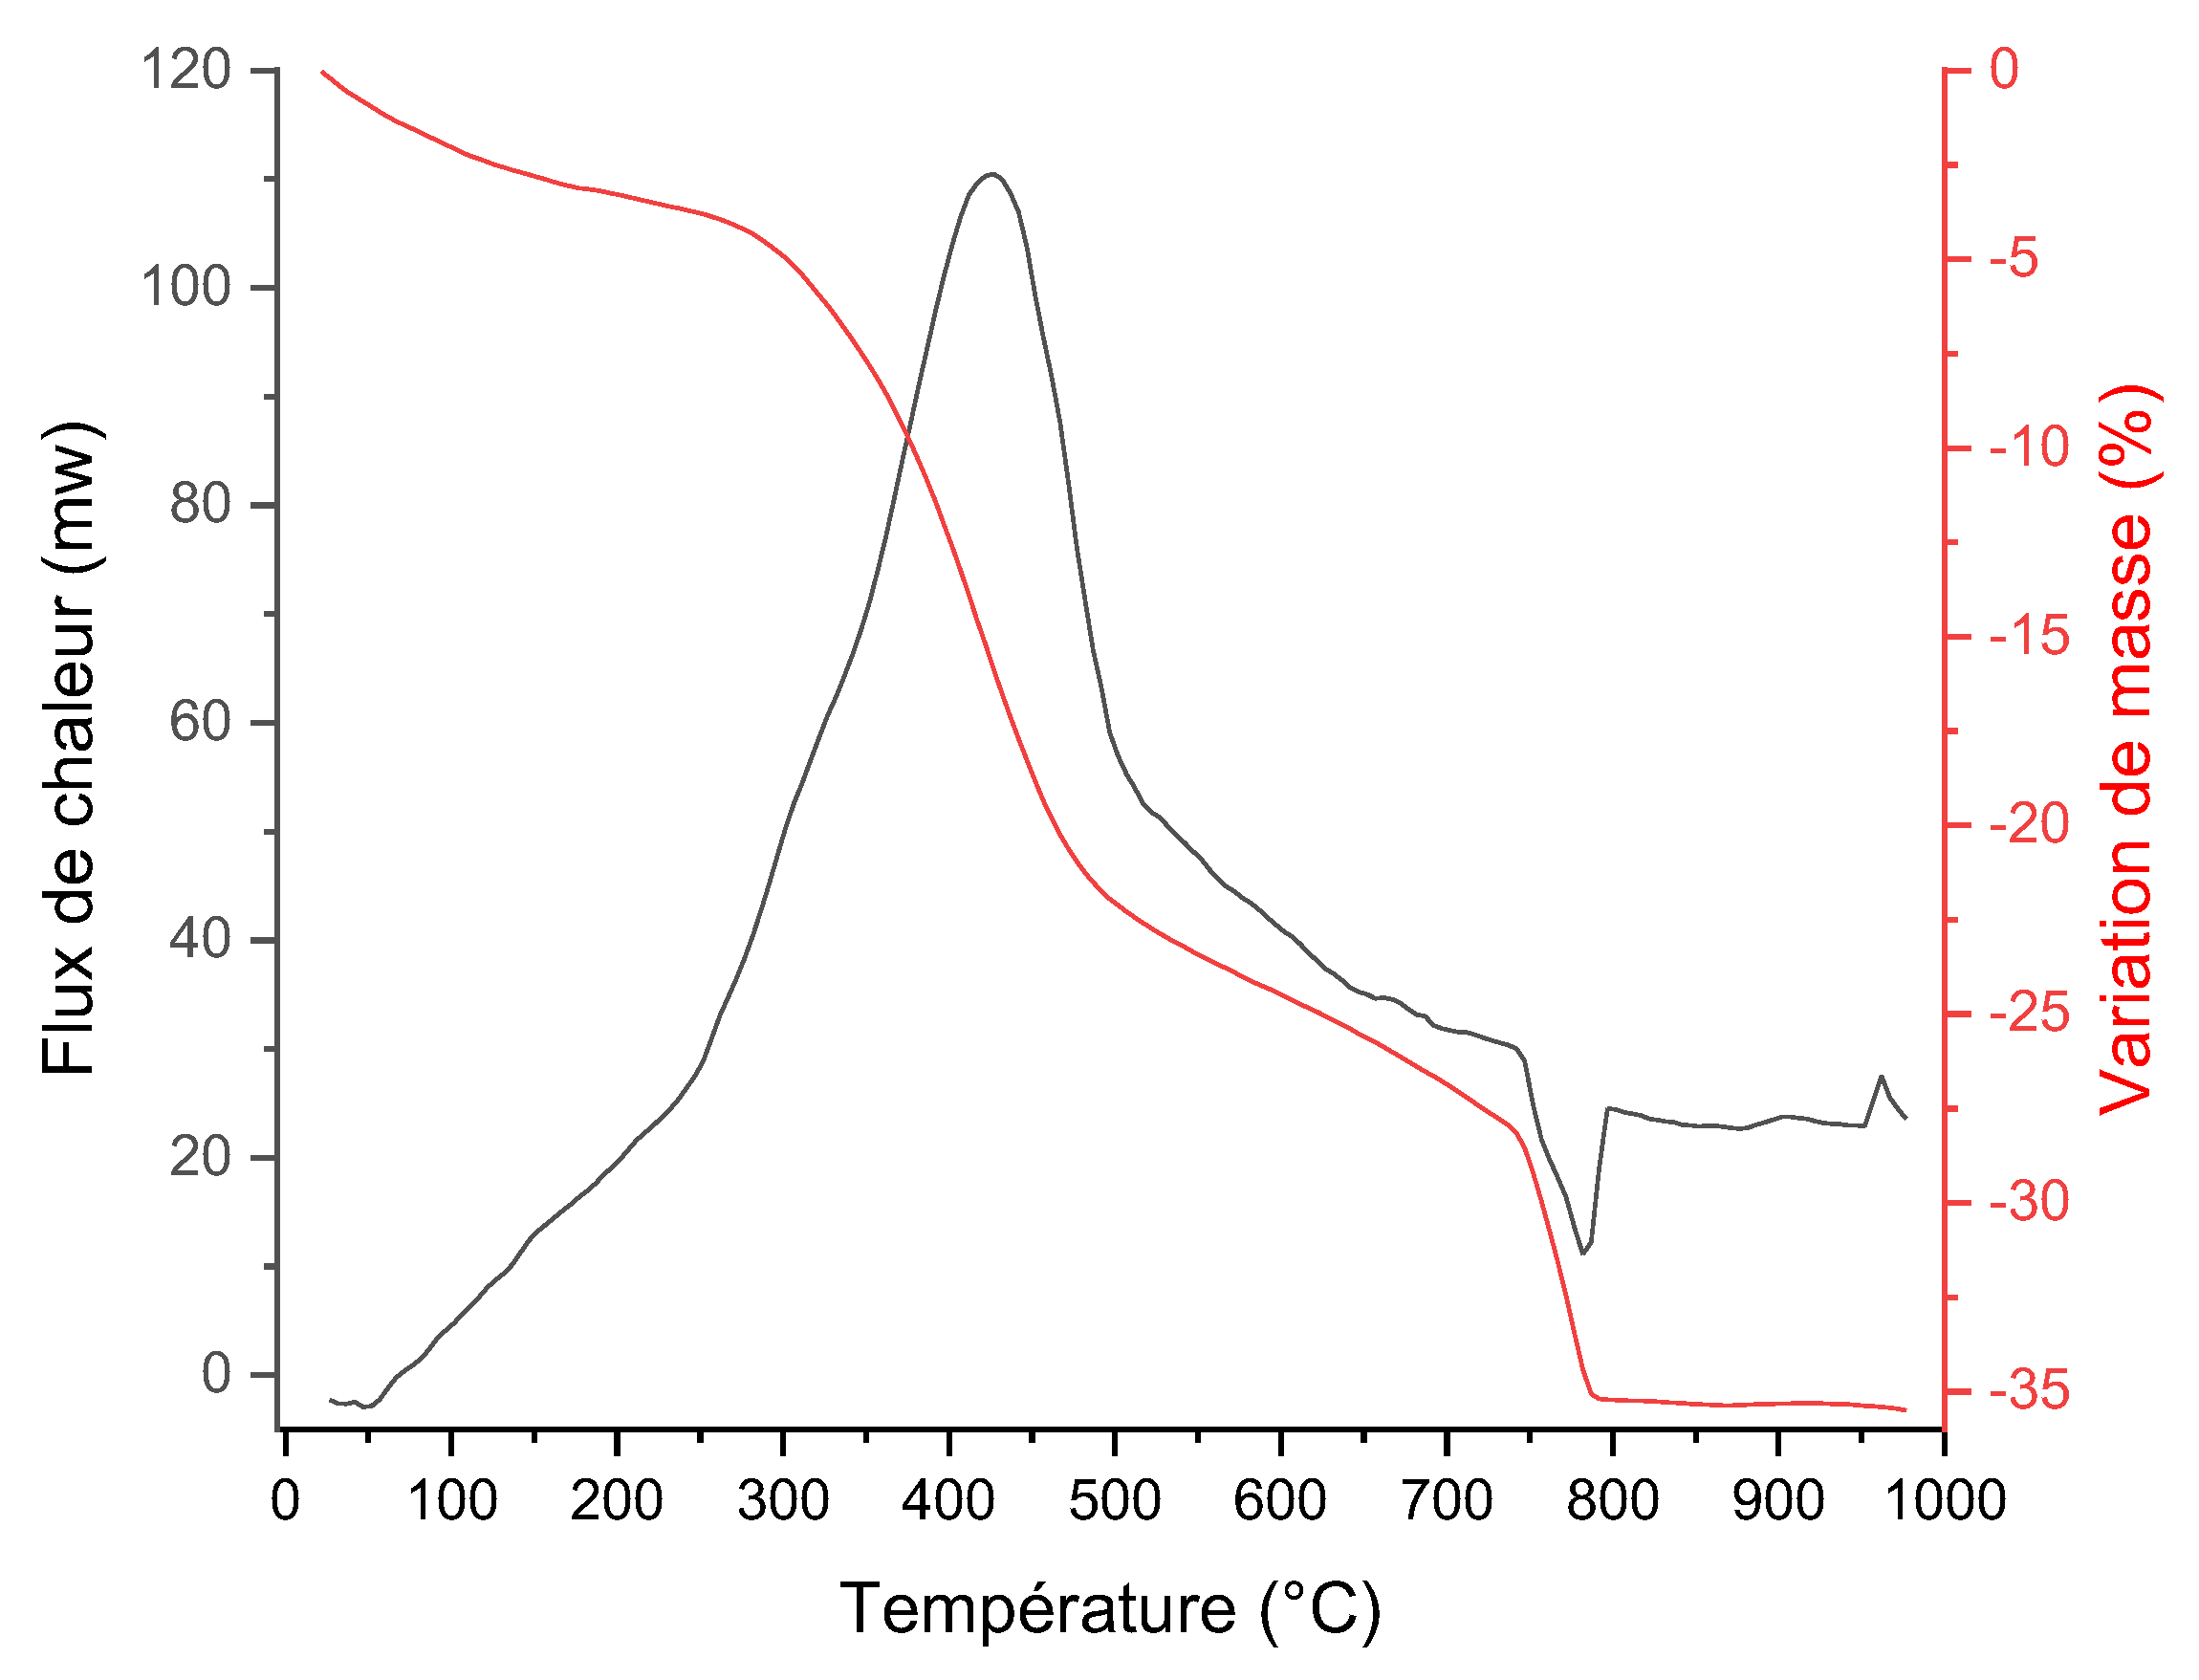
Thermal analysis of the biochar, shown in Figure 8, shows the variation in mass over a temperature range of 0 to 1000 °C.
The global mass loss was unfolded in four steps: The first loss is located between 0 and 300 °C; we noted a slight loss of 4% that could correspond to the traces of trapped water molecules (seeing that the biochar was obtained by pyrolysis). The second loss begins at 300 °C to end at 500 °C accompanied by an exothermic peak, while the third is in the vicinity of 750 °C associated with an endothermic peak. These can be attributed to the degradation of CaCO3 into calcium oxide (CaO) and carbon dioxide (CO2), according to the following reaction [55]:
CaCO 3 ( solid )     CaO ( solid ) + CO 2 ( gaz ) .
Calcite is considered to be a major component in the studied biochar. Above 800 °C, no mass loss was noticed. Indeed, an amount of 64% remains after the treatment at 1000 °C, which shows that the biochar has an organic character.

4. Conclusions

In this study, our research into a new material, biochar—originating from two precursors, sewage sludge and olive mill wastewater—allowed us to predict some potential fields of use. We could mention its application as an organic amendment to promote the fertility of soils lacking in mineral elements since its organic matter and trace element content is very high, and as a thermal conductor thanks to its high electrical conductivity. In addition, its porous morphology supports its use as an adsorbent of several pollutants exhibited in wastewater metals, dyes or in gases produced by combustion and biomethanization, including H2S, SOx and NOx. Furthermore, the material’s high dryness suggests its possible application as a by-product in the manufacture of construction materials.

Supplementary Materials

The following are available online at https://www.mdpi.com/article/10.3390/su15032409/s1, Figure S1: Infrared spectrum of Biochar; Figure S2. X-ray spectrum of Biochar (BY1B).

Author Contributions

Y.G., A.A.-H. and A.A. were charged with the writing and submission; I.M., M.R.A., E.M.S.H. and M.S.A. were charged with the funding and interpretation; M.K., A.A., M.S.E. and J.B. were charged with the supervision; M.T. and Z.R. were charged with the direction. All authors have read and agreed to the published version of the manuscript.

Funding

This work was funded by the Researchers Supporting Project (number RSP2023R173), King Saud University, Riyadh, Saudi Arabia.

Data Availability Statement

Data will be available on request.

Acknowledgments

The authors extend their appreciation to the Researchers Supporting Project (number RSP2023R173), King Saud University, Riyadh, Saudi Arabia. The research work that gave rise to this publication was carried out thanks to the contribution and synergy of all the authors. We would like to thank the Director General of RADEEF, Fatima Guennouni, who allowed us to visit the waste sites and to supply important quan-tities of samples through the STEP and depollution division of the city of FEZ.

Conflicts of Interest

The authors declare that they have no know competing financial interests or personal relationships that could have appeared to influence the work reported in this paper.

References

  1. Bairoch, P. Révolution Industrielle et Sous-Développement; Walter de Gruyter GmbH & Co KG: Berlin, Germany, 2017; Volume 9. [Google Scholar]
  2. Belhadj, M.Z. Qualité des Eaux de Surface et Leur Impact sur L’environnement Dans la Wilaya de Skikda. Ph.D. Thesis, Université Mohamed Khider-Biskra, Biskra, Algeria, 2017. [Google Scholar]
  3. Morin-Crini, N.; Crini, G.; Roy, L. Eaux industrielles contaminées. Besançon PUFC 2017, 513, 37–47. [Google Scholar]
  4. Kandalaft, J.P. L’accès à l’eau douce dans le monde: Ses principaux enjeux. Proche-Orient Études Manag. 2017, 29, 159–185. [Google Scholar]
  5. Sauquet, E.; Arama, Y.; Blanc-Coutagne, E.; Bouscasse, H.; Branger, F.; Braud, I.; Vidal, J.P. Le partage de la ressource en eau sur la Durance en 2050: Vers une évolution du mode de gestion des grands ouvrages duranciens ? Houille Blanche. 2016, 5, 25–31. [Google Scholar] [CrossRef] [Green Version]
  6. Bouleau, G.; Deuffic, P.; Sergent, A.; Paillet, Y.; Gosselin, F. Entre logique de production et de préservation: L’évo- lution de l’information environnementale dans les domaines de l’eau et de la forêt. VertigO Rev. Électronique En Sci- 403 Ences L’environnement 2016, 16. [Google Scholar] [CrossRef]
  7. ONEE National Office of Electricity. 2018. Available online: https://www.fedenerg.ma/2018/12/27/lonee-ambitionne-de-franchir-le-cap-de-160-stations-depuration-des-eaux-usees-a-lhorizon-2023/ (accessed on 7 November 2022).
  8. Arisily, T.; Hajji, A. Technologie de séchage solaire des boues des stations d’épuration des eaux usées et son impact sur la gestion des boues au Maroc. Rev. Maroc. Sci. Agron. Vet. 2020, 8. Available online: https://agrimaroc.org/index.php/Actes_IAVH2/article/view/785/1008#info (accessed on 7 November 2022).
  9. Cerra, I.; Desagnat, M.; Dubart, R.; Juven, L.; Zhou, N.; Ziani, H. Traitement des Boues des Stations D’épuration des Petites Collectivités; Montpellier, France. 2014. Available online: https://reseau-eau.educagri.fr/files/fichierRessource2_Rapport_bibliographique_traitement_boues.pdf (accessed on 7 November 2022).
  10. Belloulid, M.O. National program of sanitation and wastewater treatment in morocco: Objectives, achievements and challenges. Environ. Water Sci. Public Health Territ. Intell. J. 2018, 2, 67–76. [Google Scholar]
  11. Collivignarelli, M.C.; Abbà, A.; Frattarola, A.; Carnevale Miino, M.; Padovani, S.; Katsoyiannis, I.; Torretta, V. Legis- lation for the reuse of biosolids on agricultural land in Europe: Overview. Sustainability 2019, 11, 6015. [Google Scholar] [CrossRef] [Green Version]
  12. Cherfouh, R.; Lucas, Y.; Derridj, A.; Merdy, P. Long-Term, low technicality sewage sludge amendment and irrigation with treated wastewater under Mediterranean climate: Impact on agronomical soil quality. Environ. Sci. Pollut. Res. 2018, 25, 35571–35581. [Google Scholar] [CrossRef] [PubMed]
  13. Rahmani, M. Examen National de L’Export vert du Maroc: Produits Oléicoles; Romarin et ym; United Nations: Geneva, Switzerland, 2017. [Google Scholar]
  14. Idrissi, M. Trituration des Olives: Comment Arrêter la Pollution par les Margines. 2016. Available online: https://leseco.ma/maroc/trituration-des-olives-comment-arreter-la-pollution-par-les-margines.html (accessed on 7 November 2022).
  15. Weber, K.; Quicker, P. Properties of biochar. Fuel 2018, 217, 240–261. [Google Scholar] [CrossRef]
  16. Vannini, A.; Fedeli, R.; Guarnieri, M.; Loppi, S. Foliar Application of Wood Distillate Alleviates Ozone-Induced Dam- 458 age in Lettuce (Lactuca sativa L.). Toxics 2022, 10, 178. [Google Scholar] [CrossRef]
  17. Pan, J.; Ma, J.; Liu, X.; Zhai, L.; Ouyang, X.; Liu, H. Effects of different types of biochar on the anaerobic digestion of chicken manure. Bioresour. Technol. 2019, 275, 258–265. [Google Scholar] [CrossRef] [PubMed]
  18. Chen, H.; Awasthi, S.K.; Liu, T.; Duan, Y.; Ren, X.; Zhang, Z.; Awasthi, M.K. Effects of microbial culture and chicken manure biochar on compost maturity and greenhouse gas emissions during chicken manure composting. J. Haz-Ardous Mater. 2020, 389, 121908. [Google Scholar] [CrossRef] [PubMed]
  19. Côrtes, L.N.; Druzian, S.P.; Streit, A.F.M.; Godinho, M.; Perondi, D.; Collazzo, G.C.; Dotto, G.L. Biochars from animal wastes as alternative materials to treat colored effluents containing basic red 9. J. Environ. Chem. Eng. 2019, 7, 103446. [Google Scholar] [CrossRef]
  20. Bonga, C.P.; Lima, L.Y.; Leea, C.T.; Ongb, P.Y.; Jaromír, J.; Klemešc, C.L.; Gaod, Y. Lignocellulosic biomass and food waste for biochar production and application: A review. Chem. Eng. 2020, 81, 427–432. [Google Scholar] [CrossRef]
  21. Mahari, W.A.W.; Waiho, K.; Azwar, E.; Fazhan, H.; Peng, W.; Ishak, S.D.; Lam, S.S. A state-of-the-art review on producing engineered biochar from shellfish waste and its application in aquaculture wastewater treatment. Chemo-Sphere 2022, 288, 132559. [Google Scholar] [CrossRef] [PubMed]
  22. Dou, S.; Ke, X.X.; Shao, Z.D.; Zhong, L.B.; Zhao, Q.B.; Zheng, Y.M. Fish scale-based biochar with defined pore size and ultrahigh specific surface area for highly efficient adsorption of ciprofloxacin. Chemosphere 2022, 287, 131962. [Google Scholar] [CrossRef]
  23. Elkhalifa, S.; Al-Ansari, T.; Mackey, H.R.; McKay, G. Food waste to biochars through pyrolysis: A review. Resour. Conserv. Recycl. 2019, 144, 310–320. [Google Scholar] [CrossRef]
  24. Ambaye, T.G.; Rene, E.R.; Nizami, A.S.; Dupont, C.; Vaccari, M.; van Hullebusch, E.D. Beneficial role of biochar addition on the anaerobic digestion of food waste: A systematic and critical review of the operational parameters and mechanisms. J. Environ. Manag. 2021, 290, 112537. [Google Scholar] [CrossRef]
  25. Shaheen, S.M.; Niazi, N.K.; Hassan, N.E.; Bibi, I.; Wang, H.; Tsang, D.C.; Rinklebe, J. Wood-based biochar for the removal of potentially toxic elements in water and wastewater: A critical review. Int. Mater. Rev. 2019, 64, 216–247. [Google Scholar] [CrossRef]
  26. Assouguem, A.; Kara, M.; Mechchate, H.; Al-Mekhlafi, F.A.; Nasr, F.; Farah, A.; Lazraq, A. Evaluation of the Impact of Different Management Methods on Tetranychus urticae (Acari: Tetranychidae) and Their Predators in Citrus Orchards. Plants 2022, 11, 623. [Google Scholar] [CrossRef]
  27. Kwapinski, W.; Byrne, C.M.; Kryachko, E.; Wolfram, P.; Adley, C.; Leahy, J.J.; Hayes, M.H. Biochar from biomass and waste. Waste Biomass Valorization 2010, 1, 177–189. [Google Scholar] [CrossRef] [Green Version]
  28. Akhtar, S.S.; Andersen, M.N.; Liu, F. Residual effects of biochar on improving growth, physiology and yield of wheat under salt stress. Agric. Water Manag. 2015, 158, 61–68. [Google Scholar] [CrossRef]
  29. Zhang, J.; Bai, Z.; Huang, J.; Hussain, S.; Zhao, F.; Zhu, C.; Jin, Q. Biochar alleviated the salt stress of induced saline paddy soil and improved the biochemical characteristics of rice seedlings differing in salt tolerance. Soil Tillage Res. 2019, 195, 104372. [Google Scholar] [CrossRef]
  30. Fedeli, R.; Alexandrov, D.; Celletti, S.; Nafikova, E.; Loppi, S. Biochar improves the performance of Avena sativa L. grown in gasoline-polluted soils. Environ. Sci. Pollut. Res. 2022, 1–12. [Google Scholar] [CrossRef] [PubMed]
  31. Caractérisation des Boues—Mode Opératoire de Conditionnement Chimique en Laboratoire; AFNOR NF EN 14742; 2015; 14p. Available online: https://norminfo.afnor.org/norme/nf-en-14742/caracterisation-des-boues-mode-operatoire-de-conditionnement-chimique-en-laboratoire/86637 (accessed on 7 November 2022).
  32. Rodier, J.; Legube, B.; Merlet, N. L’analyse de L’eau, 9th ed.; Dunod Technique Et Ingénierie, Sciences & Techniques: Paris, France, 2009; 17p. [Google Scholar]
  33. Kalay, N.; Torbic, Z.; Golic, M.; Matijevic, E. Determination of the isoelectic points of several metals by adhesion method. J. Phys. Chem. 1991, 95, 7028–7032. [Google Scholar] [CrossRef]
  34. Pelekani, C.; et Snoeyink, V.L. Competitive adsorption between atrazine and methylene blue on activated carbon: The importance of pore size distribution. Carbon. 2000, 38, 1423–1436. [Google Scholar] [CrossRef]
  35. Hameed, G.H.; Din, A.T.M.; Ahmad, A.L. Adsorption of methylene blue onto bamboo-based activated carbon: Kinetics and equilibrium studies. J. Hazard. Mater. 2007, 141, 819–825. [Google Scholar] [CrossRef]
  36. ASTM D4607– 94; Standard Test Method for Determination of Iodine Number of Activated Carbon. ASTM International: West Conshohocken, PA, USA, 2006.
  37. Robinson, J.T.; Hansen, R.E. AWWA Standard for Powdered Activated Carbon; American National Institute, Inc.: Denver, CO, USA, 1978. [Google Scholar]
  38. Boehm, H. Chemical Identification of Surface Groups; Academic Press: London, UK, 1978; pp. 179–274. [Google Scholar]
  39. Baudu, M.; Guibaud, G.; Raveau, D.; et Lafrance, P. Prévision de l’adsorption de molécules organiques en solution aqueuse en fonctions de quelques caractéristiques physico-chimiques de charbons actifs. Water Qual. Res. J. 2001, 36, 631–657. [Google Scholar] [CrossRef]
  40. Natasha, N.; Shahid, M.; Khalid, S.; Bibi, I.; Naeem, M.A.; Niazi, N.K.; Rinklebe, J. Influence of biochar on trace element uptake, toxicity and detoxification in plants and associated health risks: A critical review. Crit. Rev. Environ. Sci. Technol. 2022, 52, 2803–2843. [Google Scholar] [CrossRef]
  41. Wu, S.; Chen, Y.; Chen, Z.; Wang, J.; Cai, M.; Gao, J. Shape-Stabilized phase change material with highly thermal conductive matrix developed by one-step pyrolysis method. Sci. Rep. 2021, 11, 1–12. [Google Scholar] [CrossRef]
  42. Bonanomi, G.; Ippolito, F.; Cesarano, G.; Nanni, B.; Lombardi, N.; Rita, A.; Scala, F. Biochar as plant growth 483 promoter: Better off alone or mixed with organic amendments? Front. Plant Sci. 2017, 8, 1570. [Google Scholar] [CrossRef] [PubMed] [Green Version]
  43. Kammann, C.; Glaser, B.; Schmidt, H.P. Combining biochar and organic amendments. Biochar Eur. Soils Agric. Routledge 2016, 158–186. [Google Scholar]
  44. Guo, X.X.; Liu, H.T.; Zhang, J. The role of biochar in organic waste composting and soil improvement: A review. Waste Manag. 2020, 102, 884–899. [Google Scholar] [CrossRef] [PubMed]
  45. Langmuir, I. The adsorption of gases on plane surfaces of glass, mica and platinum. J. Am. Chem. Soc. 1918, 40, 1361–1403. [Google Scholar] [CrossRef] [Green Version]
  46. IUPAC. International Union of Pure and Applied Chemistry. 2022. Available online: https://iupac.org/etoc-chemistry-international-jan-mar-2022/ (accessed on 3 January 2023).
  47. El Fels, L.; Zamama, M.; Hafidi, M. Advantages and limitations of using FTIR spectroscopy for assessing the maturity of sewage sludge and olive oil waste co-composts. In Biodegradation and Bioremediation of Polluted Systems–New Advances and Technologies; InTech: Rang-Du-Fliers, France, 2015; pp. 127–144. [Google Scholar]
  48. Gueboudji, Z.; Kadi, K.; Nagaz, K. Extraction et quantification des polyphénols des eaux usées des moulins à huile issus de l’extraction à froid de l’huile d’olive dans la région de Khenchela-Algérie. Rev. Génétique Biodiversité 2021, 5, 116–122. [Google Scholar]
  49. Assouguem, A.; Kara, M.; Ramzi, A.; Annemer, S.; Kowalczyk, A.; Ali, E.A.; Moharram, B.A.; Lazraq, A.; Farah, A. Evaluation of the Effect of Four Bioactive Compounds in Combination with Chemical Product against Two Spider Mites Tetranychus urticae and Eutetranychus orientalis (Acari: Tetranychidae). Based Complement. Altern. Med. 2022, 2022, 2004623. [Google Scholar] [CrossRef]
  50. Badou, A.; Pont, S.; Auzoux-Bordenave, S.; Lebreton, M.; Bardeau, J.F. New insight on spatial localization and micro- structures of calcite-aragonite interfaces in adult shell of Haliotis tuberculata: Investigations of wild and farmed abalones by FTIR and Raman mapping. J. Struct. Biol. 2022, 214, 107854. [Google Scholar] [CrossRef]
  51. Bolton, L.; Joseph, S.; Greenway, M.; Donne, S.; Munroe, P.; Marjo, C.E. Phosphorus adsorption onto an enriched biochar substrate in constructed wetlands treating wastewater. Ecol. Eng. 2019, 142, 100005. [Google Scholar] [CrossRef]
  52. Assouguem, A.; Kara, M.; Mechchate, H.; Alzain, M.N.; Noman, O.M.; Imtara, H.; Hano, C.; Ibrahim, M.N.; Benmessaoud, S.; Farah, A.; et al. Evaluation of the Effect of Different Concentrations of Spirotetramat on the Diaspine Scale Parlatoria ziziphi in Citrus Orchards. Agronomy 2021, 11, 1562. [Google Scholar] [CrossRef]
  53. Zhang, M.; Gao, B.; Varnoosfaderani, S.; Hebard, A.; Yao, Y.; Inyang, M. Preparation and characterization of a novel 506 magnetic biochar for arsenic removal. Bioresour. Technol. 2013, 130, 457–462. [Google Scholar] [CrossRef]
  54. Wang, Z.; Shen, D.; Shen, F.; Li, T. Phosphate adsorption on lanthanum loaded biochar. Chemosphere 2016, 150, 1–7. [Google Scholar] [CrossRef] [PubMed]
  55. Ouafi, R.; Atemni, I.; Mehdaoui, I.; Asri, M.; Taleb, M.; Rais, Z. Spectroscopic Analysis of Chemical Compounds De- 509 rived from the Calcination of Snail Shells Waste at Different Temperatures. Chem. Afr. 2021, 4, 923–933. [Google Scholar] [CrossRef]
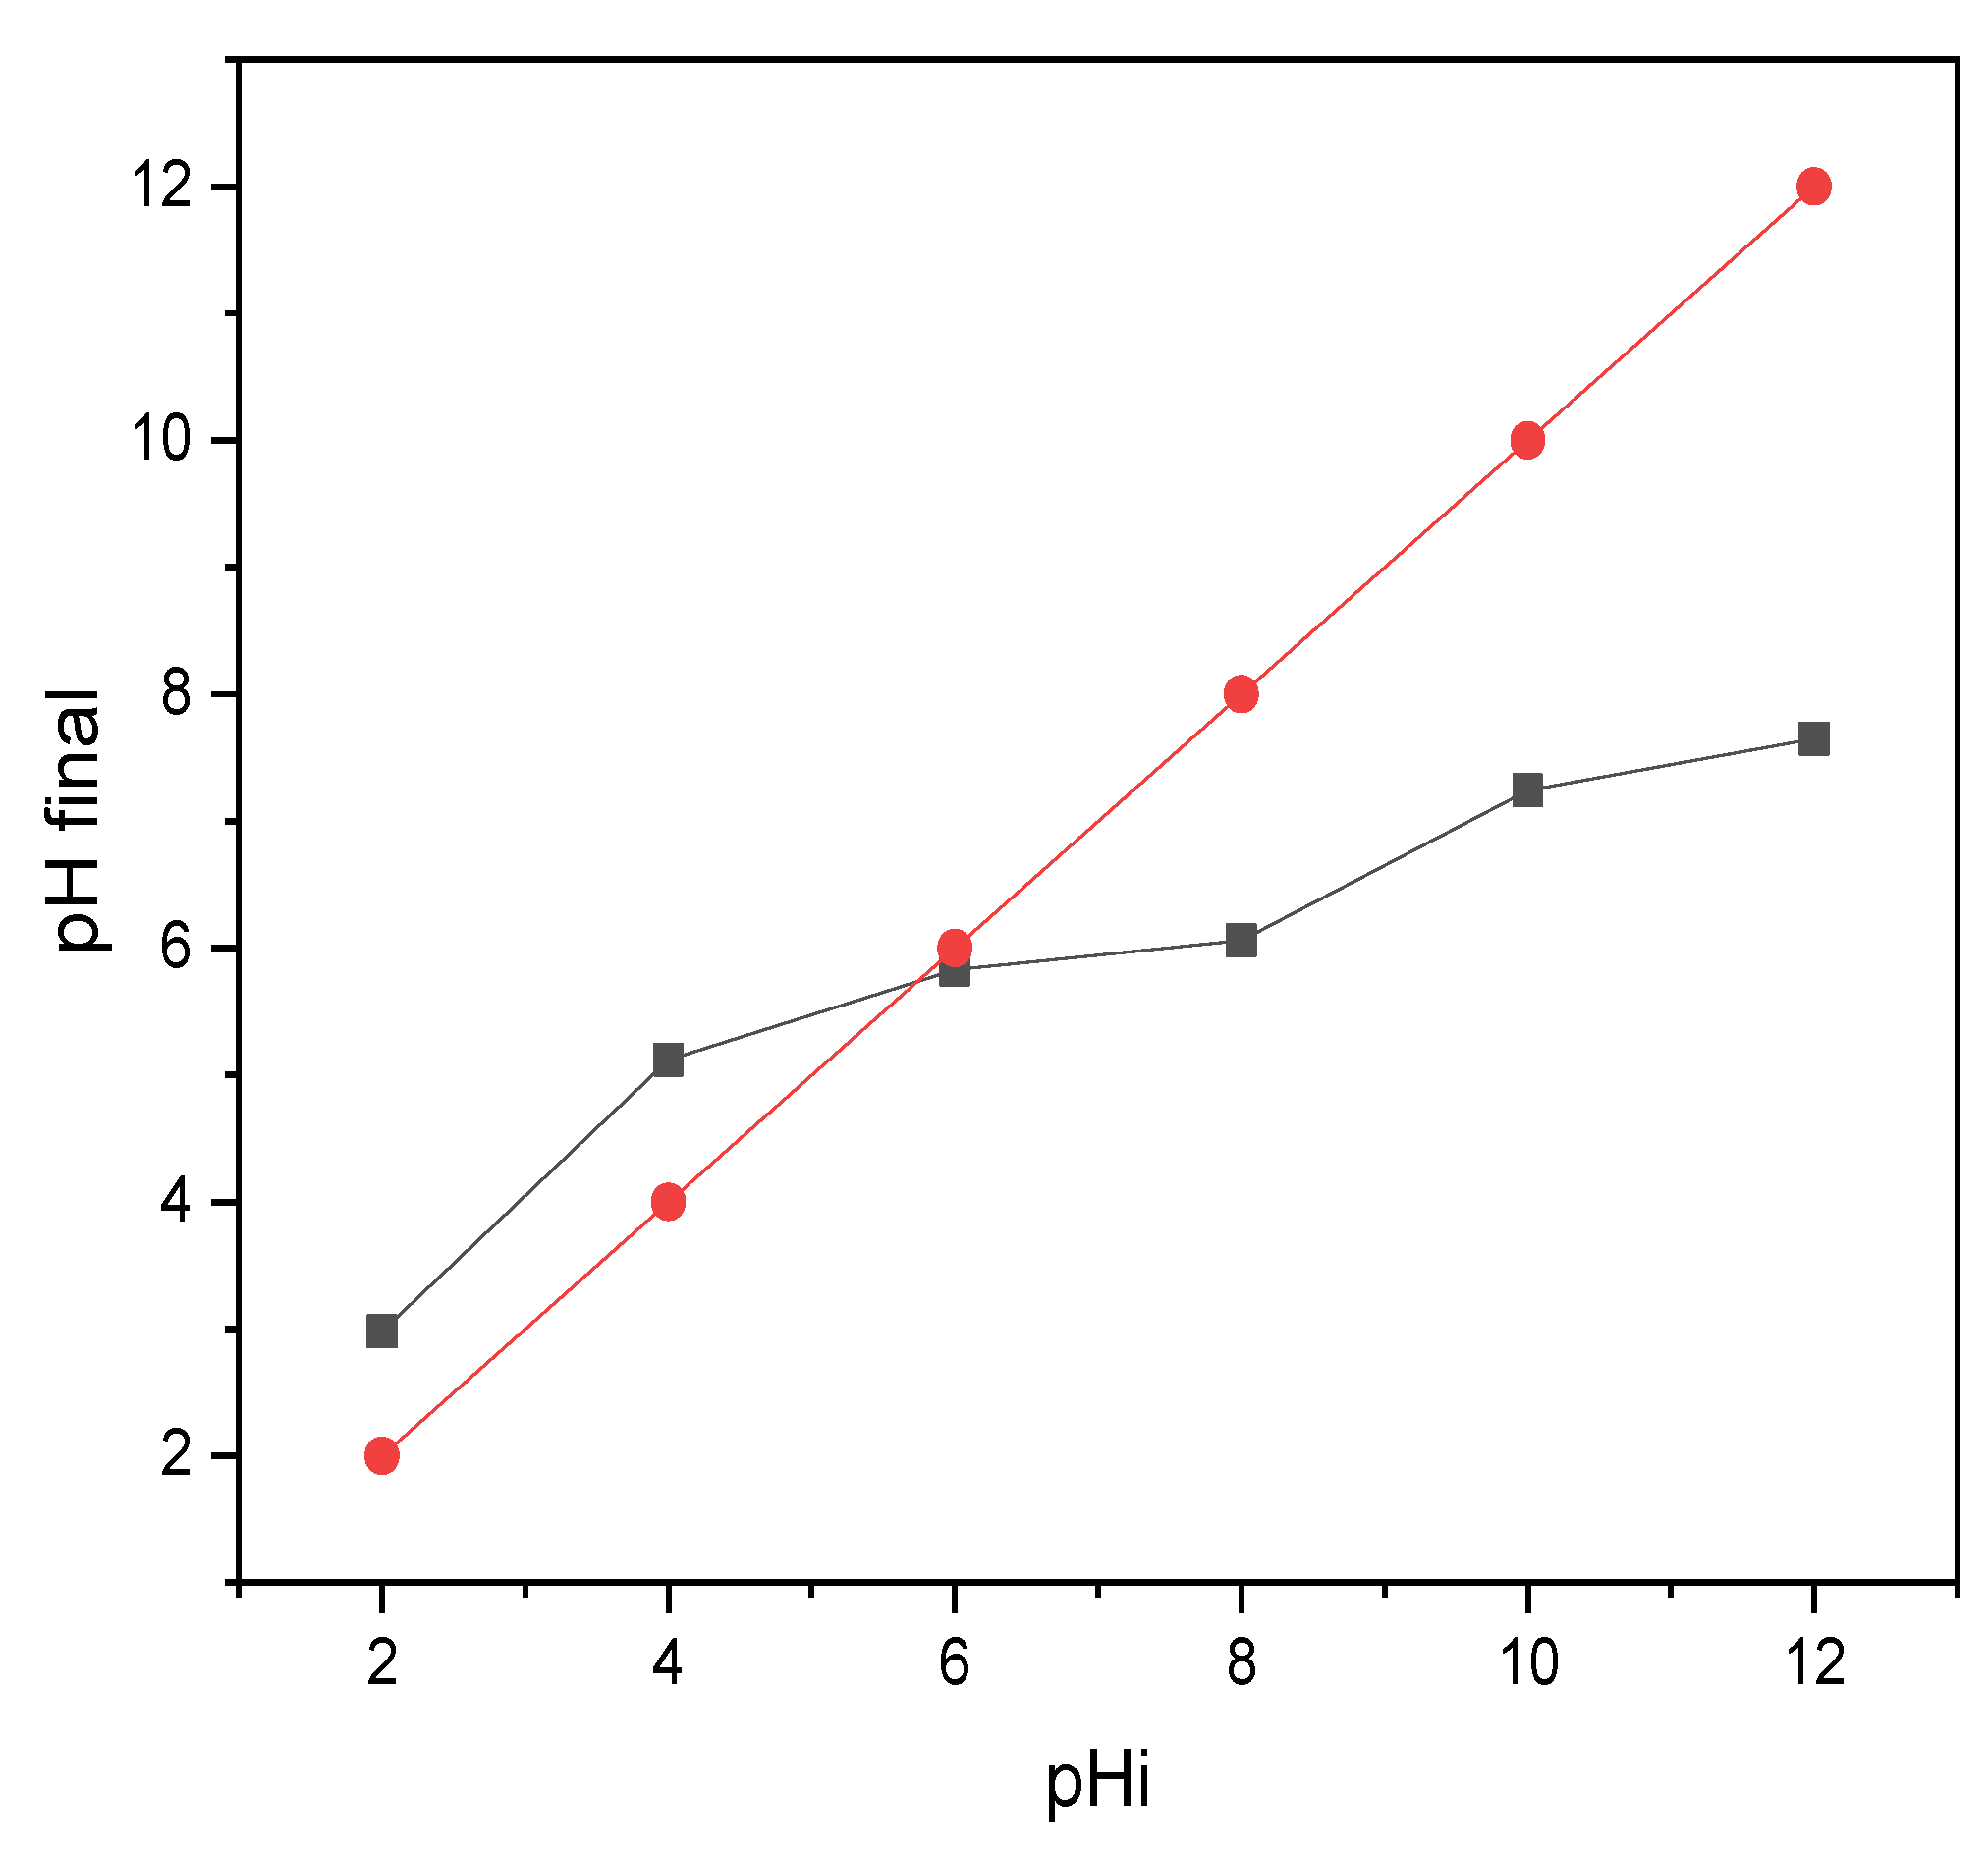
Figure 1. Determination of the pH of zero charge (pHpzc) of the biochar.
Sustainability 15 02409 g001
Figure 2. Absorption spectrum of methylene blue in the visible (C0 = 10 mg·L−1).
Sustainability 15 02409 g002
Figure 3. BM calibration line; at λmax = 669 nm.
Sustainability 15 02409 g003
Figure 4. Equilibrium isotherm.
Sustainability 15 02409 g004
Figure 5. Langmuir isotherm.
Sustainability 15 02409 g005
Figure 6. SEM images of biochar at different magnifications (a) ×100, (b) ×500, (c) ×1000 and (d) ×2000.
Sustainability 15 02409 g006
Figure 7. EDX spectrum of biochar.
Sustainability 15 02409 g007
Figure 8. Thermogravimetric analysis (ATG) spectrum of biochar.
Sustainability 15 02409 g008
Table 1. Physicochemical characteristics of biochar.
ParameterspHEC
(μS/cm)
H
(%)
DM
(%)
MM
(%)
OM
(%)
Polyphénols
(%)
FM
(%)
TOC
(%)
NTK
(%)
C/N
Values6.6513001.5898.4278.3121.691.092.1612.581.0511.98
Table 2. Trace element and metallic trace element contents of biochar.
ElementsAlCaCuFeKMgPMnNaZn
Concentration (mg/g)4.939664.0090.25357.47373.694718.64622.5880.311825.3360.7603
ElementsBAgCdCoCrNiPbSeTiAs
Concentration (mg/g)<0.010.0458<0.01<0.011.0165<0.01<0.01<0.01<0.01<0.01
Table 3. Surface chemical characteristics of the elaborated biochar.
GroupsCarboxylicPhenolicsLactonesCarbonylsTotal OxygenatesTotal Bases
Value (meq/g)0.0071.8140.0052.3020.0180.416
ParameterspHPZCSBM (m2/g)Oxygenated Functional Groups (%)Iodine Index (mg/g)BM Index
(mg/g)
Value5.56694.719.6462.359.22
Table 4. Mass and atomic percentages of the different elements of the biochar.
ElementsMass PercentageAtomic Percentage
C43.59 ± 0.1557.90 ± 0.21
O29.24 ± 0.2529.15 ± 0.25
Mg0.97 ± 0.030.64 ± 0.02
Al2.78 ± 0.051.64 ± 0.03
Si6.60 ± 0.073.75 ± 0.04
P2.53 ± 0.041.30 ± 0.02
S1.47 ± 0.030.73 ± 0.02
K0.63 ± 0.030.26 ± 0.01
Ca10.26 ± 0.104.08 ± 0.04
Fe1.94 ± 0.070.55 ± 0.02
Total100.00 100.00
Disclaimer/Publisher’s Note: The statements, opinions and data contained in all publications are solely those of the individual author(s) and contributor(s) and not of MDPI and/or the editor(s). MDPI and/or the editor(s) disclaim responsibility for any injury to people or property resulting from any ideas, methods, instructions or products referred to in the content.