Abstract
Production delays are significant problems for the loss of goodwill of the customers and the loss of profits associated with them. The delays may accrue as a result of insufficient resource planning and poorly designed unsatisfactory procedures. In this study, a new mathematical model is proposed to optimize the production processes by minimizing production delays, and a simulation model is developed to test the alternative facility designs. The purpose is to increase customer satisfaction by ensuring that the products are delivered timely and preventing lost sales in an automotive company that manufactures garbage collectors by using real data. The mixed-integer programming problem related to the minimization of production delays is solved by the GAMS CPLEX 24.1.3 software. In this way, the total delay in the production area is minimized by the mathematical model to prevent labor and time loss. Accordingly, the alternative designs are investigated for the improvement of the production processes by using discrete system simulation. A system analysis is performed to determine the bottlenecks in the production processes by developing a simulation model via the ARENA simulation software. With the proposed facility layout alternatives, the delays are eliminated, the total production time is reduced, and an increase in production efficiency is observed.
1. Introduction
Production planning and control is a critical task for companies to minimize costs and increase customer satisfaction with timely product delivery. In this study, a real-life problem for an automotive industry company is investigated in terms of improving the production processes and increasing effectiveness. A delay problem for the hydraulic compression garbage collector production department of the company is experienced, which is the most demanded product in the company, and it is subjected to some penalties due to late delivery of the end products. The company is affected by this problem as a loss of prestige and high cost. The problems in the plant are identified by the analysis of the system in the production facility and the company feedback. Different tasks in production can be assigned to different routes. The priorities among tasks can be changed depending on the make-to-order system and the stock status. It is observed that some of the workers in the production area are not assigned the appropriate tasks considering their abilities and positions, while some of them are idle. This situation affects the productivity and quality of production and causes delays. Delays in the plant grounds penalty costs for the company and end with the loss of some of the customers.
There is a fixed-position layout for the assembly part of the production facility, but it does not proceed in the order of production for the pre-assembly part. Long distances between the benches are observed. Thus, unnecessary routes in the facility reduce the traceability of the products and the speed of production. Additionally, time losses cause the machines not to work efficiently. The lack of vehicles in the plant is observed so that the workers carry and handle the material with the labor force which hurts the facility layout. It causes incorrect location problems, muscle fatigue, and health problems and reduces the efficiency of production. Considering the fact that the company loses many of its customers and pays serious fines, one of the problems that are investigated in this study is the problem of production delays. Firstly, a model is developed to achieve the optimal task-worker assignment to minimize the total maximum delay. The layout is re-arranged to reduce the distances between the machines to improve production compliance and efficiency by using a simulation experiment since another problem under consideration is the distances between the machines. In this study, an optimization model is developed for the minimization of the total maximum delay in the production processes, and alternative facility designs are tested via simulation models for the productivity of the facilities by determining the bottlenecks and proposing alternative designs as measurements for them.
Many studies focus on production planning and optimization, in the literature. Bueno et al. [1] review a high number of studies, which consider smart abilities ensured through Industry 4.0. In their study, they consider the production planning and control and performance indicators with the environmental factors discussed. Bendul and Blunck [2] review the literature considering the multiple research fields and different theoretical indications for production planning and control in industry 4.0. Li et al. [3] study the production planning and control problem considering additive manufacturing. They propose a mathematical model for the problem and solved it by using CPLEX. Additionally, they also suggest alternative heuristic methods. Altaf et al. [4] develop a discrete event simulation model. Additionally, they use the random sample consensus algorithm that is integrated with particle swarm optimization and simulated annealing algorithms. They aim to minimize production time by generating optimal production schedules.
Aouam et al. [5] discuss the acceptance of the order in production planning assuming that the quantity of the order is uncertain. The integrated production planning problems are formulated and solved by the proposed heuristic algorithm. Thürer et al. [6] use the simulation to analyze the different production planning and control approaches for bottleneck analysis. They analyze the performance of Materials Requirement Planning (MRP), Kanban, Optimized Production Technology (OPT), and Demand Driven MRP. The results of the study demonstrate that the Demand Driven MRP and Kanban show the best performance if there is no bottleneck in the system.
Lisboa and Yasin [7] aim to study the effects of workforce restriction in an aggregate production planning model. In the study, two model results are compared with and without workforce restriction. As a result of the study, it is observed that workforce level restrictions do not affect solving the problem of aggregate production planning. Nurmi et al. [8] study the General Task-based Shift Generation Problem, and it has been recognized as the first study for this type of problem. The objective is to make the maximum number of shifts that employees are included. Cavagnini et al. [9] examine a manufacturer that produces different products and has complete information regarding customer demand and quantities for those products. The study aims to use human learning potential to improve workforce capacity and reduce workforce costs. A two-stage stochastic model has been proposed. The model includes a mixed-integer model that can efficiently solve worker assignment decisions, and an exponential learning curve to measure the effect of model results.
Ertogral and Öztürk [10] propose an integrated production scheduling and workforce capacity planning model to minimize inventory holding and workforce costs of the company performing maintenance, repair, and overhaul (MRO) activities in the airline sector. Hsu et al. [11] develop a model to reduce the cost of assigning a workforce for chip handling and production control in computer-based production. With the Optimal Workforce Strategy (OWS), the model proposed in this study becomes realistically and concretely solvable. The study by Mak et al. [12] proposed a mathematical model for virtual cellular production (VCM) aimed at minimizing the total cost of production using workforce constraints. A hybrid algorithm has been created using constraint programming (CP) and discrete particle swarm optimization (DPSO) technique to solve the proposed problem.
Techawiboonwong and Yenradee [13] study aggregated manufacturing planning for different types of products where the workforce can switch between production lines. The proposed model is formulated in spreadsheet format. According to the results, the total cost is considerably decreased when the workforce is transferred between production lines. Sillekenset et al. [14] develops a mixed-integer linear programming model that combines the capacity of manufacturing and the flexibility of the workforce for the aggregated manufacturing planning problem in the automotive industry. Moussavi et al. [15] use ergonomic considerations to determine a schedule that makes the workforce effective for a specific planning period. The schedule involves the workforce assignment and the workstation rotation through a manufacturing system. They propose a linear mathematical model that considers an ergonomic workforce plan to decrease manufacturing cycle time. Ighravwe and Oke [16] propose a fuzzy target programming model for the optimization of maintenance crew considering probabilistic constraints. To verify the effectiveness of the proposed model, manufacturing system data and the simulated annealing heuristic method are used.
Yun et al. [17] simulate a pilot factory of the continuous enzyme-catalyzed biodiesel. Considering the simulation outputs of the original processes, they propose five optimization procedures concentrating on energy-saving and the recovery of methanol.
Rathnayake et al. [18] integrate the process simulation technique and the life cycle assessment (LCA) to make a fair comparison between different processes and reduce biased parameters in-process data collection. Herrmann and Thiede [19] propose an integrated methodology that aims at improving energy efficiency for different types of manufacturing companies. The proposed simulation approach derives and evaluates technical and organizational measures to improve energy efficiency, considering both ecological and economic objectives. An application is conducted to show the necessity, potential, and practicality of the proposed methodology. Schlick et al. [20] develop an approach using dynamic task networks to evaluate the human-centered design and business processes in flexible production systems. The timed method of colored Petri Nets is used to model and simulate the proposed approach. Diaz-Elsayed et al. [21] study a production system by incorporating lean and green strategies, the process from data collection to evaluation of a system. A case study on part manufacturing in the automotive sector is presented. It is observed that the production costs of a representative part decreased by approximately 10.8 %.
Kutin et al. [22] use simulation modeling to determine an effective assembly process in digital production. They consider the influence of intersections of the main flow of the different products, components, and the performance parameters of the assembly procedures. The results show an improvement in the production system efficiency.
Eberle et al. [23] use a method by focusing on Parenteral (i.e., injectable) production processes in order to measure and improve the lead time of production for pharmaceutical procedures. To determine the total delivery time probability distribution, the Monte Carlo simulation method is used. Lachenmaier et al. [24] propose alternative solutions by using simulation for cyber-physical systems. The study is applied to a large-scale automobile industry company’s production line. The objective of the model proposed in the study by Kurniawan et al. [25] is to minimize the total cost of makespan and electricity. A genetic algorithm (GA) has been used to solve unrelated parallel machine timing by considering timetables that change over time. Wang and Chan [26] propose a model that minimizes the average production cost. The proposed model is an approximate optimal manufacturing control model in which a multi-phase manufacturing system with a time delay does not consider the incorrectness of inventory. Jia et al. [27] present a multi-objective optimization model that considers both environmental impacts and economic aspects of chemical processes in cleaner production. The Elitist Non-dominated Sorting Genetic Algorithm is used to obtain the Pareto-optimal set for the solution of the proposed model.
Zhang et al. [28] develop a method of defining and analyzing production capacity based on multivariate nonlinear regression (MNR) for resource optimization. The objective of the study is to determine whether a quantitative relationship between consumption of the raw materials and related results in industrial procedures. Helbing [29] proposes models to study supply networks and how they relate to vehicle traffic. The proposed models show the potential effects of alternative management strategies by considering the nonlinear, dynamic interactions of different production units. The study shows how the nonlinear dynamics of a given supply chain in semiconductor manufacturing are optimized by the “slower-faster effect” known from panicking pedestrian crowds. Erceg and Mularifović [30] include the decomposition of logistics systems in a wood company, the supply of materials, the drying of sheets, production, packaging, and distribution and proposed a methodology for the realization of supplier selection in the decomposition and supply subsystem. With the full consistency method that is applied to determine criteria weights, the ranking of suppliers is performed using the weighted aggregate total product evaluation method. Wang et al. [31] investigate the robust manufacturing control problem for a multi-phase manufacturing system with the incorrectness of the inventory and the delay time between processes. This problem aims to minimize the mean manufacturing cost. At the end of the study, it is emphasized that the model under consideration and the manufacturing control decisions can be applied to the same type of mass manufacturing lines that includes work-in-process inventory. Liu et al. [32] integrate preventive maintenance (PM) and tactical manufacturing planning into a manufacturing system that considers different products. The objective of the study is to minimize the total cost of maintenance, manufacturing, inventory, installation, back-ordering costs, and unqualified products within the planning horizon. A real case study is conducted at a steel mill to demonstrate the validity of the proposed model. Sabadka et al. [33] study an assembly line balancing problem in the automotive industry. In the study, various measures are proposed to reduce operations on related assembly lines by omitting unrelated activities in the assembly procedures and balancing the workforce using assembly line balancing, and the Yamazumi chart. Sujová and Čierna’s [34] study aims to improve the process efficiency of the manufacturing line in an automotive industry manufacturing company. The study’s objective is to improve and optimize the testing procedures on the manufacturing line. Kasimoglu et al. [35] develop a mixed-integer programming model with sequence-dependent setup times that solve the excess buffer inventory problems in a white goods production company. Cavalcanti et al. [36] propose an artificial intelligence methodology that integrates data envelopment analysis (DEA), machine learning-based simulation, and genetic algorithms for optimally solving the efficiency of manufacturing systems. Ricondo et al. [37] study a digital twin model for the simulation optimization of manufacturing systems. Additionally, Lee et al. [38] design a digital twin and develop a simulation model to optimize the processes and production lines of a dynamic production environment.
Table 1 summarizes some of the studies in the literature and the difference between the proposed models in this study.

Table 1.
Summary of the studies in the literature.
2. Mathematical Model
The automotive industry company under consideration is manufacturing hydraulic garbage collectors, hydraulic telescopical platforms, hydraulic articulated (telescopical) platforms, water tankers, sprinklers, and firefighting vehicles. The company has a total of 105 employees. The production process flow is shown in Figure 1. The materials in the warehouse are sent to plasma cutting, guillotine, and lathe bench in the production site of the hydraulic compression garbage collector. Most of these parts are sent to the plasma workbench, and others are sent directly to the guillotine bench because they do not need the plasma-cutting process. Some of the parts are sent to the lathe bench for the production of small parts such as screws. After the plasma cutting process is finished, the plates that are cut, are sent to the milling cutter bench. Products that are transported by using platform trucks. In the milling cutter bench, the finished plates move to the absent bending machine. There are two types of guillotine machines in the plant, one is a Computer Numerical Control (CNC) guillotine machine, and the other is a manual guillotine machine. Generally, the CNC guillotine machine is used. The manual guillotine machine is used only when there is too much delay and when workers are idle.
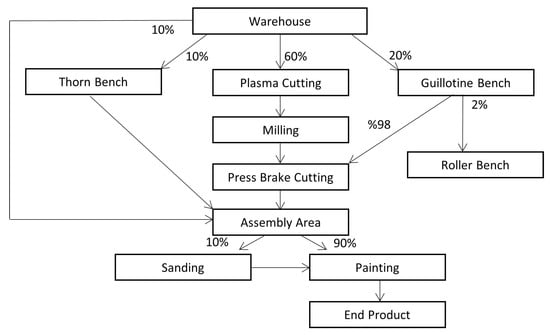
Figure 1.
The flow chart of the current system.
Production planning is managed irregularly in the plant. As seen in Figure 1, 98% of the plates which are coming from the plasma cutting machine and that are processed on the guillotine bench are transported to the press brake cutting. The remaining 2% is transported to the roller table. The plates coming from the guillotine bench and the milling cutter bench are bent on the press brake and sent to the assembly area. The plates processed on the roller table are transported to the assembly area by crane. The parts that are processed on the lathe bench are sent to the assembly area and all parts are assembled. The hydraulic and electrical installation is important in the assembly process. Therefore, there is a control phase after these two tasks are performed. If the product has a failure after the control, it is sent back to the assembly area.
After the assembling is finished, the product is sent to the painting or sanding according to the customer’s request. The sanding process is very expensive, so it is not demanded very much by the customers. After this process is finished, the product is checked by the quality engineer for quality control. The quality engineer has a checklist and gives approval to the product or sends it back to the task that needs to be corrected again. If there is no problem, the product is delivered to the customer.
A mathematical model is developed for the delay problem of the company due to inappropriate employee assignments. The objective of the model is to minimize the total delay of the products in production. The task duration is taken from the company for each worker on the bench. Based on the historical data of the company, the due date for each machine is collected. Using the Hungarian algorithm based on the data of the worker capabilities, the maximum number of workers in each machine is determined. The problem is solved by the GAMS CPLEX solver and the production delay is minimized by the optimal task-worker assignment.
The developed model optimizes the task-worker assignment to reduce the delay for a product. First of all, the number of workers who can work on the tasks is determined by using the Hungarian algorithm with the help of the matrix prepared according to the capabilities of the workers. Additionally, the results of the mathematical model are compared with the optimum results obtained from the use of the Hungarian Algorithm. The workers, who performed the task as soon as possible, are assigned to the tasks and the delay is minimized. The delay per product in the current system is 792 min. As a result of the optimization of the mathematical model, the delay per product is reduced to 210 min. In this case, 73.75% improvement in production is realized. As a future study, the case of multi-process jobs can be applied to the manufacturing systems by using the methodologies in concern supporting them by heuristics methods.
The notations for the mathematical model are as follows:
Sets
- I set of workers
- J set of tasks
Indices
- i workers ,
- j tasks ,
Parameters
- Task time of task j
- Due date of task j
- Maximum number of workers needed in task j
- Completion time of task j by worker i
Decision Variables
- 1, if task j is assigned on worker i in minimum time; 0, otherwise
- 1, if task j is assigned on worker i; 0, otherwise
Objective Function
The objective function minimizes the delay in production by assigning the workers to the optimum tasks Equation (1).
Constrains
Equation (2) satisfies that each worker must be assigned to a task.
Equation (3) provides that the total assigned number of workers to each task should not exceed the maximum number of workers needed in each task.
Equation (4) satisfies that there should be a minimum of two workers in each task.
Equation (5) satisfies that the task time by the assigned workers should not exceed the task time of the task.
3. Simulation Modeling
Simulation is commonly used to analyze, define, question the real-world system, and foster the development of the actual system by imitating a real-world process or system. Simulation is the set of processes for translating real-life cases to computer media. The basic two steps implemented in simulation studies are model design and experiments.
By using simulation, it is aimed to identify the problems related to the layout of the company and to find the source of the problems. Based on these analyzes, alternative designs for the new layout of the production site are presented.
The conceptual model is based on company data and observations. The manufacturing steps of a product according to the process order are followed. The task times of the plant, the distances between the machines, and the number of raw materials required for a product are taken as input. The raw material input for a product at the production site is defined as an entity. The entity is stated to be constant and considered to be a batch of 82 parts. The flow chart created for the current system is in Figure 1.
3.1. Input Analysis
The simulation is based on one year of data. The task times of 31 hydraulic compressions refuse collectors produced within one year are considered. A total of 775 pieces of data are used for 25 tasks in production. Plasma cutting, milling, guillotine, press brake, lathe, roller table, chassis, and base assembly, side edge assembly, body installation, body installation control, front assembly, ceiling installation, interior curtain assembly, sled assembly, rear body left side assembly, front assembly rear body, installation to the body of rear body, assembly of the container lifting system, electric installation, electric installation control, hydraulic installation, hydraulic installation control, painting and sanding task times are input as parameters. The sanding task is input as the scalar. In addition, the distance between the benches in the simulation is taken as the shortest distance. These distances are represented in Table 2. The input analyzer tool of the Arena simulation software is used to determine the probability distribution of each task. The parameters that are used in the problem are stated in Table 3 and Table 4 while the fitted probability distributions of the data are shown in Table 5.
Table 2.
The distances between the benches.
Table 3.
The data for the parameters , , and .
Table 4.
The data for the parameter .
Table 5.
The fitted probability distributions of each task.
3.2. Output Analysis
In the developed simulation model, the waiting times in queues, the number of semi-finished products, the bottlenecks in the production process, the total task time, and the utilization of the resources are determined. In production, the queues are mostly formed in the body control, hydraulic control, and electrical control processes, after the plasma cutting process, after the press brake process, and before the painting process. The causes of the queues are observed as long distances between the benches, lack of material handling, and lack of resources in the control processes. In addition to the output results, it is determined that one of the guillotine machines is unnecessary. The current situation in production slows down production and reduces worker productivity. To minimize inter-benches distances, layout alternatives are evaluated in the production site.
3.2.1. Layout Design
It is aimed to minimize the long distances between the machines at the production site. In the current situation, there is no relation between the layout and product types. Therefore, the distance between the benches in production is very long. The layout type of the company can be a mixed layout. The production is divided into two parts before and after the assembly. Before the assembly, the process should be aligned according to the process layout. In the assembly, the layout should be applied according to the fixed position product, because the product is very heavy and it is very difficult to move from one place to another.
Alternative 1: In the production site, production is made according to the process for pre-assembly. A truck should be purchased to transport the product faster to the painting and sanding area. A worker should be hired to use handling materials.
Alternative 2: The layout should be designed according to the processes in the production site. A truck should be bought and a worker should be hired for painting jobs. Additionally, 1 pallet truck should be purchased for the plasma cutting task because the products in the plasma cutting area and the painting area, the movement of the products is carried out by the workers which causes queues. If a pallet truck and a truck are used, the production time is reduced and the working environment will be more ergonomic for the employees. This alternative is more costly than alternative 1 but gives better results.
Alternative 3: There is a maintenance department of another company in the production area, as there is joint work in the factory with other brands. In this alternative, the maintenance site of the other company is also changed. The company’s maintenance department is replaced by tasks that led to long distances between the benches. In the proposed new layout intermediate stock storage areas are added between the benches. Using Arena simulation software, the layout is tested and compared with the results with the current system.
Alternative 4: In addition to alternative 3, it is recommended to purchase a pallet truck in the plasma cutting area to reduce the long transport times in the plasma cutting area and to make the work environment of the workers more ergonomic.
Alternative 5: In addition to alternatives 3 and 4, a truck is purchased and used in the painting area to reduce the queues in the painting area and reduce production time in the production area. As a result of the alternative designs, long machine-to-machine distances are reduced to reduce the current production time and the delay in production is eliminated according to the mathematical model. The obtained simulation results for the average total production times and the average waiting times for different layout suggestions are in Table 6 and Table 7, respectively.
Table 6.
Total production times.
Table 7.
The average waiting times for each scenario.
3.2.2. Experimental Design
The experimental analysis is applied to the results of the alternative designs presented for the arrangement of the plant layout. The one-way ANOVA is used to test whether there is a significant difference between the alternatives. The data are obtained by collecting different values obtained by using the Arena simulation software with 10 replications for each alternative. The data obtained are combined in Table 8. Table 9 shows the analysis of ANOVA results.
Table 8.
The alternative variables.
Table 9.
Analysis of ANOVA.
With the level of significance at 0.10, the hypothesis is;
:
: At least two of the means are not equal.
Critical region: f > 2.0696 with and degrees of freedom.
As a result of , we reject and conclude that the aggregates do not have the same mean absorption.
3.2.3. Cost Analysis
In order to eliminate the delay in production, the cost analysis of the alternatives is carried out. The unit hiring cost, the unit price of the pallet trucks, and the unit price of the trucks are 2020 TL, 1000 TL, and 37,000 TL, respectively. Table 10 shows the cost analysis of the alternatives.
Table 10.
The cost analysis of the alternatives.
As a result of the cost analysis, the best alternative is third alternative because it has is the lowest cost and the highest efficiency. The fifth alternative has the highest cost but, it is observed that its efficiency is not high enough. In this alternative, the purchase of trucks and the recruitment of workers increase the number of products, but due to the high cost, they cannot obtain sufficient efficiency in a short time.
4. Conclusions
In manufacturing companies, one of the crucial issues is customer satisfaction considering the due dates promised. In order to supply the customers properly the managers of the manufacturing system should consider the optimally designed processes and effective resource utilization. This study accomplishes these by proposing a new mathematical model to optimize the production processes by minimizing production delays and offering alternative system designs. The purpose is to increase customer satisfaction by ensuring that the products are delivered timely and preventing lost sales in an automotive company that manufactures garbage collectors by using real data. A system analysis is performed to determine the bottlenecks in the production processes by developing a simulation model via the ARENA simulation software. With the proposed facility layout alternatives, the delays are eliminated, the total production time is reduced, and an increase in production efficiency is observed. Despite an automotive company being taken into consideration, both the optimization and simulation models developed in this study can be used for other types of production facilities for the productivity of the systems in concern.
Within the scope of the study, the total delay in the production area is minimized by the mathematical model so that the labor and time loss is prevented. With the proposed facility layout the delays are eliminated and the total production time is reduced, increasing production. Additionally, buffer inventory areas are added to the new layout and a more ergonomic working environment is provided for the workers.
The decisions resulting from this study increase the expectations of the company by minimizing cost and efficiency. The loss of customers due to the delay is eliminated and it promotes the company’s annual profit increase. As the unnecessary distances in the facility cause labor and time loss, new layout alternatives are designed and the losses are minimized. The delay is minimized by assigning the workers to the right tasks according to their capabilities. Thus, customer satisfaction increases. This is also important for the company’s prestige. One of the guillotine machines is not used according to the simulation model, therefore, the guillotine machine can be sold or hired to prevent the machine from being idle. As a future study, the case of multi-process jobs can be considered in the model for the production processes in concern.
Funding
This research received no external funding.
Data Availability Statement
Not applicable (all the required data are provided in the manuscript).
Acknowledgments
I would like to express my appreciation to Burcu Altunoğlu, Bergüzar Aslan, Rüya Gülsüm Yülek, and Ezgi Gizem Aydoğan for their valuable support during the development of this study.
Conflicts of Interest
The author declares no conflict of interest.
References
- Bueno, A.; Godinho Filho, M.; Frank, A. Smart production planning and control in the Industry 4.0 context: A systematic literature review. Comput. Ind. Eng. 2020, 149, 106774. [Google Scholar] [CrossRef]
- Bendul, J.C.; Blunck, H. The design space of production planning and control for industry 4.0. Comput. Ind. 2019, 105, 260–272. [Google Scholar] [CrossRef]
- Li, Q.; Kucukkoc, I.; Zhang, D.Z. Production planning in additive manufacturing and 3D printing. Comput. Oper. Res. 2017, 83, 157–172. [Google Scholar] [CrossRef]
- Altaf, M.S.; Bouferguene, A.; Liu, H.; Al-Hussein, M.; Yu, H. Integrated production planning and control system for a panelized home prefabrication facility using simulation and RFID. Autom. Constr. 2018, 85, 369–383. [Google Scholar] [CrossRef]
- Aouam, T.; Geryl, K.; Kumar, K.; Brahimi, N. Production planning with order acceptance and demand uncertainty. Comput. Oper. Res. 2018, 91, 145–159. [Google Scholar] [CrossRef]
- Thürer, M.; Fernandes, N.O.; Stevenson, M. Production planning and control in multi-stage assembly systems: An assessment of Kanban, MRP, OPT (DBR) and DDMRP by simulation. Int. J. Prod. Res. 2022, 60, 1036–1050. [Google Scholar] [CrossRef]
- Lisboa, J.; Yasin, M. The impact of workforce level restriction on the performance of the linear decision rule: An exploratory production planning study. Ind. Manag. Data Syst. 1999, 99, 156–164. [Google Scholar] [CrossRef]
- Nurmi, K.; Kyngäs, N.; Kyngäs, J. Workforce Optimization: The General Task-based Shift Generation Problem. IAENG Int. J. Appl. Math. 2019, 49, 4. [Google Scholar]
- Cavagnini, R.; Hewitt, M.; Maggioni, F. Workforce production planning under uncertain learning rates. Int. J. Prod. Econ. 2020, 225, 107590. [Google Scholar] [CrossRef]
- Ertogral, K.; Öztürk, F.S. An integrated production scheduling and workforce capacity planning model for the maintenance and repair operations in airline industry. Comput. Ind. Eng. 2019, 127, 832–840. [Google Scholar] [CrossRef]
- Hsu, K.S.; Lan, T.S.; Chang, S.B. Optimum workforce strategy for production handling. J. Inf. Optim. Sci. 2008, 29, 163–173. [Google Scholar] [CrossRef]
- Mak, K.L.; Ma, J.; Su, W. Production scheduling for virtual cellular manufacturing systems with workforce constraints using a hybrid algorithm. In Proceedings of the 2010 Sixth International Conference on Natural Computation, Yantai, China, 10–12 August 2010; Volume 8, pp. 4445–4449. [Google Scholar]
- Techawiboonwong, A.; Yenradee, P. Aggregate production planning with workforce transferring plan for multiple product types. Prod. Plan. Control. 2003, 14, 447–458. [Google Scholar] [CrossRef]
- Sillekens, T.; Koberstein, A.; Suhl, L. Aggregate production planning in the automotive industry with special consideration of workforce flexibility. Int. J. Prod. Res. 2011, 49, 5055–5078. [Google Scholar] [CrossRef]
- Moussavi, S.E.; Mahdjoub, M.; Grunder, O. Reducing production cycle time by ergonomic workforce scheduling. IFAC-Pap. 2016, 49, 419–424. [Google Scholar] [CrossRef]
- Ighravwe, D.E.; Oke, S.A. A machine survival time-based maintenance workforce allocation model for production systems. Afr. J. Sci. 2016, 8, 457–466. [Google Scholar] [CrossRef]
- Yun, H.; Wang, M.; Feng, W.; Tan, T. Process simulation and energy optimization of the enzyme-catalyzed biodiesel production. Energy 2013, 54, 84–96. [Google Scholar] [CrossRef]
- Rathnayake, M.; Chaireongsirikul, T.; Svangariyaskul, A.; Lawtrakul, L.; Toochinda, P. Process simulation based life cycle assessment for bioethanol production from cassava, cane molasses, and rice straw. J. Clean. Prod. 2018, 190, 24–35. [Google Scholar] [CrossRef]
- Herrmann, C.; Thiede, S. Process chain simulation to foster energy efficiency in manufacturing. CIRP J. Manuf. Sci. Technol. 2009, 1, 221–229. [Google Scholar] [CrossRef]
- Schlick, C.; Reuth, R.; Luczak, H. A comparative simulation study of work processes in autonomous production cells. Hum. Factors Ergon. Manuf. Serv. Ind. 2002, 12, 31–54. [Google Scholar] [CrossRef]
- Diaz-Elsayed, N.; Jondral, A.; Greinacher, S.; Dornfeld, D.; Lanza, G. Assessment of lean and green strategies by simulation of manufacturing systems in discrete production environments. CIRP Ann. 2013, 62, 475–478. [Google Scholar] [CrossRef]
- Kutin, A.; Dolgov, V.; Podkidyshev, A.; Kabanov, A. Simulation modeling of assembly processes in digital manufacturing. Procedia CIRP 2018, 67, 470–475. [Google Scholar] [CrossRef]
- Eberle, L.G.; Sugiyama, H.; Schmidt, R. Improving lead time of pharmaceutical production processes using Monte Carlo simulation. Comput. Chem. Eng. 2014, 68, 255–263. [Google Scholar] [CrossRef]
- Lachenmaier, J.F.; Lasi, H.; Kemper, H.G. Simulation of production processes involving cyber-physical systems. Procedia CIRP 2017, 62, 577–582. [Google Scholar] [CrossRef]
- Kurniawan, B.; Gozali, A.A.; Weng, W.; Fujimura, S. A genetic algorithm for unrelated parallel machine scheduling minimizing makespan cost and electricity cost under time-of-use (TOU) tariffs with job delay mechanism. In Proceedings of the 2017 IEEE International Conference on Industrial Engineering and Engineering Management (IEEM), Singapore, 10–13 December 2017; pp. 583–587. [Google Scholar]
- Wang, Z.; Chan, F.T. A robust production control policy for a multiple-stage production system with inventory inaccuracy and time-delay. In Proceedings of the 2013 IEEE International Conference on Automation Science and Engineering (CASE), Madison, WI, USA, 17–20 August 2013; pp. 77–82. [Google Scholar]
- Jia, X.; Zhang, T.; Wang, F.; Han, F. Multi-objective modeling and optimization for cleaner production processes. J. Clean. Prod. 2006, 14, 146–151. [Google Scholar] [CrossRef]
- Zhang, K.; Li, W.; Han, Y.; Geng, Z.; Chu, C. Production capacity identification and analysis using novel multivariate nonlinear regression: Application to resource optimization of industrial processes. J. Clean. Prod. 2021, 282, 124469. [Google Scholar] [CrossRef]
- Helbing, D. Modeling and optimization of production process: Lessons from traffic dynamics. Nonlinear Dyn. Prod. Syst. 2004, 6, 85–105. [Google Scholar]
- Erceg, Ž.; Mularifović, F. Integrated MCDM model for processes optimization in supply chain management in wood company. Oper. Res. Eng. Sci. Theory Appl. 2019, 2, 37–50. [Google Scholar] [CrossRef]
- Wang, Z.; Chan, F.T.; Li, M. A robust production control policy for hedging against inventory inaccuracy in a multiple-stage production system with time delay. IEEE Trans. Eng. Manag. 2018, 65, 474–486. [Google Scholar] [CrossRef]
- Liu, X.; WAng, W.; Peng, R. An integrated production and delay-time based preventive maintenance planning model for a multi-product production system. Eksploat. Niezawodn. 2015, 17, 215–221. [Google Scholar] [CrossRef]
- Sabadka, D.; Molnár, V.; Fedorko, G.; Jachowicz, T. Optimization of production processes using the Yamazumi method. Adv. Sci. Technol. 2017, 11, 175–182. [Google Scholar] [CrossRef]
- Sujová, E.; Čierna, H. Optimization and improvement of test processes on a production line. Manag. Syst. Prod. Eng. 2018, 26, 88–92. [Google Scholar] [CrossRef]
- Kasimoglu, S.; Demir, G.; Yaz, B.P.; Utku, D.H. An Application: A Model with Sequence Dependent Setup Times for Parallel Machines for the Die House Station in a White Goods Manufacturing Company. Osman. Korkut Ata üNiversitesi Fen Bilim. EnstitüSü Derg. 2021, 4, 33–44. [Google Scholar]
- Cavalcanti, J.H.; Kovács, T.; Kő, A. Production System Efficiency Optimization Using Sensor Data, Machine Learning-based Simulation and Genetic Algorithms. Procedia CIRP 2022, 107, 528–533. [Google Scholar] [CrossRef]
- Ricondo, I.; Porto, A.; Ugarte, M. A digital twin framework for the simulation and optimization of production systems. Procedia CIRP 2021, 104, 762–767. [Google Scholar] [CrossRef]
- Lee, D.; Kim, C.K.; Yang, J.; Cho, K.Y.; Choi, J.; Noh, S.D.; Nam, S. Digital Twin-Based Analysis and Optimization for Design and Planning of Production Lines. Machines 2022, 10, 1147. [Google Scholar] [CrossRef]
Disclaimer/Publisher’s Note: The statements, opinions and data contained in all publications are solely those of the individual author(s) and contributor(s) and not of MDPI and/or the editor(s). MDPI and/or the editor(s) disclaim responsibility for any injury to people or property resulting from any ideas, methods, instructions or products referred to in the content. |
© 2023 by the author. Licensee MDPI, Basel, Switzerland. This article is an open access article distributed under the terms and conditions of the Creative Commons Attribution (CC BY) license (https://creativecommons.org/licenses/by/4.0/).