
Research on Hydraulic Support Attitude Monitoring Method Merging FBG Sensing Technology and AdaBoost Algorithm


Abstract
:1. Introduction
2. Basic Theory
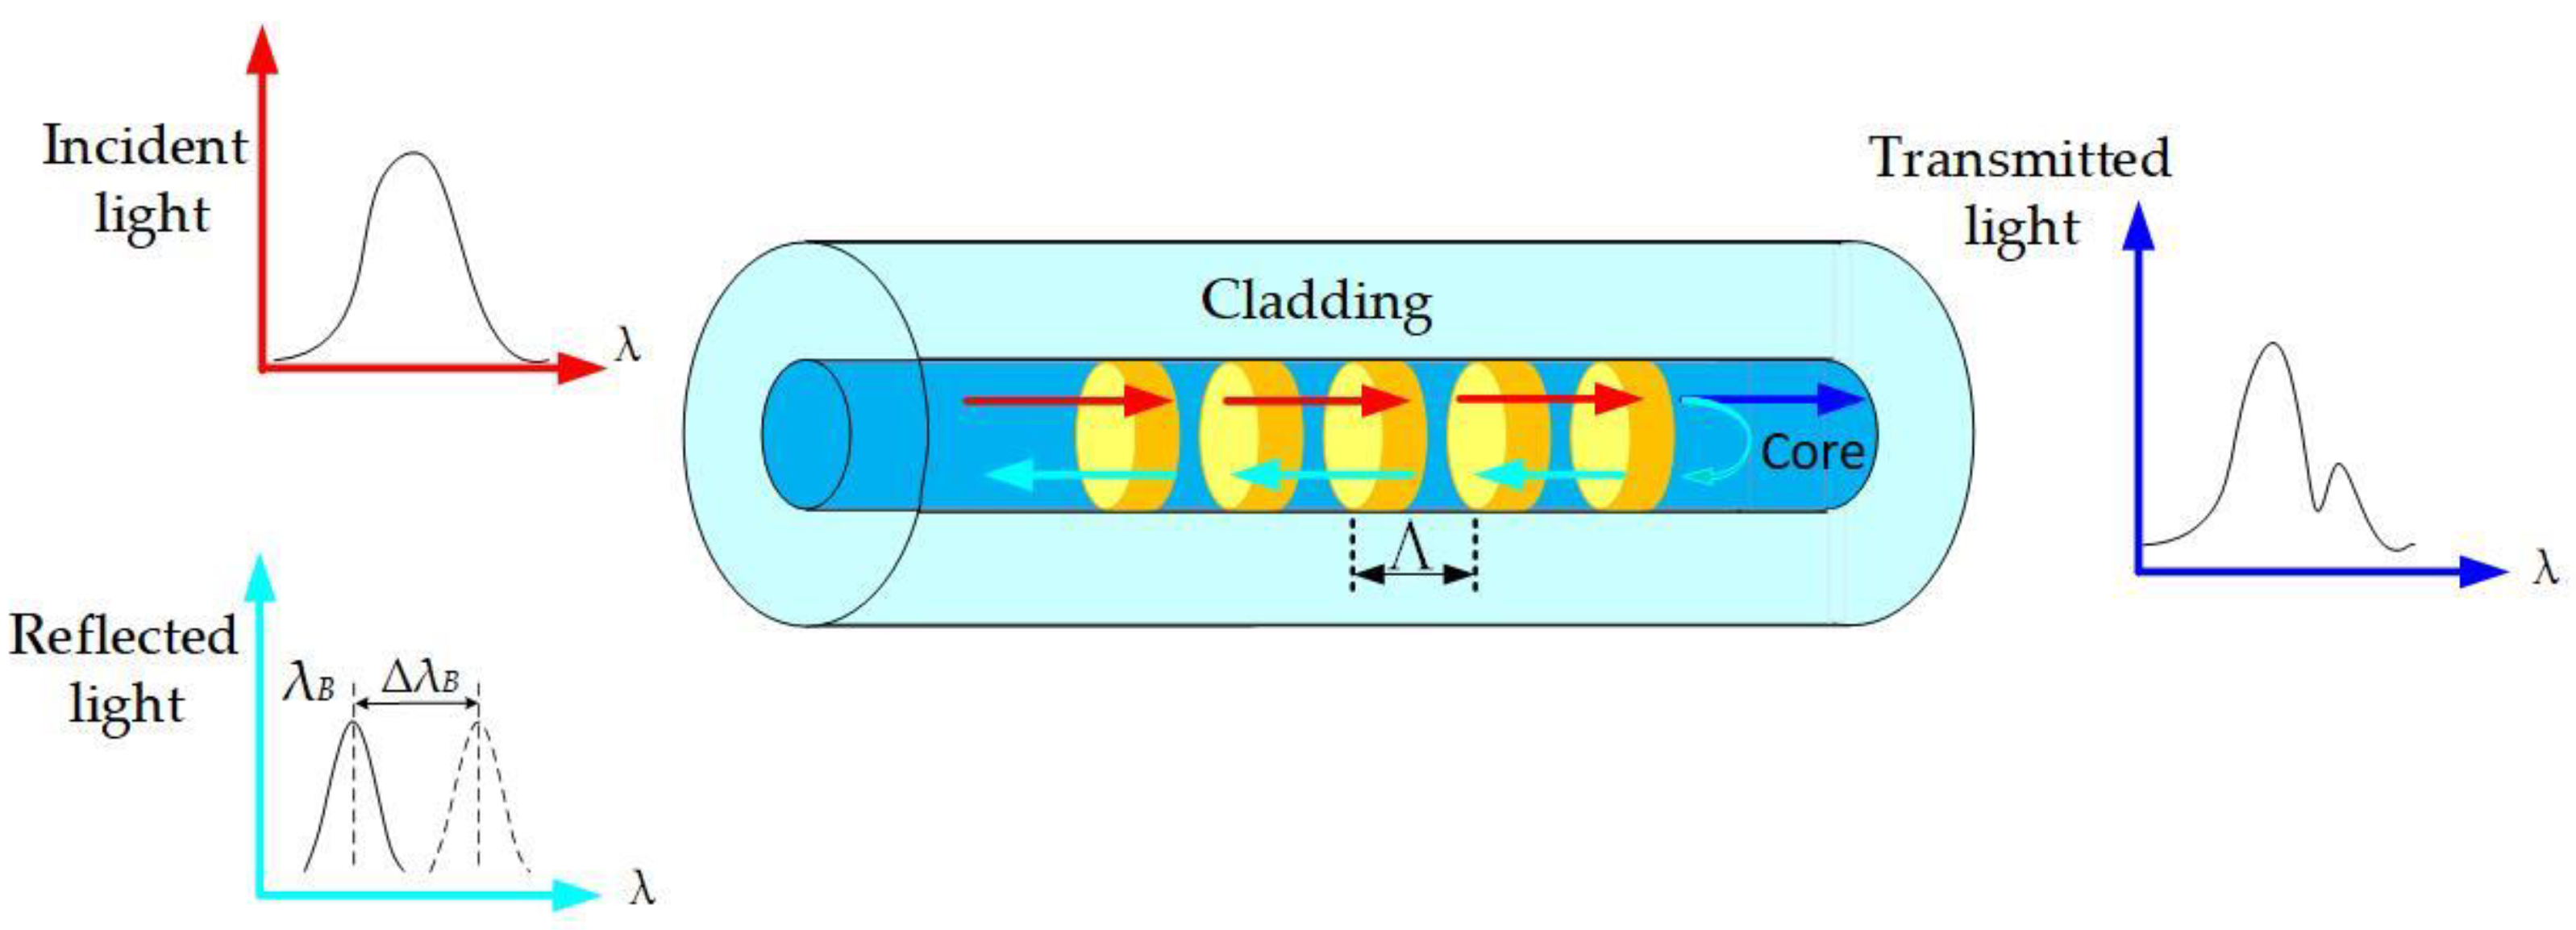
2.1. The Sensing Theory of the FBG
2.2. AdaBoost Neural Network Algorithm
- (1)
- Data collection
- (2)
- Initialize the weights of N samples. The initial sample weights are uniformly distributed, , where is the weight of the sample in the Kth iteration and N is the number of samples in the training set.
- (3)
- Under the weight of the training samples, the weak learner is trained.
- (4)
- The error and average error of the weak learner under each sample are calculated.
- (5)
- Update the sample weights . The weights of weak learners are , where and is the normalization factor for .
- (6)
- The weak classifiers are calculated recursively until the number of iterations is t. Finally, the weak classifiers are combined according to their weights, that is, .
- (7)
- Through the action of the symbolic function , the strong predictor function is obtained as:
3. The FBG Intelligent Monitoring System for Hydraulic Support Attitude
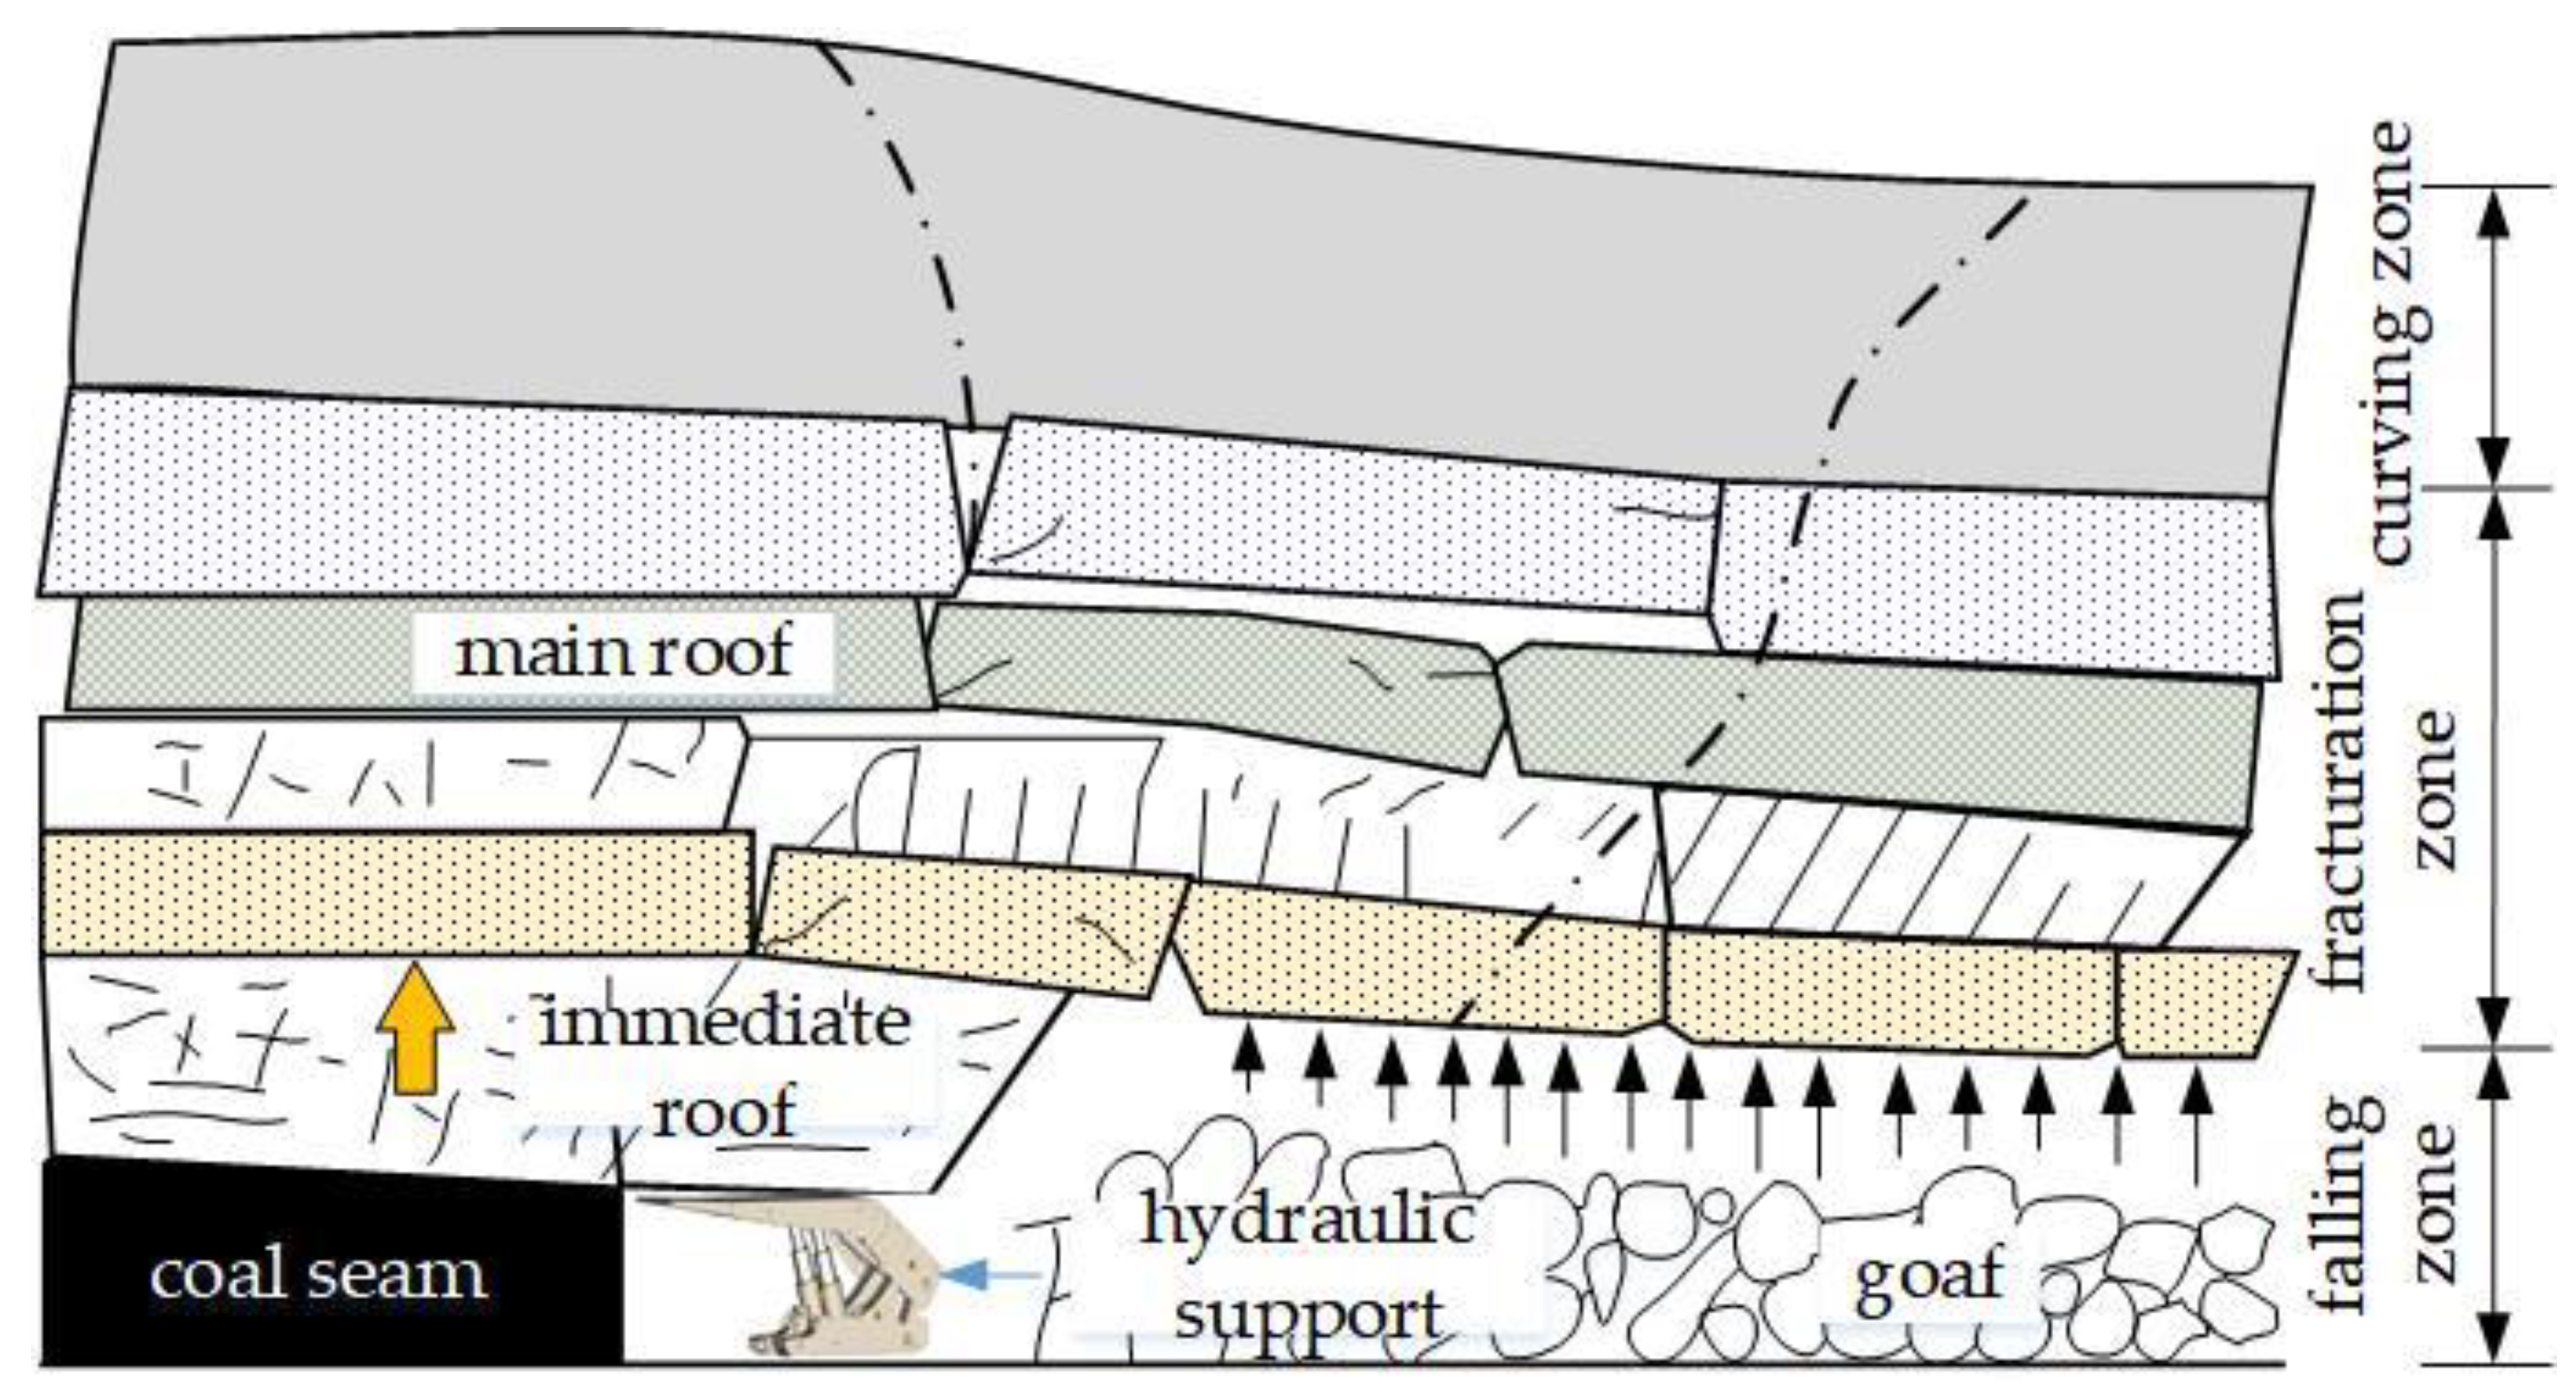
3.1. The Coupling Model of the Hydraulic Support and Surrounding Rock in a Stope
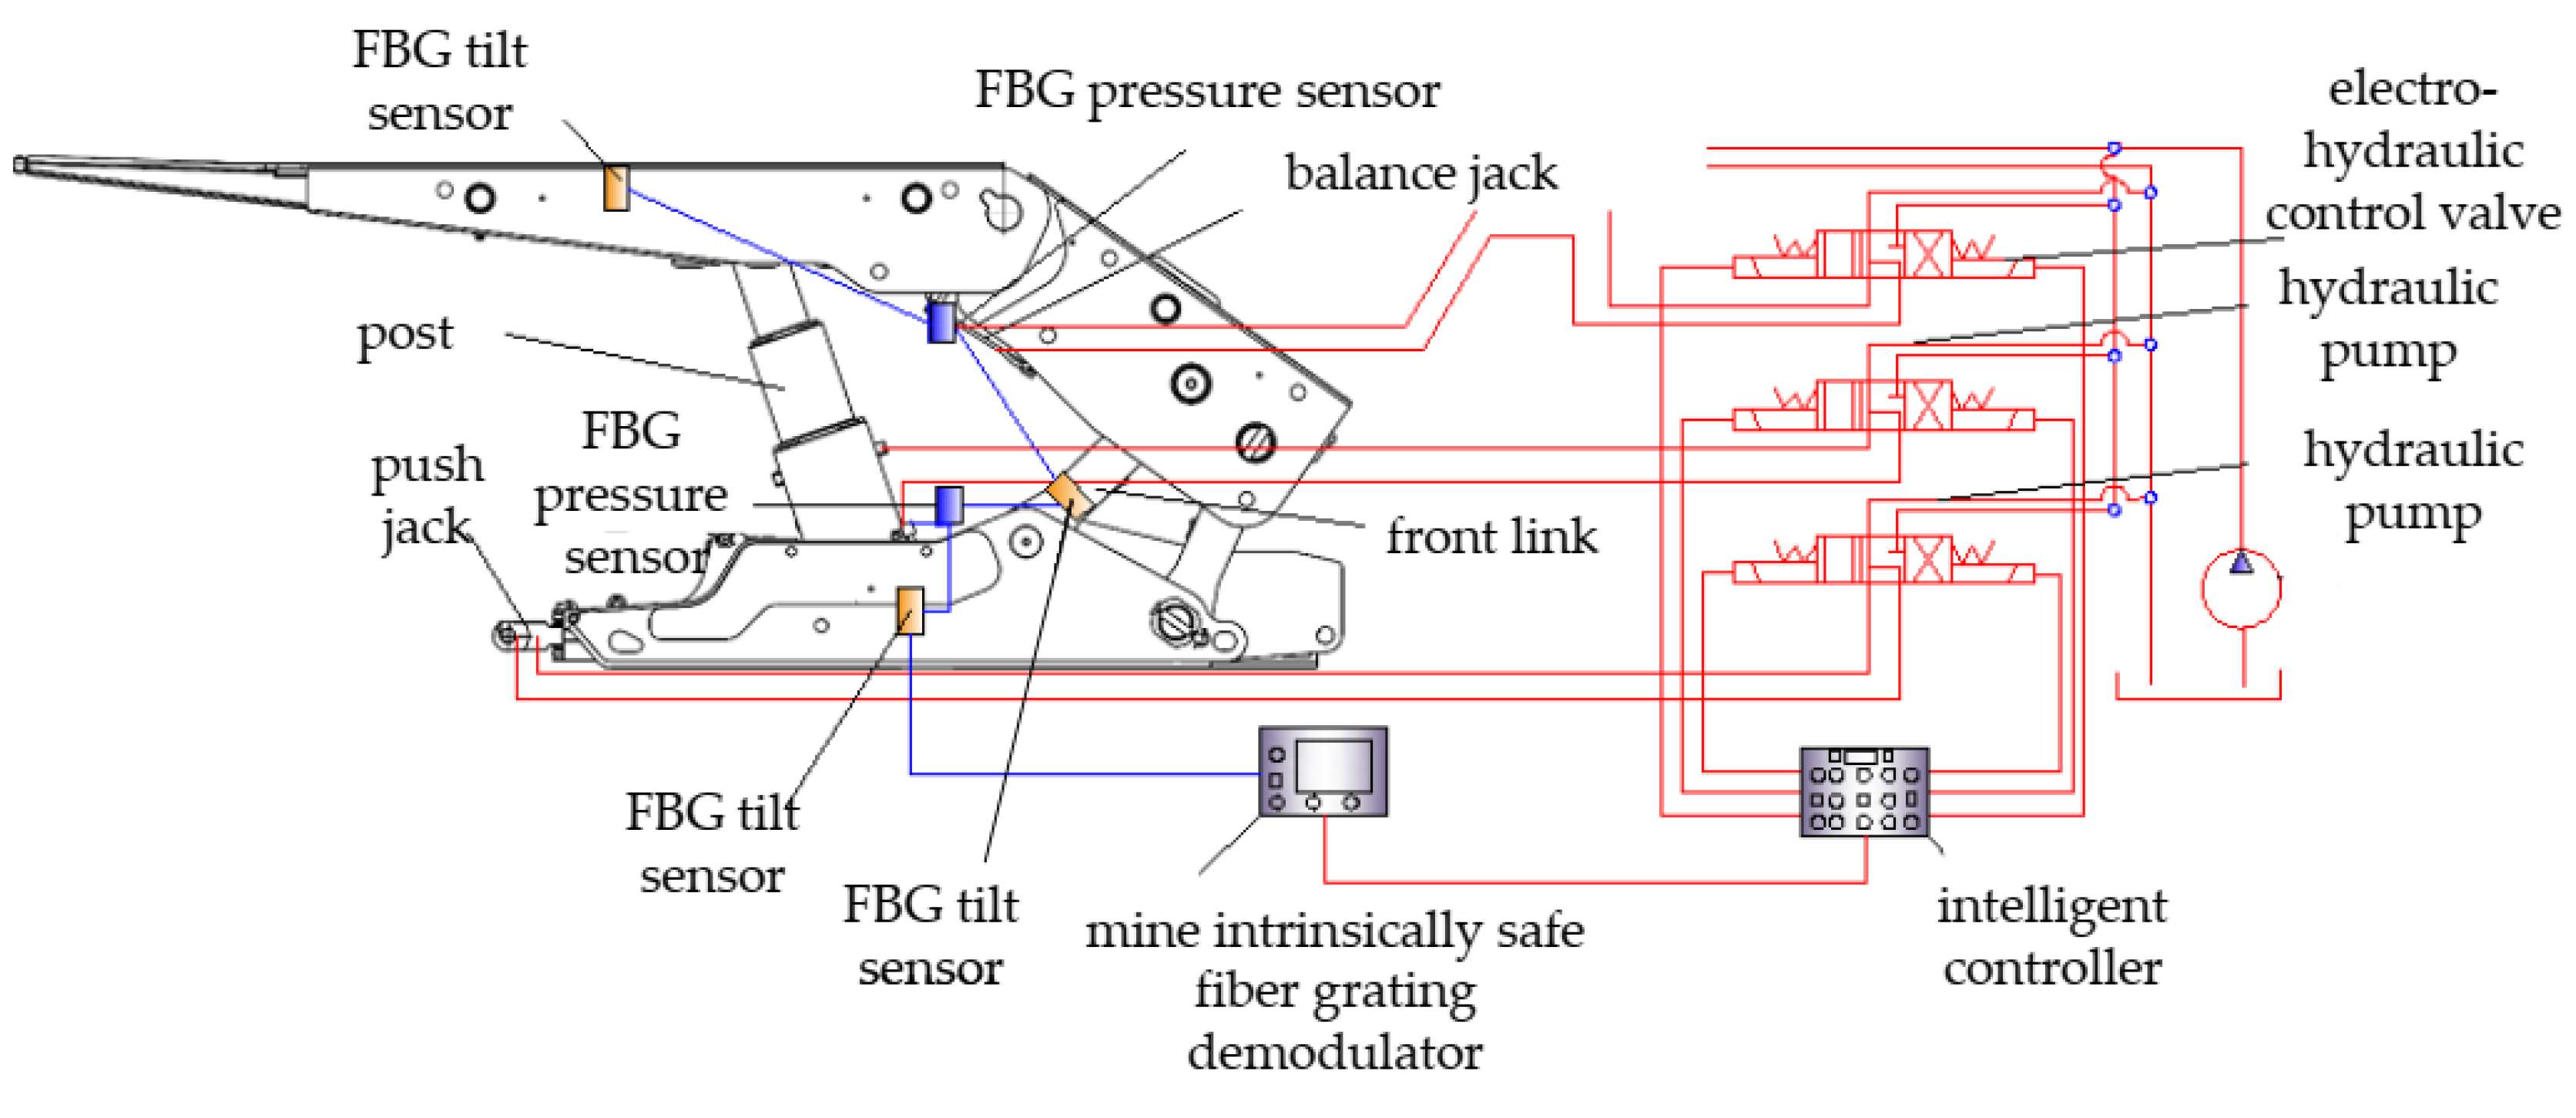
3.2. The FBG Sensing System for Hydraulic Support Attitude
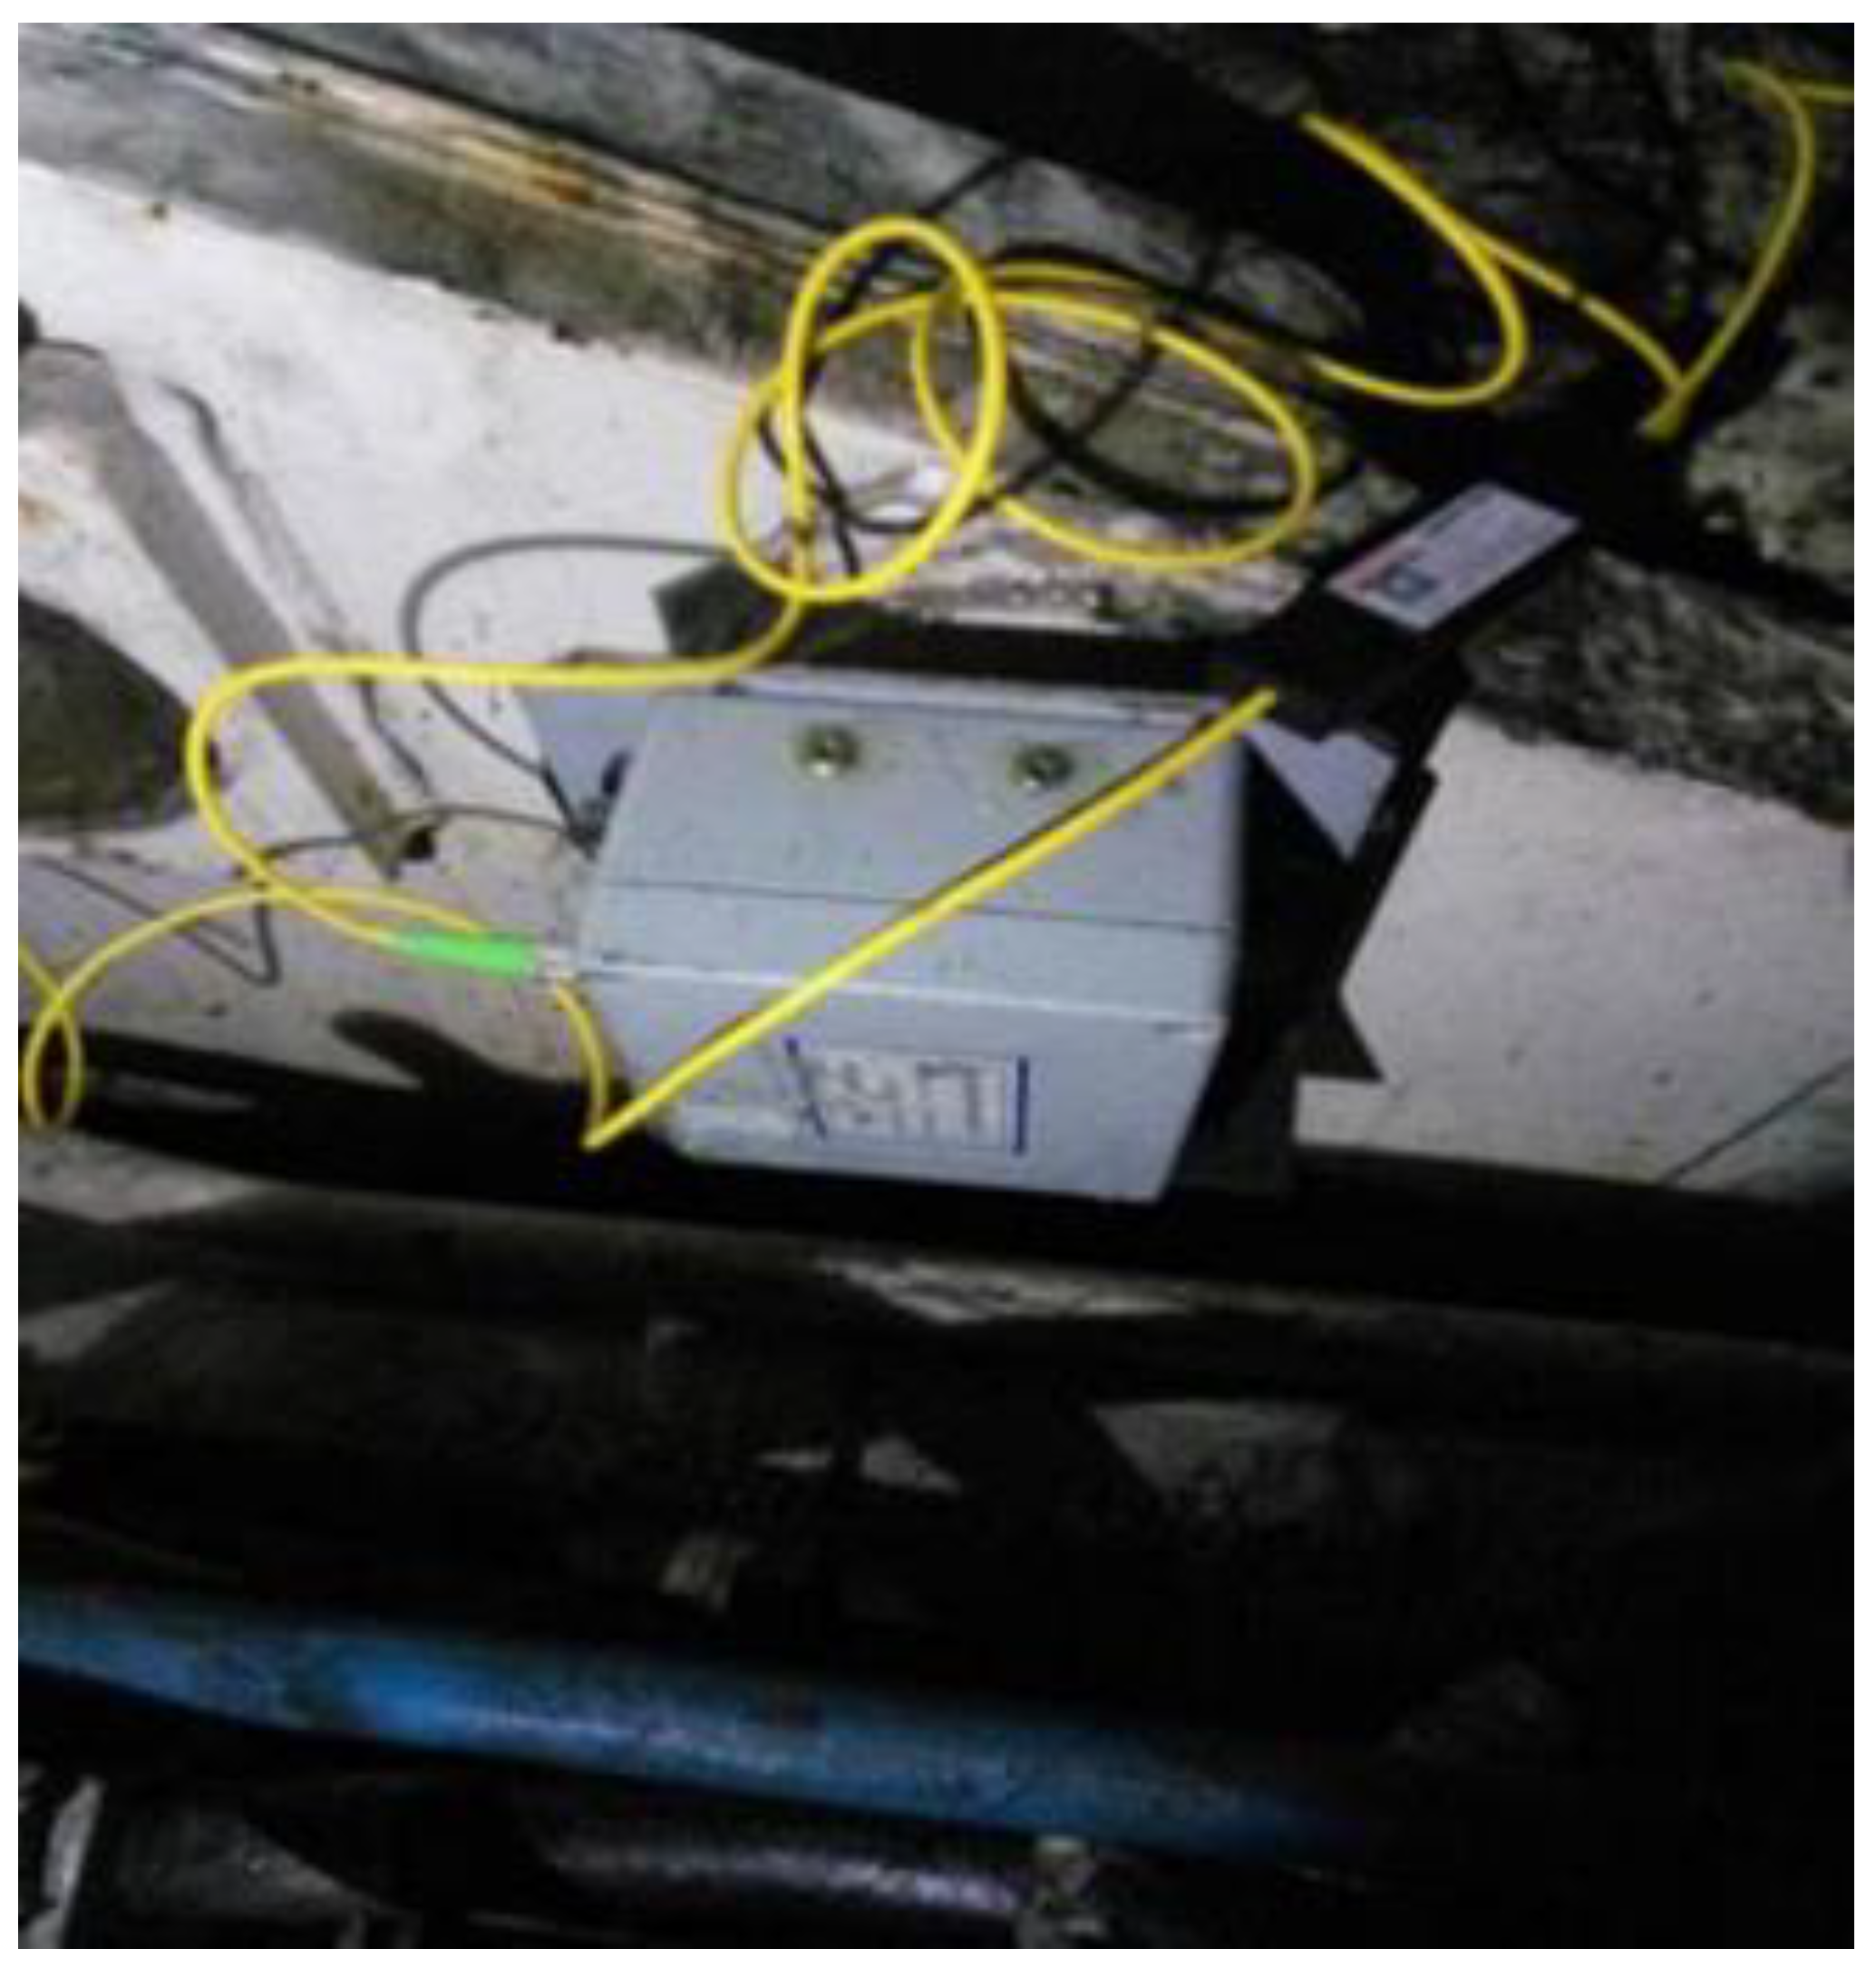
3.2.1. The Hardware Equipment of FBG Sensing Monitoring
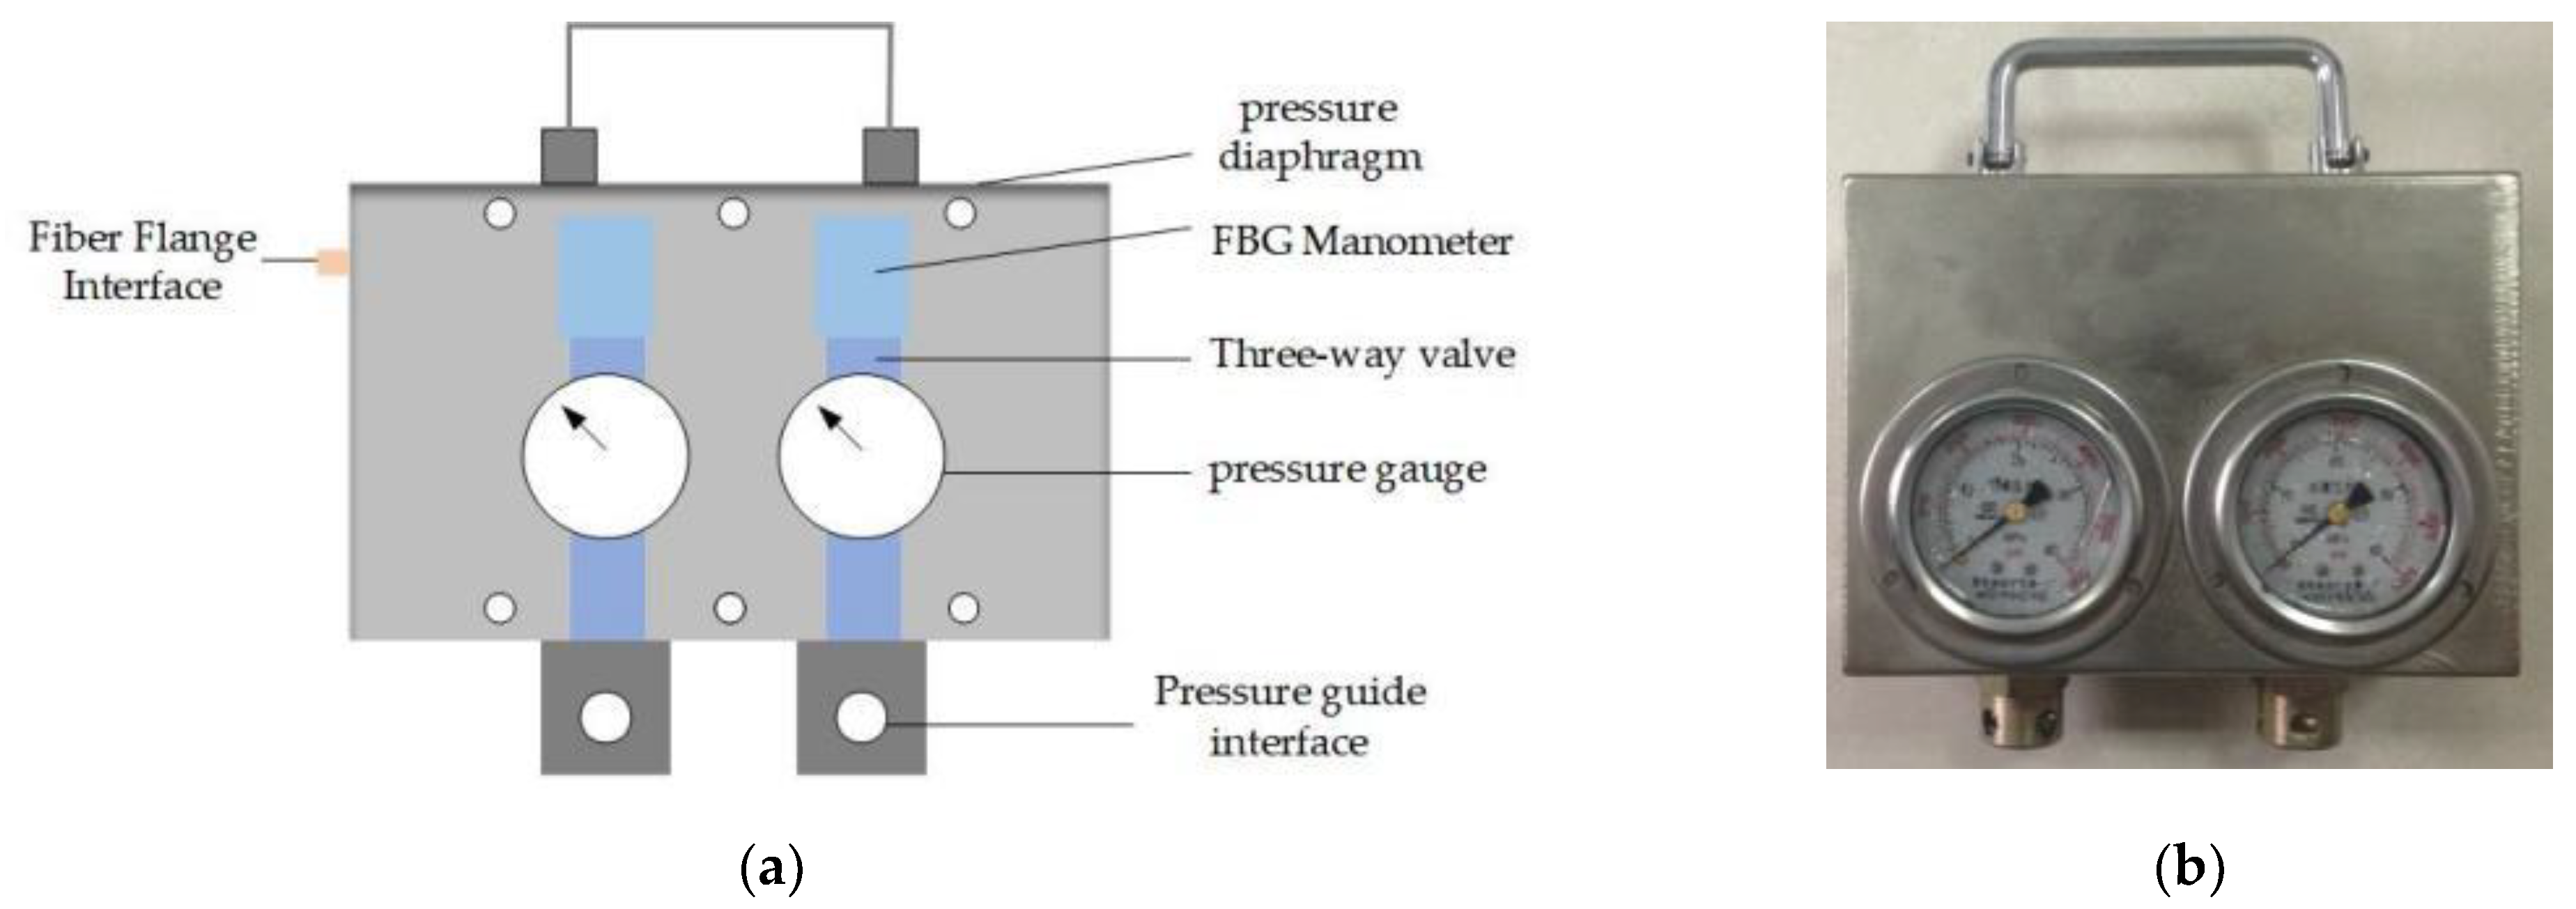
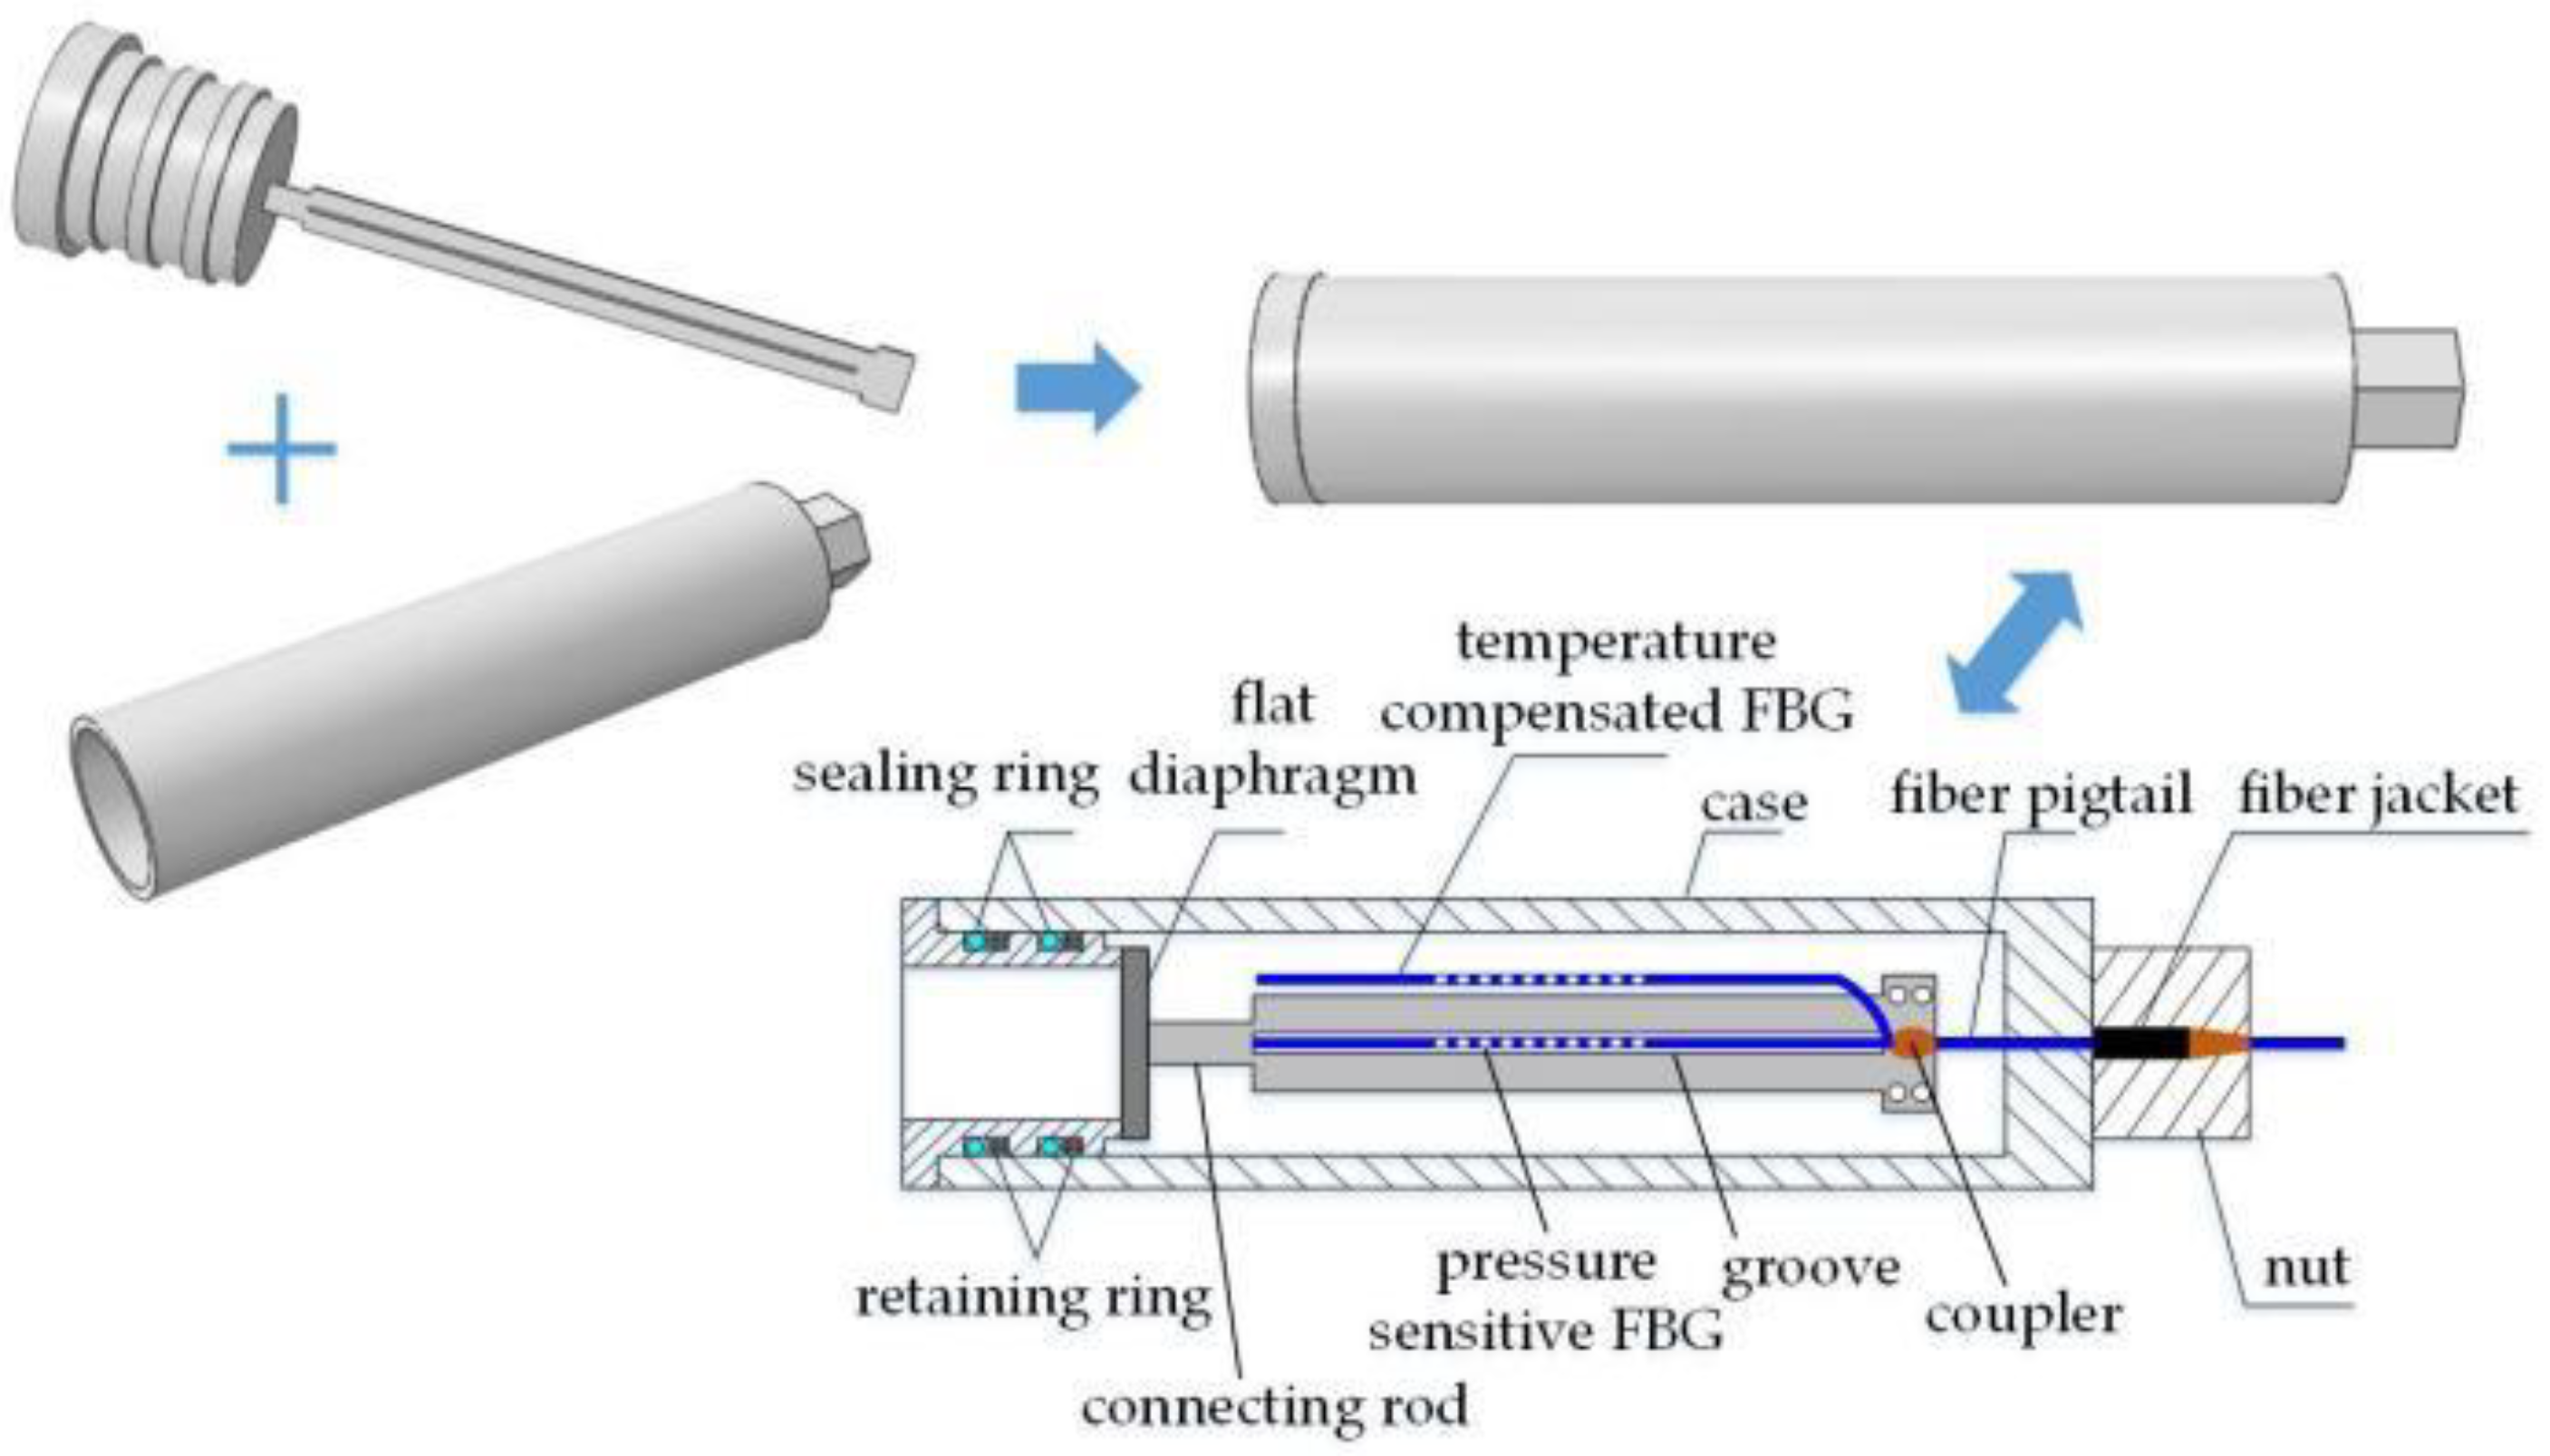
- The FBG Pressure Sensor for Hydraulic Support
- 2.
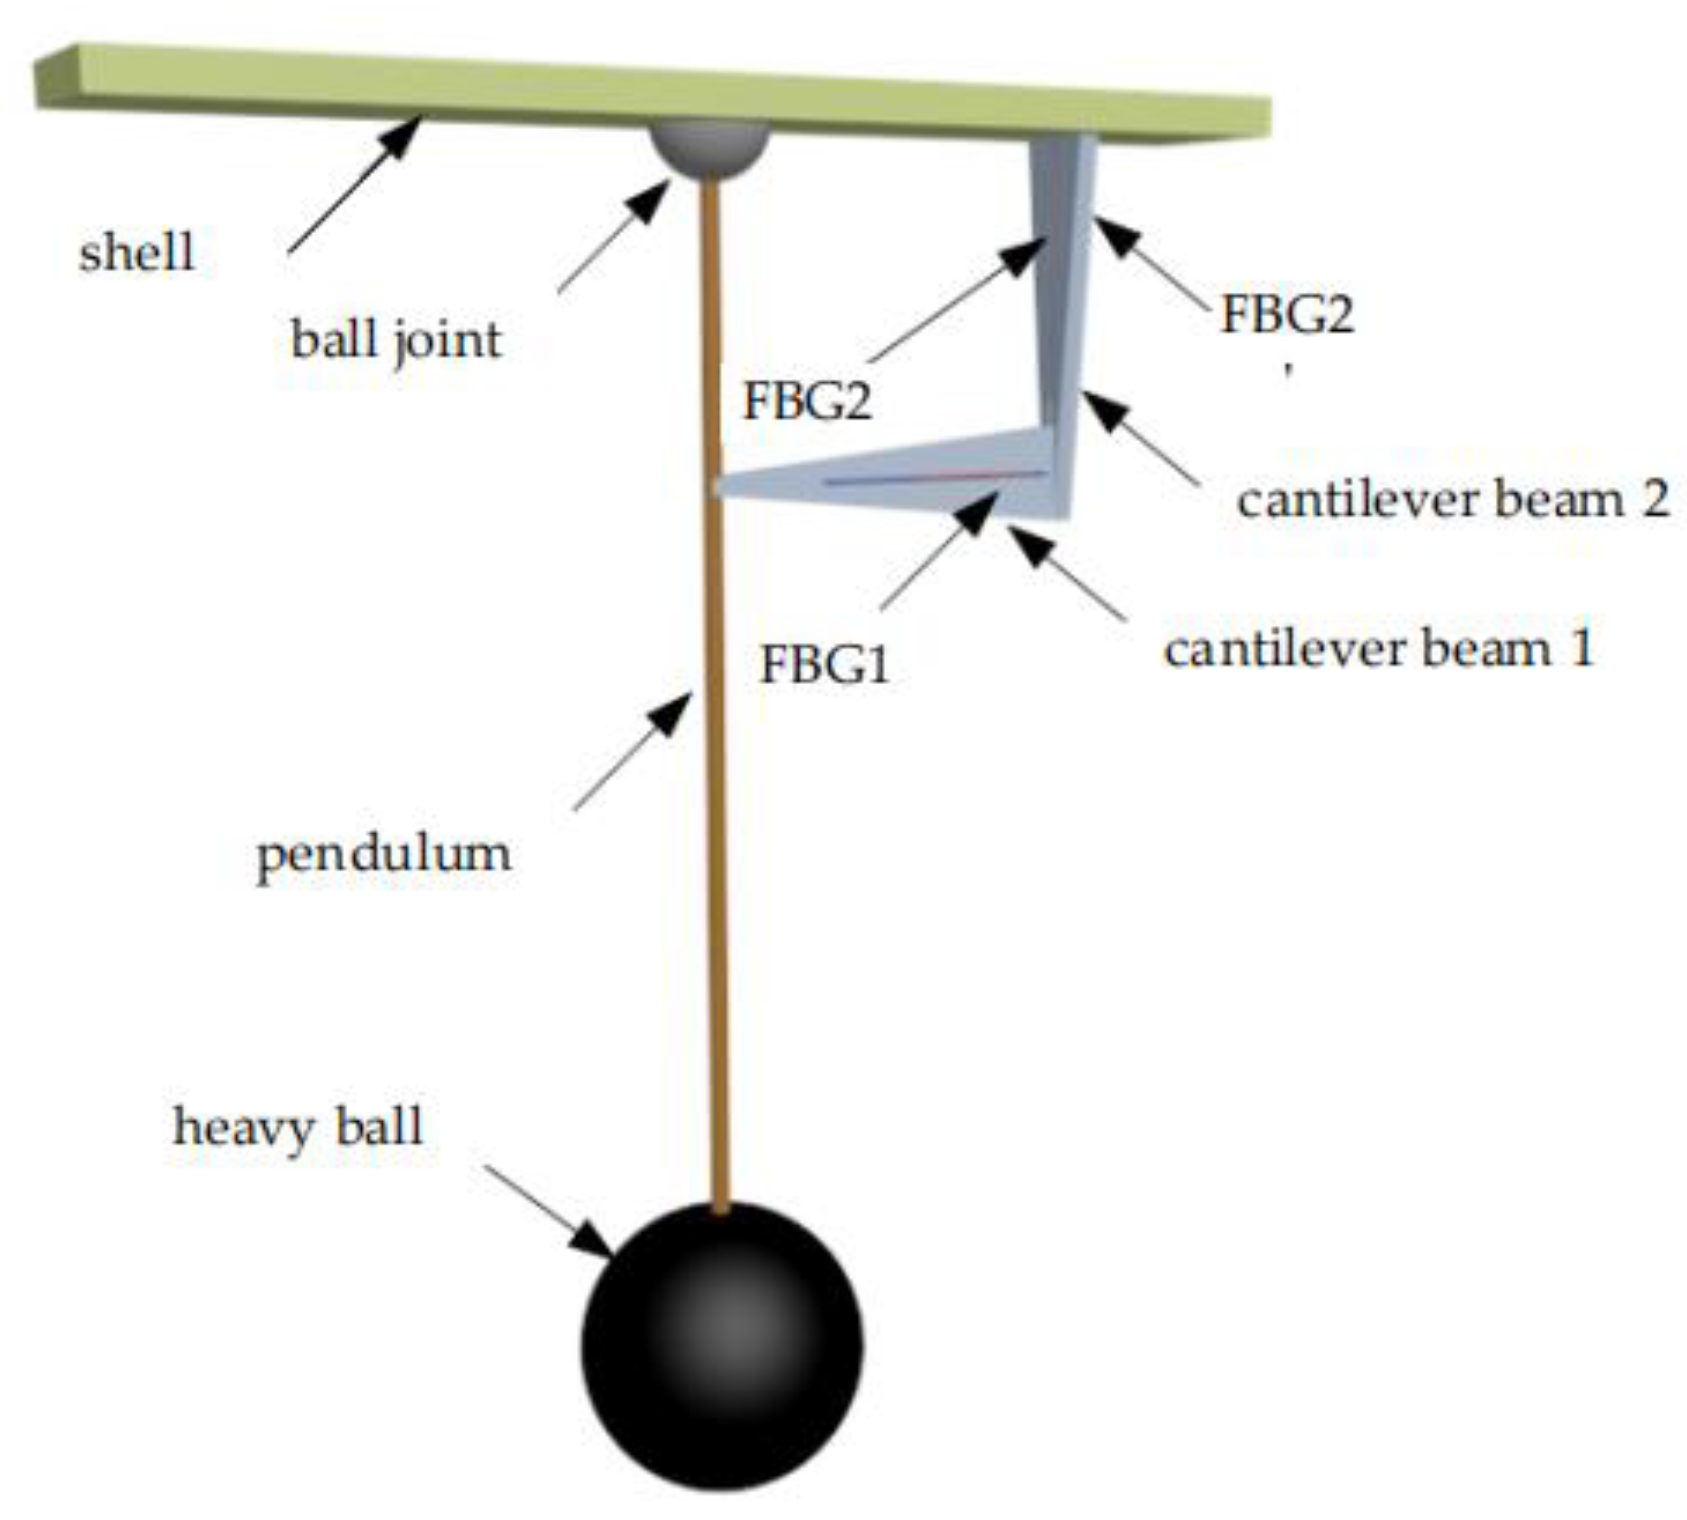
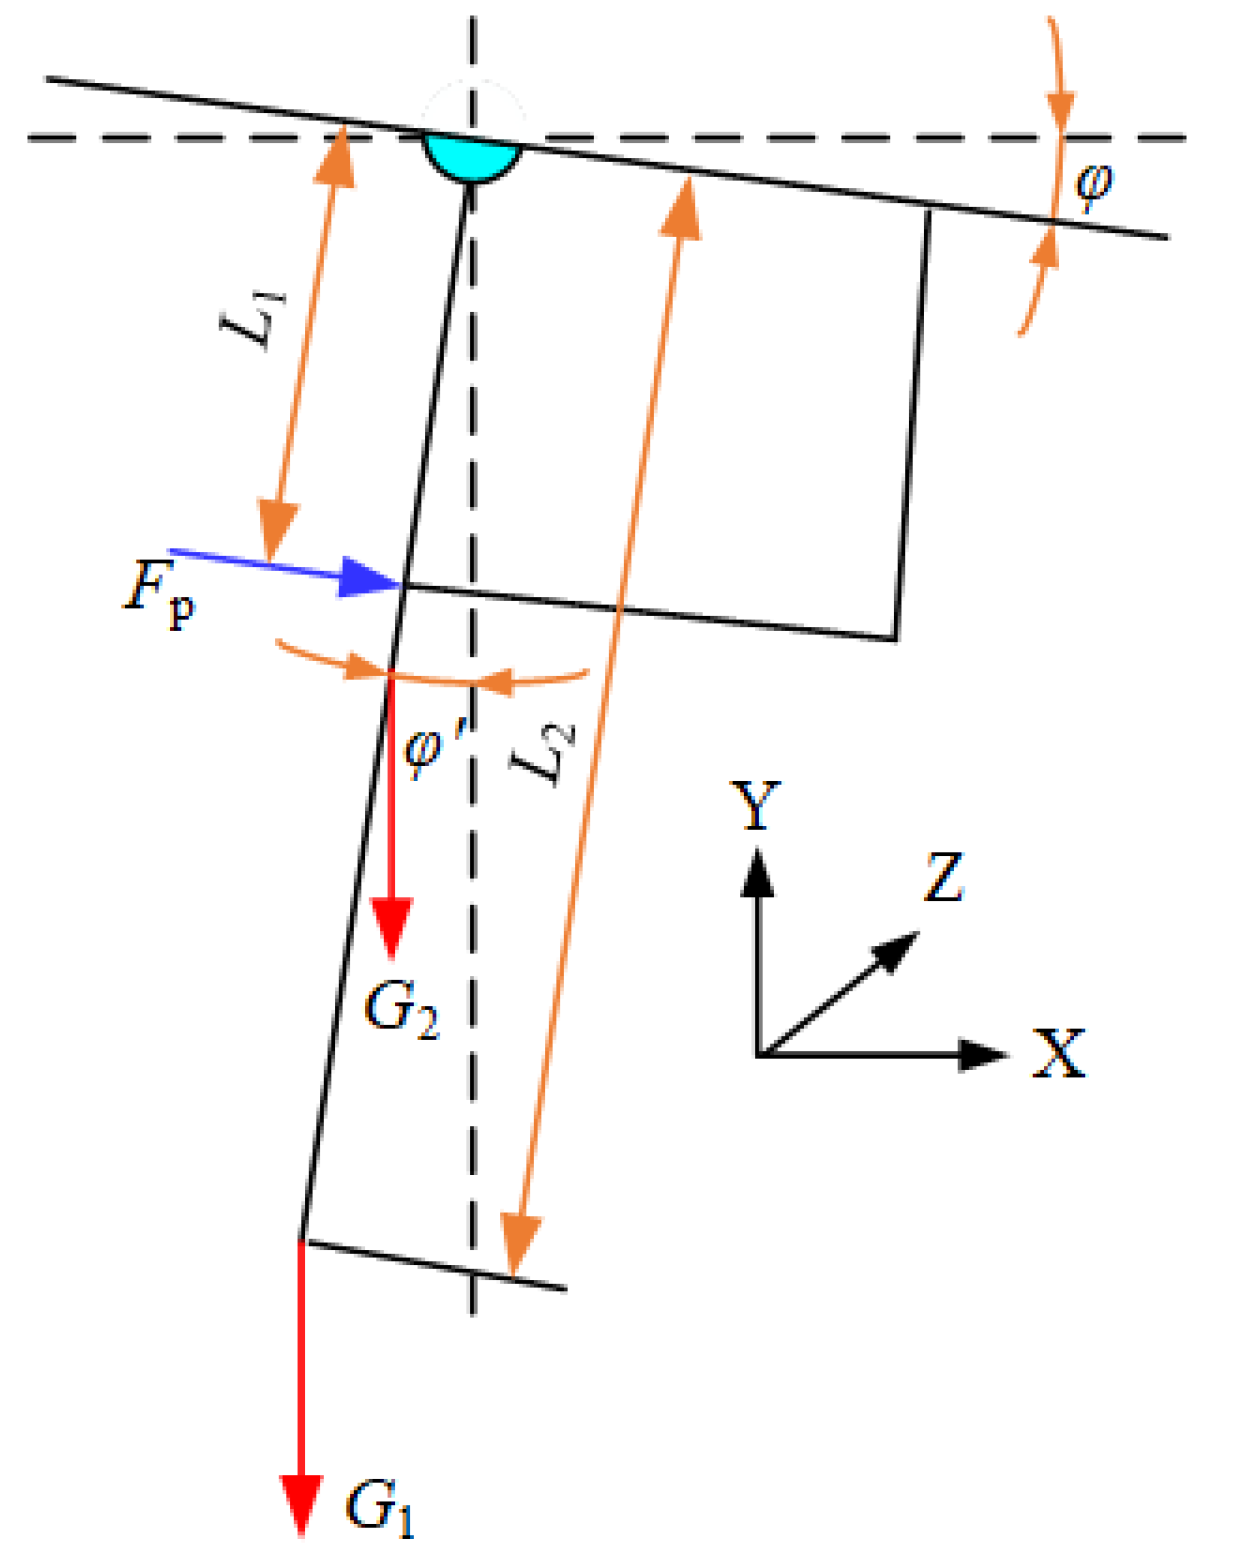
- The FBG Tilt Sensor
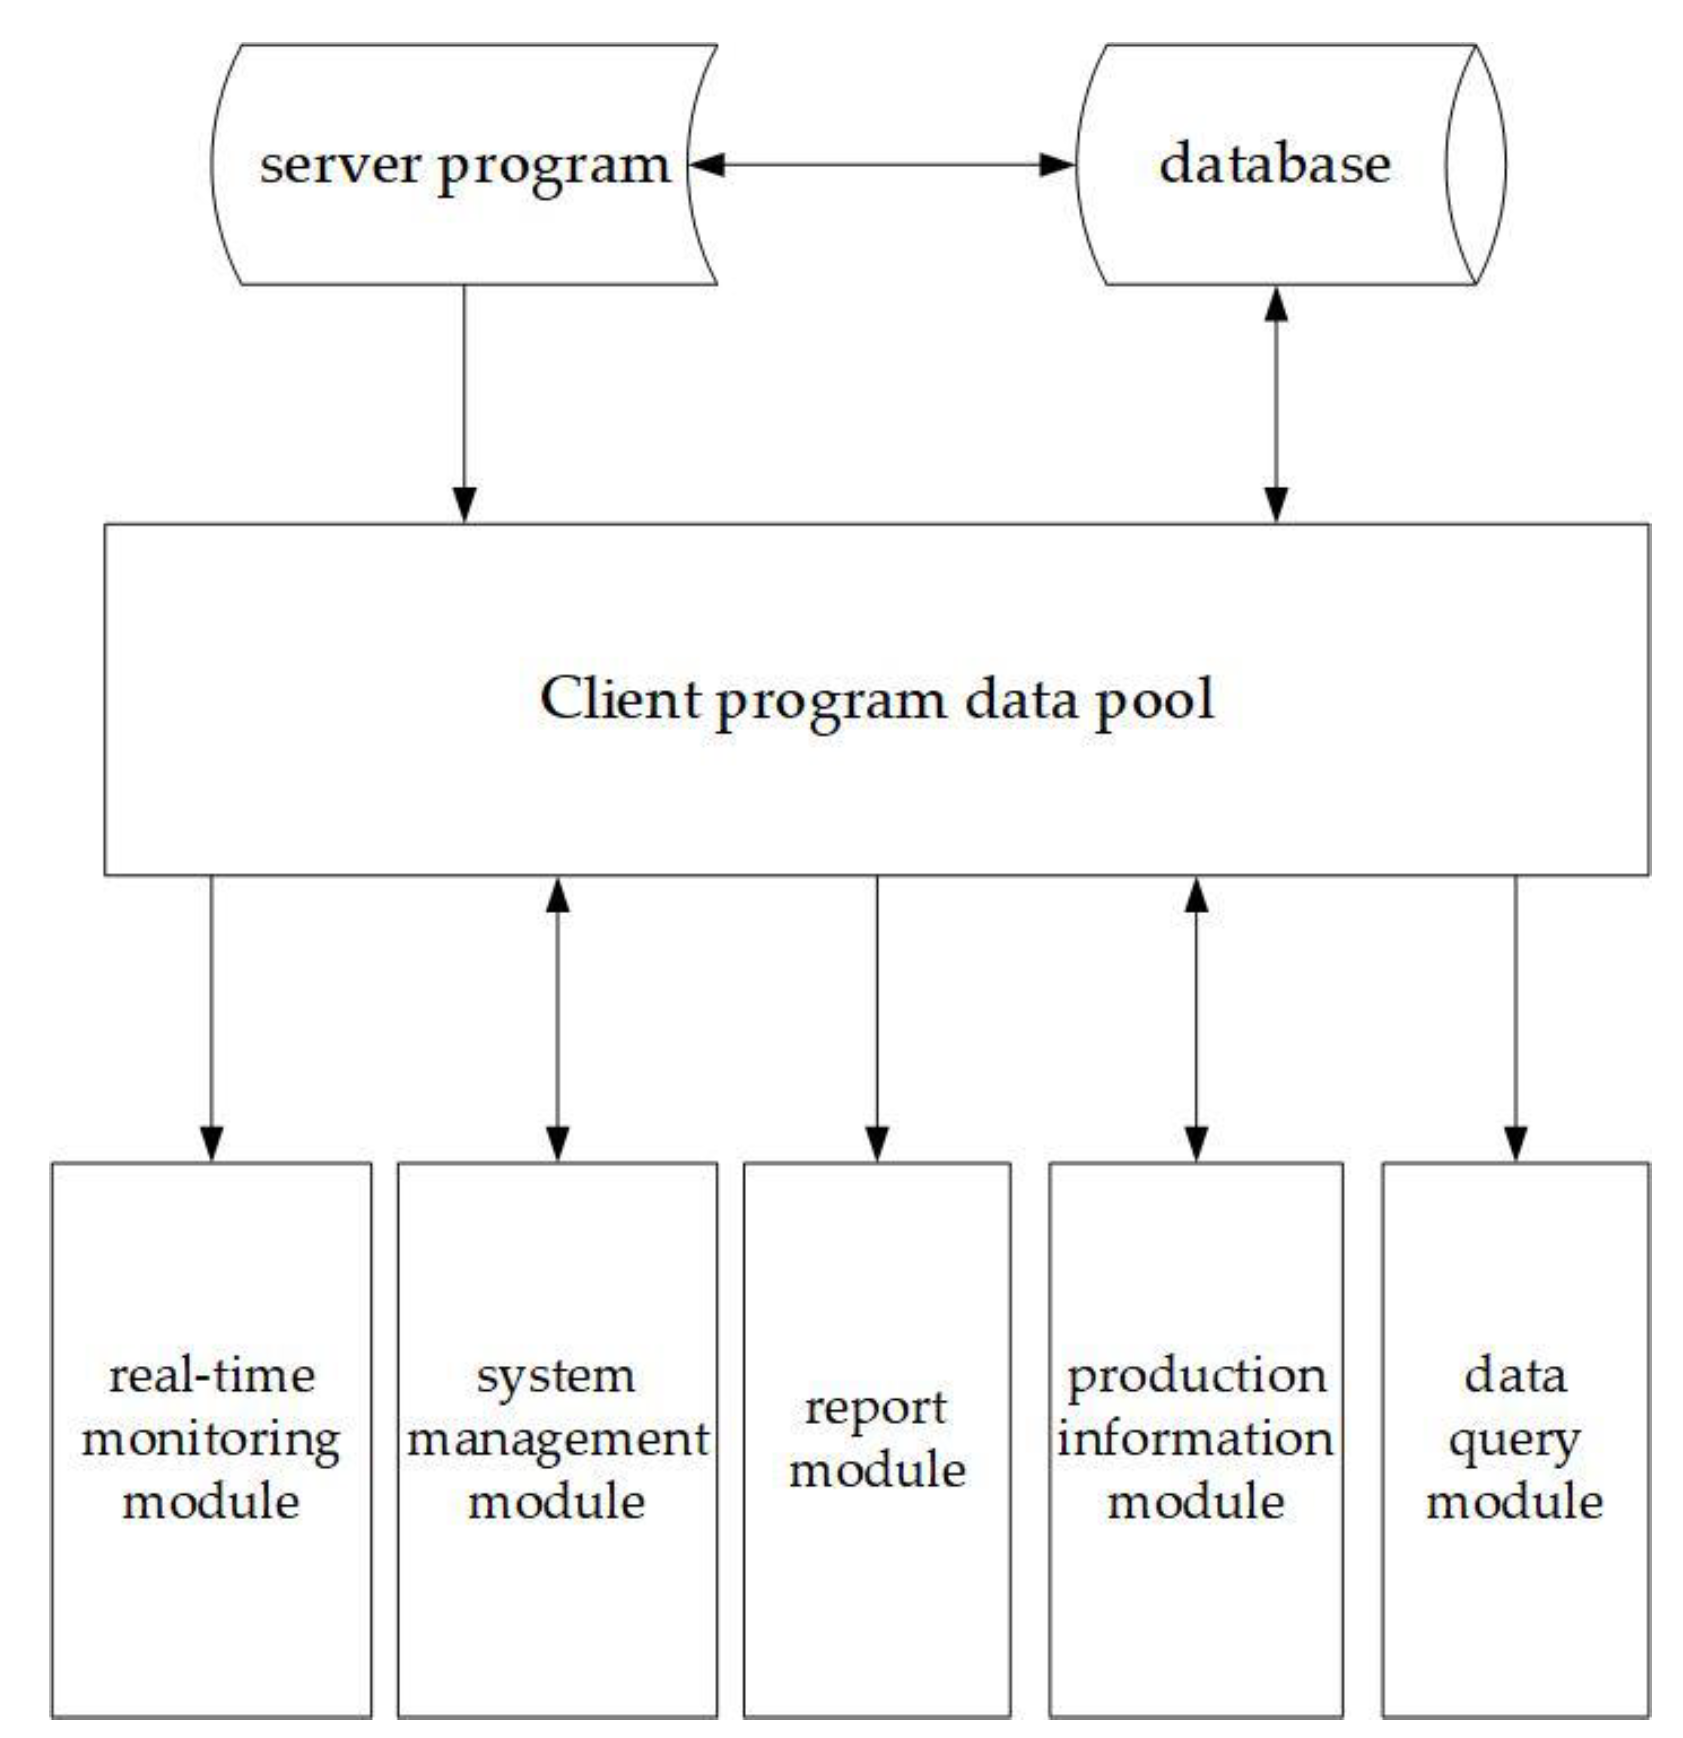
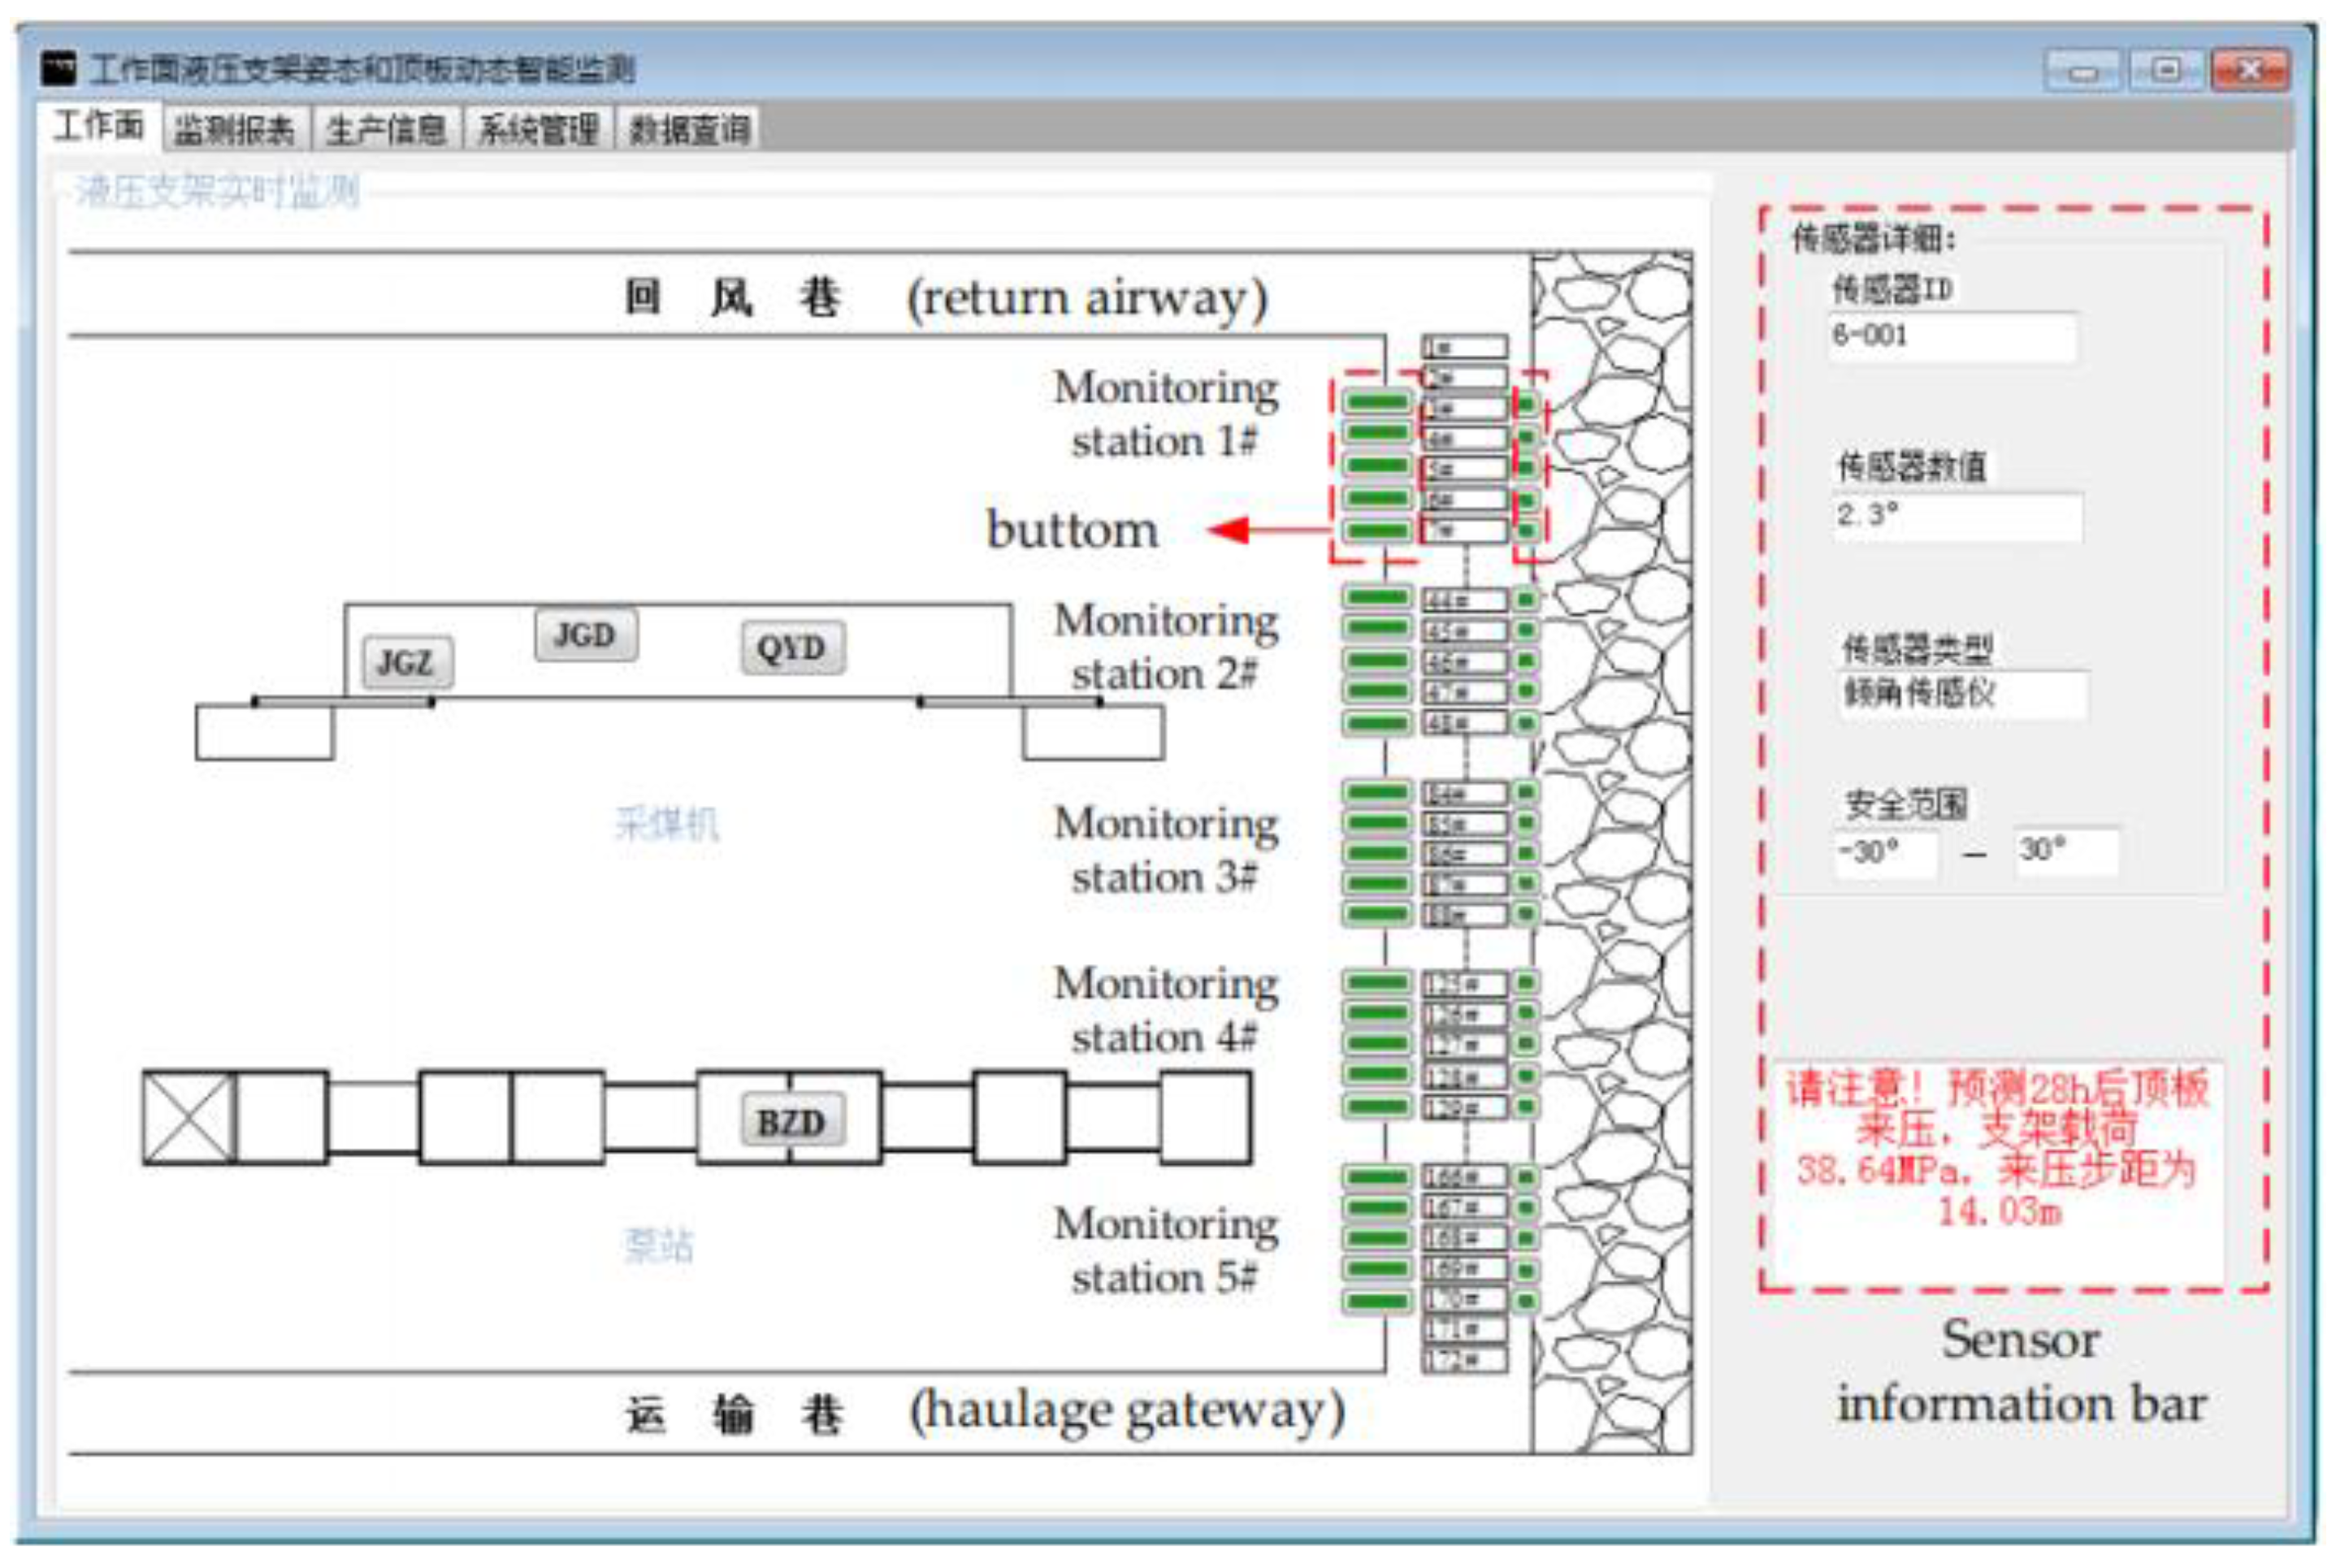
3.2.2. The Software Information Platform of FBG Sensing Monitoring
4. Engineering Application
4.1. Project Overview
4.2. The FBG Sensing System for Hydraulic Support Attitude
4.2.1. The FBG Sensing System
4.2.2. Measuring Stations Arrangement
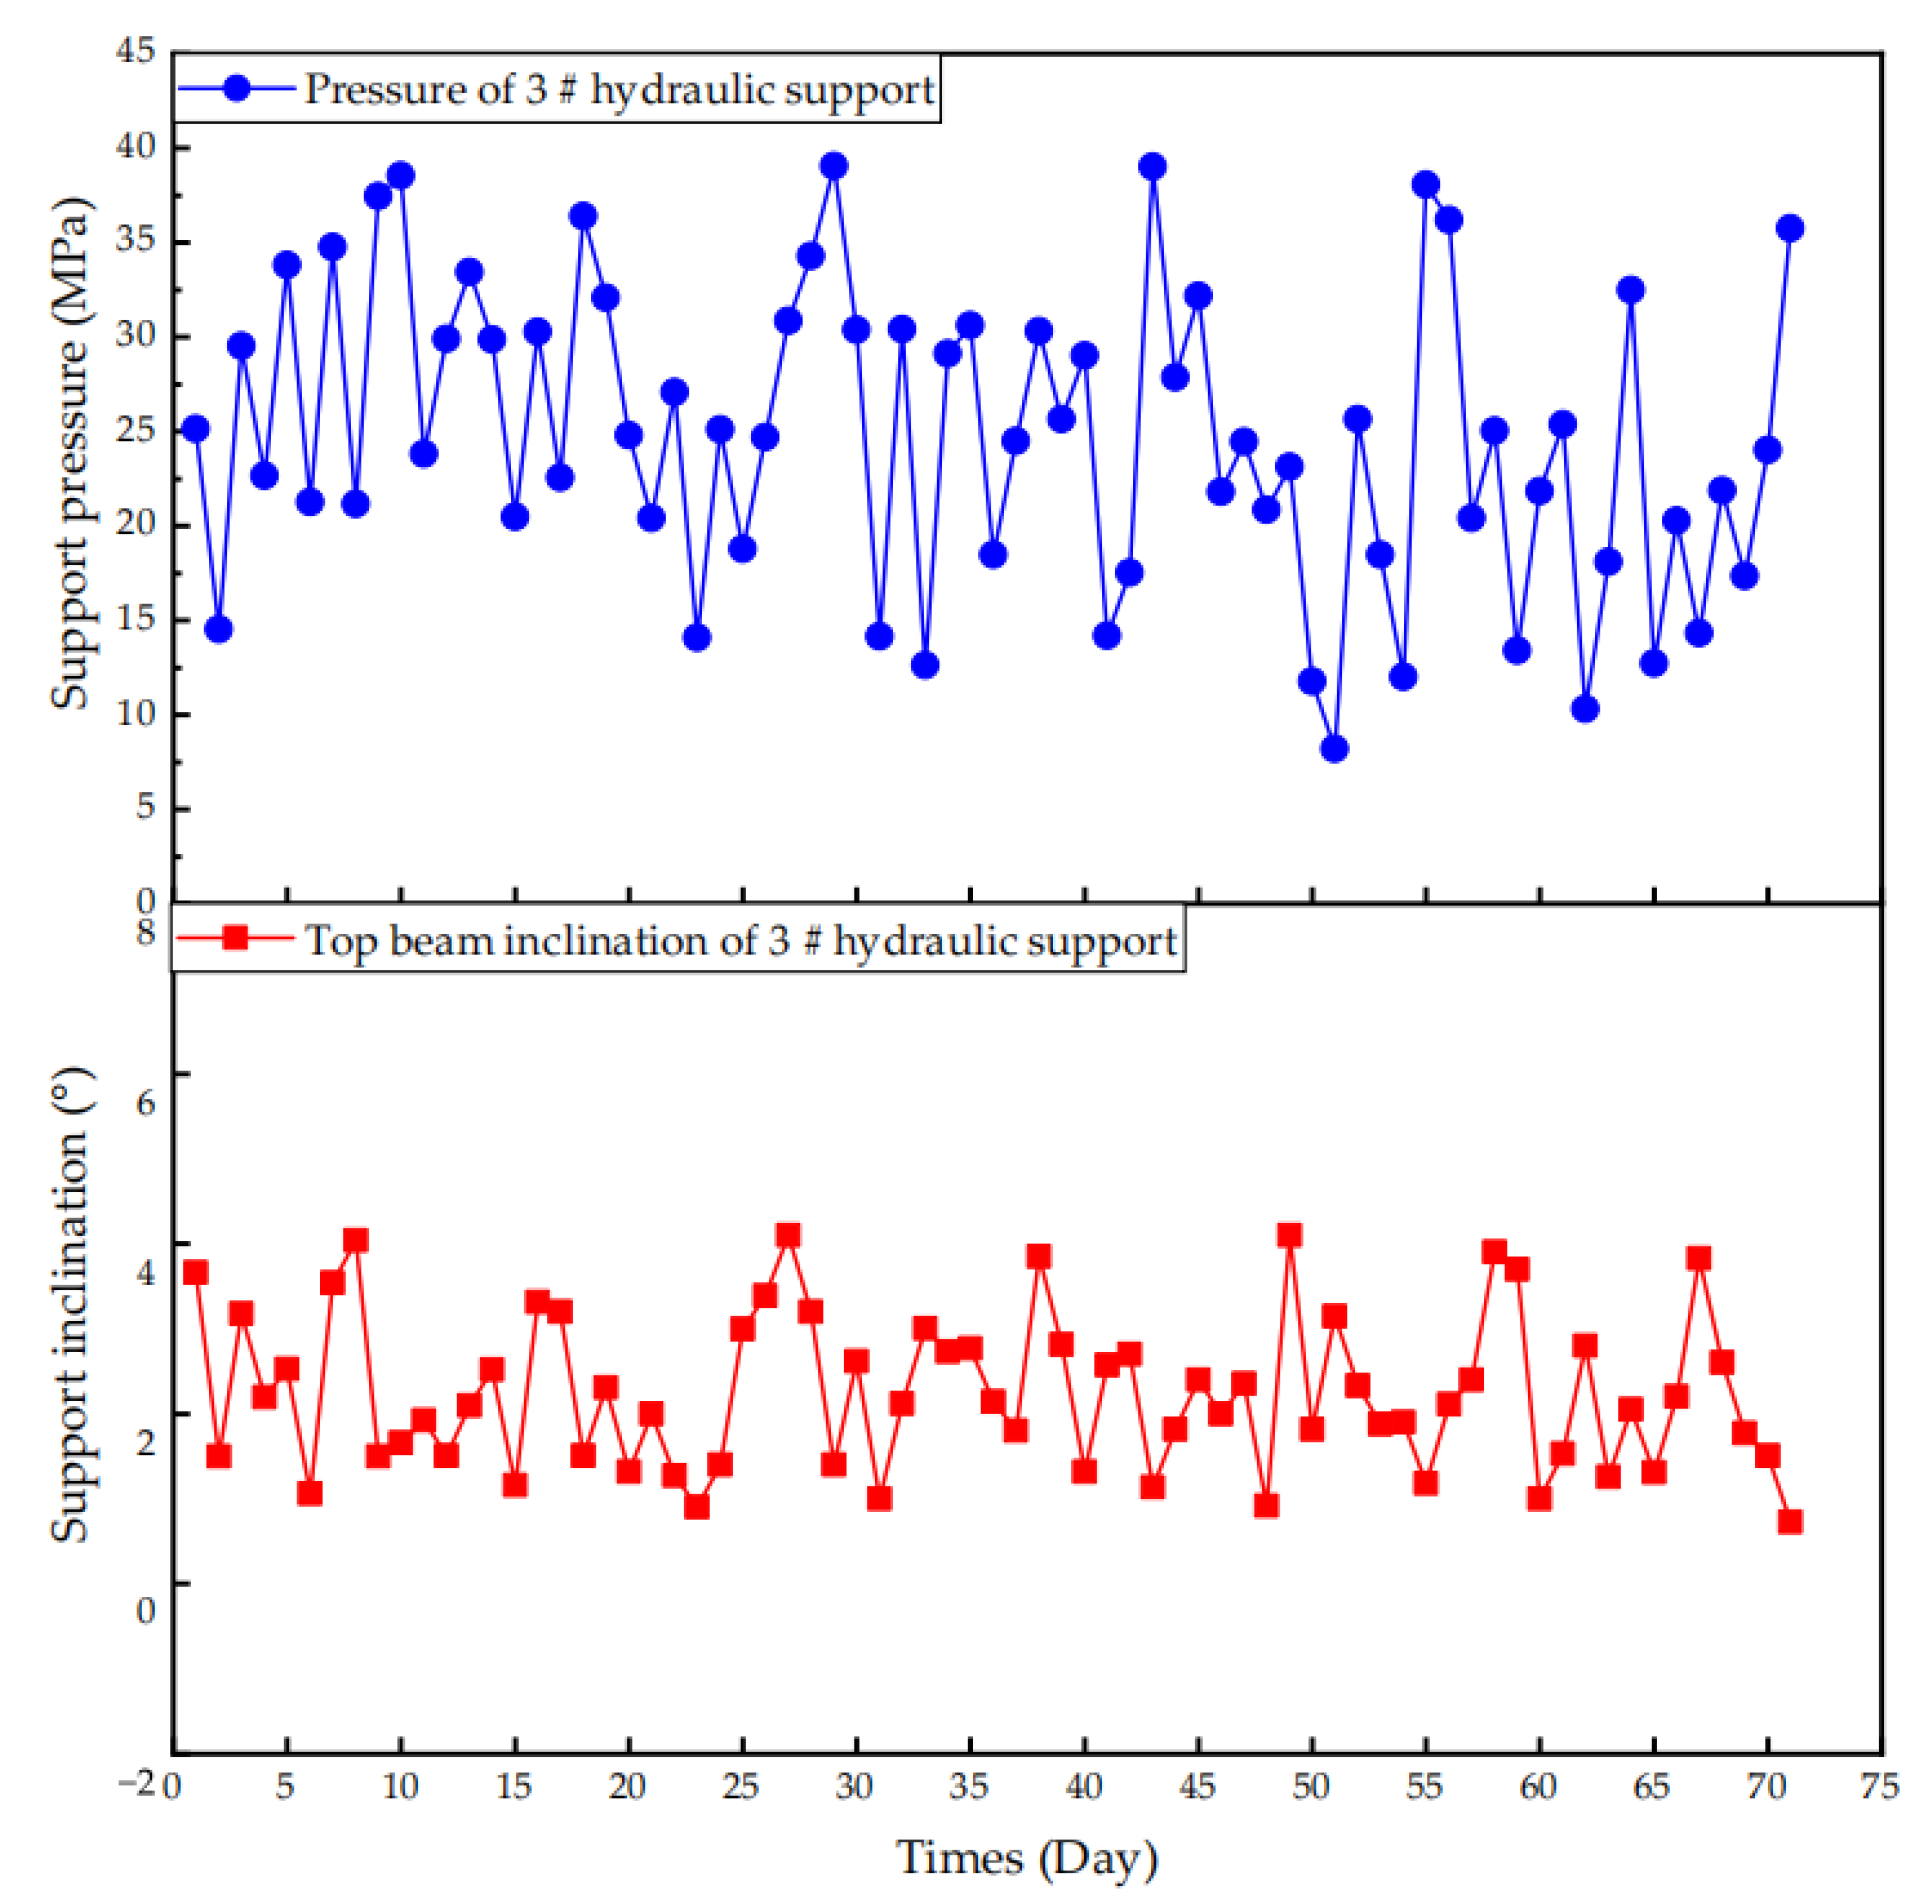
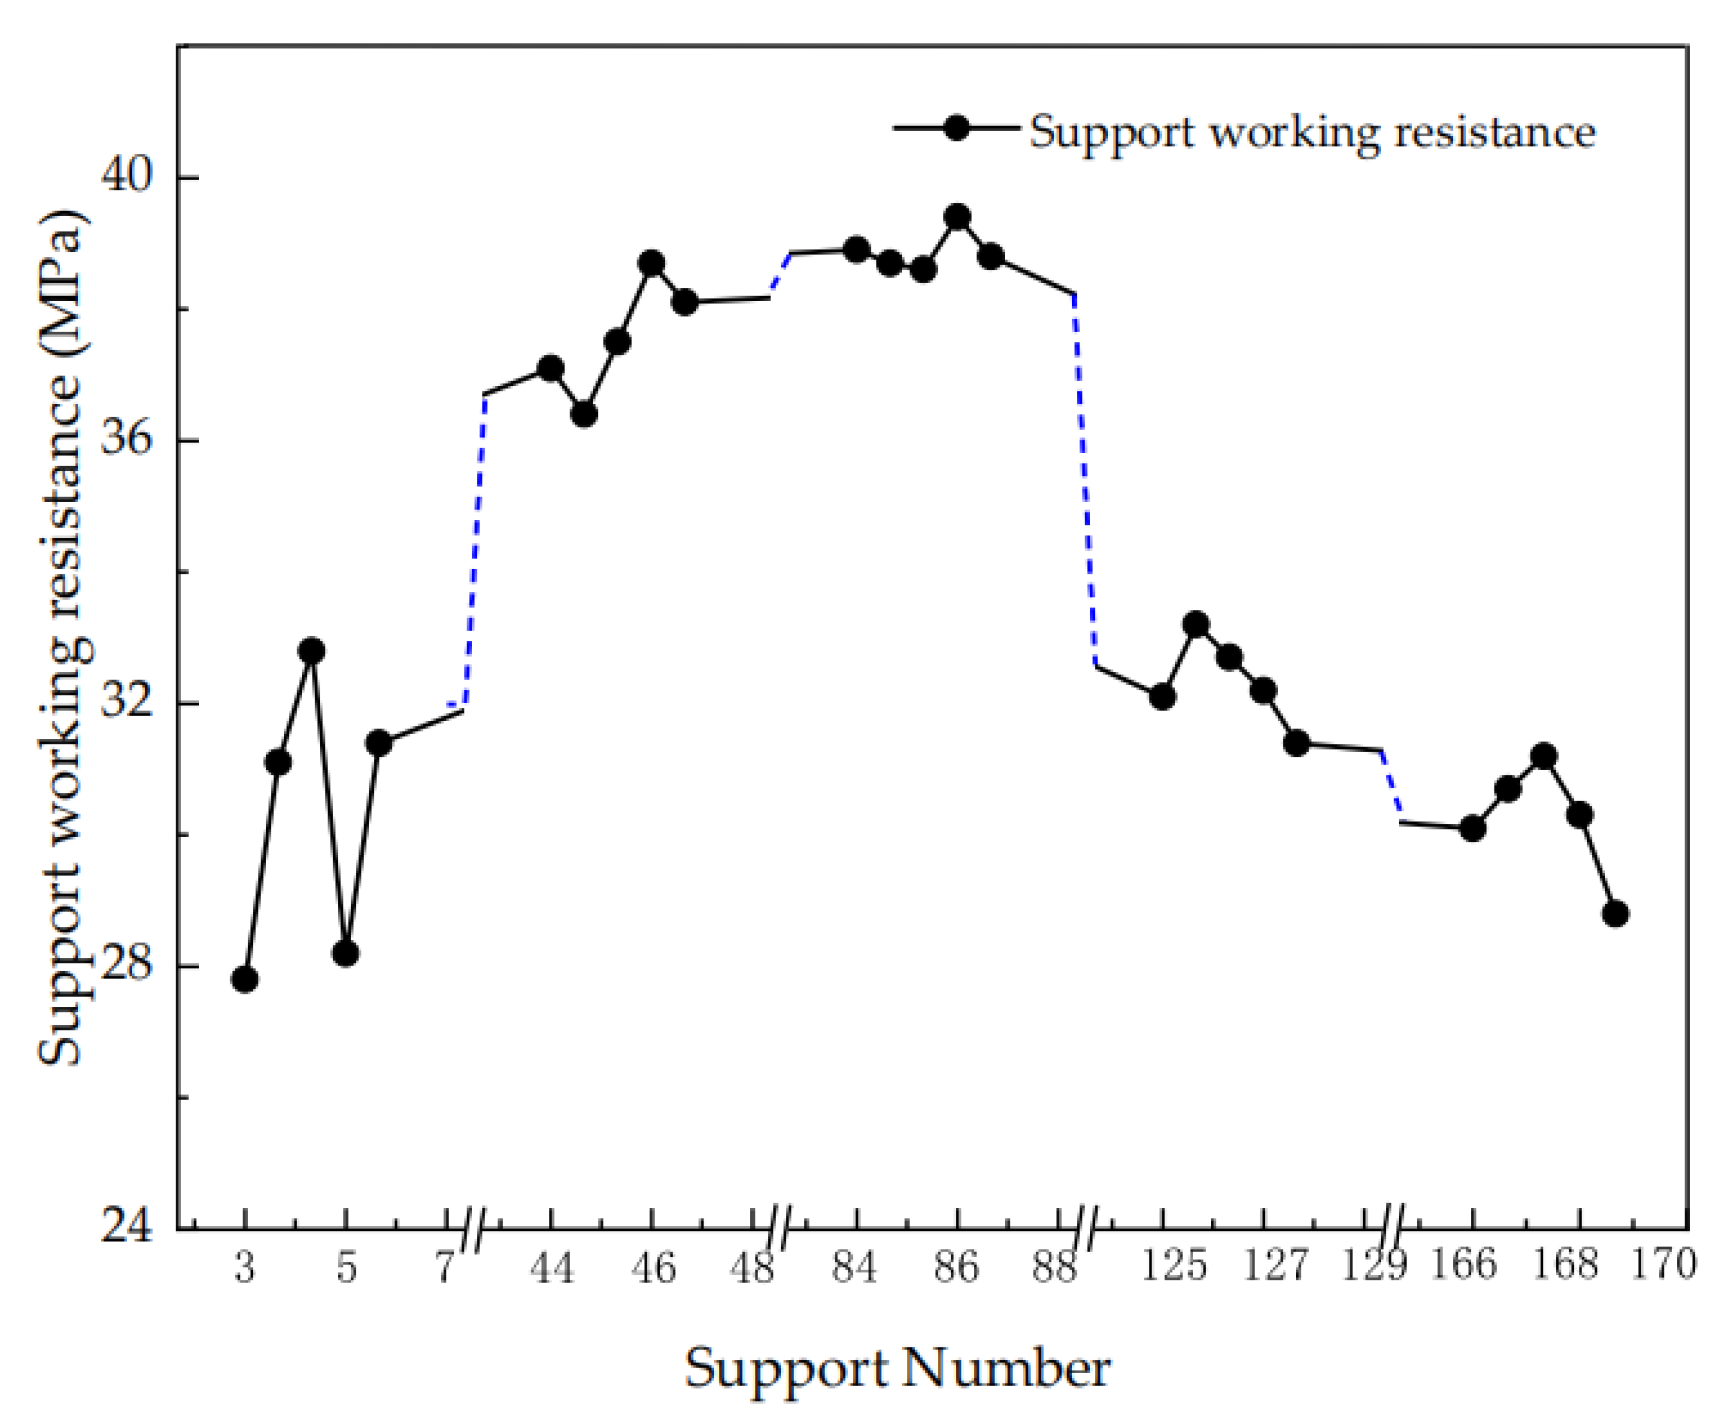
4.3. Analysis of Monitoring Results
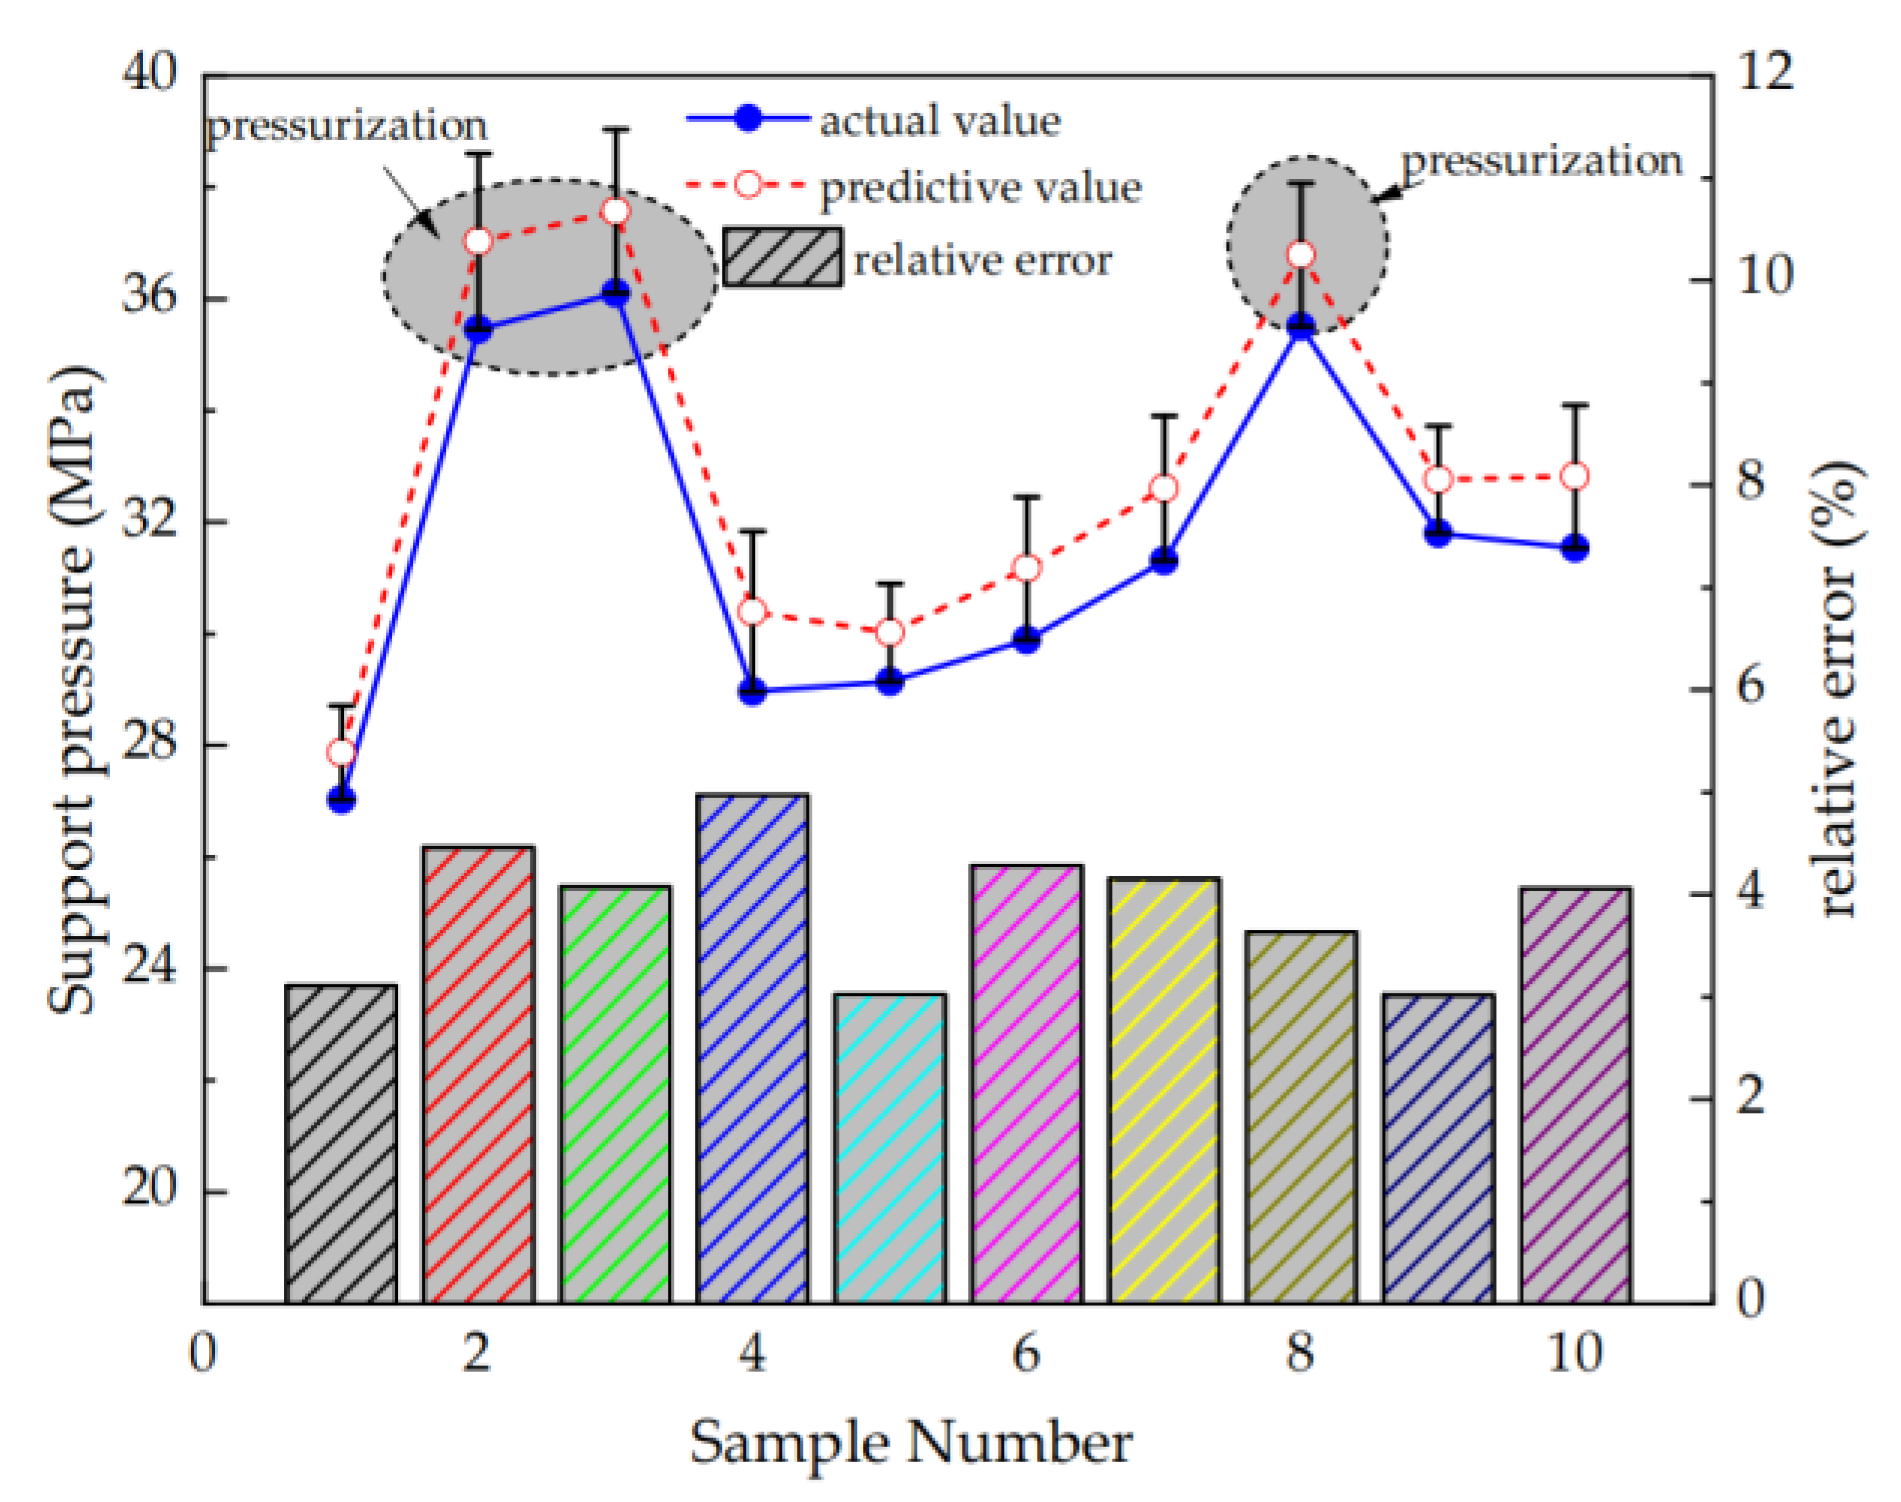
4.4. AdaBoost Neural Network Algorithm Prediction
5. Conclusions
- Based on the coupling model of a support and surrounding rock in a stope, the support inclination and pressure are identified as the research objects of support attitude sensing. In this paper, the FBG tilt sensor and FBG manometer are developed independently. In addition, an FBG sensing monitoring software information platform based on the C/S architecture model is developed.
- A hydraulic support attitude FBG sensing system is constructed and tested on working face 101 of the Longde coal mine. The results show that the top beam inclination of the 3# hydraulic support is maintained within the range of 0.7°~4.2°, and the 3# hydraulic support pressure fluctuates within the range of 8.2 to 39.05 MPa without a warning precursor. The average working resistance of the hydraulic supports varies from 26.16 MPa to 39.76 MPa. During this period, the working resistance value of the hydraulic support does not exceed the warning value, and the hydraulic support is in normal working condition.
- An AdaBoost neural network hydraulic support working resistance prediction model is established using MATLAB. The AdaBoost neural network algorithm successfully predicts the periodic pressure of the coal mining face by training with sample data of the working resistance of the hydraulic support. The results show that the prediction accuracy, judging from the difference between the predicted and actual values, is over 95%.
Author Contributions
Funding
Institutional Review Board Statement
Informed Consent Statement
Data Availability Statement
Acknowledgments
Conflicts of Interest
References
- Wo, X.F.; Li, G.C.; Sun, Y.T.; Li, J.H.; Yang, S.; Hao, H.R. The Changing Tendency and Association Analysis of Intelligent Coal Mines in China: A Policy Text Mining Study. Sustainability 2022, 14, 11650. [Google Scholar] [CrossRef]
- Li, M.; Zhang, X.P.; Mao, S.J.; Liu, Q.S. Study on deep mining safety control decision making system. In Proceedings of the International Conference on Mining Science & Technology, Xuzhou, China, 18–20 January 2009; pp. 377–384. [Google Scholar]
- Wang, G.; Liu, F.; Pang, Y.; Ren, H.; Ma, Y. Coal mine intellectualization: The core technology of high quality development. J. China Coal Soc. 2019, 44, 349–357. [Google Scholar] [CrossRef]
- Li, S.; Ren, H. Research status and development trend of position and posture measurement technology on hydraulic support, scraper conveyor, shearer in fully-mechanized mining face. J. China Coal Soc. 2020, 48, 219 226. [Google Scholar]
- Negi, P.; Chakraborty, T.; Bhalla, S. Viability of electro-mechanical impedance technique for monitoring damage in rocks under cyclic loading. Acta Geotech. 2022, 17, 483–495. [Google Scholar]
- Negi, P.; Chakraborty, T.; Bhalla, S. Damage Monitoring of Dry and Saturated Rocks Using Piezo Transducers. J. Test. Eval. 2017, 45, 169–181. [Google Scholar] [CrossRef]
- Juárez-Ferreras, R.; González-Nicieza, C.; Menéndez-Díaz, A.; Álvarez-Vigil, A.E.; Álvarez-Fernández, M.I. Measurement and analysis of the roof pressure on hydraulic props in longwall. Int. J. Coal Geol. 2008, 75, 49–62. [Google Scholar] [CrossRef]
- Reid, P.B.; Dunn, M.T.; Reid, D.C.; Palston, J.C. Real-world automation: New capabilities for underground longwall mining. In Proceedings of the Australasian Conference on Robotics and Automation, Brisbane, QLD, Australia, 6–8 December 2010. [Google Scholar]
- Barczak, T.M.; Engineer, M. A retrospective assessment of longwall roof support with a focus on challenging accepted roof support concepts and design premises. In Proceedings of the 25th International Conference on Ground Control in Mining, Morgantown, WV, USA, 1–3 August 2006. [Google Scholar]
- Vaze, J.; Jenkins, B.R.; Teng, J.; Tuteja, N.K. Soils fieldwork, analysis, and interpretation to support hydraulic and hydrodynamic modelling in the Murray floodplains. Aust. J. Soil Res. 2010, 48, 295–308. [Google Scholar] [CrossRef]
- Verma, A.K.; Kishore, K.; Chatterjee, S. Prediction model of longwall powered support capacity using field monitored data of a longwall panel and uncertainty-based neural network. Geotech. Geol. Eng. 2016, 34, 2033–2052. [Google Scholar] [CrossRef]
- Ge, X.; Xie, J.C.; Wang, X.W.; Liu, Y.; Shi, H.B. A virtual adjustment method and experimental study of the support attitude of hydraulic support groups in propulsion state. Measurement 2020, 158, 107743. [Google Scholar] [CrossRef]
- Chen, D.F.; Li, S.B. Measurement of coal mining height based on hydraulic support structural angle. J. China Coal Soc. 2016, 41, 788–793. [Google Scholar]
- Wang, Y.F.; Wang, X.W.; Xie, J.C.; Yang, Z.J. Memory attitude monitoring method for hydraulic support based on grey theory. Ind. Mine Autom. 2017, 43, 11–14. [Google Scholar]
- Ren, H.W.; Li, S.S.; Zhao, G.R.; Zhang, K.X.; Du, M.; Zhou, J. Measurement method of support height and roof beam posture angles for working face hydraulic support based on depth vision. J. Min. Saf. Eng. 2022, 39, 72–81. [Google Scholar]
- Wu, Z.X.; Wu, F. Fiber Bragg Grating Sensing Principle and Application, 1st ed.; Nation Defense Industry Press: Beijing, China, 2011; pp. 31–49. [Google Scholar]
- Zhao, C.J. AdaBoost. In Analysis of Machine Learning Electrostatic Algorithm: Based on OpenCV, 1st ed.; Zhang, S., Ed.; Posts & Telecom Press: Beijing, China, 2018; pp. 120–141. [Google Scholar]
- Yan, H.; Zhang, J.X.; Zhou, N.; Li, M. Application of hybrid artificial intelligence model to predict coal strength alteration during CO2 geological sequestration in coal seams. Sci. Total Environ. 2020, 711, 135029. [Google Scholar] [CrossRef] [PubMed]
- Yan, H.; Zhang, J.X.; Zhou, N.; Shi, P.; Dong, X.J. Coal permeability alteration prediction during CO2 geological sequestration in coal seams: A novel hybrid artificial intelligence approach. Geomech. Geophys. Geo-Energy Geo-Resour. 2022, 8, 104. [Google Scholar] [CrossRef]
- Zhang, K.; Li, Y.X.; Feng, L.; Meng, X.J.; Zhong, D.H.; Huang, L.S. Roof deformation characteristics and experimental verification of advanced coupling support system supporting roadway. Energy Sci. Eng. 2022, 10, 2397–2419. [Google Scholar] [CrossRef]
- Liang, M.F.; Fang, X.Q.; Bai, H.L.; Xing, X.P.; Wu, G. Application of temperature compensation fiber Bragg grating pressure sensor for bolting quality monitoring. J. China Coal Soc. 2017, 42, 2826–2833. [Google Scholar]
- Liang, M.F.; Fang, X.Q.; Li, S.; Wu, G.; Ma, M.; Zhang, Y.G. A fiber Bragg grating tilt sensor for posture monitoring of hydraulic supports in coal mine working face. Measurement 2019, 138, 305–313. [Google Scholar] [CrossRef]


| Form Type | Description |
|---|---|
| Logic Control Management Information Table | The FBG sensing information list |
| Correction information list | |
| Alarm information list | |
| Data Type Table | Configuration information table of data correction module |
| Monitoring data of the FBG tilt sensors | |
| Monitoring data of the FBG pressure gauges |
Disclaimer/Publisher’s Note: The statements, opinions and data contained in all publications are solely those of the individual author(s) and contributor(s) and not of MDPI and/or the editor(s). MDPI and/or the editor(s) disclaim responsibility for any injury to people or property resulting from any ideas, methods, instructions or products referred to in the content. |
© 2023 by the authors. Licensee MDPI, Basel, Switzerland. This article is an open access article distributed under the terms and conditions of the Creative Commons Attribution (CC BY) license (https://creativecommons.org/licenses/by/4.0/).
Share and Cite
Chen, N.; Fang, X.; Liang, M.; Xue, X.; Zhang, F.; Wu, G.; Qiao, F. Research on Hydraulic Support Attitude Monitoring Method Merging FBG Sensing Technology and AdaBoost Algorithm. Sustainability 2023, 15, 2239. https://doi.org/10.3390/su15032239
Chen N, Fang X, Liang M, Xue X, Zhang F, Wu G, Qiao F. Research on Hydraulic Support Attitude Monitoring Method Merging FBG Sensing Technology and AdaBoost Algorithm. Sustainability. 2023; 15(3):2239. https://doi.org/10.3390/su15032239
Chicago/Turabian StyleChen, Ningning, Xinqiu Fang, Minfu Liang, Xiaomei Xue, Fan Zhang, Gang Wu, and Fukang Qiao. 2023. "Research on Hydraulic Support Attitude Monitoring Method Merging FBG Sensing Technology and AdaBoost Algorithm" Sustainability 15, no. 3: 2239. https://doi.org/10.3390/su15032239
APA StyleChen, N., Fang, X., Liang, M., Xue, X., Zhang, F., Wu, G., & Qiao, F. (2023). Research on Hydraulic Support Attitude Monitoring Method Merging FBG Sensing Technology and AdaBoost Algorithm. Sustainability, 15(3), 2239. https://doi.org/10.3390/su15032239