1. Introduction
Based on the Global Water Organization, the water crisis is considered as the fifth global risk in terms of impact on our society [
1]. Although it is known that water resources are finite, the global population consumes water at an increasingly high rate. Based on “The World Counts”, 10 billion tons of fresh water worldwide is consumed on a daily basis [
2]. It is of high importance to nudge citizens to consciously consume water and change their consumption behaviors as individual contributors.
Citizens’ behavioral change can be achieved by employing smart metering services that are able to notify about daily consumption patterns. Smart cities can support this approach by improving the monitoring capabilities of the underlying water distribution infrastructure. Smart metering devices able to leverage IoT technology to broadcast metering data can facilitate the transformation and enable real-time household/end-user water consumption metering. In order for smart water meters to be adopted by the market, several challenges arise from multiple perspectives such as integration, interoperability, autonomy, maintenance, etc. A preliminary study by the European Commission was conducted on “deploying full water metering at the household/final user level” [
3]. The research findings conclude that quality improvements in the consumption data to raise the awareness and the behavior of consumers are quite impactful despite the high cost of the initial capital investment. Smart water metering can enable a reasonable consumption of water by informing users about their daily water usage. From another perspective, water distribution companies and public entities can identify the fluctuation of water consumption during the day and plan frequent maintenance of the distribution network of a given area [
4,
5,
6]. It is undeniable that the current water distribution infrastructure is old and prone to leakages, oxidation and other malfunctions. Therefore, consistent monitoring is required to identify leakages based on consumption patterns. Predictive maintenance or replacement of pipes can be implemented using integrating water quality (WQ) metering units that are able to detect changes [
7].
As IoT technology is becoming more prominent, highly scalable robust systems and platforms are being developed to accommodate the constant increase of IoT devices. Nonetheless, limited applications in the water distribution system have been applied [
8]. This can be attributed mainly to the fact that the water distribution systems and networks were engineered several decades ago, making interventions and expansions extremely difficult, especially in urban areas where direct access to infrastructure is limited. On the other hand, expanding the current infrastructure demands in-depth research by several authorities for interdisciplinary integration.
Quality improvements of the water consumption levels can be implemented in residential areas by informing consumers about their behavioral patterns and introducing incentives for optimal consumption. Public spaces such as malls, businesses and public bodies can have little to no impact on the behavioral aspects of consumption apart from the monitoring process.
Integrating smart water metering systems in residential areas or in whole districts cannot only lay the foundations of smart living but can incentivize consumers to change their consumption behaviors. Moreover, the strategic deployment of smart sensors into main distribution water networks can mitigate leakages and infrastructure failures.
Although IoT is considered a cornerstone in internet communication technology, smart cities face challenges from an interoperability and heterogeneity point of view. Smart cities are considered a multi-ecosystem system that enables ubiquitous access to services and platforms [
9]. An ever-increasing number of IoT protocols and smart sensors drive smart cities with several compatibility challenges; different types of raw data and formats hinder the establishment of a standardized communication interface for cross-ecosystem applications. Extensive post-processing is needed for such cases by annotating them at the source or at an early stage. Wireless communication technology, on the other hand, strives to introduce communication protocols that facilitate interoperability and promote ad-hoc behavior. Based on [
10], Low-Power Wide-Area Networks (LPWANs) are considered ideal for long-range communication and low-energy consumption in smart city applications.
Over the decades, the metering process has shifted to a real-time enabled service from a human-labor procedure. In the past, specialized personnel had to manually download the meter’s log data by examining each device on-site at the point of installation. This process was error-prone since human intervention proliferated the probability of failure [
11]. To improve the overall system performance, AMR devices were introduced as a more sustainable option. A one-way communication from the meter to the utility was employed, transforming the water metering process while avoiding human labor [
12]. Nowadays, AMR metering devices can measure the consumption of water in real-time, inform about the status of the device and obtain troubleshoot information. The consumers’ data are then sent to a water utility provider for billing purposes [
13,
14].
Although projects for real-time energy consumption have been at the forefront of the research community, water consumption and quality-monitoring state-of-the-art systems that require transformative approaches are underdeveloped. Smart cities can benefit from real-time information about the distribution of water, such that immediate observation for contamination scenarios and other hazards is efficable. Public authorities can respond immediately and stop the water supply to minimize water losses. During this period, citizens in a given area will be informed about the contamination and how it is being handled. However, event-driven smart cities require constant data accumulation from multiple sources that enable smart decision-making even in crisis situations.
Under a funded research project, a thorough study on transforming water distribution networks is being conducted. Specifically, an IoT system was developed and tested as a pilot case. The research project aims to develop a quantitative and qualitative smart water metering system that can be deployed as a plug-and-play, market-ready solution. The system exploits LoRaWAN as the transmission protocol for enabling real-time data, while machine learning is used for water disaggregation purposes. The transformation of the water distribution infrastructure with flowmeters and water quality units (WQ) facilitates the potential creation of a new market that can sustain new business ideas with contemporary monetization schemes based on service-oriented models.
In this article, the objective is to introduce a novel modular IoT-ready water metering solution that is capable of constantly monitoring the consumption and the water quality of distributed water. Specifically, the fundamental contribution of the presented IoT system has been the adoption of a highly modular system that is cost-effective and manages to address the underlying real-time monitoring gap from water utility companies. Not only does the system include water consumption functionality, but it explores a novel hybrid architecture for water quality monitoring that drastically reduces the high initial investment and maintenance costs. This sustainable solution of deploying water quality sensors in highly populated areas where information can be shared across all households is the critical takeaway of this solution. Finally, the proposed solution explores and demonstrates the potential applicability of water disaggregation techniques for identifying connected appliances and forecasts water quality fluctuations.
The remainder of the paper is structured as follows: A short literature review is presented in
Section 2.
Section 3 presents the IoT water system with a high-level architecture and the underlying subsystems.
Section 4 contains all of the details about the sensors used in the research study. In
Section 5, a brief presentation of the developed web interface for monitoring purposes is presented.
Section 6 describes the impact of the proposed system from a social, environmental and economic standpoint. In
Section 7, the limitations of the proposed system are presented along with the future directions. Finally,
Section 8 concludes the paper.
2. Literature Review
A narrow literature survey of previously published surveys and review studies on smart metering technologies is presented in this section. The research background is mainly focused on the smart water metering deployments and test trials that are relative to the presented novel IoT solution. However, smart metering in the energy domain uses similar technologies; therefore, several published papers and surveys are included.
It should be noted that water is considered much cheaper than other commodities (e.g., gas, electricity), which results in considerably fewer investments and efforts in the market. Nevertheless, digital transformation in the water infrastructure is mandatory and demands similar attention to the Smart Grid to enable real-time water consumption. Distribution System Operators (DSOs), or water distribution providers, are responsible for the deployment of smart metering devices in households. In a substantial number of cases, water meters are located underground and/or difficult to access areas (protected areas), which makes the deployment efforts risky. Additionally, such places do not have direct access to electricity for safety reasons, which in turn requires smart devices to operate on batteries. Energy efficiency is of high importance when designing smart meters, which drives the high cost of development and manufacturing. Considering the above information, the reduction of available water on a global scale along with population growth presents the need for technologically innovative solutions that can address this gap and transform smart city infrastructures [
15,
16].
2.1. Smart Water Meters
Smart water meters are a contemporary practice that is constantly being adopted by the market. The first smart meters that were deployed used short-range wireless communication protocols such as Wireless M-Bus to broadcast data. The devices were designed as a Remote Meter-Reading (RMR) system, where operators were handed a specialized portable device that collected data when the operator was in the proximity of the smart meter [
17]. This initial approach was far from novel by today’s standards since constant monitoring was required by operators to aggregate information about consumption. Although RMR systems removed the physical access or the visual inspection of smart meters, they did not facilitate the mandatory technological equipment to provide real-time information gathering and transmission.
In recent years, smart meters are equipped with LoRa and LoRaWAN modules that enable wireless broadcasting of consumption. Given the fact that smart meters operate on batteries, a low-power long-range wireless protocol is required to enable real-time readings without compromising the longevity of the device. Moreover, LoRa has been tested in urban and extra-urban environments that showcase the capabilities of the technology [
18,
19]. A considerable amount of research has been conducted to evaluate LoRa in high loads and cumulative interference effects, which concluded that LoRa operates stably under stress [
18]. The next generation of smart meters was designed for Automatic Meter Reading (AMR) systems, where data are collected fully autonomously and periodically transmit the consumption information to nearby gateways. Gateways are the initial data relay layer that accumulates data and relays them to the corresponding utility management by leveraging mostly mobile communication networks (3G, 4G, LTE). Additionally, smart meters encrypt data before transmission to ensure end-to-end security. The information flow of AMR systems is from the consumer’s smart meter to a gateway and lastly to the utility database, which manually bills each consumer based on their consumption.
Advanced Meter Infrastructure (AMI) was introduced to enable bi-directional communication between utilities and consumers [
20]. This approach enables consumers to get informed in real-time about their consumption habits and the respective billing. AMI also facilitates auto-billing and tariffs based on demand, while utilizing customer usage, device information and theft detection [
21]. Different area networks take place in AMI systems such as Home Area Network (HAN) between the consumer and the smart meter, Field Area Network (FAN) or Neighborhood Area Network (NAN) between smart meters and gateways/routers and Wide Area Network (WAN) from gateways and routers to utility databases and management systems that perform real-time inspection and billing.
With this regard, wireless communication protocols in IoT are considered a compelling enabler for smart metering applications. Specifically, LoRa is increasingly being adopted by original equipment manufacturers (OEMs) of smart water meters [
22] due to the low cost of components and the open standard aspect. Similar communication technologies that leverage low power consumption and can achieve long-range communication are the Narrow-Band Internet of Things (NB-IoT) and Sigfox [
23].
Smart water metering capabilities can facilitate improved customer engagement by presenting consumption analytics that can result in behavioral changes (e.g., reduction of water bills) that ultimately lead to better water conservation [
24].
2.2. Smart Water Quality Meters
Little research has been conducted on the integration of quality metering devices on the water distribution network. Most of the testing and proofs-of-concept have been conducted in large tanks or water sources that are not able to provide adequate information about the quality and status of the distribution pipes. Vijayakumar et al. propose a real-time quality system that is implemented on a Raspberry Pi board, which that is able to connect to a Wi-Fi network to transmit data [
25]. Although this solution demonstrates the capabilities of measuring water quality parameters, it is relatively limited from the implementation aspect in large-scale adoption.
On the other hand, Daigavane et al. employed an Arduino UNO board connected with turbidity, PH and temperature sensors that can take advantage of the existing GSM network to broadcast data [
26]. Nevertheless, this implementation does not address the battery autonomy factor, which is critical for similar applications.
A similar pilot test implementation was conducted on a river where an Arduino UNO was integrated to connect a PH, turbidity, temperature and flow sensor and transmit them via WIFI using an ESP8266 Wi-Fi module [
27]. The main reason the authors opted for a Wi-Fi module is the transmission of the data to a PC that conducts analysis and displays each sensor measurement on a scale. Even though the implementation was performed with fewer quality sensors and in water that is constantly moving in a specific direction, several key takeaways can be made. Flowing water is considered a substantial similarity to the presented novel IoT system, which degrades the employed sensors in use.
Relative to the previous implementations, Kamaludin et al. demonstrate the use of a Radio Frequency Identification system and a Wireless Sensor Network (WSN) platform that measures PH values and transmits them [
28]. However, the implementation is limited since the test was executed in a campus area of the University Sains Malaysia (USM). A user-friendly mobile device was developed to present the accumulated data.
A similar implementation to the proposed IoT monitoring system is presented by Wu et al., where the quality sensors were placed on an Unmanned Surface Vehicle (USV) [
29]. The USV navigates inside Dardanelle Lake and measures the differentiation of water quality in several geographic positions. The data are transmitted via LoRaWAN and the visualization and storage are handled on a cloud. Although there is a substantial overlap between the USV’s solution and the proposed system, it must be noted that gateway coverage in lakes is inadequate compared to cities or rural areas. However, this project highlights the use of such solutions to monitor stationary water infrequently rather than on a day-to-day approach.
Ngom et al. present a LoRa-based quality measurement station that accumulates data from stationary water in a botanical garden pool [
30]. The selection of quality sensors is similar to the proposed solution, which highlights the importance of the complete quality parameters to conduct the quality assessment.
On the other hand, Simitha et al. present a low-cost implementation of a quality metering device and a LoRaWAN gateway that is connected to an ESP32 for visualization purposes [
31].
Lastly, Manoharan et al. demonstrate the use of smart metering and quality metering solutions in smart villages [
32]. The authors leverage LoRaWAN as the medium of broadcasting data from each deployed device and state that smart metering can be done on the household level, which can improve the consumption accuracy and drive better billing.
Based on the presented research literature, it is obvious that most of the implementations were performed on stationary water, which although is an informative solution for specific needs is far from applicable in real-world use cases. Additionally, a handful of smart metering and quality monitoring implementations were conducted by leveraging other IoT protocols rather than LoRa, which significantly changes the sustainability scope of the solution.
It must be noted that the calibration of the quality sensors during the deployment or in regular intervals has not been addressed by the previously mentioned use cases. Having considered the degradation of the quality sensors, the proposed novel solution highlights the importance of calibrating the quality sensors with high-accuracy reference equipment. This approach proves that the presented solution has been thoroughly investigated and researched. The overarching objective of the proposed solution is to deploy and test a real-world scenario for quantitative and qualitative monitoring of water in realistic environmental conditions, thus proving the applicability of LoRaWAN as a stable solution for smart metering.
3. Advanced Water System Infrastructure
As smart cities continue to attract more citizens and businesses, the underlying water infrastructure is constantly being challenged and pushed to its limits. Increased load (consumption) during specific time windows is observed on a day-to-day basis that requires specialized handling for optimal uptime operation [
33,
34,
35]. Whether it is water or electricity consumption, smart infrastructure can operate autonomously based on the load and the current circumstances. It is undeniably critical for such infrastructures to operate stably and adjust autonomously based on certain predefined criteria. This can be achieved by feeding a large amount of collected data into training machine learning models that can digitally transform smart cities into intelligent cities. Self-regulated operations that are based on the output of ML models can provide the initiative for future cities to interoperate with sub-ecosystems and drive decisions autonomously. For such cases to be realized, the underlying infrastructure requires drastic changes and upgrades.
IoT is considered the cornerstone of digital transformation, which bridges the communication gap between end devices with cloud applications [
36]. To this end, water infrastructure can adopt IoT as the core technology that enables smart metering capabilities in residential, rural or industrial areas. Smart water metering can be employed either on a large scale that accommodates groups of consumers in residential areas or domestic usage (per household). Different benefits arise from either option.
In the case of water monitoring in a large area (e.g., municipality block), water consumption readings cannot provide considerable benefits. This is because data are being accumulated by multiple households and consumer profiling cannot be achieved. Water utility companies thereafter are unable to identify the consumption of each household and bill accordingly. WQ monitoring on a central water distribution pipe can benefit all supplied households with real-time quality information. Moreover, this mass-coverage option can also reduce the deployment and adoption cost of quality monitoring; therefore reducing the number of quality sensors required.
The other option, which is monitoring water consumption and quality at a household level, presents several benefits. Information about the individual consumer’s consumption can be achieved, which enables water providers to perform water disaggregation, identify consumption patterns and behaviors, categorize consumers based on profiling characteristics and bill accordingly. However, deploying a WQ unit in each household increases the cost immensely due to the periodic sensor replacement. This is mainly because WQ sensors deteriorate based on usage, affecting the measuring accuracy [
36]. OEMs specifically state that sensors last roughly 1 year with everyday use, which inevitably drives the maintenance cost upward [
37].
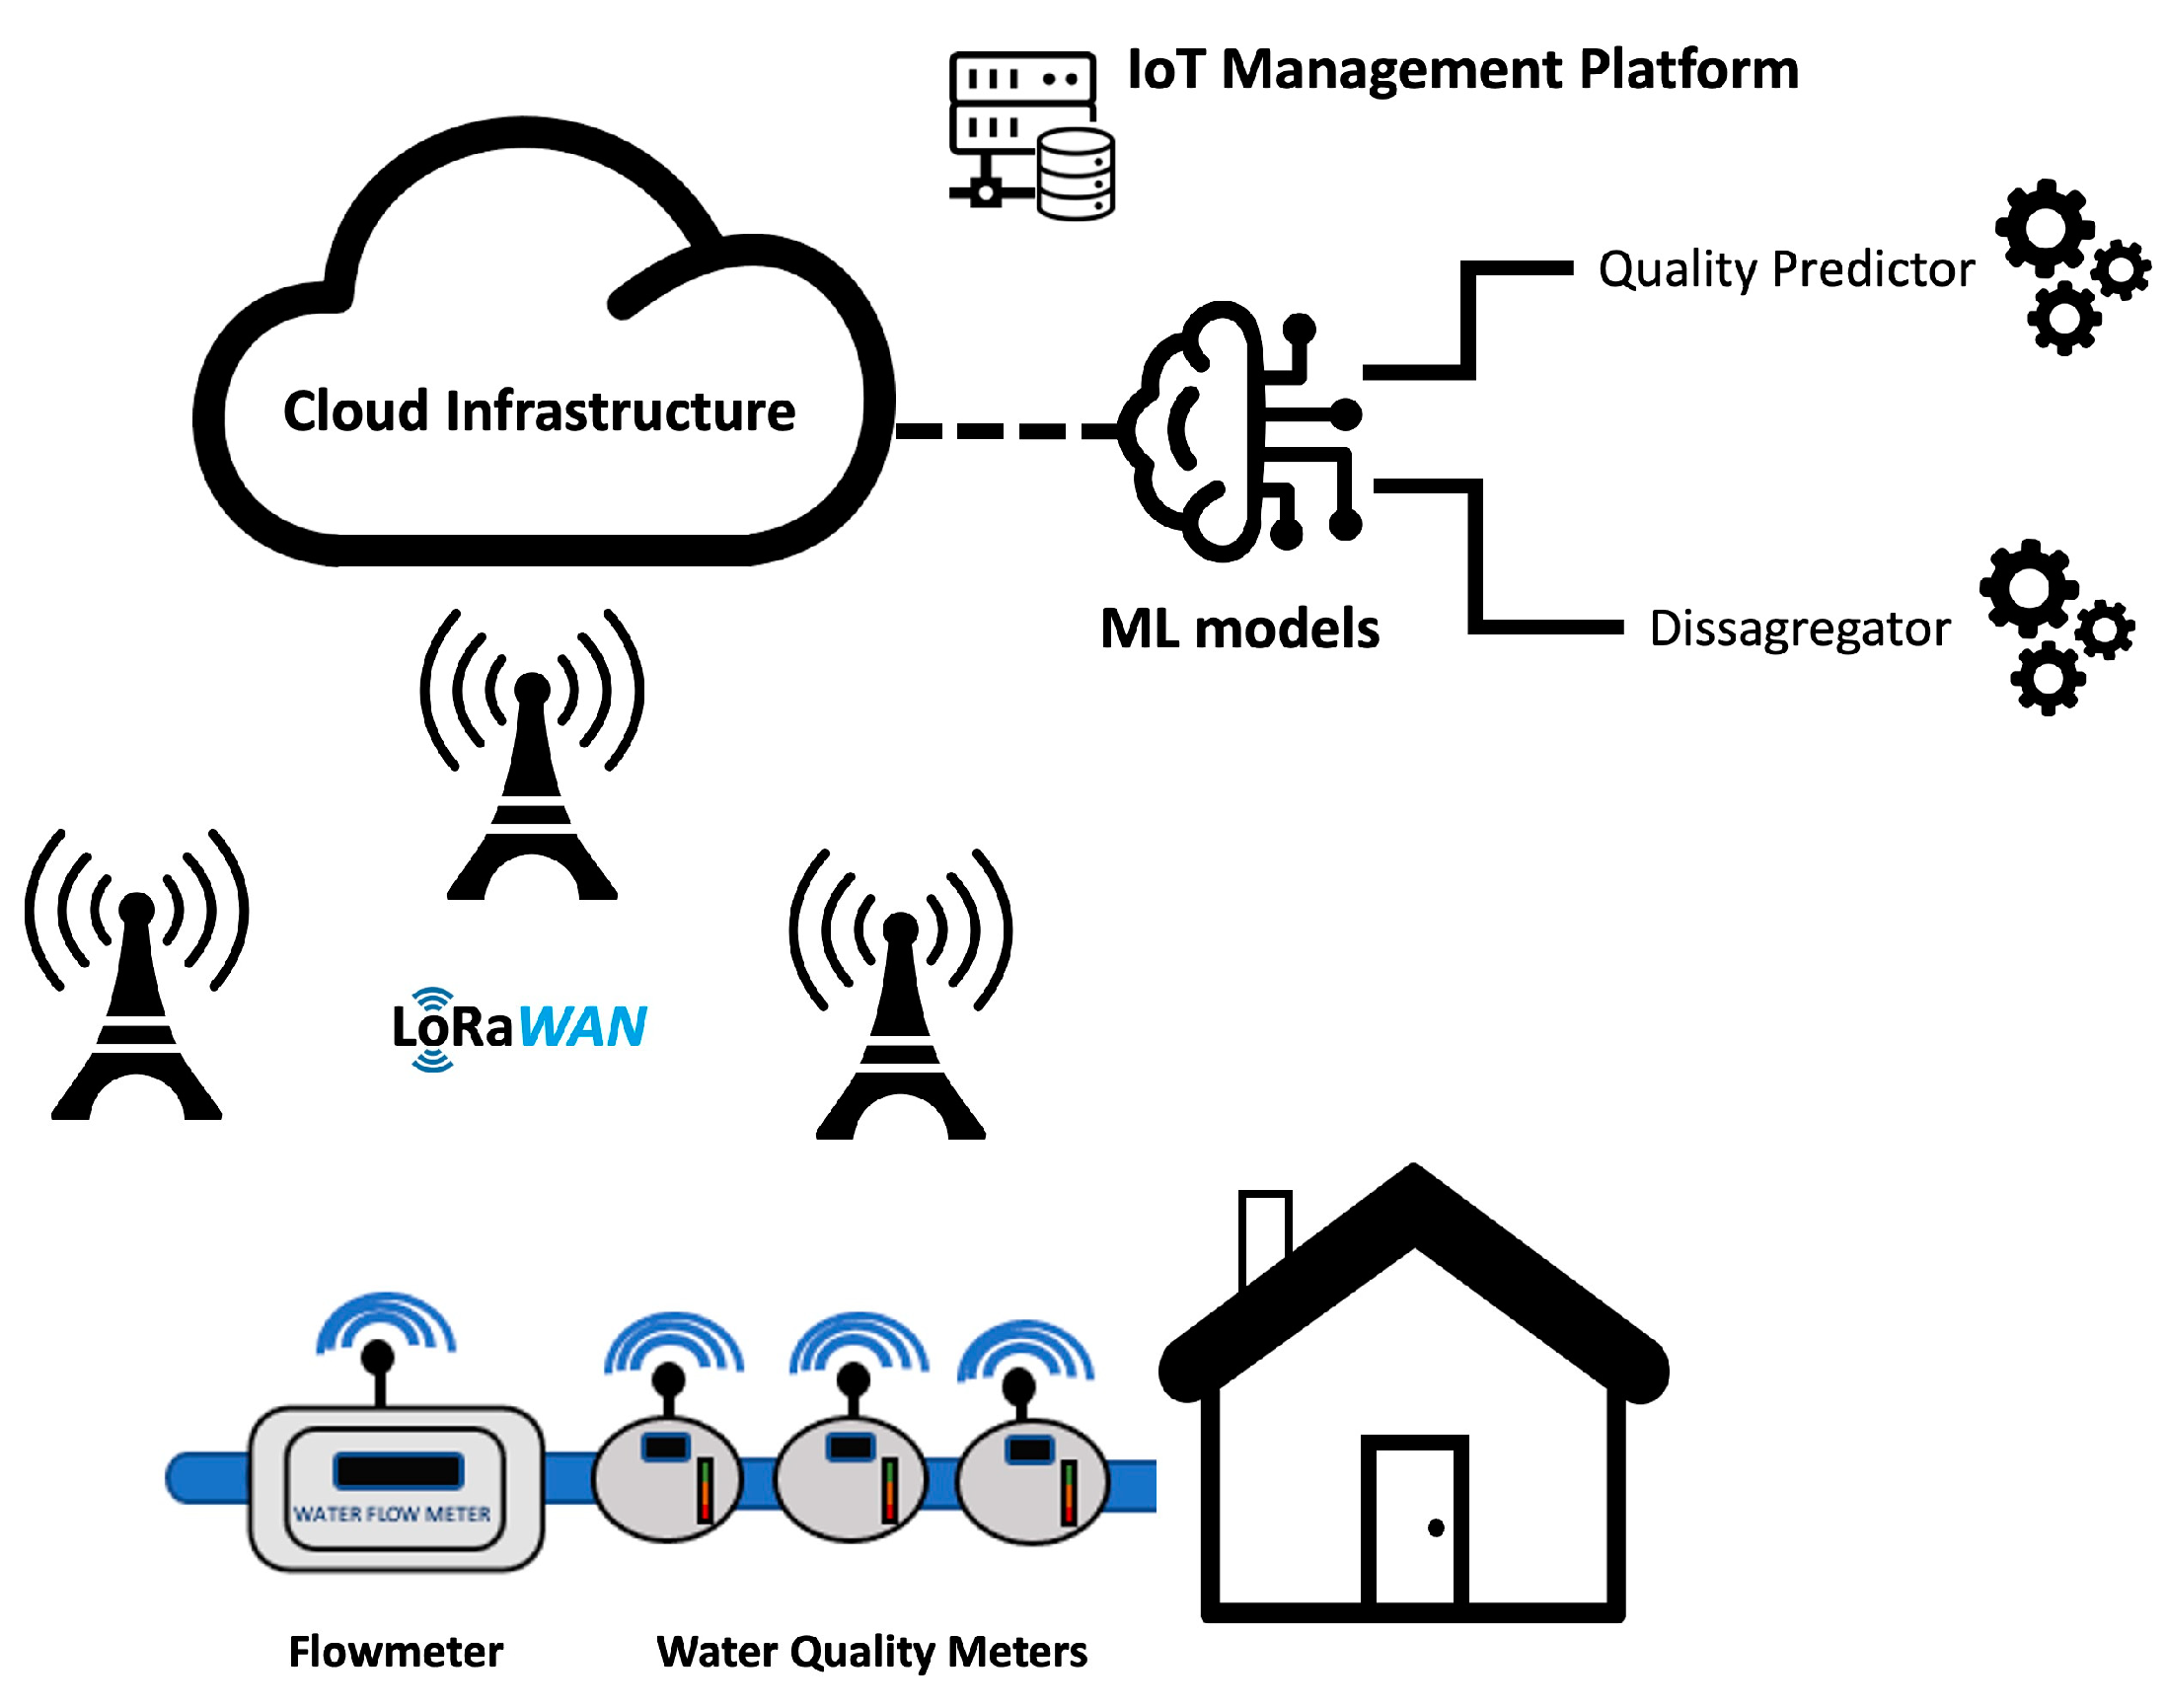
For water disaggregation to be both effective with a reduced number of quality units, a hybrid solution can be applied as shown in
Figure 1. As seen, a WQ unit can be deployed on a central water distribution pipe with flowmeters at each household. The benefits of the hybrid solution outweigh the drawbacks mentioned above, making it an attractive solution. Water utility providers can be informed about the quality of the distributed water in a manageable way since multiple households are supplied from similar water pipes. Meanwhile, household-specific quantitative measuring can be implemented, which can enable billing strategies based on consumer profiling.
3.1. Architecture
Although the hybrid approach is considered a cost-effective and sustainable solution for mass deployment, during the pilot project the system was designed for individual households. The main reason was to identify the amount of data generated on a day-to-day period in a single household. The data were used for feeding water disaggregation ML models, which required constant feedback optimization when configuring the transmitted payloads. It must be noted that little modifications are required to obtain a transition into the hybrid solution.
The architecture of the system, as depicted in
Figure 2, is comprised of five separate subsystems, each responsible for a specific operation. The first is the flowmeter, which measures water consumption. The second is the WQ unit that integrates multiple water quality sensors with a LoRaWAN module for transmitting data. LoRaWAN is considered the third subsystem that acts as a medium for broadcasting data over long distances. The fourth is the cloud infrastructure that handles the incoming data relayed from LoRaWAN gateways (GWs) into an IoT management platform. The fifth subsystem is the machine learning models that have been trained on past data and can: (a) predict future consumption or possible changes in the quality of the water, and (b) disaggregate the total water consumption of a specific period into specific activities/appliances in each household.
3.2. Subsystems
As mentioned in the previous section, the proposed system is comprised of multiple subsystems, each responsible for specific operations. A detailed description of each system is presented in this section, highlighting the internal operations and functionalities.
3.2.1. Flowmeter
During the course of the research project, a common mechanical flowmeter was purchased. Several components were added to transform it into a smart device that can measure and transmit data. A digital encoder was integrated into the enclosed turbine, enabling digital reading of the rotational velocity. An ARM Cortex MCU was selected after thorough market research. The attributes, which influenced the selection of the STM32L073XX MCU, were mainly the energy consumption footprint, the connectivity as well as the compatibility with the LoRaWAN Module. The SX1276 LoRaWAN module was integrated with a LoRa Core antenna for LoRaWAN exploitation. The device operates with an integrated battery system, extending the lifetime based on the operation period (indicatively 5 years). The type of data transmitted over LoRaWAN are:
In case of any alert, the device owner and the water utility provider are informed with instant notification about events such as:
3.2.2. Water Quality Unit
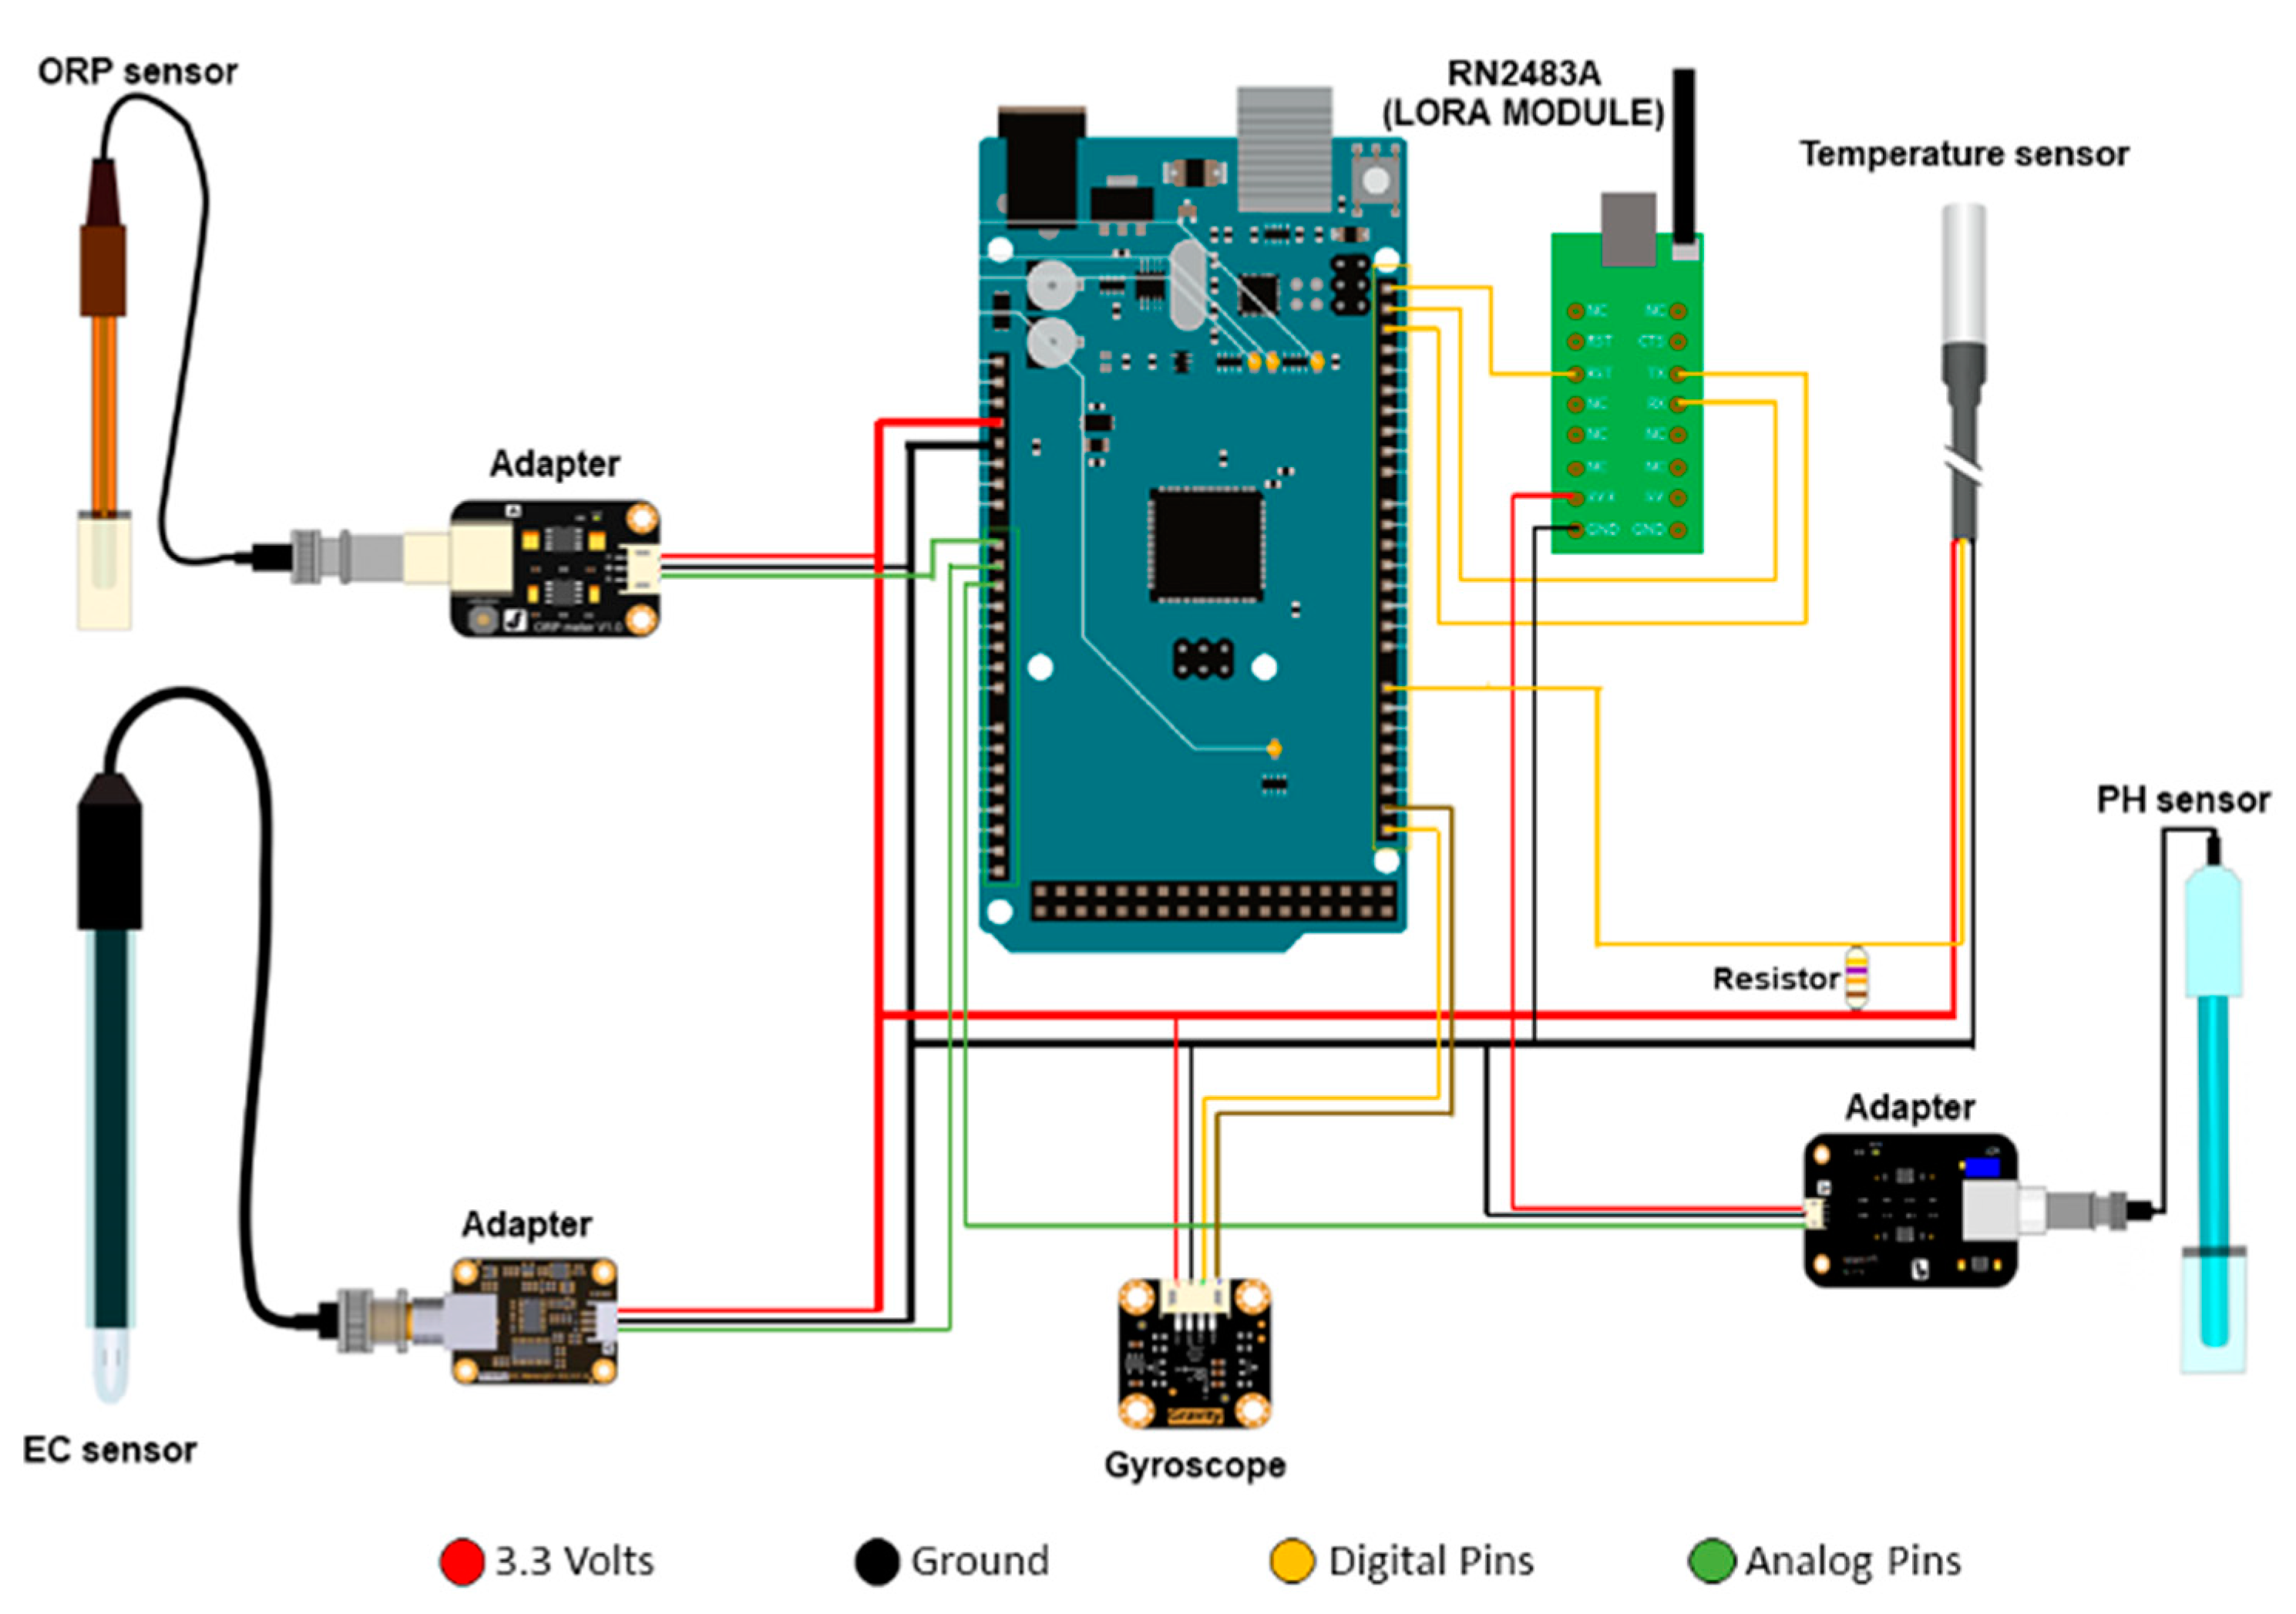
WQ is a property that needs specialized equipment for measuring water parameters. Therefore, the research team conducted exhaustive market research for smart and cost-effective sensors, that can integrate with an Arduino Mega MCU for a proof-of-concept working demo. Moreover, the literature survey provided directions for choosing the critical sensors for measuring the quality of the water. For the proof-of-concept, an Arduino Mega 2560 Rev3 was selected for the requirements of the system with an additional dedicated shield (Gravity IO) that rewires the pin layout, enabling easy sensor integration. The selected sensors are connected to a predefined digital input pin that handles the measuring of each quality property. Each sensor accumulates data at different intervals based on the manufacturer’s specifications. Data are pre-processed to ensure the validity of the measurement. A payload with all of the sensor readings is constructed and broadcasted via a LoRaWAN-enabled module. The selected module (RN2483A) integrates the entire LoRaWAN stack from the PHY layer up to the MAC layer. More importantly, it is certified based on LoRaWAN 1.0.1 specification and supports Class A and Class C applications.
Figure 3 presents all of the used sensors for measuring the quality of the water, the Arduino Mega and the RN2483A. However, the IO shield is omitted inside
Figure 3 for clarity and to avoid the reader’s confusion about pins rewiring.
3.2.3. LoRa and LoRaWAN
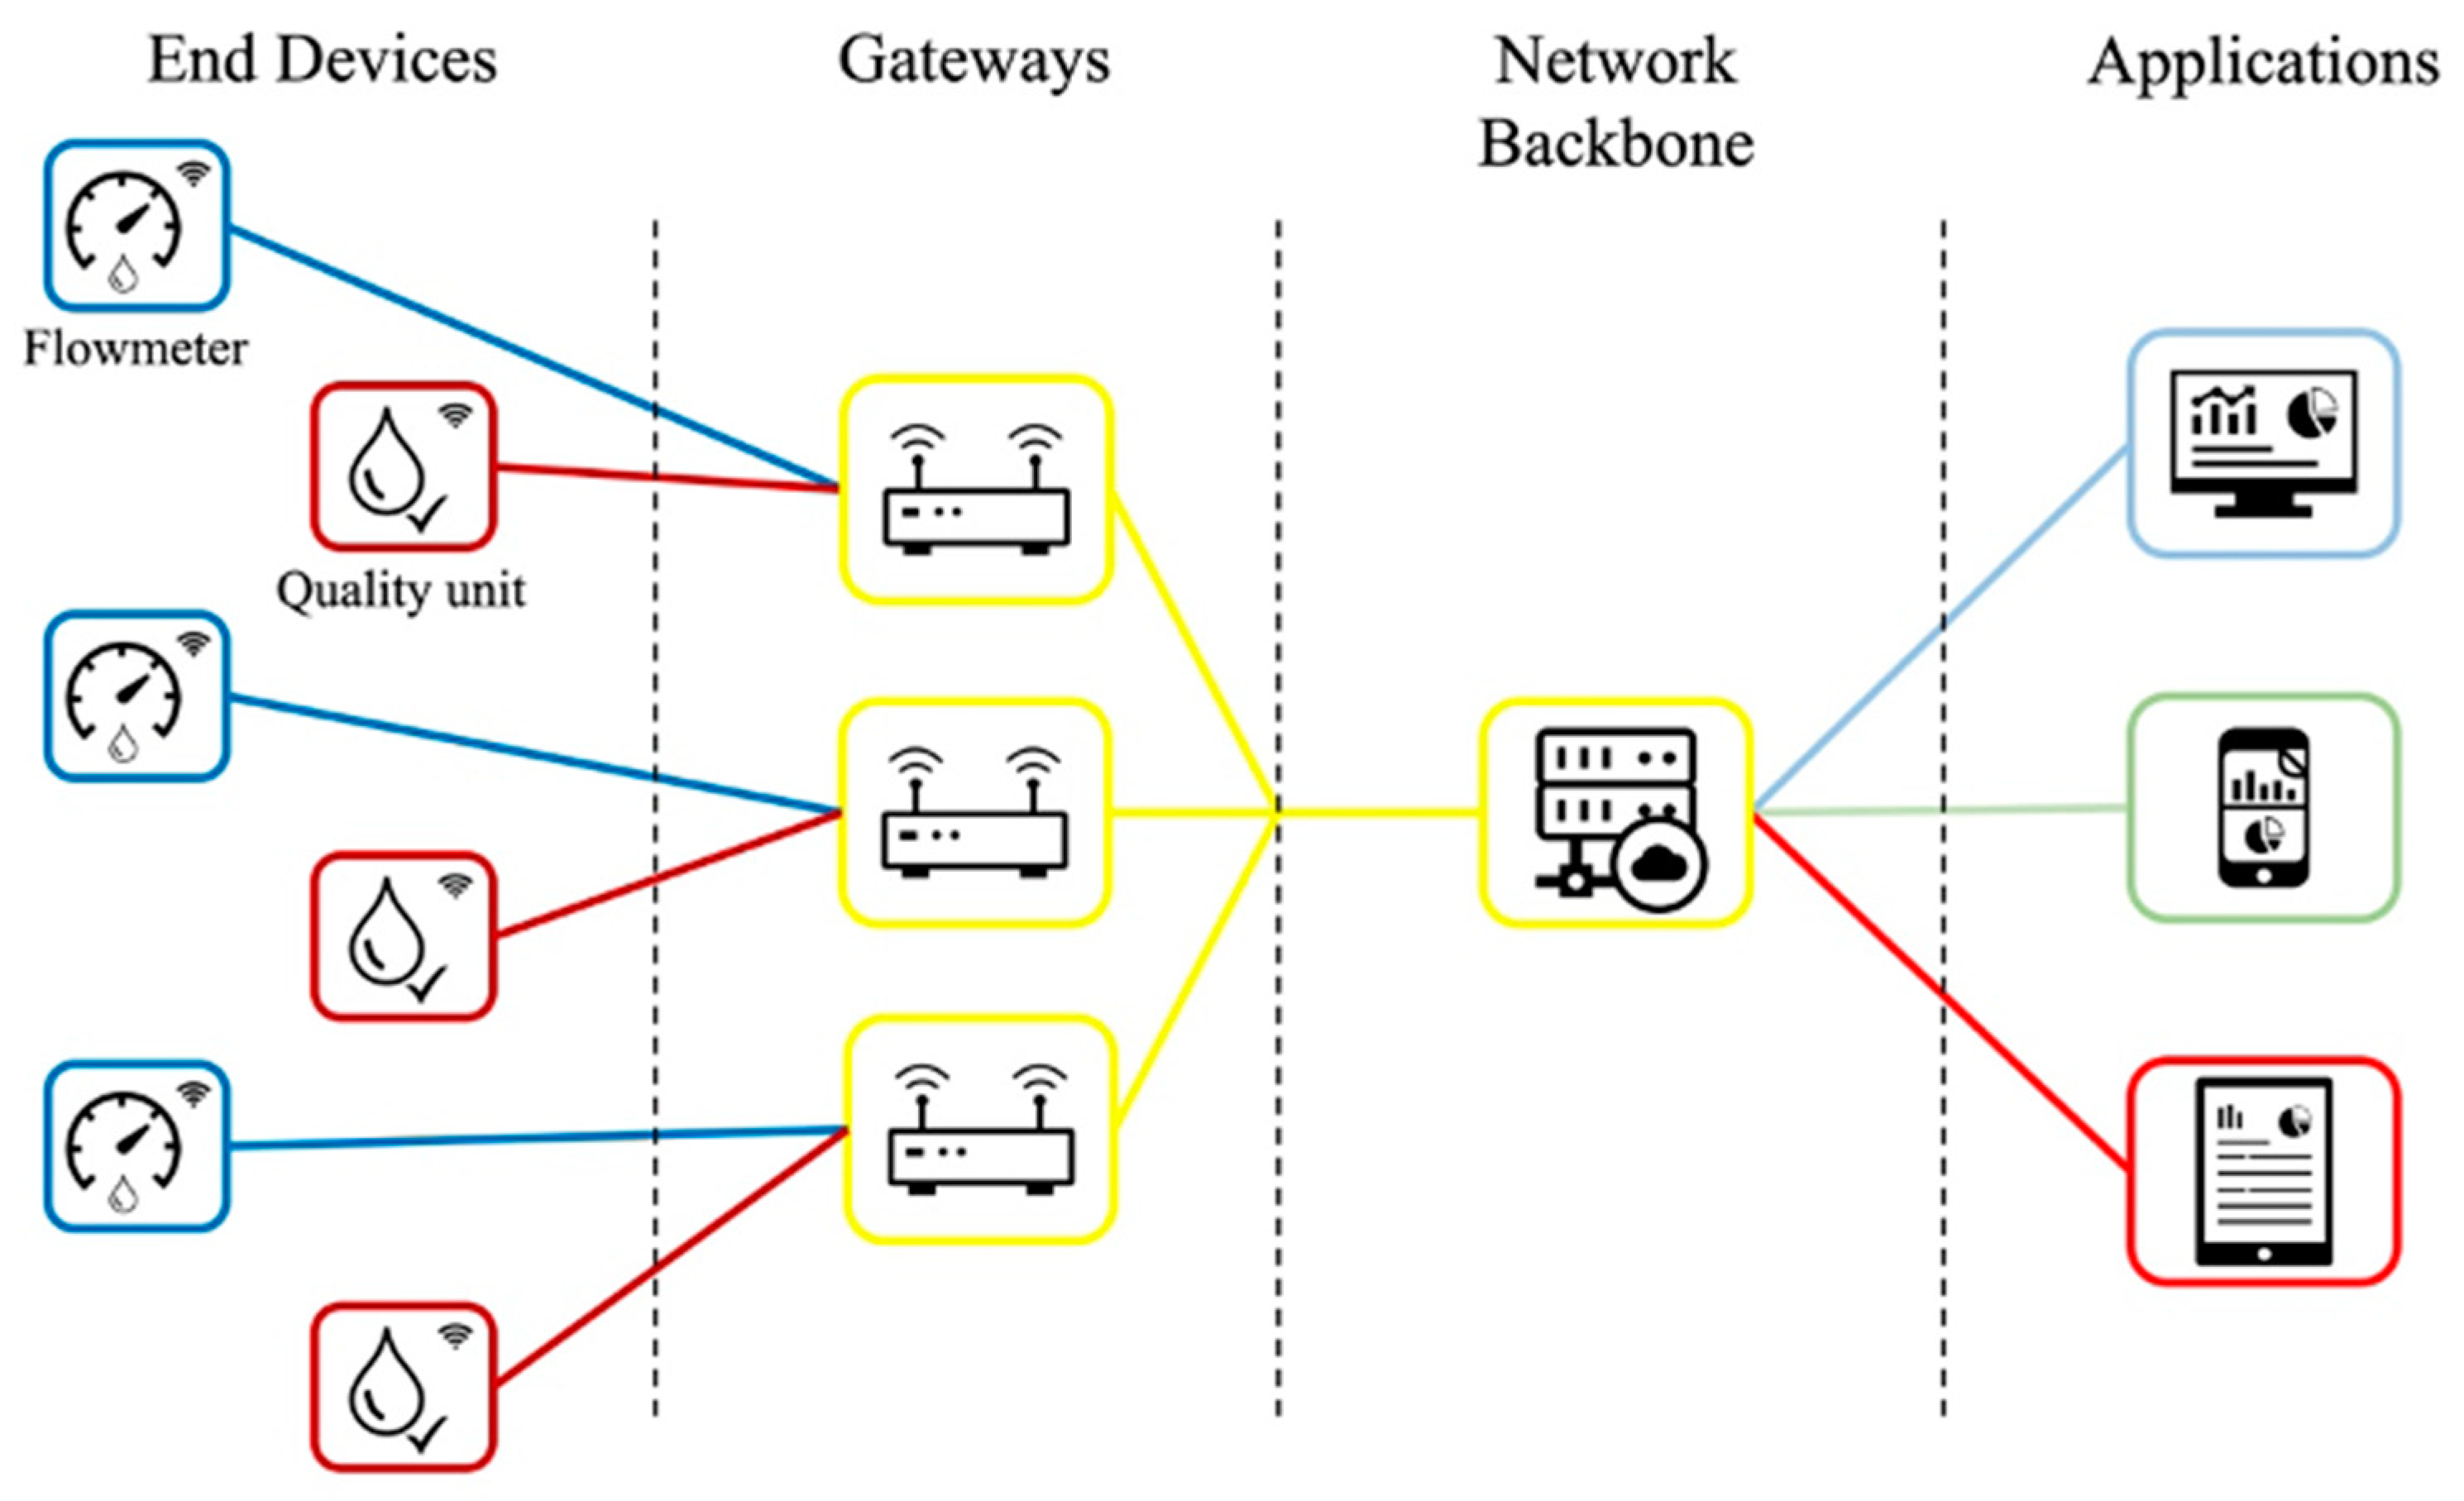
LoRa is based on Radio Frequency modulation that enables devices to transmit data over an unlicensed spectrum. LoRaWAN, on the other hand, is a MAC layer that acts as the coordinator of the medium. The LoRaWAN network is considered a star-of-stars topology that comprises multiple end devices and gateways. In the LoRaWAN network, as shown in
Figure 4, end devices are used for measuring and transmitting data to gateways (GWs) that relay the data between the end devices and the network backbone hosted on the cloud.
In detail, the communication between the end devices and GWs is performed over the wireless channel, utilizing the LoRa physical layer, whilst the connection between GWs and central servers is handled solely over a backbone IP-based network. In detail:
End Devices in most cases, are paired with smart sensors that monitor changes and fluctuations in the monitoring environment. They are responsible for transmitting data directly to nearby GWs within a given range [
38].
Gateways are solely to provide an intermediate connection point between end devices and the network server. GWs relay messages between end devices and network backbone servers using IP [
10].
Network backbone is cloud-based platforms such as The Things Network (TTN), which were selected for testing the proposed solution. The purpose of the network backbone is to connect GWs that receive data packets and ultimately route the data to the relevant application. It must be noted that network backbone servers can either receive data known as an uplink (i.e., sensor to application) or transmit data downlink (i.e., application to the sensor).
Applications are the last layer of LoRaWAN that typically integrate multiple end devices, which transmit data into a central IoT platform for visualization and analytics.
The security of LoRaWAN is a primary concern for any application. In detail, LoRaWAN utilizes two layers for ensuring security across the entire IoT stack, from end device to application. The network security ensures the authenticity of the employed node inside the network, while the application security ensures that the network operator (in our case TTN) does not have any access to the user’s application data [
39]. LoRaWAN specification defines two layers of cryptography that handles the security:
A 128-bit Network Session Key (NwkSKey) that is shared between end devices and the network backbone server;
A 128-bit Application Session Key (AppSKey) is shared within the entire stack end-to-end (e.g., end device to application).
To ensure that data cannot be decrypted during each layer, LoRaWAN encrypts data twice; sensor data are encrypted by the end device, and afterwards, data are encrypted again by the LoRaWAN protocol before they are transmitted to the GWs. Once data reach a network backbone server, data are decrypted by the NwkSKey and are passed to the application server, which in turn decrypts the sensor data using the AppSKey. It is important to note that since GWs receive data from multiple end devices in the vicinity, the LoRaWAN encryption ensures that LoRa GWs are unable to decrypt data before relaying them to network backbone servers. During the project, the flowmeter and the WQ unit encrypt data individually. This reduced the re-engineering stage of the devices when the hybrid architecture will be implemented in the future.
Given that the end devices are deployed in Greece, each device follows the respective regulatory considerations of LoRa specifications and operates at a frequency of 868 MHz. Both end devices are configured with different data rates and channel selections for ensuring the transmission of each payload [
10]. However, based on research, LoRa modulation is susceptible to interferences from the surrounding environment. Specifically, it can withstand interferences of power levels up to 30% with >6 dB sensitivity degradation [
40]. Therefore, the positioning of the devices in the field should be considered carefully to ensure uninterrupted operation.
3.2.4. Cloud Infrastructure
Based on the previous architecture, the IoT cloud application and the machine learning subsystems reside in the cloud. This is because cloud hosting provides high computing power, which benefits data storage and ML training. The network backbone server that was tested and used during the research project was The Things Network IoT (TTN) platform, an open-source community-driven platform that provides frictionless LoRaWAN project development. TTN is hosted on the cloud and acts as an intermediate layer for relaying data accumulated by end devices. The data from both the flowmeter and the WQ unit are handled separately in the context of TTN since different payload formats are employed. Each payload received by TTN is passed through a payload formatter to ensure that the data are decomposed to a human-readable format.
During the development of the project, the research team extensively utilized TTN’s IoT platform for LoRaWAN connectivity. TTN provides a user-friendly application for registering LoRaWAN end devices and GWs. TTN acts as an intermediate layer for relaying the end device’s data to a specific platform. In other words, data are generated by the end devices and they are transmitted via LoRaWAN. GWs capture the broadcasted data and relay them to a cloud IoT platform. Additionally, TTN provides connectivity adapters known as “Integrations” (APIs, Webhooks, MQTT, etc.) that forward incoming data to external platforms.
Lastly, data are stored in a time-series database optimized for IoT real-time data and seamless access for retrieval. This removes the formatting overhead in storing the date in SQL or NoSQL databases.
3.2.5. Machine Learning and AI
The system is equipped with two ML models that were trained using history data containing: (a) the consumption of specific activities (e.g., bathing, washing dishes, etc.) or appliances (clothes or dishwashers), (b) the total consumption of the household and (c) water quality measurements (e.g., pH, hardness) over time.
The first model is a quality predictor that provides users with information regarding near or distant future changes in the quality of the water. This information can be very useful for household owners in order to take actions, such as filtering the tap water and for water providing companies in order to check the distribution network for possible leaks or damages. The model was trained using the DAID dataset containing around 17 million household measurements, one measurement over an hour, in the area of Alicante in Spain. The dataset was preprocessed using various techniques in order to clear erroneous data, align the timeseries and fill missing values using linear regression. Various models were trained using state-of-the-art algorithms such as ARIMA, Theta, Multiple Aggregation Prediction Algorithm (MAPA) and a neural network based on Multilayer Perceptron (MLP). The models were further improved using a specialized Time-Step Boosting technique. The models were tested on unknown datasets and the mean absolute percentage error (MAPE) was recorded.
Table 1 showcases the three different architectures of non-intrusive load monitoring (NILM) used: NFED [
41], SAED [
42] and WGRU [
43]. In addition to these architectures, a lightweight recurrent architecture called SimpleGru was developed. In order to evaluate and compare the models, the following metrics were calculated: F1 score, Relative Error in Total Volume (REVol) and Mean Absolute Error (MAE). The F1 score is the main performance metric that has more impact and is required to be higher. On the other hand, REVol and MAE are required to be at a minimum.
The second model is a disaggregator, able to analyze the total water consumption over a time period (time series) in its resultants. This problem is related to the Non-Intrusive Load Monitoring (NILM) problem, which usually applies to electricity consumption [
44]. Based on that core concept, water disaggregation follows the same principles. The ML models and training focus on blind source separation of consumed water. Hence, this method could provide the fundamental tools to properly monitor and manage potable water. More importantly, water waste can be avoided by employing sophisticated ML models that detect anomalies in water consumption. Furthermore, this tightly integrated IoT solution is an effective system that residential installations can benefit from. User behavior patterns and more insight can be provided to facilitate a proactive approach to water demand management in areas where limited resources exist [
45,
46].
The frequency and the resolution of the data can significantly affect the performance of the ML models, thus hindering the credibility of the water disaggregation methodology. Existing solutions in the sector of water disaggregation often base their training on data that are gathered on monthly and/or daily periods. This approach limits the potential of water disaggregation mostly due to legacy hardware or infrastructure. To address this issue, the proposed solution transmits both consumption and quality data at a relatively high frequency, making it a market-ready solution. The former transmits data at an hourly interval, while the latter transmits data at a 15 min interval.
To further improve the forecasting accuracy, the Time-Step Boosting technique can be applied during training to help the models optimize towards the periods that are harder to predict, thus increasing the final performance. The results of this technique are presented in
Table 2 for three common ML models with different configurations, showcasing an up to 40% improvement. Specifically, the results are reported using the root mean square error (RMSE) and the mean average percentage error (MAPE), with the performance of the enhanced (weighted) models highlighted in bold. The results also indicate that increasing the depth and width of the models more than 5 layers and 300 units has adverse results to their performance; therefore, it is advised to limit these parameters to a reasonable size, depending on the size of the data.
4. Water Sensors
In this section, the water sensors used during the pilot are presented along with their functionalities and quality parameters.
4.1. Flowmeter
The flowmeter as mentioned previously is a standalone system that measures the consumption of water in real-time. It collects metadata about the flowmeter’s status in runtime, which is also included in each transmitted payload. During the pilot phase, the flowmeter had been configured to broadcast data at different intervals (e.g., 1, 2, 4 h and once a day) to assess whether there is a need for such frequent data transmission.
One issue that was noticed when training the machine learning models for disaggregation was that the accuracy was directly linked with the frequency of the transmission. Specifically, it was observed that low-frequency transitions were not able to observe the fluctuations of consumption, thus limiting the accuracy of the training models. The one payload/hour was selected as the ideal configuration since it was able to capture the consumption fluctuations without affecting the longevity of the flowmeter and more importantly complying with the maximum duty cycle of European Telecommunications Standards Institutes regulations in LoRaWAN.
4.2. Water Quality Unit
The WQ unit is also a standalone system that operates autonomously and monitors the physiochemical properties of water. A plug-and-play solution has been developed during the pilot project that showcases the necessary quality parameters of water, based on standard scientific approaches. The unit integrates all water sensors with their proprietary outputs with specialized adapters to the MCU’s input pins.
When deployed, the MCU instantiates the sensors with the predefined outputs and establishes a connection with the LoRaWAN network to register the end device. Once setup is completed, the main loop is executed based on the MCU clock cycle. During the main loop, all connected sensors measure each value sequentially and store their values in memory. At the 10 min mark, all of the stored values are then processed to generate a single value that will be stored in the payload, which is transmitted every 15 min. However, the transmission period is restricted by the LoRaWAN network and the airtime, which is calculated based on the broadcasted payload. Based on the LoRaWAN specification, each end device is allowed to transmit data for a predetermined period during the day. In detail, the spreading factor controls the chirp rate, and thus controls the transmission speed of the data [
47].
This restriction is calculated based on the selected spreading factor that defines the relation between the symbol rate and the chip rate. The WQ unit employs the adaptive data rate approach that dynamically selects the spreading factor.
The spreading factor defines the relation between the symbol rate and the chip rate. A higher spreading factor increases the sensitivity and range, but also prolongs the airtime of a packet and likely raises the risk of collision. LoRaWAN uses 6 different orthogonal spreading factors numbered 7–12.
4.2.1. pH Sensor
Based on a thorough literature review with a narrow scope on WQ monitoring, pH is considered to be the single most significant quality trait in WQ applications [
48]. The pH indication is critical for the potability of the water as well as the oxidation of the water distribution network pipes. The scale of the pH dictates how acidic/basic the water is. The pH value ranges from 0 to 14, while 7 is considered neutral and ideal for potable water [
49]. In detail, pH is a measurement that takes into consideration the relative amount of free hydrogen and hydroxyl ions in the water. When free hydrogen ions are in abundance, this results in water being acidic. On the other hand, if free hydroxyl ions are higher, the water is basic. For the proposed system, an analogue pH sensor was used that can be connected to the MCU shield using a specific adapter. To provide accurate measurements, a calibration procedure was carried out using the provided reference liquids. A two-point calibration was performed using the software library while the measurement accuracy was ±0.1 of the pH scale at 25 °C.
4.2.2. ORP Sensor
The oxidation-reduction potential (ORP) measures the oxidative and reductive properties of water. Based on previous research, ORP was often used to define alkaline-ionized water [
50]. The most common ORP sensors use a small surface made of platinum that accumulates charge without chemical reactions. The measured charge is relative to the solution; therefore, the ground voltage of the solution is derived from the reference junction—similar to the pH sensor. For implementation purposes, an acceptable range of ORP in potable water is between 300 and 500 mV [
51]. The selected ORP sensor measuring range is from −2000 mV to 2000 mV with an accuracy of ±10 mV at 25 °C. Although the sensor can operate in a wide range of temperatures (5–70 °C), the experiments were conducted at varying temperatures of 15–25 °C. As in the case of the pH sensor, the ORP probe is connected with an adapter that maps the electrodes of the sensor to MCU-compatible connectors. Additionally, the calibration procedure was similar to the pH sensors by identifying two different points of reference in a known solution.
4.2.3. Electric Conductivity Sensor
Electric conductivity (EC) is a measurement that shows the water’s ability to conduct electricity [
52]. Although EC sensors measure the ions of water, it is highly susceptible to water temperature, concentration and mobility. Previous studies state that EC can also represent the amount of total dissolved solids (TDS) [
53,
54,
55]. Measuring TDS from the EC sensor is considered an efficient and accurate method since a standalone analysis of TDS is difficult and expensive due to specialized equipment [
56]. Several studies have tried to mathematically approach the correlation of EC and TDS [
57,
58]. However, a clearly defined ratio of TDS and EC cannot be proposed for each type of water (i.e., natural water for irrigation, distillate water, freshwater, seawater, brine water). Since the EC sensor is manufactured by the same OEM as the pH and ORP sensors, a special adapter for connecting to the MCU was included.
4.2.4. Temperature Sensor
The temperature sensor has been integrated as a validator for the pH and EC sensors. In detail, the temperature value of water directly affects the measured values of the sensors. Since both pH and EC sensors detect a voltage difference in the electrodes, the nominal operation from manufacturers is performed at 25 °C. If the temperature differs from the nominal value, the measured pH and EC values should be assessed. Each sensor’s measurements fluctuate based on the operating temperature, which must be taken into consideration for accuracy. Nevertheless, the quality unit integrates a digital temperature sensor that is compatible with the MCU and can operate between −55 °C and 125 °C. However, the sensor has an accuracy of ±0.5 °C when the temperature varies from −10 °C to 85 °C.
4.2.5. Calibration
In order for the quality unit to behave and measure accurately, the calibration of each sensor is mandatory before deployment. The manufacturers of the pH and EC sensors consider the two-point calibration process to be effective and accurate. On the other hand, ORP does not require calibration since a linear response is observed.
The pH sensor is calibrated using two factory solutions with values of four and seven. Initially, the pH sensor is submerged in the four-pH solution. Thereafter, the measurements are performed, and the offset calibration procedure is calculated. The exact same process is done using the seven-pH solution. Both measured values of the sensor are saved in the MCU’s EEPROM for future reference and use.
The EC sensor is also calibrated using two solutions with values of 1.41 μS/cm and 12.88 mS/cm. A similar procedure is conducted to detect the reference solution’s offset measurement value in the respective range. These values present the sensor’s operation pattern in different solutions.
To validate the employed sensors, a high-quality water meter was purchased during the pilot project that can be used as a reference and validator point. The AP-2000 is a portable multiparameter water monitoring probe that includes several sensor probes depending on the user’s requirements. For the purpose of the project, the reference kit is equipped with pH, ORP, EC, DO, RES, TDS, SSG, SAL and temperature sensors. Both the reference kit and the employed sensors mentioned above were exposed to reference solutions and were compared for accuracy using different configurations.
5. Implementation
In this section, a brief description of the implementation during the pilot project is presented. During the funded research project, a web interface was developed for easy access to future deployed devices. For the purpose of the pilot, a single flowmeter was registered to validate the seamless operation of the application as well as to test all of the functionalities and refine the usability aspects. As shown in
Figure 5, the application displays the location of the devices with the metadata. Moreover, the application is able to display alerts and notifications to the user along with the consumption of the selected devices.
During the writing of this research, the integration of the quality unit with the web application is at an ongoing state. Although the quality unit icon is not shown on the map, the quality measurements are performed in the background and stored in the database for training the ML models.
6. Impact
Water monitoring and power consumption are the new frontiers of the digital transformation of smart cities. However, the purpose of these implementations is not targeted only for extracting information about the consumption periods and peak values, but to evaluate different behavioral interventions for efficient usage. Moreover, the proposed IoT system can drastically affect the environment through constant water distribution network monitoring.
The adoption of this solution in water distribution is considered a sustainable solution for real-time consumption, notification and billing strategies. In this section, a preliminary investigation of the social, environmental and economic aspects of the IoT system is presented.
6.1. Social Aspects
The implementation of quantitative and qualitative water monitoring systems can have a positive social impact in several ways.
Monitoring citizens’ water consumption in real-time can help them make more informed decisions about their water usage, leading to more efficient and sustainable use of this precious resource. With this information, citizens can better understand their own water consumption patterns and make adjustments to reduce their water usage and save money on their water bills. The presented IoT monitoring system provides the necessary infrastructure and functions to facilitate the development of new business opportunities where effective monitoring can be leveraged as a solution.
The use of behavioral science principles in the design of water monitoring systems can help drive behavioral change among citizens, leading to even greater water efficiency. This can be done using mobile applications and other interventions that provide citizens with personalized feedback on their water usage patterns. By understanding their own water usage habits and receiving tailored suggestions for improvement, citizens can be nudged towards more sustainable water-usage behaviors [
59,
60].
Real-time monitoring can also help protect public health by providing short notice in case of impurities or contamination in the distributed water. With this information, water utility companies can take immediate action to address the problem and prevent potentially harmful water from being consumed by the public. This can help prevent water-borne diseases and other health problems that can arise from drinking contaminated water.
6.2. Environmental Aspects
Preserving a healthy ecosystem for the livelihood of the population is critical, thus WQ monitoring is important. Most monitoring solutions conducted by chemical labs or water utility companies are done periodically. This can influence the analysis outcomes and hide intermediate fluctuations of quality properties. Notwithstanding, this problem can be solved with the proposed solution by deploying WQ units. However, the replacement of the quality sensors should be done on a yearly basis to accurately measure the water parameters. Real-time data can also be accessed by other public entities to ensure whether operations influence the quality of the distributed water.
Based on the current solutions, quality monitoring is performed in large water depots that withhold stationary water. However, during the distribution, water is exposed to kilometers of network pipes that can contaminate water.
The environmental impact of water contamination can have a negative effect on aquatic life. When water becomes contaminated, it can contain harmful substances that can be toxic to fish and other aquatic organisms. This can lead to a decline in the overall health of the aquatic ecosystem and can have long-term consequences for the balance of the ecosystem. Undeniably, contaminated water can also be dangerous for humans to consume, as it can cause illness and other health problems [
61]. By deploying WQ units in strategic areas and monitoring the water in real-time, we can help to prevent contamination and protect both the environment and human health.
6.3. Economic Aspects
The adoption of quantitative and qualitative IoT water monitoring systems have several impacts.
First, the use of smart meters and other IoT technologies can reduce the need for specialized personnel to periodically check the flowmeters for consumption readings. This can help water utility companies save on labor costs, as they no longer need to hire as many employees to carry out these tasks.
Second, smart meters can provide valuable information to water utility companies about system failures and the stability of the infrastructure under high loads. This can help water companies to identify potential problems with their water distribution systems and take appropriate actions to prevent costly disruptions or failures.
Third, IoT technologies in water monitoring can also help water utility companies to improve their operations and become more efficient by collecting and analyzing real-time data on water usage and quality. Water companies can gain valuable insights into their operations and make data-driven decisions to optimize their systems and reduce costs.
Although the upgrade of the underlying water infrastructure to an IoT-ready system requires a high investment cost, the presented hybrid solution drastically reduces the initial investment capital. This is due to the fact that water quality monitoring can be performed on a large scale, which reduces the sensor replacement costs. Consumption can be implemented on a per household basis such that direct insight is observed in the consumption patterns.
7. Limitations and Future Directions
In the previous sections, a contemporary LoRaWAN-enabled water monitoring system was introduced, which was developed during a funded research project for commercial use. The system includes all of the steps that take place, from the aggregation, the transmission, the storage, the provision and the model training for disaggregation. Since the system is comprised of many stages, it is unlikely to introduce problems and malfunctions. Therefore, during the development, the internal components of each system were minimized such that the risk of failure is reduced without affecting their operation.
Even though both the flowmeter and the quality unit utilize LPWANs, it is admitted by the research community that several limitations arise. When an increased number of end devices are accommodated by GWs, the successful packet delivery ratio is decreased, which imposes problems for real-time or critical services that rely solely on LoRaWAN infrastructures. Therefore, a thorough investigation must be conducted to assess the reliability of LoRaWAN as a medium. Intelligent load balancing strategies on increased load by a high number of clients are required on the GWs side. This approach will reduce the overall GWs usage since intelligent load balancing can reroute received payloads, ultimately resulting in an increased life of GWs and less power consumption.
As mentioned in the section above, the proposed system cannot be adopted for domestic use only due to frequent sensor replacement costs. To address this issue, a hybrid alternative has been presented as a reliable solution that can be adopted by the underlying infrastructure for smart metering strategies. The manufacturing cost of a flowmeter is particularly lower than the quality unit. Apart from this, the flowmeter’s lifetime is significantly longer than the quality unit’s respective lifetime, resulting in multiple sensor replacements. With this in mind, each flowmeter can be deployed at each household and can be operated for a long time, while the quality unit can be integrated into a water distribution pipe that provides water to multiple houses/district/municipality blocks. The strategic placement of the quality units not only reduces the overall cost of the proposed system, but it enables the replacement of quality sensors with minimal intervention. Multiple consumers can be informed about their consumption individually using the employed flowmeter in their household, while the quality monitoring is handled by a quality unit, which accommodates multiple consumers. This solution could significantly reduce the cost of the overall system without affecting performance and information provisioning.
Another problem that needs to be addressed is that both the flowmeter and the quality unit can be stolen or removed from their mounted locations. These systems are deployed in public spaces that specialized personnel can access if needed. More importantly, the LoRaWAN antenna employed must not be obstructed by surrounding obstacles. Consequently, the flowmeter and the quality unit are equipped with a gyroscope for detecting movements in case the device is unmounted by unauthorized personnel. If movement over a specific threshold is identified, the device signals an alert via LoRaWAN that notifies the water utility company and in the case of a flowmeter, the consumer is also informed.
8. Conclusions
The presented water metering system is a contemporary, modular and cost-effective solution that is capable of utilizing LPWANs as communication protocols in smart city applications. It is undeniable that the solution offers several advantages over existing water infrastructure, including robustness, built-on open standards, ease of integration, low energy requirements, long-range coverage and real-time analytics.
It should be noted that the system has been tested in a pilot and has shown promising results in water disaggregation. Furthermore, the hybrid modular design promotes the sustainable aspect compared to existing water infrastructure.
The system can also be used in conjunction with external data sources that are able to predict demand–response fluctuations, future contaminations and inform water utility companies about water distribution pipe replacement as a preventative measure.
Nevertheless, smart cities can greatly benefit from the adoption of this novel IoT system. The presented IoT system can be considered as the de facto water IoT infrastructure where utility companies are able to provide metering services and customer-based billing opportunities.


 ,
, 


