Review

The Drying Peace–Athabasca Delta, Canada: Review and Synthesis of Cryo-Hydrologic Controls and Projections to Future Climatic Conditions

Watershed Hydrology and Ecology Research Division, Environment and Climate Change Canada, Canada Centre for Inland Waters, 867 Lakeshore Rd., Burlington, ON L7S 1A1, Canada
Sustainability 2023, 15(3), 2103; https://doi.org/10.3390/su15032103
Submission received: 10 August 2022 / Revised: 12 January 2023 / Accepted: 15 January 2023 / Published: 22 January 2023
(This article belongs to the Special Issue Sustainable Management and Conservation of Wetland Ecology)

Abstract

:
The Peace–Athabasca Delta (PAD) in northern Alberta, Canada is one of the world’s largest inland freshwater deltas, home to large populations of waterfowl, muskrat, beaver, and free-ranging wood bison. The delta region has been designated a Ramsar wetland of international importance and is largely located within the Wood Buffalo National Park, itself being a UNESCO World Heritage Site. Indigenous residents have depended on the delta for centuries to sustain their culture and lifeways. In the past five decades, the PAD has experienced prolonged dry periods in-between rare floods, accompanied by reduction in the area covered by lakes and ponds that provide habitat for aquatic life. Recharge of the higher-elevation, or “perched”, basins depends on overland flooding generated by major spring ice jams that occasionally form in the lower reaches of the Peace and Athabasca Rivers and in their various distributaries. Indigenous Traditional Knowledge and Historical Records for the unregulated Athabasca River are relatively scarce, but conclusively demonstrate the role of ice jams in replenishing perched basins of the Athabasca sector of the PAD. Similar information, coupled with extensive hydrometric and observational data for the regulated Peace River have enabled elucidation of the physical mechanisms that lead to ice-jam flooding of the Peace sector and assessment of regulation impacts on flood frequency. Such understanding can inform design of remedial strategies to moderate or arrest the drying trend of the delta. Climate-related projections to future scenarios suggest reduced frequency of ice-jam floods, albeit with uncertainty.

1. Introduction

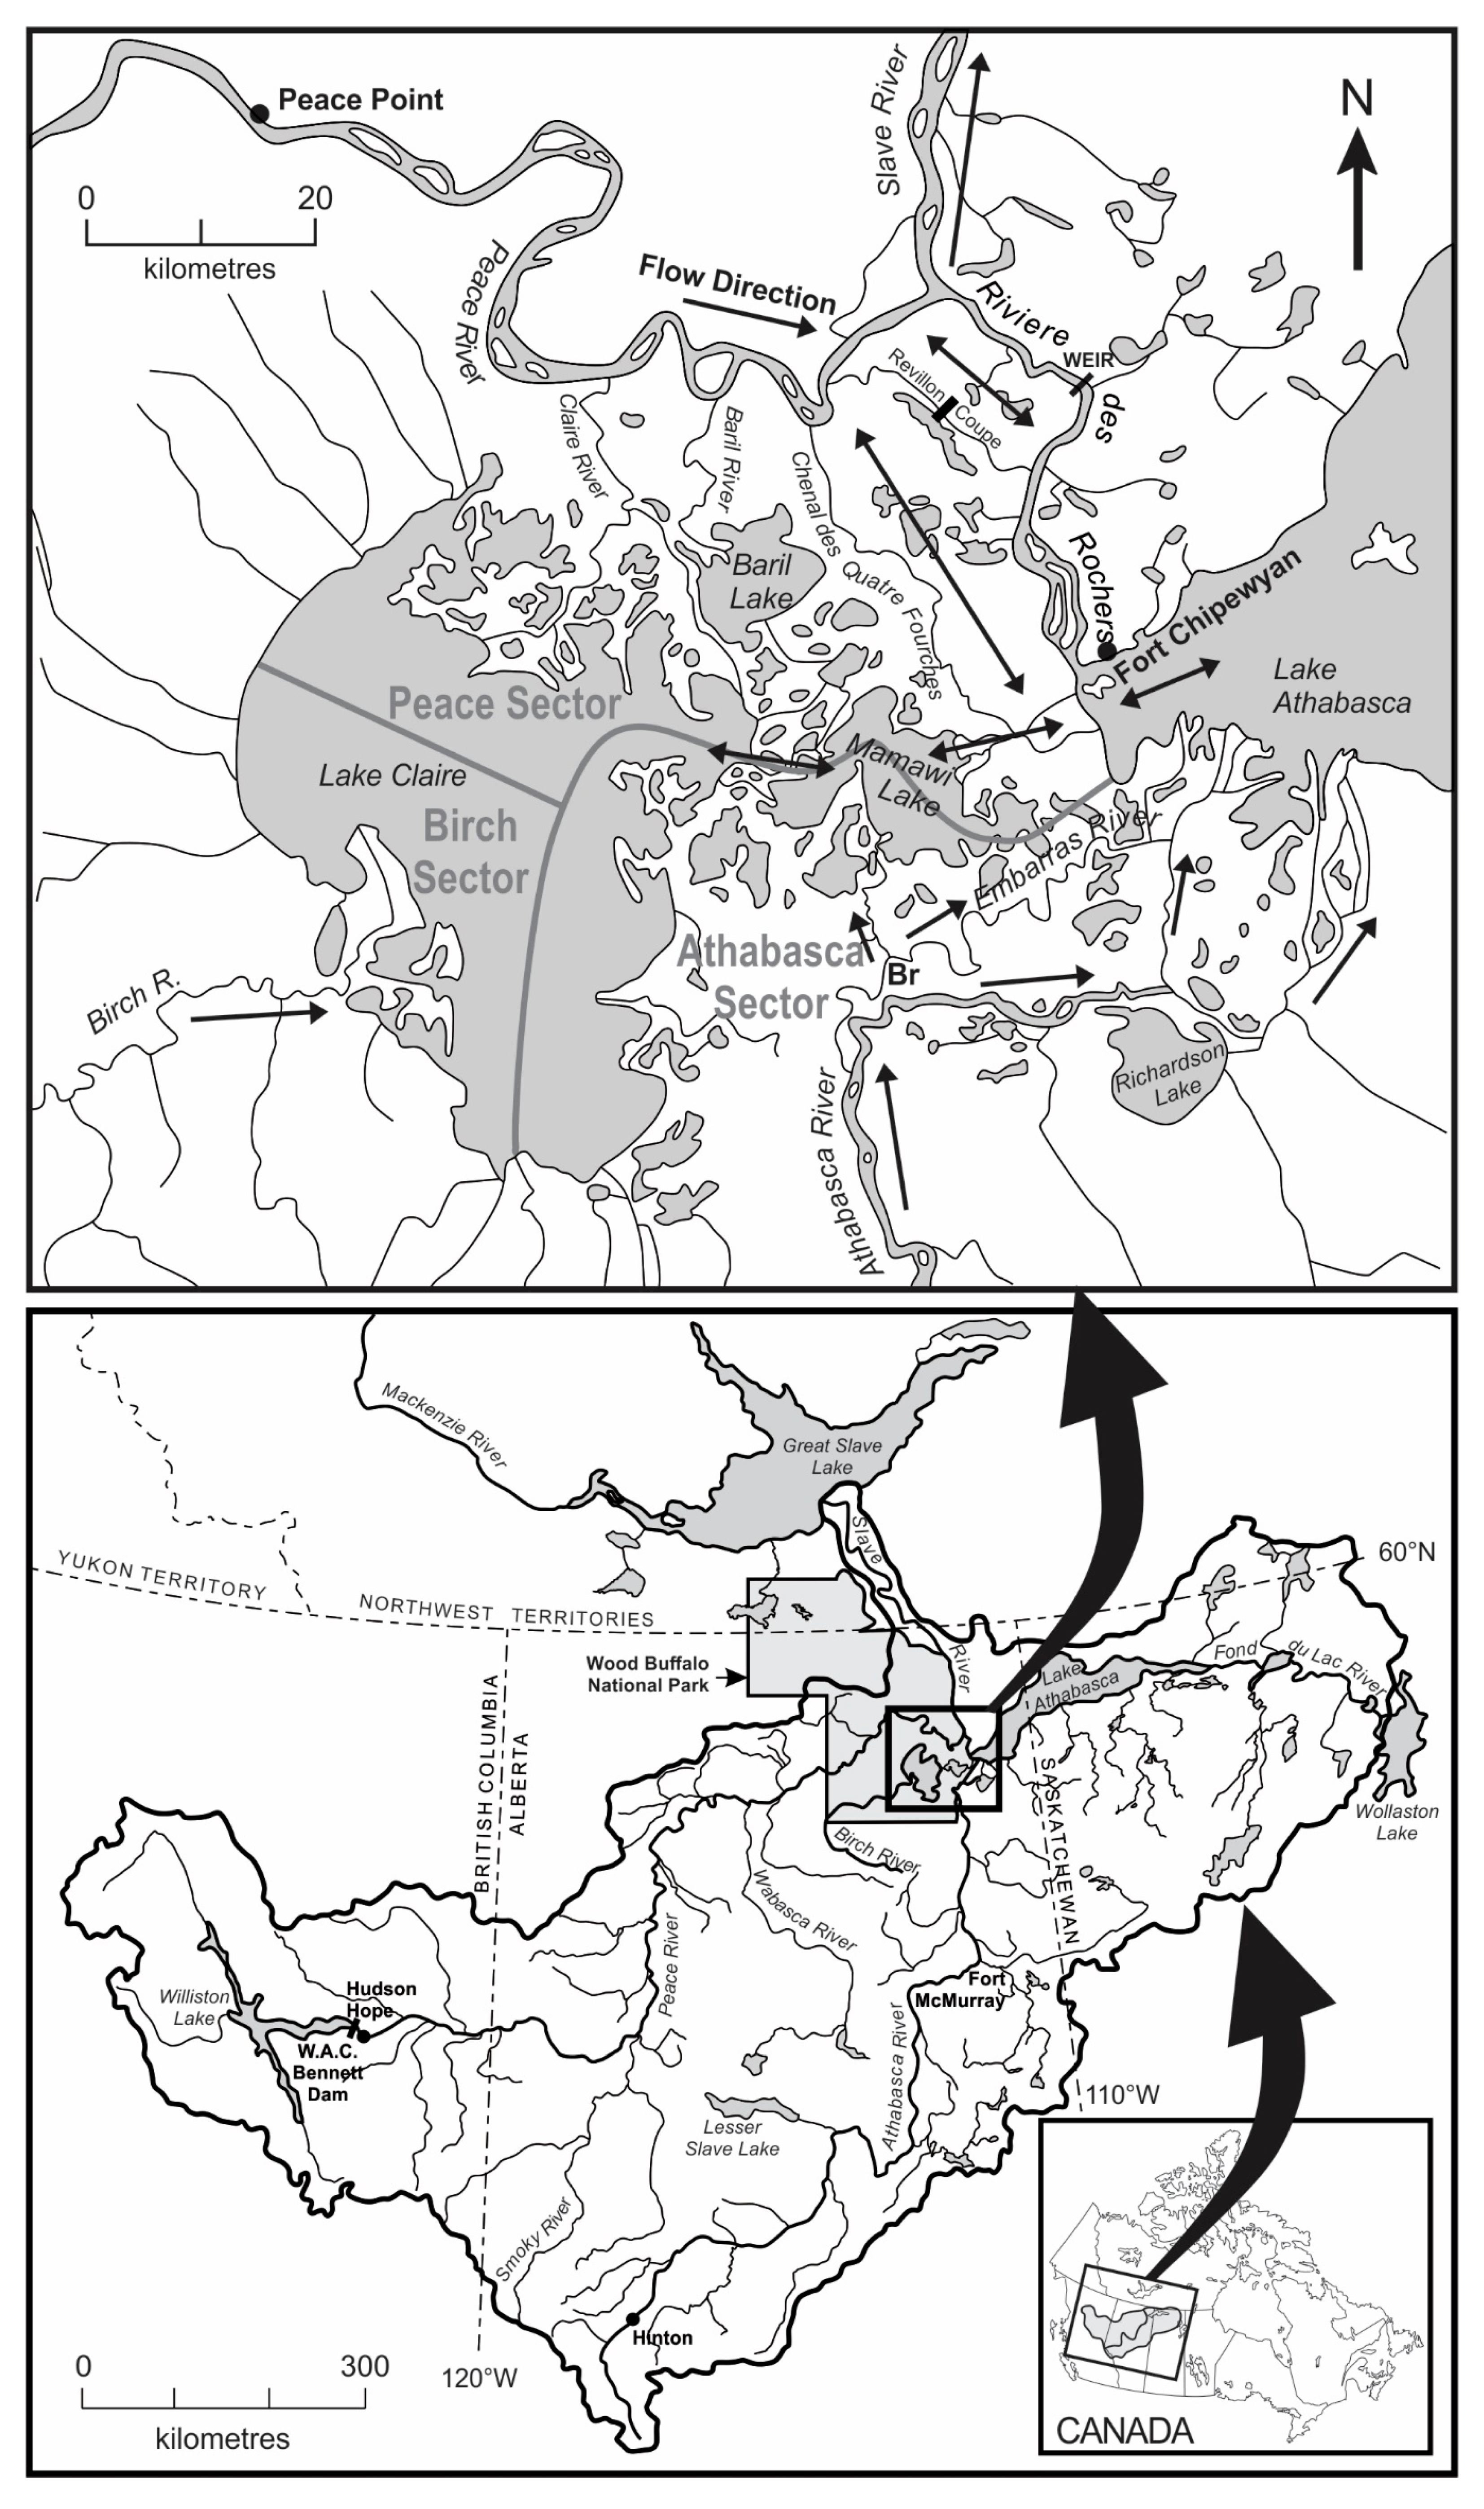
The Peace–Athabasca Delta (PAD) in northern Alberta (Figure 1) is one of the world’s largest inland freshwater deltas, home to large populations of waterfowl, muskrat, beaver, and free-ranging wood bison. The delta region has been designated a Ramsar wetland of international importance and is largely located within the Wood Buffalo National Park (WBNP), a UNESCO World Heritage Site [1]. The delta is a homeland for the Indigenous people of the region [2]. In Figure 1, the Peace sector of the PAD extends from Lake Clair in the west to Riviere des Rochers and Lake Athabasca in the east and from Peace River in the north to approximately the middle points of Lakes Clair and Mamawi. The Athabasca sector lies to the south and east of the Peace sector, while a much smaller sector, associated with Birch River, occupies the southwest portion of Lake Claire [3]. As noted in [3], the Peace and Athabasca sectors have merged to become one enormous complex of channels and wetlands. The upper map of Figure 1 only shows a few of the 1000+ small lakes and ponds (basins) that characterize the delta landscape.
During the past five decades or so, this complex and dynamic region has, in-between rare overland flooding events, experienced prolonged dry periods and considerable reduction in the area covered by lakes and ponds that provide habitat for aquatic life [4,5,6,7,8,9,10,11,12]. The drying trend coincides with the regulation of Peace River, which began with construction (1968), reservoir-filling (1968–1971) and operation (1972 onwards) of the W.A.C. Bennett hydroelectric dam in British Columbia, located some 1200 km upstream of the PAD (Figure 1). Concern over the long-term health and sustenance of PAD ecosystems is underscored by climate change and future construction of more dams [13]. As a result of a UNESCO Reactive Monitoring Mission report [14], prompted by a petition from Indigenous Peoples, Canadian federal and provincial authorities commissioned a strategic assessment [15] of WBNP. This assessment culminated in development of the WBNP Action Plan [1], which incorporated Indigenous knowledge, to address several recommendations towards preserving the ecological integrity of this important World Heritage Site. Ongoing concern prompted a second Monitoring Mission in 2022, which will make further recommendations, possibly including addition of Wood Buffalo National Park to UNESCO’s List of World Heritage in Danger. (https://www.albertanativenews.com/unesco-team-is-investigating-the-deterioration-of-wood-buffalo-national-park/ accessed on 12 January 2023).
Figure 1. Peace–Athabasca Delta map (upper) and drainage basin of the Peace–Athabasca Delta/Lake Athabasca system (lower). Arrows indicate flow directions along different channels, while most small basins are not shown. Modified from [8] (Peters 2003). The approximate boundaries of the three delta sectors are reproduced from [3].
Sustainability 15 02103 g001
The primary agents of replenishment with water, sediment and nutrients for the myriad basins of the delta are the Peace and Athabasca Rivers. Replenishment is accomplished either directly by overbank flooding or indirectly via distributaries of the Athabasca River and occasionally reversing tributaries of the Peace River. Typically, these tributaries carry water from a large lake (e.g., Lake Athabasca) towards the Peace because the lake surface elevation exceeds the river surface elevation at the tributary mouth. The flow direction may be reversed when the Peace River flow is large and/or the river stage is influenced by ice jamming. Indigenous Traditional Knowledge (ITK) and Historical Records (HRs) indicate that river ice jams, combined with sizeable spring flows, are more effective in generating flooding than large, or even extreme, summer flows [16,17,18]. This understanding has been corroborated by subsequent scientific analysis and mathematical modelling [8,19,20]. Essentially, it is the northern location of the delta and the consequent seasonal ice formation and breakup, which are the primary factors in the maintenance of the PAD. The same applies to other major Canadian deltas, such as the Mackenzie and the Slave River Deltas [21,22] and possibly to the Saskatchewan River Delta [23,24].
Noting the significance of spring ice jams and related cryospheric processes to the maintenance of the PAD and of other major deltas in Canada and possibly elsewhere, the objectives of this article are to: (a) review the relevant cryo-hydrologic factors and mechanisms; (b) examine the impact of climate and regulation on the drying of the PAD; and (c) discuss possible measures that can help ensure the long-term sustainability of the delta.

2. Background Information

The myriad of small ponds and lakes scattered throughout the PAD provide the most productive habitat for wildlife [25]. These basins have been classified into three categories, depending on the degree of hydraulic connection with the main flow system, i.e., open-drainage, restricted-drainage, and isolated basins [5]. In basins of the first type, water levels respond directly to fluctuations in an adjacent lake or channel. The hydraulic restriction associated with the second type (e.g., levee, high-closure channel, subsurface flow system) causes a lag in the response of the basin water level. The third type (termed “truly perched” basin in [25]) is isolated from the flow system and significant recharge can only be achieved by overland flooding; water-level decreases are almost exclusively controlled by evapotranspiration [25].
The term “perched” basin is abundant in PAD-related literature, but may have different meanings, depending on author and year of publication. Herein, it will be taken to mean the third type, i.e., the isolated basin, which can only be sustained by overland flooding. This terminology is, for example, consistent with that of [18] and [26].
The recharge of restricted-drainage basins (RDBs) and perched (isolated) basins depends primarily on high river stages caused by exceptionally large open-water flows or by ice jams in the Peace and Athabasca Rivers. A secondary contributing mechanism is “hydraulic damming” [27], which involves flow reversals in Peace River tributaries or mere reduction of PAD outflows when Peace River stages are moderately high. (Tributary flows depend on the difference in water surface elevation between a contributing lake and the Peace River at the tributary mouth; when this difference is negative, we have a reversal; when it is positive but close to zero, we have reduced outflow). Overland flooding, typically caused by ice jams, is the most effective recharge mechanism because it can replenish the perched basins, in addition to the RDBs. Hydraulic damming can replenish RDBs, even without overland flooding, albeit to a lesser degree; it can occur under open-water or ice-influenced flow conditions, respectively requiring sizeable or modest discharge.
Spring ice jams form in rivers when running broken ice from upstream reaches encounters an obstacle, typically competent stationary ice cover at morphologically jam-prone sites and begins to accumulate. Such accumulations initially extend upstream by surface juxtaposition of ice fragments, but later collapse and thicken under the pressure of external forces generated by gravity and flow friction at the jam underside. The large aggregate thickness (a few to many metres) and extreme underside roughness of ice jams are known to cause very high water levels in rivers, even when the discharge is modest relative to summer peaks [28,29]. At many river sites in cold regions, the highest floods are generated by spring ice jams and the same has been shown to apply to the Lower Peace River [19] using archived data from a hydrometric gauge located near Peace Point (Figure 1).
Other factors being equal, the water level in ice-jammed reaches increases as the incoming discharge increases. This discharge is related to the total winter precipitation in the basin as well as to the rapidity of snowmelt and the magnitude of any accompanying rainfall. Ice jam formation or non-formation in a particular river reach also depends on the resistance to dislodgment of the stationary ice cover. In turn, this resistance depends on local channel morphology and curvature, ice thickness and strength, and the highest level at which the ice cover formed in the fall or winter [30]. The end-of-winter (pre-melt) thickness of the ice cover is largely controlled by air temperature and snowfall patterns during the winter. Once melt begins, ice thickness decreases, and so does ice strength under the influence of increasing solar-radiation absorption [31,32].
Freezeup in the lower reaches of the primary PAD-contributing rivers (Peace, Athabasca) typically starts in late October or early November, while the breakup typically begins in the second half of April and ends in early May. The closest meteorological station to the PAD is located at Fort Chipewyan, and its record has been used in the past to characterize air temperature and snowfall over the PAD area [19,33]. Homogenized monthly data for Fort Chipewyan [34] indicate a positive linear trend (1950 to 2021) of ~0.04 °C/year (p < 0.05) in mean winter (November to March) air temperature, which ranges from −20 °C to −10 °C. Total winter snow data since the middle of the 20th century are only available for the period 1963 to 2007, with occasional gaps. They indicate a negative linear trend of 1.5 cm/year (p < 0.05), and a range of ~30 to 190 cm.
The most complete record of end-of-winter ice thickness in the delta area derives from Water Survey of Canada (WSC) hydrometric records at Peace Point (station No. 07KC001) and is illustrated in Figure 2. This time series exhibits no trend up to ~2005, but thickness visibly declines afterwards. The coldness of the winter varies from ~1600 to ~3500 °C days of freezing but, by itself, is a poor predictor of thickness [35]; prediction improves when snowfall is taken into account [33]. Occasional measurements in the delta reach of Peace River indicate that the local ice cover is often thinner than it is at Peace Point [33]. Annual measurements of ice thickness in the main delta rivers, as well as in selected tributaries and lakes of the PAD commenced in 2012 under a Community-Based Monitoring (CBM) Program that is operated by Indigenous stakeholders [36]. In addition to total thickness, CBM measurements include the portions of snow ice and black ice, as well as the depth of snow on top of the ice cover, as, for example was done in [37].

3. Athabasca Sector and Significance of Morphological Changes

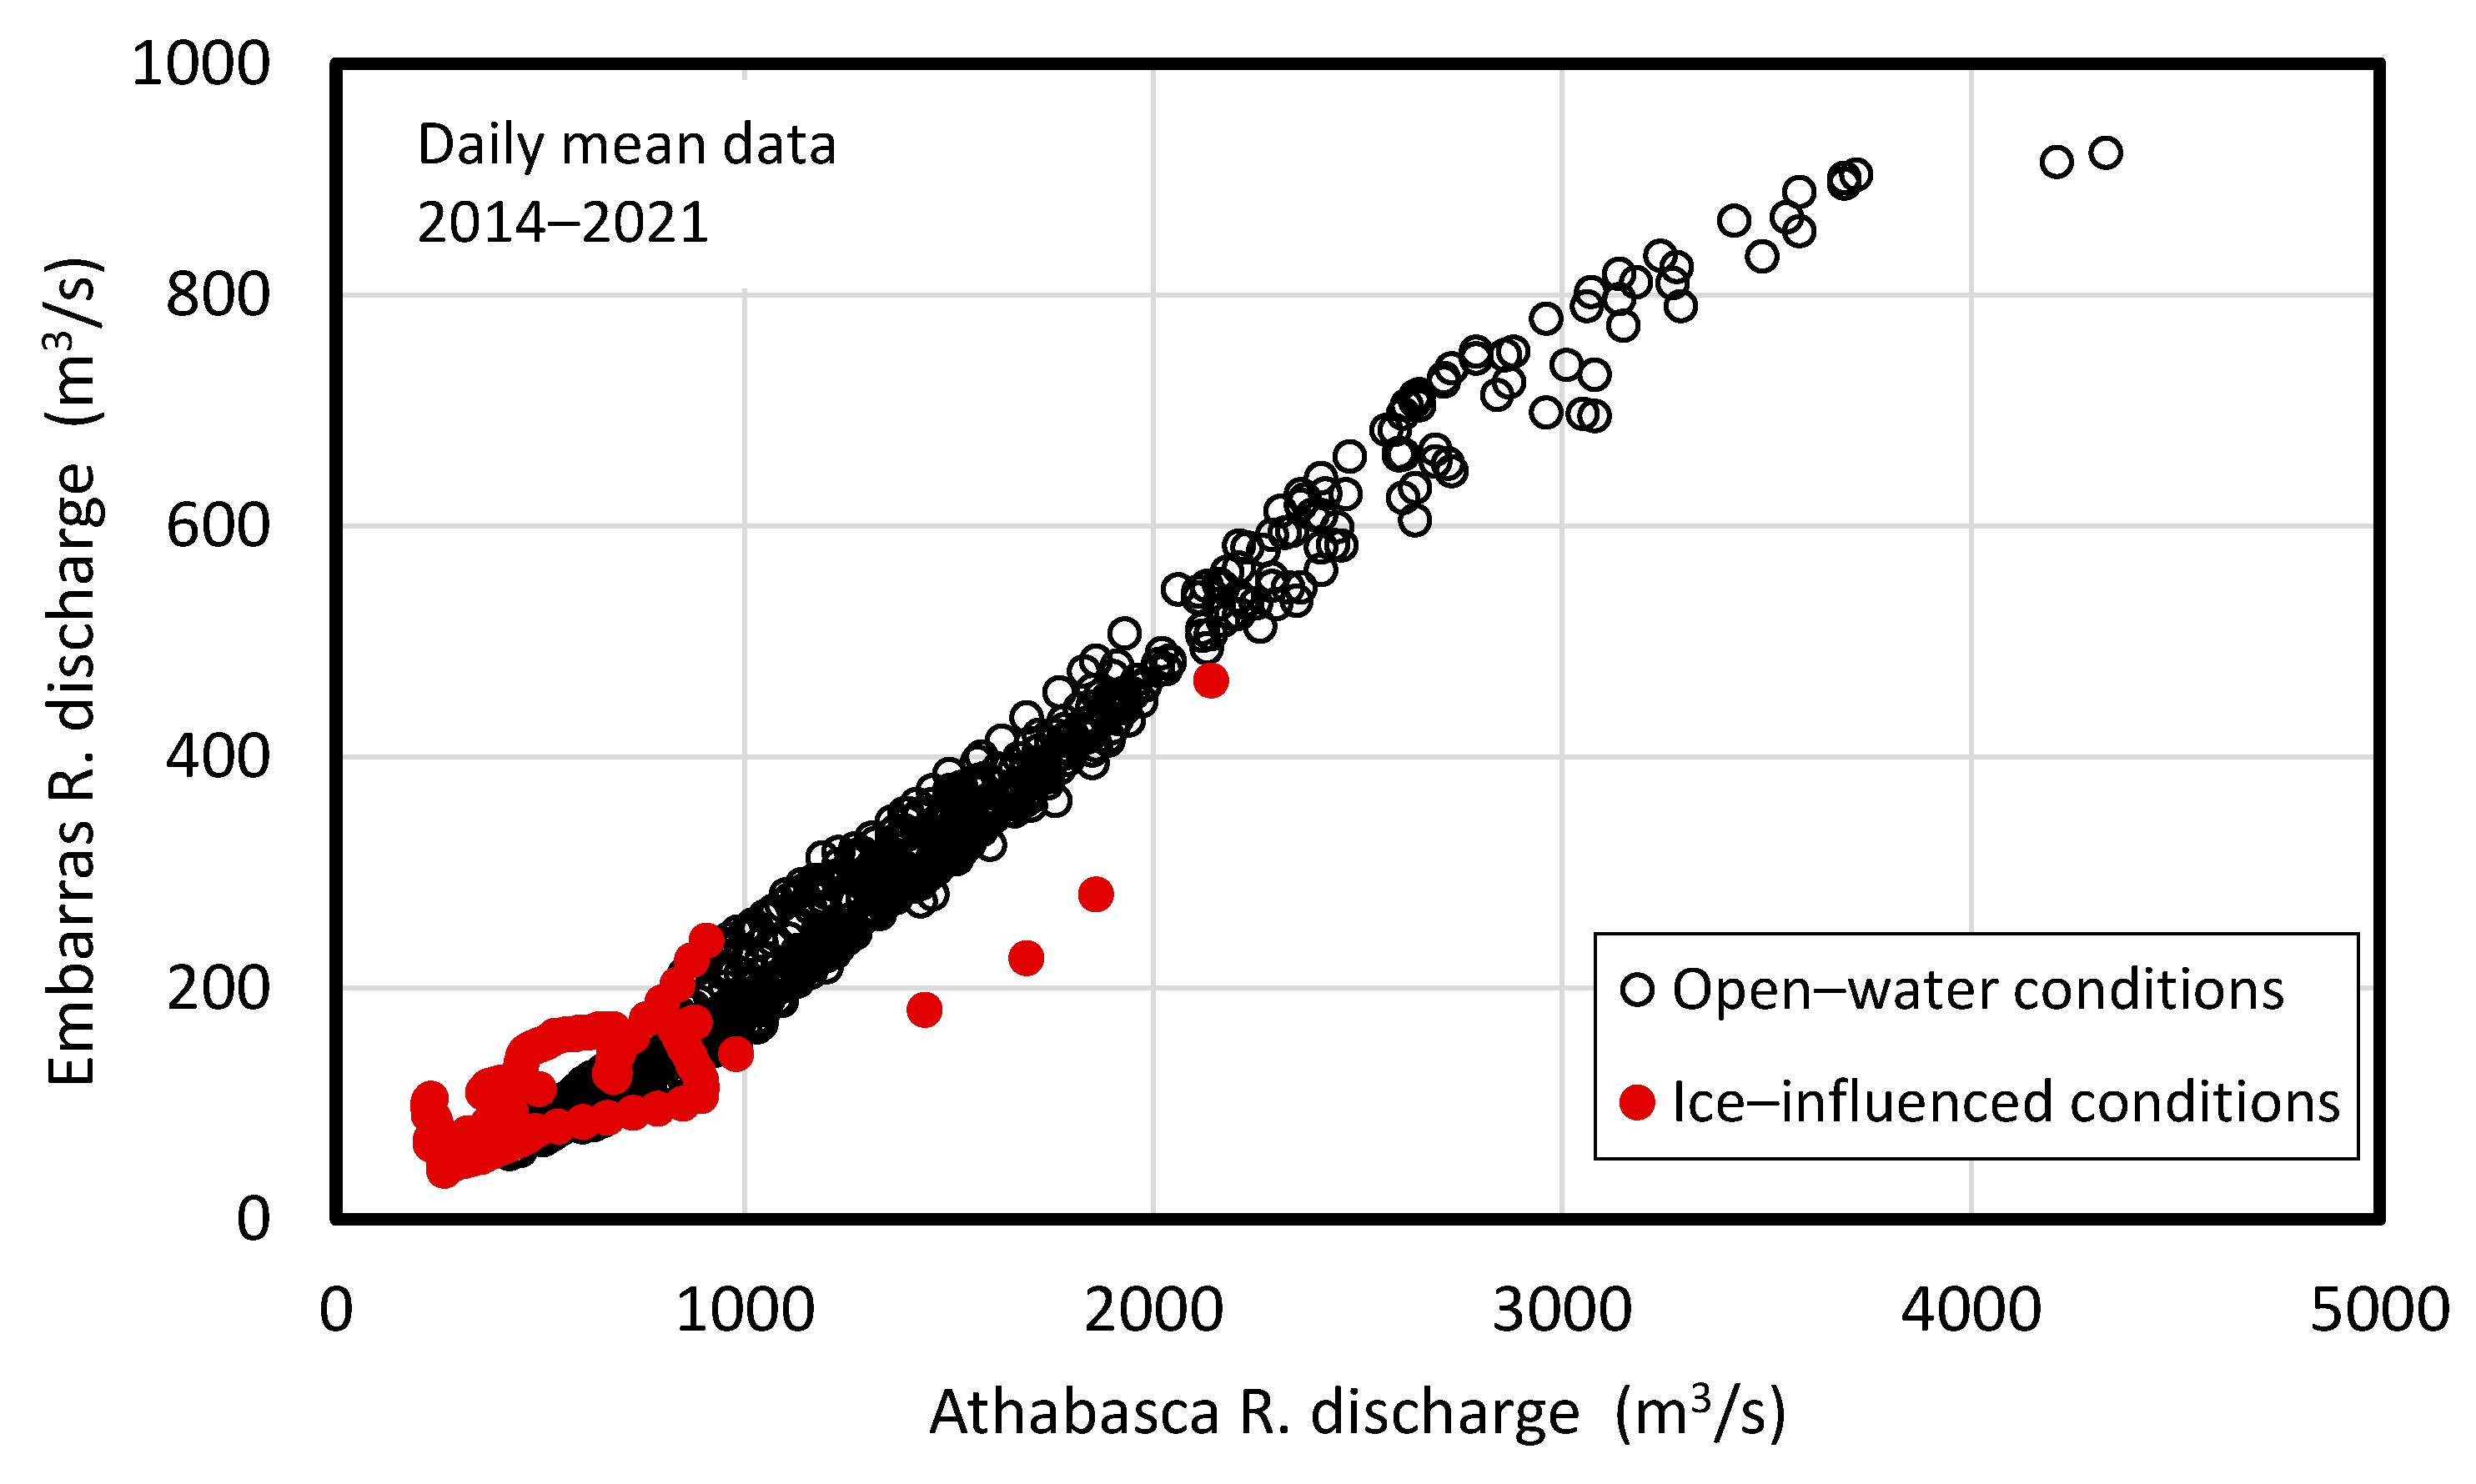
Basins located in the Athabasca sector are replenished primarily by flooding along the Athabasca River and its distributaries (Figure 1). Open-water overbank flooding does occur on occasion, but ice-jam floods (IJFs) are more frequent and effective in replenishing perched basins [8,16,17,18,38]. Flooding along the Embarras River (Figure 1) is known to supply water farther north into the PAD than the other distributary channels, and on occasion to inundate areas to the west of the river and towards Lake Clair. The flow entering the Embarras River depends on the magnitude of the Athabasca River inflow upstream of the bifurcation (or “split”) and on whether the stage is influenced by ice or not, as illustrated in Figure 3. In general, 20–25 percent of the incoming Athabasca River flow goes into the Embarras River.
The Athabasca River is not regulated, but its morphology near the Athabasca–Embarras split was drastically altered by human intervention in 1972, when a cutoff channel was excavated across the neck of a large 180° meander (Figure 4). This intervention was deemed necessary to prevent the advancing Athabasca River meander loop from breaking into the Embarras River and causing serious detrimental impacts on delta hydro-ecology [5].
Such river bends as the now-inactive meander are known to prime ice jams [29,31], so it is probable that ice jams would have formed frequently at that location before 1972. These jams would extend for several or many km upstream, potentially flooding areas next to the Athabasca River. Anecdotal ITK has indicated that the presence of jams on the Athabasca River near the Athabasca–Embarras split can enhance the amount of flow entering the Embarras River, thereby increasing flood likelihood along that channel (T. Carter, pers. comm. 2018). Therefore, the cutoff might have reduced the frequency of spring flooding of basins located between southern Lake Clair and the left (western) banks of the Athabasca and Embarras rivers (Figure 1). In turn, this effect could explain ITK suggesting reduced IJF frequency in this area [16]. More recently, water isotope-tracing indicated that basins in the southwestern Athabasca sector are prone to drying, much as are basins located in the central and northwestern Peace sector [39]. Again, this finding would be consistent with the postulated consequence of the 1972 cutoff.
During a 1982 flood event, the Embarras River broke through to Cree Creek, a tributary of Mamawi Creek, which empties into Mamawi Lake. This natural avulsion diverted a significant portion of the Embarras River northward and away from Lake Athabasca [40,41]. In Figure 1, the channel connecting the Embarras River to Mamawi Lake begins at the site labelled “Br” along the Embarras River. As the breakthrough channel enlarged, it carried increasing fractions of the upstream Embarras River flow and sediment. Analysis of daily mean discharge data from nearby WSC gauges (Nos. 07KF015 and 07DD003) indicated that the fraction was 0.53 on average for the years 1987–1997, rising to 0.65 for the years 2011–2021 and ranging from ~0.5 to ~0.85. Such variability is likely due to: (a) ice effects on stage; and (b) variations in the water level of Mamawi Lake.
Taking into account that the Embarras delivers ~20–25% of the Athabasca River flow, the 2011–2021 data suggest that the breakthrough channel now diverts ~13–16% of the Athabasca River water northward towards Mamawi Lake. Similar fractions have been reported in [26], based on WSC hydrometric data from 1987 to 2010. Apart from enhanced delivery of water and sediment to Mamawi Lake, the breakthrough appears to have resulted in reduced flooding of basins in areas east of the breakthrough and increased flooding northward along the sides of the breakthrough channel [42].
A major factor in the frequency of IJFs of the Athabasca sector is the magnitude of discharge during the spring breakup of the ice cover, which typically occurs towards the end of April or the beginning of May. Long-term flow data (1958 to 2021) are available for a gauge located at Fort McMurray (WSC station 07DA000), located some 160 km south of the PAD, but capturing a large percentage of the flow reaching the station at the Embarras airport (ratio of respective drainage areas = 0.85). Monthly discharge data for April and May exhibit very slight decreasing trends; the April-May average discharge (assumed to best represent typical breakup conditions) exhibits a statistically non-significant linear decrease rate of merely 0.9 m3/s per year. Different investigators [43,44,45] projected Fort McMurray breakup flows to future years of the 21st century by coupling climate-model scenarios with hydrological models. These works yielded conflicting results as to whether breakup flows are likely to increase or decrease in the future. Because similar flows are likely to prevail in the Athabasca River near the PAD, it is difficult to assess at this time whether ice-jam flooding in the Athabasca sector is likely to intensify or diminish in the future as a result of climatic change.

4. Peace Sector and Significance of Regulation

Northern and central portions of the PAD are replenished by flooding along the lower Peace River (Figure 1). Various sources (e.g., [18,19]) have stated that ice jamming is needed to generate overland flooding and this is in accord with experience since at least 1959, when the hydrometric gauge at Peace Point (WSC station No. 07KC001) was established. Flows recorded at this site are essentially the same as the flows that occur in the delta reach of Peace River a half- to one-day later. The flows occurring during most of the instrumental period are influenced by regulation, which commenced in 1968. Regulated open-water flows are considerably smaller than what they would have been under natural conditions [46]; therefore, one cannot preclude the possibility that open-water overland flooding might have occurred under natural conditions after 1968. Moreover, there is historical evidence that such flooding occurred in the 19th century [17]. Be that as it may, ITK and HRs clearly establish the dominant role of Peace River ice jams in replenishing the perched basins of the Peace sector.
Unlike for the Athabasca River, concern over the drying of the delta and the possible effects of regulation downstream of the Bennett Dam, motivated implementation of detailed monitoring programs, hydrometric and meteorological data analysis, as well as numerical modelling of relevant ice processes. These activities commenced circa 1973 and involve various agencies (Indigenous groups, BC Hydro, federal and provincial departments, Universities). The results have largely elucidated ice-breakup patterns that may lead to significant jamming in the delta reach of Peace River (e.g., [19,25,35,36,47,48,49,50,51,52,53,54,55]).
As spring approaches, thermal inputs to the open-water section of Peace River between the regulation facilities and the front of the winter ice cover raise water temperatures and cause gradual recession of the ice front. Increasing flows accelerate this process and can even result in minor ice breakage and short jams, but the breakup remains of the “thermal” kind, as it is still dominated by thermal processes and has no potential for major jamming. Somewhere along the way, an ice jam may form by an accumulation of various ice fragments and rubble that may originate in Peace River itself, but more typically, in ice runs from the Smoky River, a major tributary entering the Peace some 850 km above the mouth of Peace (MOP), which is also the beginning of the Slave River. The breakup may revert to “mechanical” or dynamic, upon release of this jam and formation of javes (ice-jam release waves), which can greatly augment hydrodynamic driving forces. {Mechanical breakup occurs when the winter ice cover is dislodged and mobilized while still retaining a good portion of its mechanical strength; this can lead to dynamic phenomena such as formation of major ice jams at locations of still-stationary ice cover segments and to large water waves upon release of these jams [30]}. Javes can trigger wholesale mobilization and breakup of the downstream ice cover, followed by runs of ice rubble. These runs are eventually arrested to form new jams, which after a time release and the process is repeated, largely in leapfrogging fashion. While the breakup front advances towards the PAD, thermal processes reduce the volume of ice rubble contained in various jams and weaken the ice cover of the PAD reach (Figure 1). After several or many days since the breakup first becomes dynamic, ice rubble arrives in this reach, where it may be arrested to produce major jams and overland flooding. On occasion (e.g., 2003, 2018, 2020), the volume of ice rubble arriving at the MOP and the upper Slave River is too small to form a significant jam and/or the local ice cover is too decayed to arrest the incoming rubble.
Occurrence of a PAD IJF depends on the overall celerity of breakup advance, CB. For events that start out as dynamic hundreds of km above the delta, CB depends on the number and “residence times” of the various jams that form along the way. High flow promotes high CB, but high resistance of the ice cover to dislodgment promotes low CB. In the latter case, the volume of ice rubble that arrives at the delta reach of Peace River may be too small to produce a major jam, owing to prolonged thermal degradation (e.g., 2020 event; [35]. Ice cover resistance is enhanced by thick ice covers, high freezeup levels, and channel morphology (e.g., sharp bends, constrictions, abrupt gradient reductions; [30]). The freezeup level (HF) is of particular concern in the present context because hydropower generation has considerably augmented downstream freezeup flows and stages [19,56].
Minimal regulation effects on ice thickness and strength, and a slight increase—on average—in breakup flows were detected in [19]. The small average flow increase was also detected in [56,57], based on naturalization of breakup flows. The latter two studies indicated, however, that breakup flow could be significantly augmented or curtailed by regulation in individual years. Together with the regulation-induced increase in HF, a natural cryo-hydrologic regime would likely have produced up to twice as many IJFs than have actually occurred (5 events) during the years 1972 to 2016, for which naturalization modelling was performed [56]; the reservoir-filling years 1968–1971 were excluded as non-representative of normal regulation operations. The effect of regulation on the frequency of IJFs in the lower Peace River is disputed by researchers who may be employed by, or receive funding from, the regulating agency. Interested readers may find details on this debate in Appendix A, including citations to additional publications.
Climatic impacts on the decreasing IJF frequency have been linked to a general decrease in breakup flows, as a result of decreasing winter precipitation in key portions of the Peace River basin [19]. This process appears to have stabilized in recent years because winter precipitation now exhibits a recovery [58], while naturalized breakup flows for the period 1972–2016 exhibit no discernible trend [56,57]. An assessment of the relative contributions of climate and regulation on IJF frequency indicated that the role of climate has been secondary [59].
Climate-related projections for the future of IJF frequency have been reported in [50,60]. The earlier study [50] concluded that IJFs will likely become about four times less frequent during the 21st century as a result of depleted snow packs that will be available for spring melt. The cause of such change would be the increasing frequency and magnitude of mid-winter thaws; this projection appears to be already occurring: significant thaws and snowpack depletion were experienced in 2015 and again in 2022. A projected thinning of the winter ice cover [33] could exacerbate the anticipated flood-frequency reduction. The later study [60] indicated that the probability of IJFs will decline during the 21st century, likely by orders of magnitude because “…winters are expected to be insufficiently cold to build substantial river ice and snow packs are expected to be reduced”. The large uncertainty associated with such projections was stressed in the aforementioned studies, but it seems prudent to anticipate continuing, if not accelerating, drying of the PAD if no remedial action is undertaken.

5. Strategies for Restoring Floodwater to Peace Sector Basins

Over the years, various remedial measures have been proposed and/or implemented by stakeholder agencies. Such measures were reviewed in [6]; it was reported that construction of weirs at key locations within the PAD has been highly successful in restoring water levels on the large lakes, but ineffective with respect to perched basins. Artificial ice accumulations to promote formation of ice jams and/or block the flow and raise the stage of water, were also tried but the effectiveness of this method depends on spring flow conditions, potentially rendering it superfluous: the years in which the spring flow is sufficiently large to make artificial jams/dams effective within the delta are also the years in which natural jamming is most likely to occur [6]. Consequently, the option of artificial ice accumulations has not been pursued further.
The physical understanding that has been gained so far (Section 4) suggests that timely modifications of regulation operations may enhance overland flooding of the Peace Sector of the PAD. These modifications involve reduced flows during freezeup and/or enhanced flows during breakup.

5.1. Spring Flow Releases

A timely release of flow at the Bennett Dam can augment the discharge in the PAD reach during the “residence time” of an ice jam and increase the volume of water entering various basins. The feasibility of this approach was tested in the spring of 1996, an IJF year [7]. Pre-breakup indicators, such as winter precipitation and flow in the Smoky River were favourable, while ice thickness was about average. {Though the corresponding HF does not seem to have been considered, its value (212.38 m; [49] was relatively low and therefore favourable to ice-jam formation, other factors being equal}. Consequently, a release of extra 500 m3/s at the Bennett Dam was implemented between 25 April and 3 May. This operation resulted in a 6% increase in flow when it reached the lower Peace near the PAD, and partly overlapped with the duration of a major ice jam that was already causing widespread flooding. Via numerical hydraulic and ice-jam modelling, it was estimated that this flow increase began to be felt in the PAD reach on 1 May, generating a maximum stage increase of 0.27 m on 3 May; the jam released between reconnaissance flights on 3 and 4 May. A question to which there is no satisfactory answer at present is whether the additional flow might be enough to bring about dislodgment of the jam and thence reduction of flooding duration.
Comprehensive numerical modelling has been applied to study the propagation and effects of Bennett Dam releases, not only near the delta but also at key sites between the dam and the delta, such as the town of Peace River and Fort Vermilion [61]. Such, or similar, predictive capability could be used to advantage under this remedial option. Limitations to the magnitude and timing of any release arise from the need to ensure that various communities located along the river between the dam and the PAD are not subjected to increased flood risk. From the practical point of view, it is debatable whether a release can make the difference between a flood and a non-flood event, unless the release volume of water is so large as to raise cost and safety concerns. A major cause of drying, i.e., the reduced frequency of IJFs in the past 50 years or so, is not addressed by this measure. Therefore, the primary value of this option would be in enhancing the overland flow of water in situations when an IJF is already in progress.
Under this option, it is important to ensure that flow enhancement applies to what would be the natural breakup flow, not the prevailing regulated flow. Naturalization studies [56,57] indicate that regulated breakup flow is occasionally smaller than the corresponding natural flow (e.g., 1989). Natural flows (or inflows) to a reservoir are routinely computed by regulating agencies as part of normal operating procedures; their contributions to Peace River flow near the delta can be estimated using appropriate lag times or numerical models.

5.2. Freezeup Stage Reductions

The obvious approach under this scenario would be to reduce fall/winter flows, ensuring that freezeup stages will be comparable to, or not much higher than, those that prevailed prior to regulation. However, this method would entail loss of revenue from electricity generation and distribution. Quantification of the spatiotemporal details of an effective HF-control strategy would require numerical modelling and selected field observations to arrive at an optimal variation of Bennett Dam outflow during the ice season. A drawback of this approach is that it would end up being of little value to the delta in years of low spring runoff, an outcome that cannot be predicted when the river ice cover is forming.

5.3. Overall Assessment

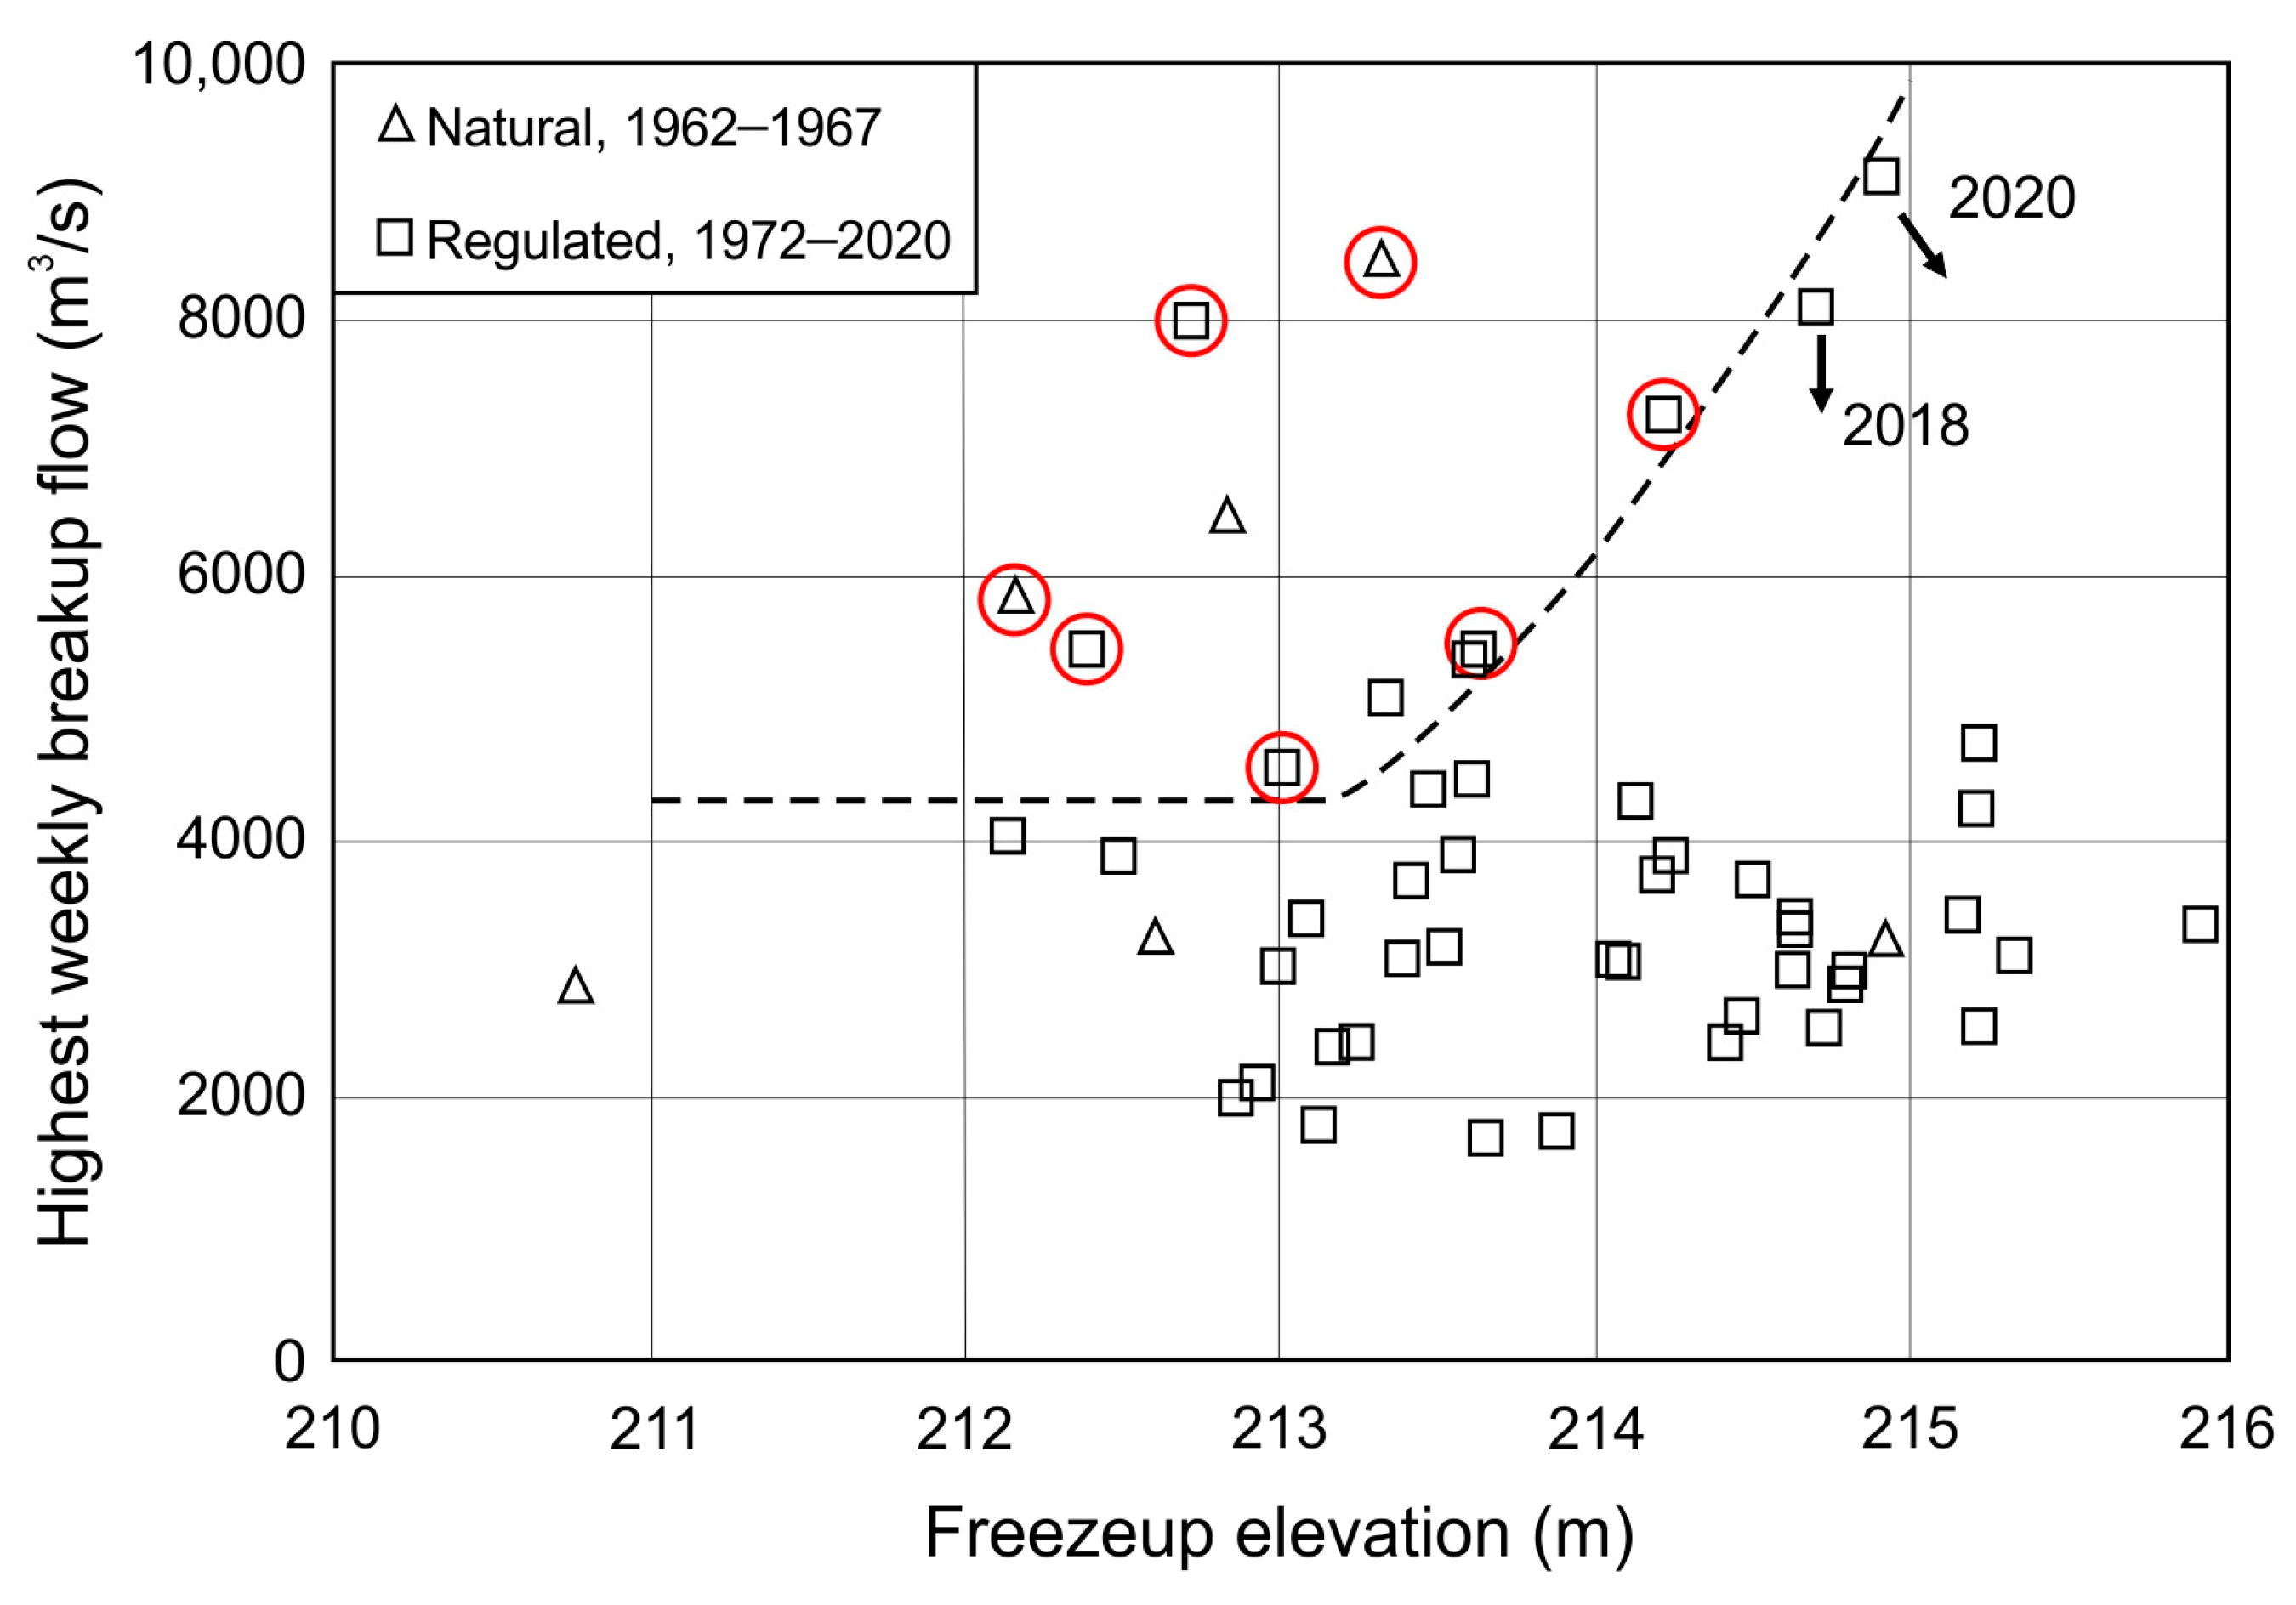
The above considerations suggest that a combination of freezeup stage reduction and spring flow enhancement may be a more effective strategy for enhancing the probability of ice-jam flooding in the lower Peace River than either one of the preceding two options (spring flow release, freezeup level reduction). Use of one or the other option, alone, would be hampered by the fact that either the freezeup stage or the spring flow can act as a limiting factor with respect to ice-jam flooding. Thus, a low freezeup stage can turn out to be of no consequence if the spring flow is not high enough. At the same time, a high spring flow, augmented by a timely reservoir release, may not produce an IJF if the freezeup stage is too high. These limitations are illustrated in Figure 5, which could also provide some guidance regarding the needed flow increase, depending on the value of HF and the magnitude of the anticipated “unassisted” breakup flow. Weekly breakup flows were computed for the last week of April, the first week of May, and the second week of May. The highest, ice-influenced value of these quantities is plotted in Figure 5 and typically pertains to the first week of May. For practical application, longer or shorter time intervals than 7 days may also be considered, depending on how well they capture the ice-breaking capacity of the early spring hydrograph.
An important caveat with respect to the above possibilities is that climate change may ultimately render them ineffectual if the anticipated (Section 4), severely negative, future impacts of climate change on IJF frequency materialize. In that case, overland flooding in the lower Peace River could only be restored by means of suitable flow- and ice-control structures. Such a measure would be relatively expensive, given the size of the river and the remoteness of the site.

6. Summary

The long-term sustainability of the Peace–Athabasca Delta, an extensive and highly valuable Canadian wetland, depends primarily on cryospheric processes such as river ice formation and breakup, snowfall and ice cover thickness. Overland flooding, which can replenish the perched basins of the delta is typically generated by ice jams that form in the Peace and Athabasca Rivers as well as in their distributary channels. A drying trend that began in the 1970s is causing concern among various government agencies and Indigenous residents. It has motivated historical and field data collection, monitoring activities, and scientific studies into the causes of drying, future climate-related conditions and possible remedial measures.
In the last 50 years or so, the unregulated Athabasca River experienced two major morphological changes that likely impacted ice-jam flooding in the Athabasca sector of the PAD. The 1972 cutoff of a large meander loop likely eliminated local ice jam formation, contributing to reported drying in the southwestern portion of the Athabasca sector. The 1982 natural breakthrough of the Embarras River towards Mamawi Lake is diverting northward significant amounts of water and sediment, with positive reported impacts on the recharge of nearby basins and negative impacts on basins located farther east. Long-term (1958–2021) April and May flows of the Athabasca River exhibit slight non-significant trends, suggesting that climate has not played a significant role in changes that have been observed within the Athabasca sector. Climate-change projections are inconclusive, so that it is not possible to forecast whether IJFs will diminish or intensify during the remainder of this century.
Drying of perched basins in the Peace sector is concomitant with reduced frequency of lower Peace River IJFs. It is attributed to a combination of regulation and climate variability by several scientists, while other scientists dispute the role of regulation. The former assertion derives from an empirically known and theoretically supported effect of the freezeup level on the resistance of the winter ice cover to dislodgment and mobilization. In turn, this effect implies that high HFs can prevent occurrence of an IJF, even if the breakup flow is very high, explaining a number of non-flood occurrences, including the extreme-flow 2020 breakup event. The contrary view, i.e., no regulation effect, derives from paleolimnological and statistical studies; these are also referenced herein, so that interested readers may examine details of the ongoing debate.
To date, the effect of climate on IJF frequency has been manifested in reduced winter snowfall, which seems to be recovering in recent years. However, climate-change projections by different scientists point—with uncertainty—to greatly reduced future incidence of IJFs in the lower Peace River, regardless of the regulation impact. Possible remedial action to improve sustainability of the perched basins includes enhanced spring flow releases from the Bennett Dam and/or modified fall regulation operations to reduce freezeup levels along the Peace River. In view of the anticipated negative climate-change effects on PAD sustainability, it may eventually prove necessary to build relatively costly river control structures.

Funding

This research received no external funding.

Institutional Review Board Statement

Not applicable.

Informed Consent Statement

Not applicable.

Data Availability Statement

Data used in this study can be provided on request.

Acknowledgments

The writer gratefully acknowledges the support of Environment and Climate Change Canada in preparing this manuscript, which is primarily intended to contribute to Canada’s Wood Buffalo National Park Action Plan.

Conflicts of Interest

The author declares no conflict of interest.

Appendix A. The Debate on the Effects of Regulation on the Frequency of IJFs in the Lower Peace River
The negative impact of higher freezeup levels on the frequency of Peace River IJFs was first identified in 1993 [62] and later corroborated by [19,26,35,49]. These studies are based on known physics of river ice processes and empirical hydrometric data/observations, as well as mathematical analysis and modelling.
Two sets of researchers [63,64] critically discussed a Technical Note [65], which showed a sharp decrease in lower Peace River IJF frequency following construction of the Bennett Dam. These Discussions were rebutted in [66]. Paleolimnological studies [67,68] have advanced the view that the effect of regulation is minimal, if any; this claim was critiqued in a commentary [69], which in turn was rebutted in [70].
Logistic regression was performed [60] on potentially relevant cryo-hydrologic variables and indicated that IJF occurrence probability is best determined in terms of winter (November to April) precipitation (WP) and overall coldness of the winter, expressed as cumulative degree days of frost (DDF). Inclusion of the freezeup level as an additional regression variable did not improve predictive capability, while the respective p-value exceeded conventional statistical-significance thresholds. This result may seem to indicate that HF does not influence the occurrence of IJFs, but the authors [60] noted that the predictive power of their regression was low and judiciously cautioned that:
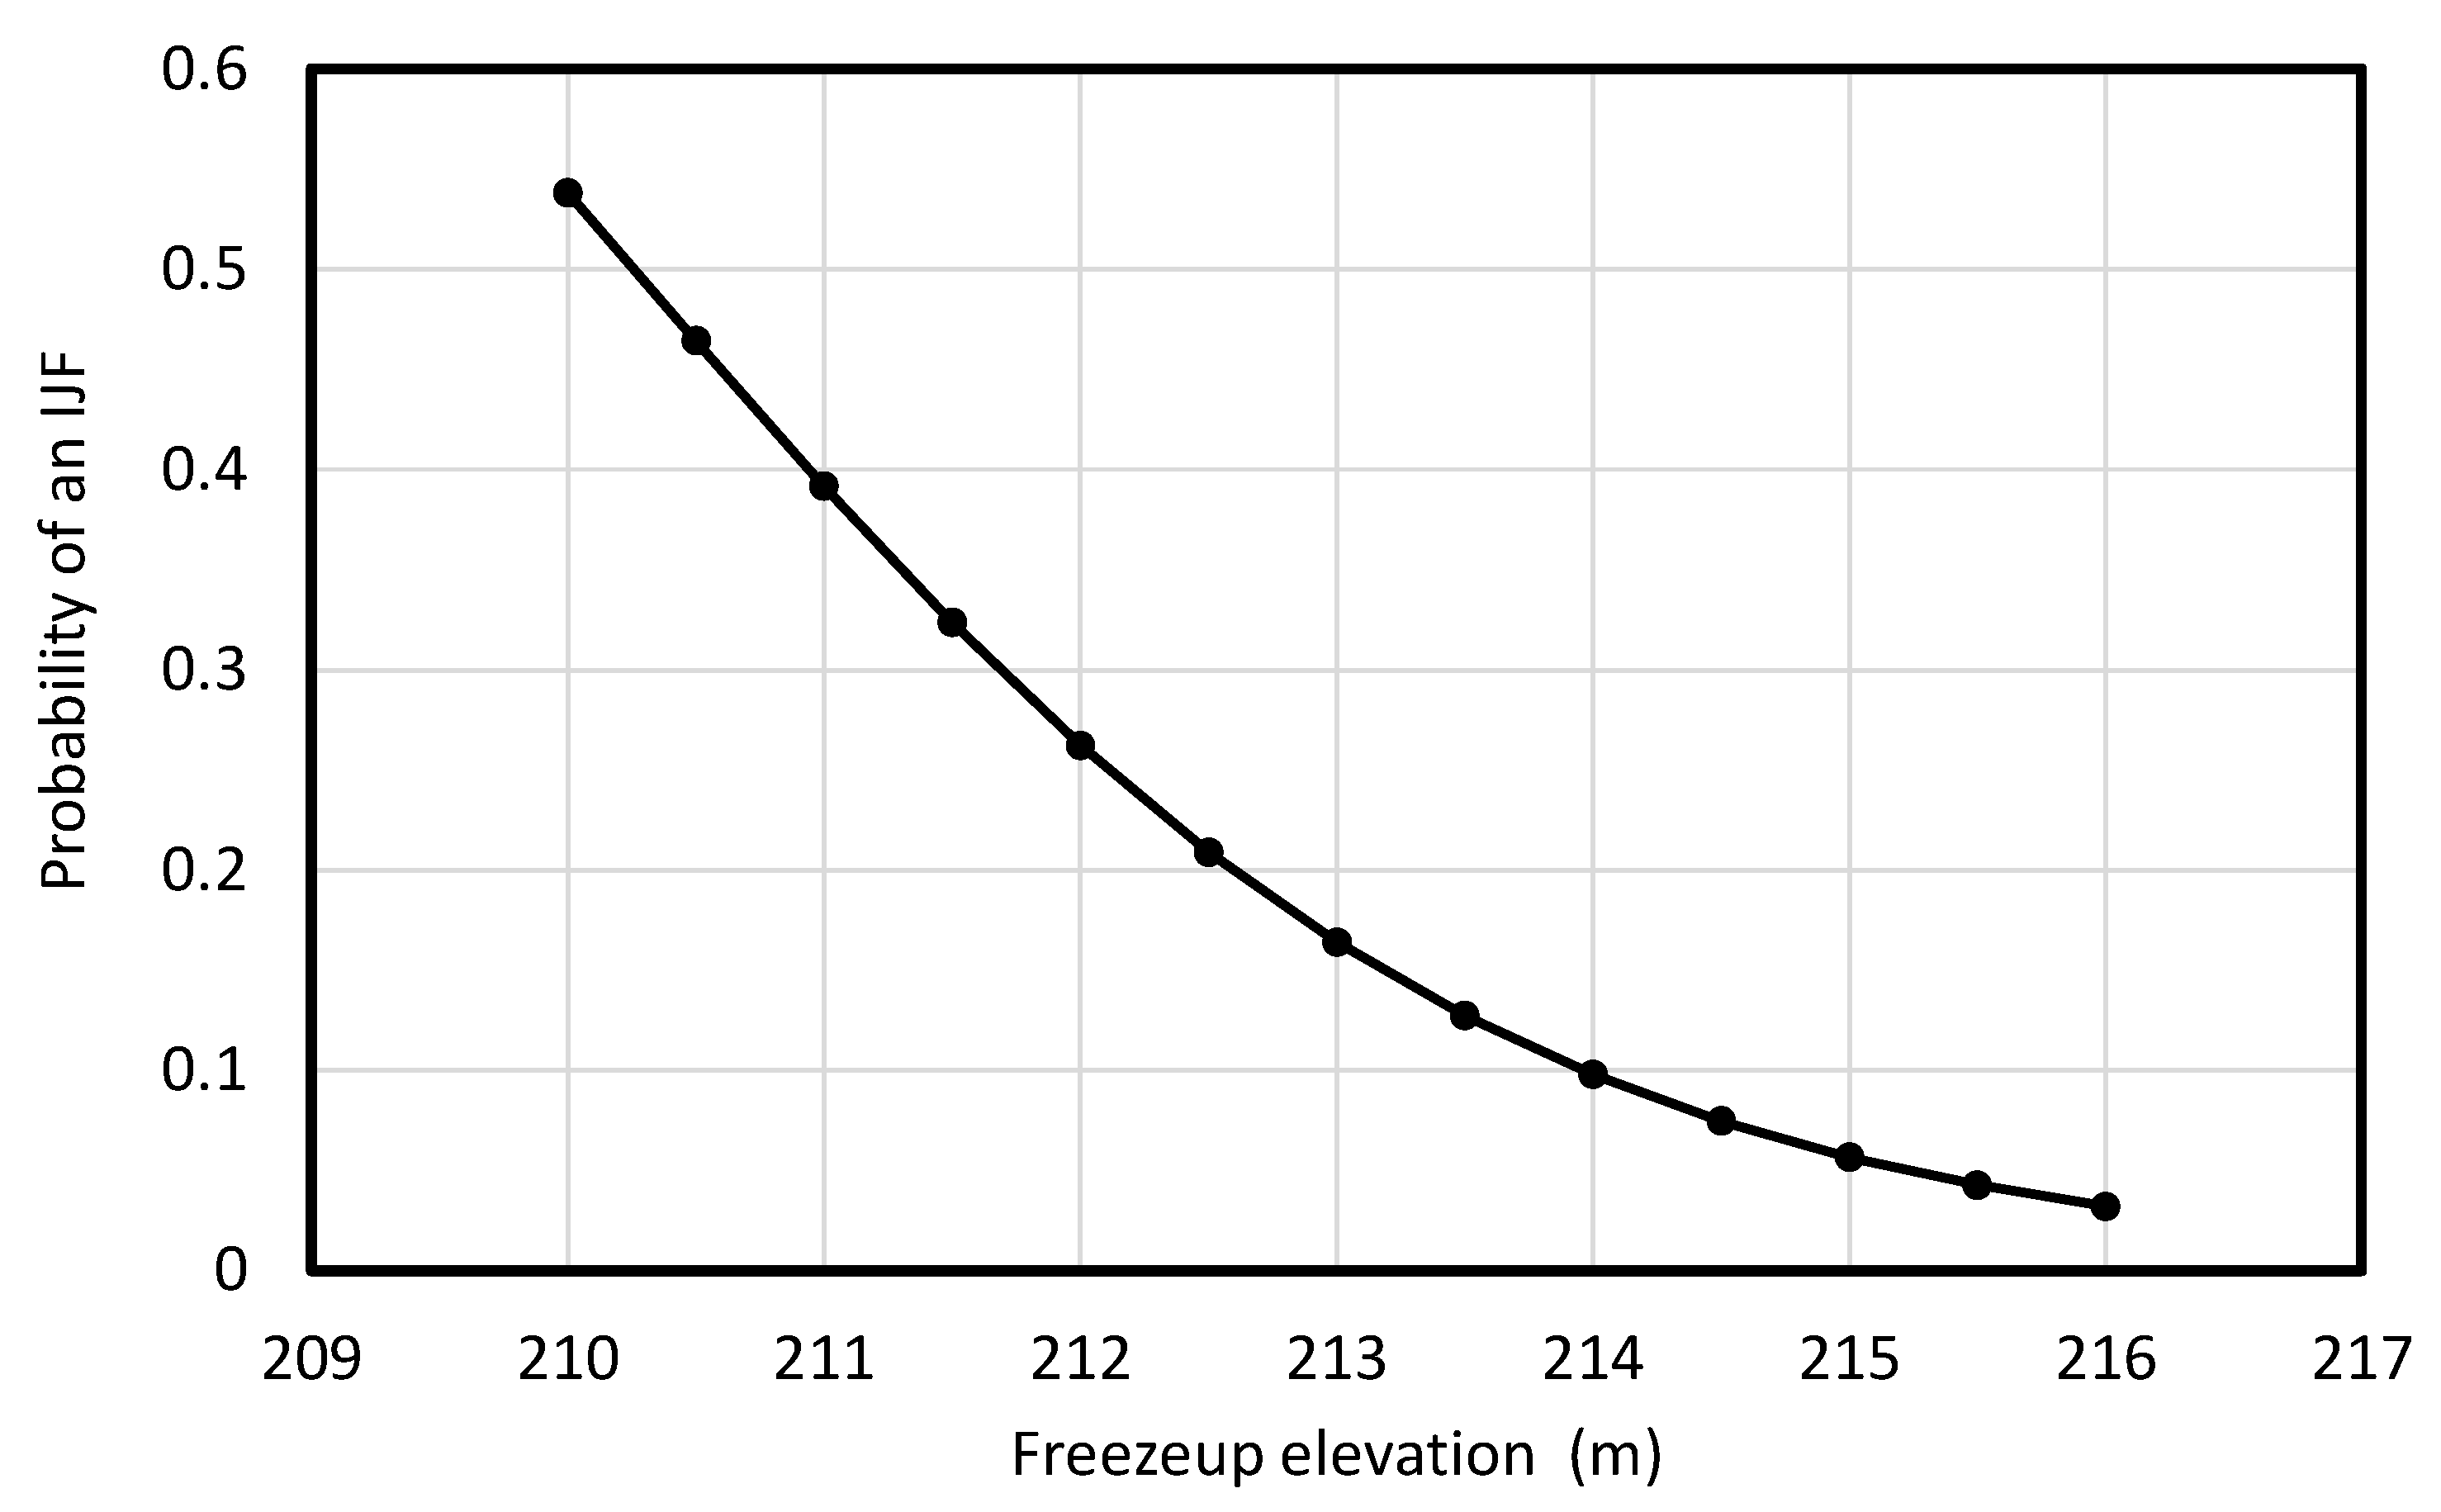
“It is important to note that just because a factor is not statistically significant or the model AICc is not competitive, does not necessarily mean that the factor is unimportant to generating large ice jam floods. It could be that the factor’s relationship to flood generation is different than assumed by the models we tested (structural uncertainty), or that the sample size is too small to precisely estimate the effect of the factor on ice jam floods (parametric uncertainty). It could also be that the factors used as proxies for the physical drivers are not good (epistemic uncertainty)” [60]. As shown in [71], epistemic uncertainty is pronounced in the analysis of [60]. Moreover, it can be shown that use of direct, rather than proxy, explanatory variables (breakup discharge instead of WP and measured ice thickness instead of DDF) in logistic regression results in improved predictive power and statistical significance for HF (2 sided p-value < 0.05; using software provided in [72]); at the same time, logistic regression on HF alone clearly demonstrates how flood chances diminish as HF increases (Figure A1).
Figure A1. Variation of IJF probability with freezeup elevation, computed by single-variable logistic regression [72]. Peace Point gauge data 1962–2020; computed flood probabilities increase if reservoir-filling years 1968–1971 are excluded.
Sustainability 15 02103 g0a1

References

  1. WBNP. Development of a Multi-Jurisdiction Action Plan to Protect the World Heritage Values of Wood Buffalo National Park; Parks Canada: Fort Smith, Canada, 2019; ISBN R64-546/2019E-PDF. Available online: https://publications.gc.ca/site/eng/9.866972/publication.html (accessed on 14 January 2023).
  2. Parks Canada. The Peace-Athabasca Delta. 2022. Available online: https://www.ibacanada.ca/site.jsp?siteID=AB002 (accessed on 12 January 2023).
  3. Smith, D.G.; Hubbard, S.M.; Lavigne, J.; Leckie, D.A.; Fustic, M. Stratigraphy of counter-point-bar and eddy-accretion deposits in low-energy meander belts of the Peace-Athabasca Delta, Northeast Alberta, Canada. In River to Rock Record: The Preservation of Fluvial Sediments and their Subsequent Interpretation; SEPM Special Publication No. 97; Society for Sedimentary Geology: Broken Arrow, OK, USA, 2011; pp. 143–152. [Google Scholar]
  4. Peace-Athabasca Delta Project Group. The Peace-Athabasca Delta, A Canadian Resource; Summary Report; The Peace-Athabasca Delta Project Group: Saskatchewan, AB, Canada, 1972; 144p. [Google Scholar]
  5. Peace-Athabasca Delta Project Group. Peace-Athabasca Delta Project; Technical Report; The Peace-Athabasca Delta Project Group: Saskatchewan, AB, Canada, 1973; 176p. [Google Scholar]
  6. Prowse, T.D.; Aitken, B.; Demuth, M.N.; Peterson, M. Strategies for restoring spring flooding to a drying northern delta. Regul. Rivers Res. Manag. 1996, 12, 237–250. [Google Scholar] [CrossRef]
  7. Prowse, T.D.; Peters, D.; Beltaos, S.; Pietroniro, A.; Romolo, L.; Töyrä, J.; Leconte, R. Restoring Ice-jam Floodwater to a Drying Delta Ecosystem. Water Int. 2002, 27, 58–69. [Google Scholar] [CrossRef]
  8. Peters, D.L. Controls on the Persistence of Water in Perched Basins of the Peace-Athabasca Delta, Northern Canada. Ph.D. Thesis, Trent University, Peterborough, ON, Canada, 2003. [Google Scholar]
  9. Peters, D.L.; Prowse, T.D.; Pietroniro, A.; Leconte, R. Flood hydrology of the Peace-Athabasca Delta, northern Canada. Hydrol. Process. 2006, 20, 4073–4096. [Google Scholar] [CrossRef]
  10. Ward, E.M.; Gorelick, S.M. Drying drives decline in muskrat population in the Peace-Athabasca Delta, Canada. Environ. Res. Lett. 2018, 13, 124026. [Google Scholar] [CrossRef]
  11. Ward, E.M.; Wysong, K.; Gorelick, S.M. Drying landscape and interannual herbivory-driven habitat degradation control semiaquatic mammal population dynamics. Ecohydrology 2020, 13, e2169. [Google Scholar] [CrossRef]
  12. Ward, E.M.; Solari, K.A.; Varudkar, A.; Gorelick, S.M.; Hadly, E.A. Muskrats as a bellwether of a drying delta. Nat. Commun Biol. 2021, 4, 750. [Google Scholar] [CrossRef] [PubMed]
  13. Jasek, M.; Pryse-Phillips, A. Influence of the proposed site C hydroelectric project on the ice regime of the Peace River. Can. J. Civ. Eng. 2015, 42, 645–655. [Google Scholar] [CrossRef]
  14. UNESCO. Reactive Monitoring Mission (RMM) to Wood Buffalo National Park, Canada. Mission Report March 2017. UNESCO World Heritage Centre—WHC International Union for Conservation of Nature (IUCN). 2017. Available online: http://whc.unesco.org/en/documents/156893 (accessed on 14 January 2023).
  15. Independent Environmental Consultants (IEC). Strategic Environmental Assessment of Potential Cumulative Impacts of All Developments on the World Heritage Values of Wood Buffalo National Park; Final SEA Report; Independent Environmental Consultants (IEC): Markham, ON, Canada, 2018; Volume 1, 247p. [Google Scholar]
  16. Peterson, M.; Courtorielle, W. Flood history study, Peace/Athabasca Delta, Wood Buffalo National Park; Data Report 92—14/WB; Parks Canada: Fort Chipewyan, AB, Canada, 1992; p. 62. [Google Scholar]
  17. Thomson, S. Peace-Athabasca Delta Flood History. In Historical Services, Prairie & Northern Region Documentary Information; Appended to Report by Peterson and Courtorielle: Fort Chipewyan, AB, Canada, 1992. [Google Scholar]
  18. Peterson, M. Peace–Athabasca Flood History Study. In Peace–Athabasca Delta Technical Studies, Task F.1—Flood History; Peace–Athabasca Delta Technical Studies, Communications: Fort Chipewyan, AB, Canada, 1995; p. 32. [Google Scholar]
  19. Prowse, T.D.; Conly, F.M. Effects of climatic variability and flow regulation on ice-jam flooding of a northern delta. Hydrol. Process. 1998, 12, 1589–1610. [Google Scholar] [CrossRef]
  20. Beltaos, S. Numerical modelling of ice-jam flooding on the Peace-Athabasca Delta. Hydrol. Process. 2003, 17, 3685–3702. [Google Scholar] [CrossRef]
  21. Marsh, P.; Lesack, L.; Roberts, A. The environmental effects of ice jam flooding on lakes in the Mackenzie Delta. In Proceedings of the Workshop on Environmental Aspects of River Ice; Prowse, T.D., Ed.; NHRI Symposium Series No. 12; National Hydrology Research Institute: Saskatoon, SK, Canada, 1993; pp. 359–381. [Google Scholar]
  22. Zhang, F.; Elshamy, M.; Lindenschmidt, K.-E. Climate change impacts on ice jam behavior in an inland delta: A new ice jam projection framework. Clim. Chang. 2022, 171, 1–18. [Google Scholar] [CrossRef]
  23. Abu, R. Knowledge, use, and change in the Saskatchewan River Delta: Assessing the changing livelihoods of Cumberland House Métis and Cree Nation. Ph.D. Thesis, University of Saskatchewan, Saskatoon, SK, Canada, 2017; 166p. [Google Scholar]
  24. PFSRB (Partners for the Saskatchewan River Basin). From the Mountains to the Sea: The State of the Saskatchewan River Basin. Saskatoon. 2009. Available online: http://www.saskriverbasin.ca/pages/state_of_the_basin_report.html (accessed on 14 January 2023).
  25. Prowse, T.D.; Lalonde, V. Open-Water and Ice-Jam Flooding of a Northern Delta. Hydrol. Res. 1996, 27, 85–100. [Google Scholar] [CrossRef]
  26. Timoney, K.P. The Peace-Athabasca Delta: Portrait of a Dynamic Ecosystem; The University of Alberta Press: Edmonton, AB, Canada, 2013; Available online: www.uap.ualberta.ca (accessed on 14 January 2023).
  27. Peters, D.L.; Buttle, J.M. The effects of flow regulation and climatic variability on obstructed drainage and reverse flow contribution in a Northern river-lake-Delta complex, Mackenzie basin headwaters. River Res. Appl. 2010, 26, 1065–1089. [Google Scholar] [CrossRef]
  28. Pariset, E.; Hausser, R.; Gagnon, A. Formation of ice covers and ice jams in rivers. J. Hydraul. Div. 1966, 92, 1–24. [Google Scholar] [CrossRef]
  29. Beltaos, S. (Ed.) River Ice Jams; Water Resources Publications: Highlands Ranch, CO, USA, 1995. [Google Scholar]
  30. Beltaos, S. (Ed.) River Ice Breakup; Water Resources Publications: Highlands Ranch, CO, USA, 2008. [Google Scholar]
  31. Ashton, G.D. (Ed.) River and Lake Ice Engineering; Water Resources Publications: Littleton, CO, USA, 1986. [Google Scholar]
  32. Ashton, G.D. River and lake ice thickening, thinning, and snow ice formation. Cold Reg. Sci. Technol. 2011, 68, 3–19. [Google Scholar] [CrossRef]
  33. Beltaos, S.; Bonsal, B. Climate change impacts on Peace River ice thickness and implications to ice-jam flooding of Peace-Athabasca Delta, Canada. Cold Reg. Sci. Technol. 2021, 186, 103279. [Google Scholar] [CrossRef]
  34. GC (Government of Canada). Adjusted and Homogenized Canadian Climate Data. 2022. Available online: https://www.canada.ca/en/environment-climate-change/services/climate-change/science-research-data/climate-trends-variability/adjusted-homogenized-canadian-data.html (accessed on 6 January 2023).
  35. Beltaos, S.; Carter, T. Minor 2020 ice jamming in lower Peace River despite extreme breakup flows: Assessment of hydroclimatic controls. In Proceedings of the CGU HS Committee on River Ice Processes and the Environment 21st Workshop on the Hydraulics of Ice Covered Rivers, Saskatoon, SK, Canada, 29 August–1 September 2021. [Google Scholar]
  36. Maclean, B.; Bampfylde, C.; Lepine, M.; Tssessaze, L. Towards a Rights-Based Ice Monitoring Trigger. In Proceedings of the CGU HS Committee on River Ice Processes and the Environment 21st Workshop on the Hydraulics of Ice Covered Rivers, Saskatoon, SK, Canada, 29 August–1 September 2021; Available online: http://www.cripe.ca/docs/proceedings/21/Maclean-et-al-2021.pdf (accessed on 14 January 2023).
  37. Lei, R.; Leppäranta, M.; Cheng, B.; Heil, P.; Li, Z. Changes in ice-season characteristics of a European Arctic lake from 1964 to 2008. Clim. Chang. 2012, 115, 725–739. [Google Scholar] [CrossRef]
  38. Timoney, K.P. Three centuries of change in the Peace–Athabasca Delta, Canada. Clim. Chang. 2009, 93, 485–515. [Google Scholar] [CrossRef]
  39. Remmer, C.R.; Neary, L.K.; Kay, M.L.; Wolfe, B.B.; I Hall, R. Multi-year isoscapes of lake water balances across a dynamic northern freshwater delta. Environ. Res. Lett. 2020, 15, 104066. [Google Scholar] [CrossRef]
  40. Garner, L.A.; Fonstad, G.D.; Quazi, M.E. Assessment of Creed Creek Diversion; Alberta Department of the Environment, Technical Services division: Edmonton, AB, Canada, 1986; 22p. [Google Scholar]
  41. DeBoer, A.; Winhold, T.; Garner, L. Embarras river breakthrough to Mamawi Creek (task d.2). In Peace-Athabasca Delta Technical Studies; Technical Services & Monitoring Division, Alberta Environmental Protection: Edmonton, AB, Canada, 1994; 92p. [Google Scholar]
  42. Kay, M.L.; A Wiklund, J.; Remmer, C.R.; Neary, L.K.; Brown, K.; Ghosh, A.; MacDonald, E.; Thomson, K.; Vucic, J.M.; Wesenberg, K.; et al. Bi-directional hydrological changes in perched basins of the Athabasca Delta (Canada) in recent decades caused by natural processes. Environ. Res. Commun. 2019, 1, 081001. [Google Scholar] [CrossRef] [Green Version]
  43. Eum, H.-I.; Dibike, Y.; Prowse, T. Climate-induced alteration of hydrologic indicators in the Athabasca River Basin, Alberta, Canada. J. Hydrol. 2017, 544, 327–342. [Google Scholar] [CrossRef]
  44. Rokaya, P.; Morales-Marin, L.A.; Bonsal, B.; Wheater, H.; Lindenschmidt, K.-E. Climatic effects on ice phenology and ice-jam flooding of the Athabasca River in western Canada. Hydrol. Sci. J. 2019, 64, 1265–1278. [Google Scholar] [CrossRef]
  45. Das, A. A Stochastic Modelling Approach to Improve Ice-Jam Flood Risk Management. Ph.D. Thesis, University of Saskatchewan, Saskatoon, SK, Canada, 2021. [Google Scholar]
  46. Peters, D.L.; Prowse, T.D. Regulation effects on the lower Peace River, Canada. Hydrol. Process. 2001, 15, 3181–3194. [Google Scholar] [CrossRef]
  47. Giroux, S. 1996 Peace–Athabasca Delta Flood Report; Wood Buffalo National Park: Fort Chipewyan, AB, Canada, 1997; p. 31. [Google Scholar]
  48. Giroux, S. 1997 Peace–Athabasca Delta Flood Report; Wood Buffalo National Park: Fort Chipewyan, AB, Canada, 1997; p. 6. [Google Scholar]
  49. Beltaos, S.; Prowse, T.D.; Carter, T. Ice regime of the lower Peace River and ice-jam flooding of the Peace-Athabasca Delta. Hydrol. Process. 2006, 20, 4009–4029. [Google Scholar] [CrossRef]
  50. Beltaos, S.; Prowse, T.; Bonsal, B.; MacKay, R.; Romolo, L.; Pietroniro, A.; Toth, B. Climatic effects on ice-jam flooding of the Peace-Athabasca Delta. Hydrol. Process. 2006, 20, 4031–4050. [Google Scholar] [CrossRef]
  51. Beltaos, S.; Carter, T. Field studies of ice breakup and jamming in lower Peace River, Canada. Cold Reg. Sci. Technol. 2009, 56, 102–114. [Google Scholar] [CrossRef]
  52. Jasek, M. Peace River 2014 Break-up Sequence that led to the Ice Jam Flooding of the Peace-Athabasca Delta. In Proceedings of the CGU HS Committee on River Ice Processes and the Environment 19th Workshop on the Hydraulics of Ice Covered Rivers, Whitehorse, YT, Canada, 9–12 July 2017. [Google Scholar]
  53. Jasek, M. An emerging picture of Peace River break-up types that influence ice jam flooding of the Peace-Athabasca Delta part 1: The 2018 Peace River break-up. In Proceedings of the 20th Workshop on the Hydraulics of Ice Covered Rivers, Ottawa, ON, Canada, 14–16 May 2019. [Google Scholar]
  54. Jasek, M. An emerging picture of Peace River break-up types that influence ice jam flooding of the Peace-Athabasca Delta part 2: Insights from the comparison of the 2014 and 2018 break-ups. In Proceedings of the 20th Workshop on the Hydraulics of Ice Covered Rivers, Ottawa, ON, Canada, 14–16 May 2019. [Google Scholar]
  55. MCFN-ACFN CBM (Mikisew Cree and Athabasca Chipewyan Community Based Program). 2012–2020 Ice Monitoring Report; Mikisew Cree and Athabasca Chipewyan First Nations: Fort Chipewyan, AB, Canada, 2020; p. 31. [Google Scholar]
  56. Beltaos, S.; Peters, D.L. Naturalizing the freezeup regimes of regulated rivers and exploring implications to spring ice-jam flooding. Hydrol. Process. 2021, 35, e14321. [Google Scholar] [CrossRef]
  57. Beltaos, S.; Peters, D.L. Naturalized flow regime of the regulated Peace River, Canada, during the spring breakup of the ice cover. Cold Reg. Sci. Technol. 2020, 172, 103005. [Google Scholar] [CrossRef]
  58. Beltaos, S. Ice-jam flood regime of the Peace-Athabasca Delta: Update in light of the 2014 event. Cold Reg. Sci. Technol. 2019, 165, 102791. [Google Scholar] [CrossRef]
  59. Beltaos, S. Comparing the impacts of regulation and climate on ice-jam flooding of the Peace-Athabasca Delta. Cold Reg. Sci. Technol. 2014, 108, 49–58. [Google Scholar] [CrossRef]
  60. Lamontagne, J.R.; Jasek, M.; Smith, J.D. Coupling physical understanding and statistical modeling to estimate ice jam flood frequency in the northern Peace-Athabasca Delta under climate change. Cold Reg. Sci. Technol. 2021, 192, 103383. [Google Scholar] [CrossRef]
  61. Rokaya, P.; Wheater, H.; Lindenschmidt, K.-E. Promoting Sustainable Ice-Jam Flood Management along the Peace River and Peace-Athabasca Delta. J. Water Resour. Plan. Manag. 2019, 145, 04018085. [Google Scholar] [CrossRef]
  62. Prowse, T.D.; Demuth, M.; Peterson, M. Environmental aspects of river ice jamming on the Peace-Athabasca Delta. In Proceedings of the 7th Workshop on the Hydraulics of Ice Covered Rivers, 18–20 August 1993; NHRI Symposium Series No. 12; Saskatoon, SK, Canada, 1993. pp. 333–337.
  63. Timoney, K.; Smith, J.; Lamontagne, J.R.; Jasek, M. Discussion of “Frequency of ice-jam flooding of Peace-Athabasca Delta”. Can. J. Civ. Eng. 2019, 46, 239–242. [Google Scholar] [CrossRef]
  64. Hall, R.I.; Wolfe, B.B.; Wiklund, J.A. Discussion of “Frequency of ice jam flooding of Peace-Athabasca Delta”. Can. J. Civ. Eng. 2019, 46, 236–238. [Google Scholar] [CrossRef]
  65. Beltaos, S. Frequency of ice-jam flooding of Peace-Athabasca Delta. Can. J. Civ. Eng. 2018, 45, 71–75. [Google Scholar] [CrossRef]
  66. Beltaos, S. Reply to discussions by Timoney et al. (2018) and Hall et al. (2018) on “Frequency of ice-jam flooding of Peace-Athabasca Delta”. Can. J. Civ. Eng. 2019, 46, 243–248. [Google Scholar] [CrossRef] [Green Version]
  67. Wolfe, B.B.; Hall, R.; Last, W.M.; Edwards, T.W.D.; English, M.C.; Karst-Riddoch, T.L.; Paterson, A.; Palmini, R. Reconstruction of multi-century flood histories from oxbow lake sediments, Peace-Athabasca Delta, Canada. Hydrol. Process. 2006, 20, 4131–4153. [Google Scholar] [CrossRef]
  68. Wolfe, B.B.; Hall, R.I.; Wiklund, J.A.; Kay, M.L. Past variation in Lower Peace River ice-jam flood frequency. Environ. Rev. 2020, 28, 209–217. [Google Scholar] [CrossRef] [Green Version]
  69. Beltaos, S.; Peters, D.L. Commentary on “Past variation in Lower Peace River ice-jam flood frequency” by Wolfe et al. Environ. Rev. 2020, 28, 560–566. [Google Scholar] [CrossRef]
  70. Wolfe, B.B.; Hall, R.I.; Wiklund, J.A.; Kay, M.L. Response to Commentary by Beltaos and Peters on: “Past variation in Lower Peace River ice-jam flood frequency” by Wolfe et al. (2020). Environ. Rev. 2020, 28, 567–568. [Google Scholar] [CrossRef]
  71. Beltaos, S. Assessing the Frequency of Floods in Ice-Covered Rivers under a Changing Climate: Review of Methodology. Geosciences 2021, 11, 514. [Google Scholar] [CrossRef]
  72. Wessa, P. Bias Reduced Logistic Regression (v1.0.6) in Free Statistics Software (v1.2.1), Office for Research Development and Education. 2016. Available online: http://www.wessa.net/rwasp_logisticregression.wasp/ (accessed on 14 January 2023).
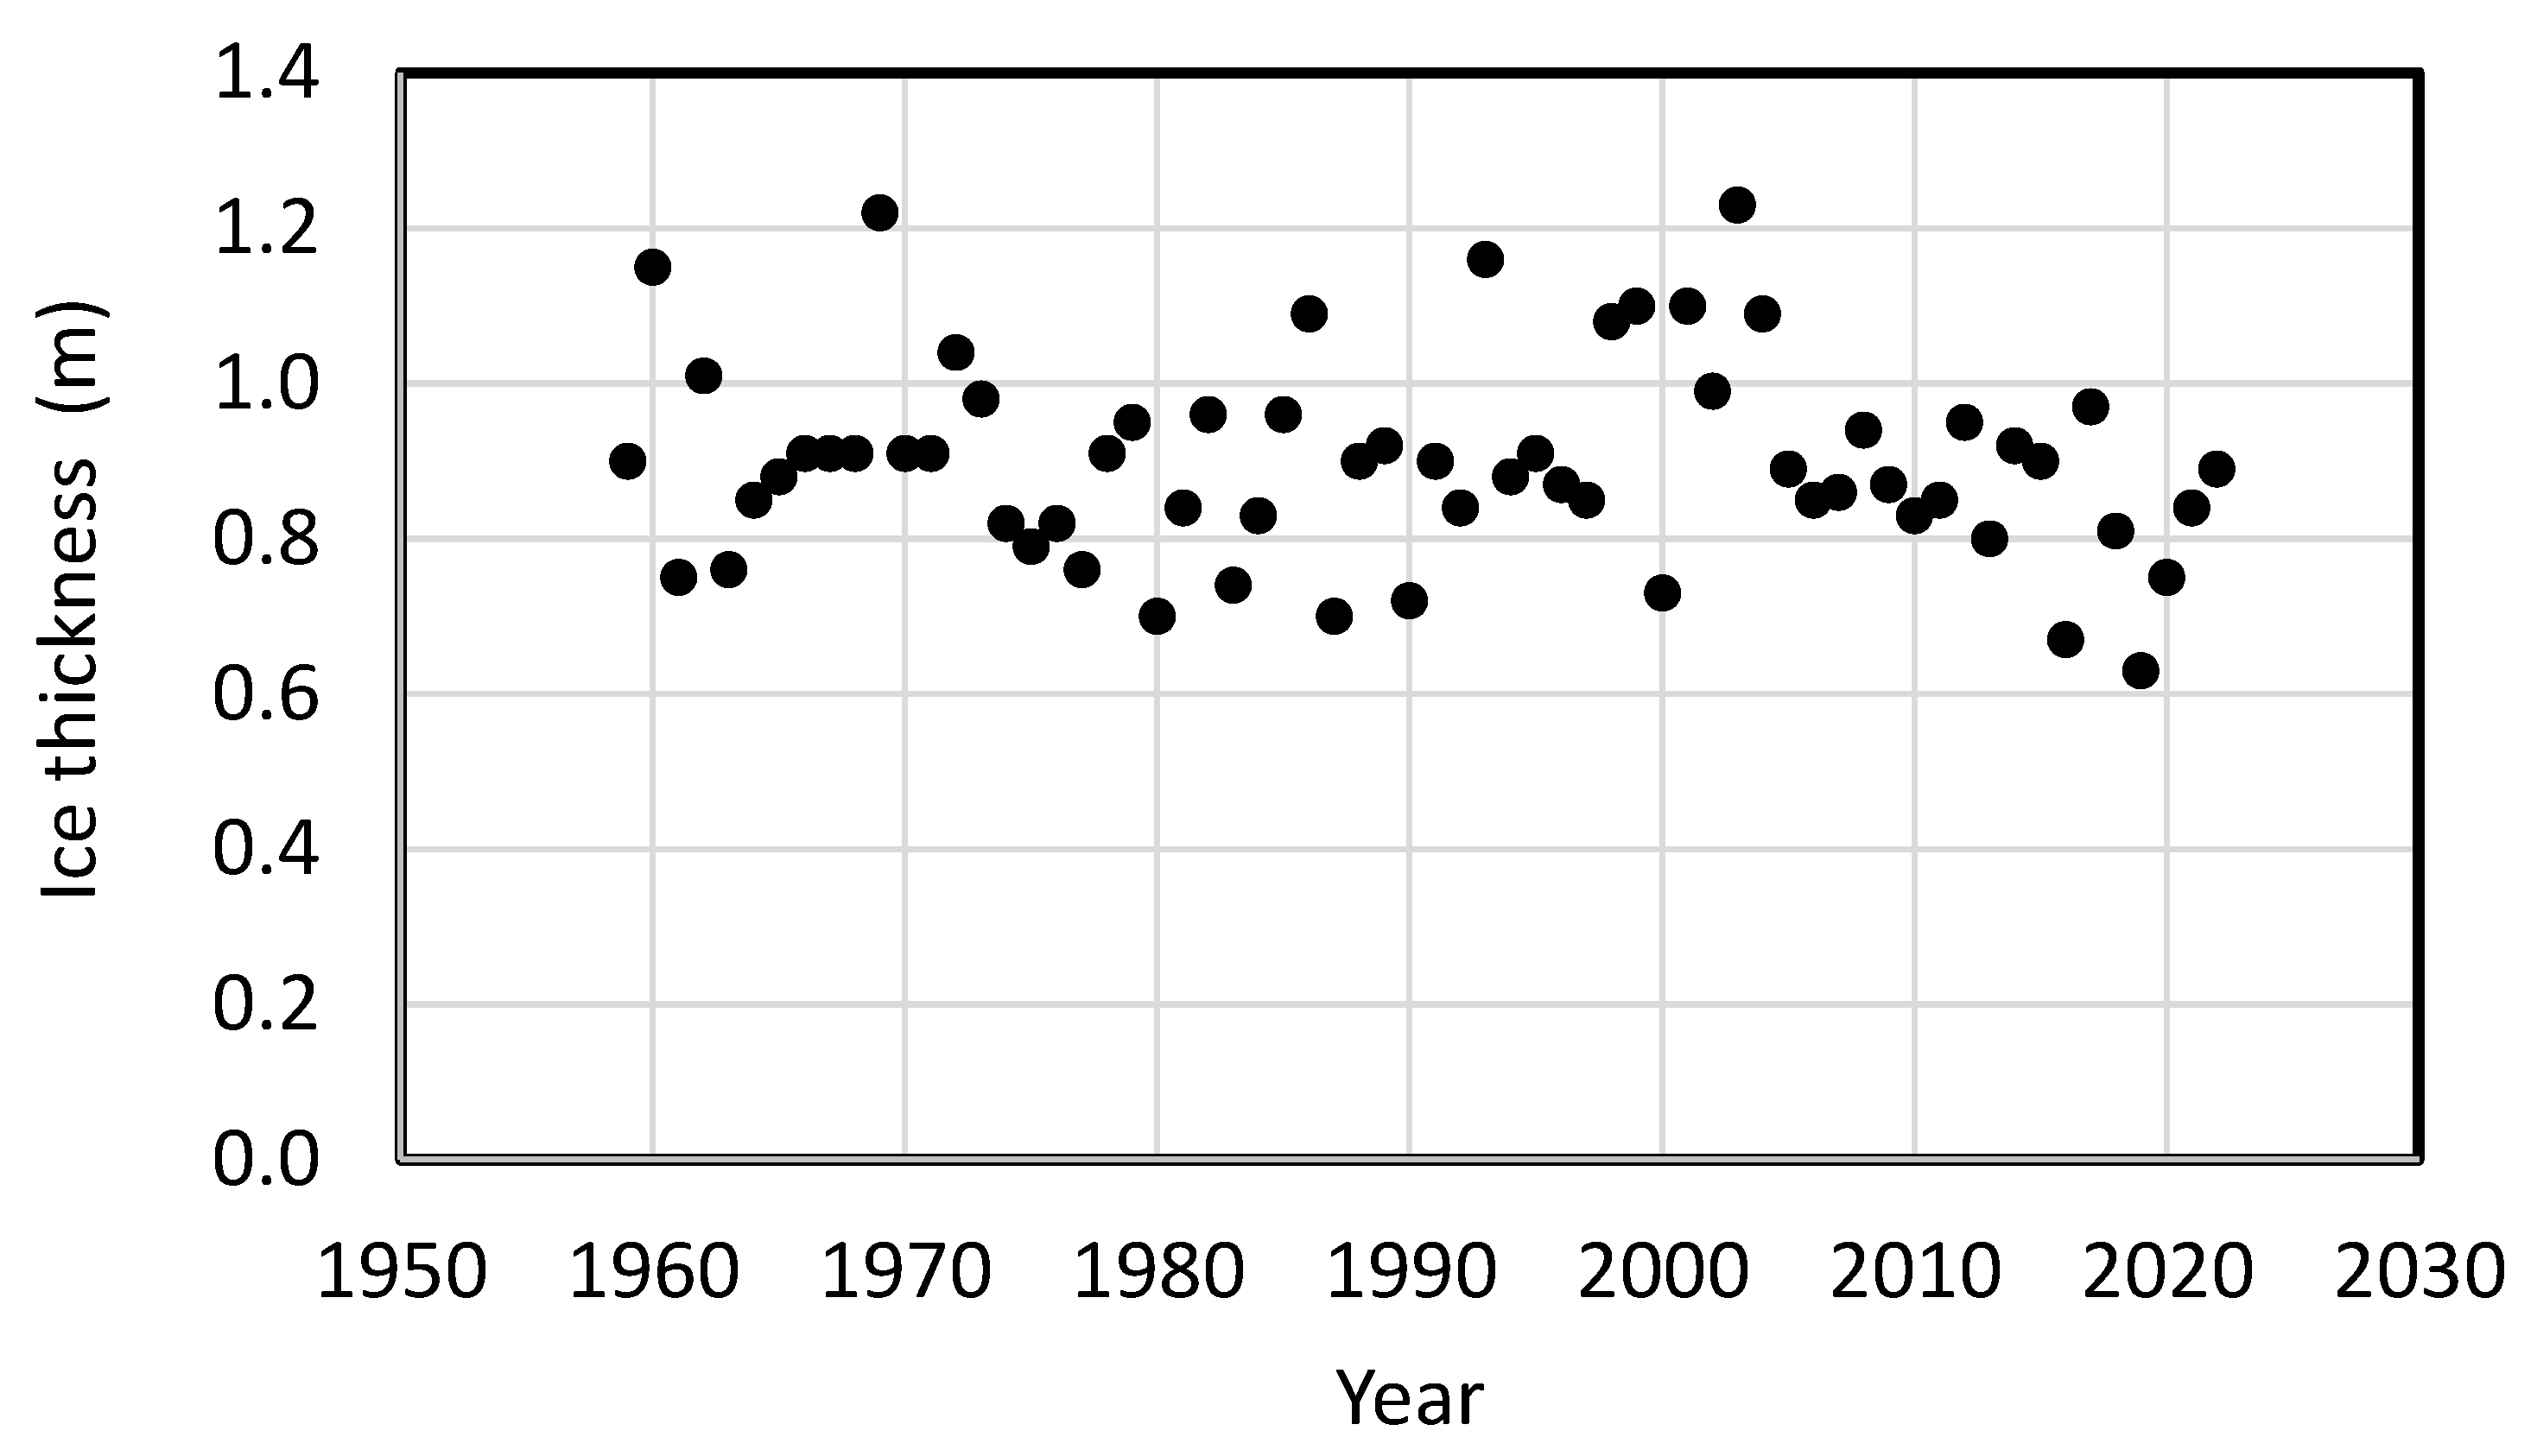
Figure 2. End-of-winter ice thickness at Peace Point, based on WSC records for hydrometric station No. 07KC001, and assessed according to the procedure described in [35]. Regulation commenced in 1968 and the reservoir was filled in 1971.
Sustainability 15 02103 g002
Figure 3. Relationship between Embarras and Athabasca River flows, based on corresponding hydrometric gauge records [Water Survey of Canada gauges 07DD003 (Embarras River below divergence; ~6.0 km below split) and 07DD001 (Athabasca River at Embarras airport; ~9.0 km above split)] (https://wateroffice.ec.gc.ca/, accessed on 18 July 2022).
Sustainability 15 02103 g003
Figure 4. Athabasca River meander cutoff near the Embarras River split. Adapted from a Sentinel image, dated 21 January 2022 Sentinel Playground|Sentinel Hub (sentinel-hub.com, accessed on 14 July 2022). The 1972 cutoff was initially relatively narrow, but widened over time to nearly match the width of the Athabasca River. The reverse has occurred along the meander loop.
Sustainability 15 02103 g004
Figure 5. Peace Point breakup flow-freezeup level diagram delineating regions of likely IJFs and non-flood events; red circles mark known IJFs. Arrows reflect uncertainty in the data and point to the direction in which the correct plotting position would be located. The dashed lines empirically delimit the area of relatively high flood probability and are subject to update as more events occur in the future. Reservoir-filling years (1968–1971) are excluded. From [56] with changes.
Sustainability 15 02103 g005
Disclaimer/Publisher’s Note: The statements, opinions and data contained in all publications are solely those of the individual author(s) and contributor(s) and not of MDPI and/or the editor(s). MDPI and/or the editor(s) disclaim responsibility for any injury to people or property resulting from any ideas, methods, instructions or products referred to in the content.