
Detection Framework of Abrupt Changes and Trends in Rainfall Erosivity in Three Gorges Reservoir, China


Abstract
Highlights
- Variations in the form of trends and abrupt changes are distinguished.
- Using the single-test method produced large uncertainty. Trend tests were performed separately from abrupt change tests to assess the long-term changes in rainfall erosivity series, which would result in the wrong conclusion.
Abstract
1. Introduction
2. Methods
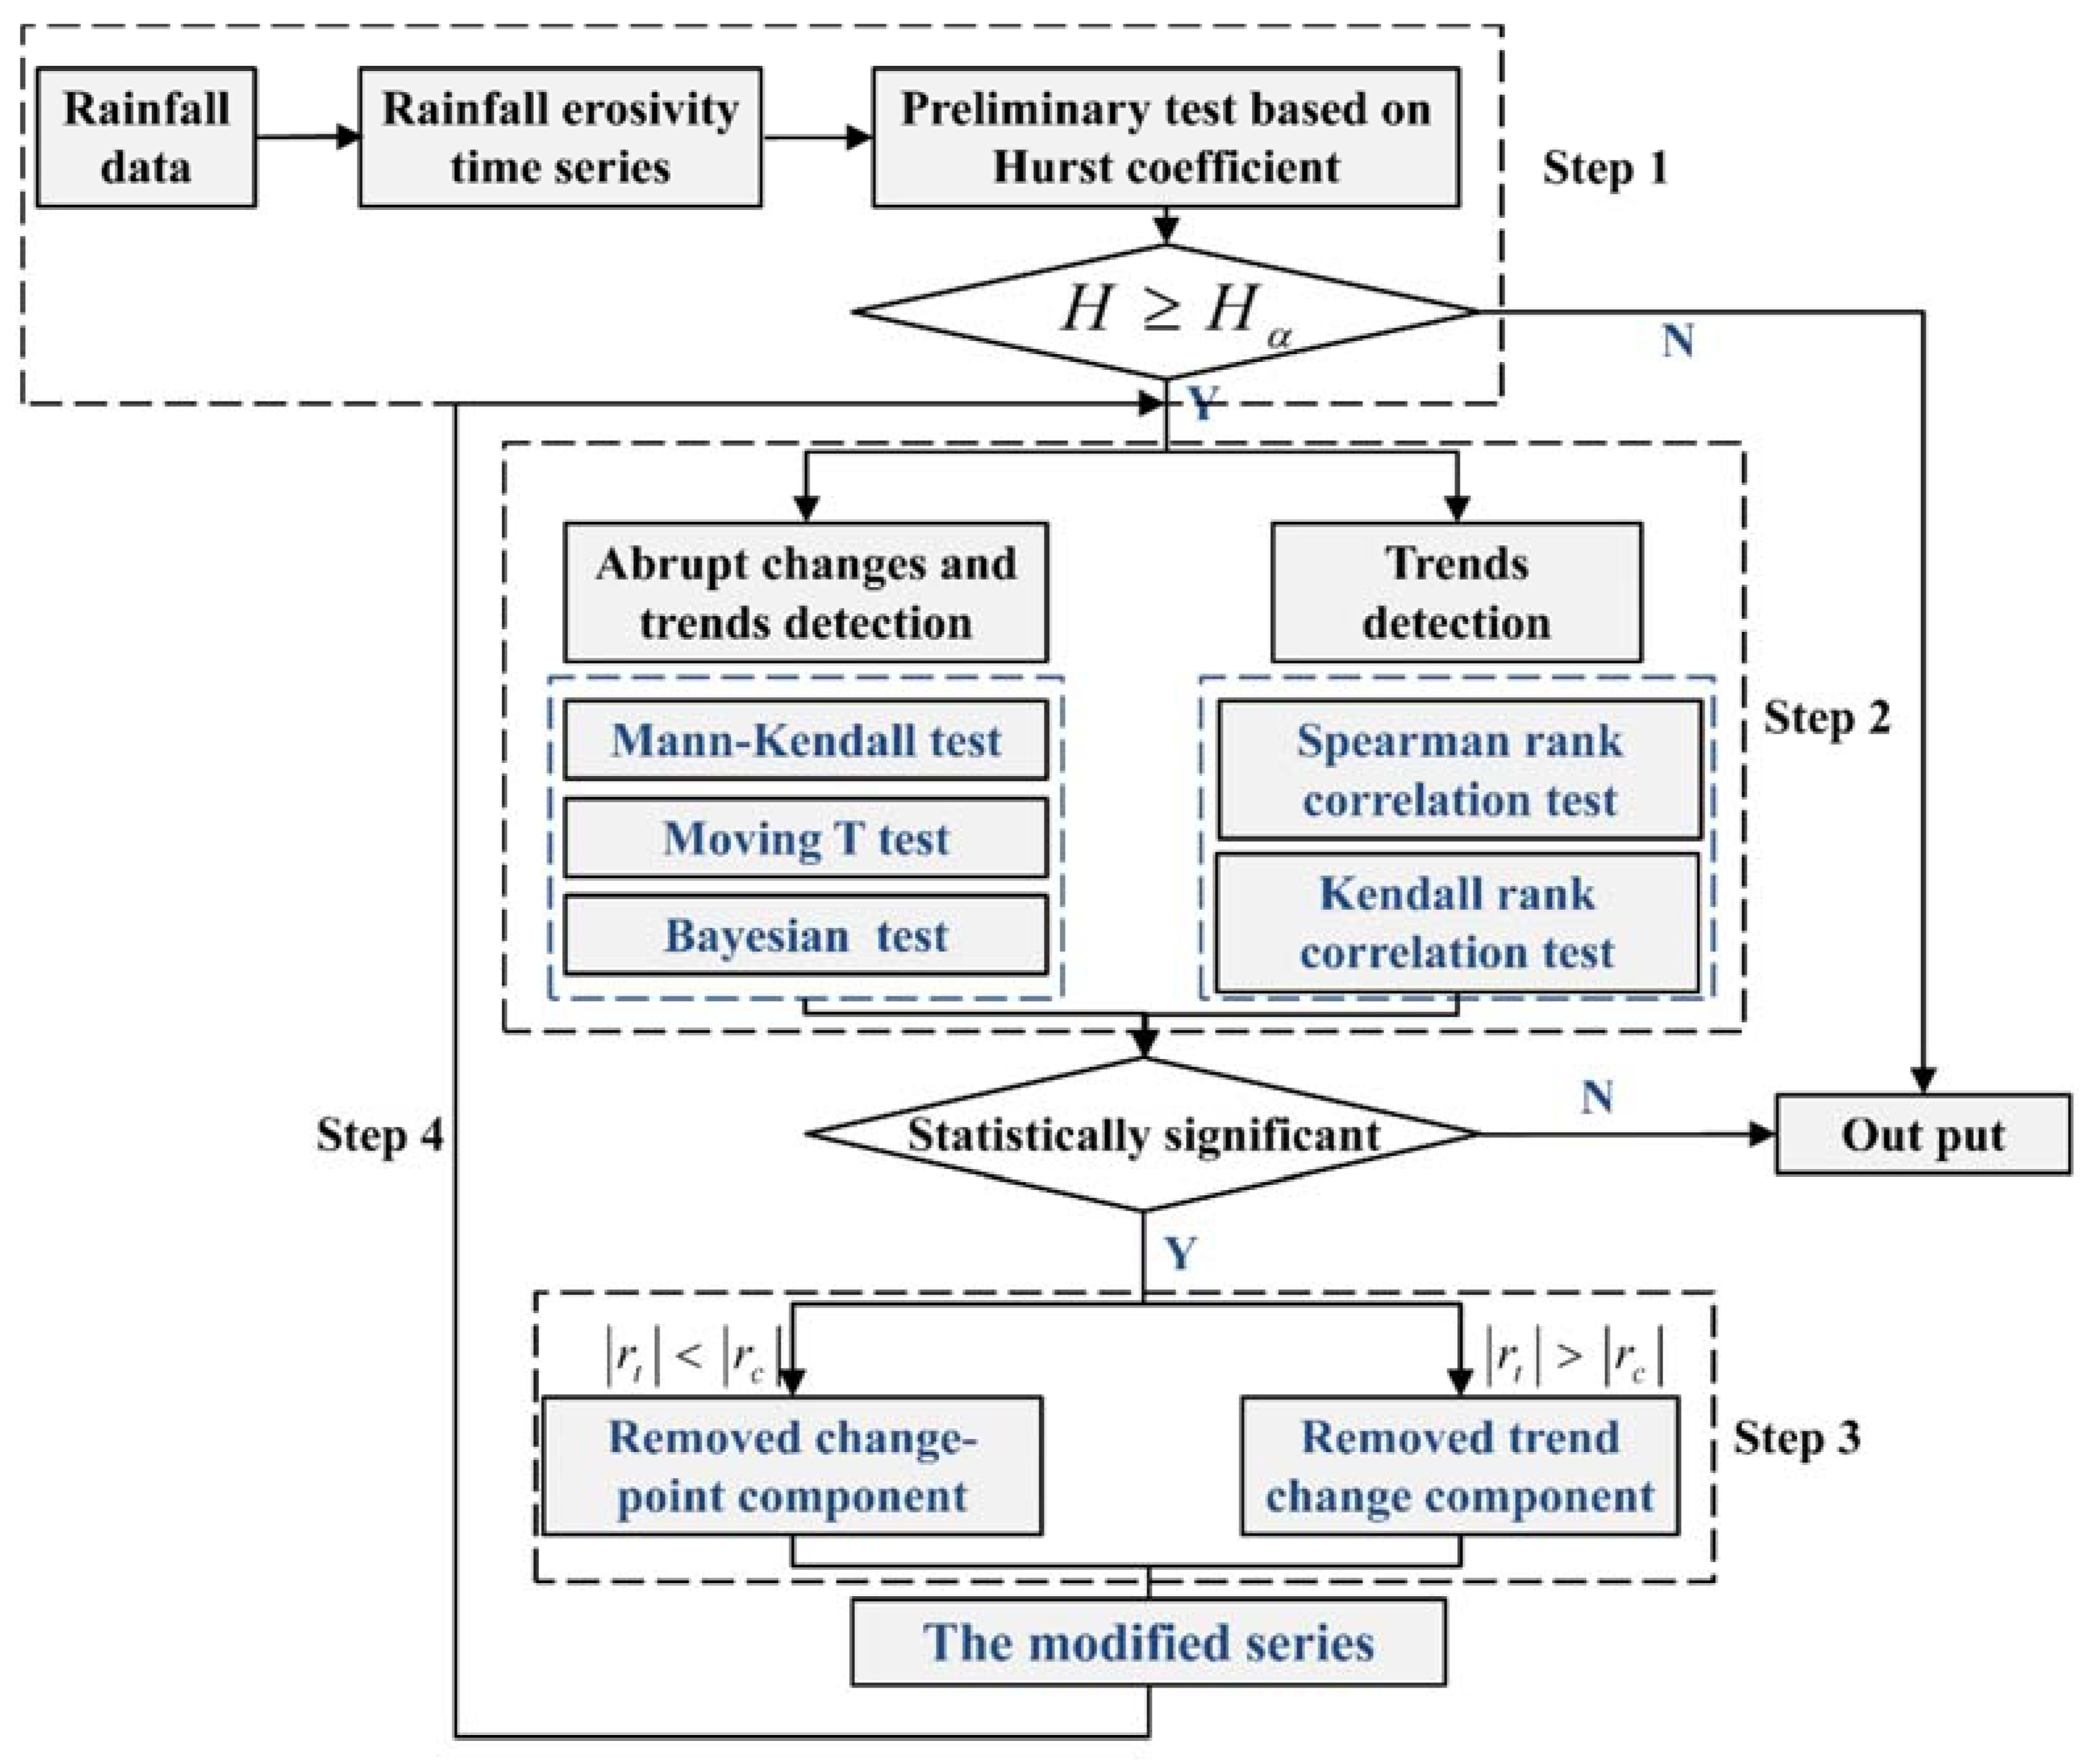
2.1. Methodological Framework
2.2. The Correlation Coefficient Method for Trend Detection
2.3. The Correlation Coefficient Method for Abrupt Changes Detection
3. Detection of Trends and Abrupt Changes in Rainfall Erosivity
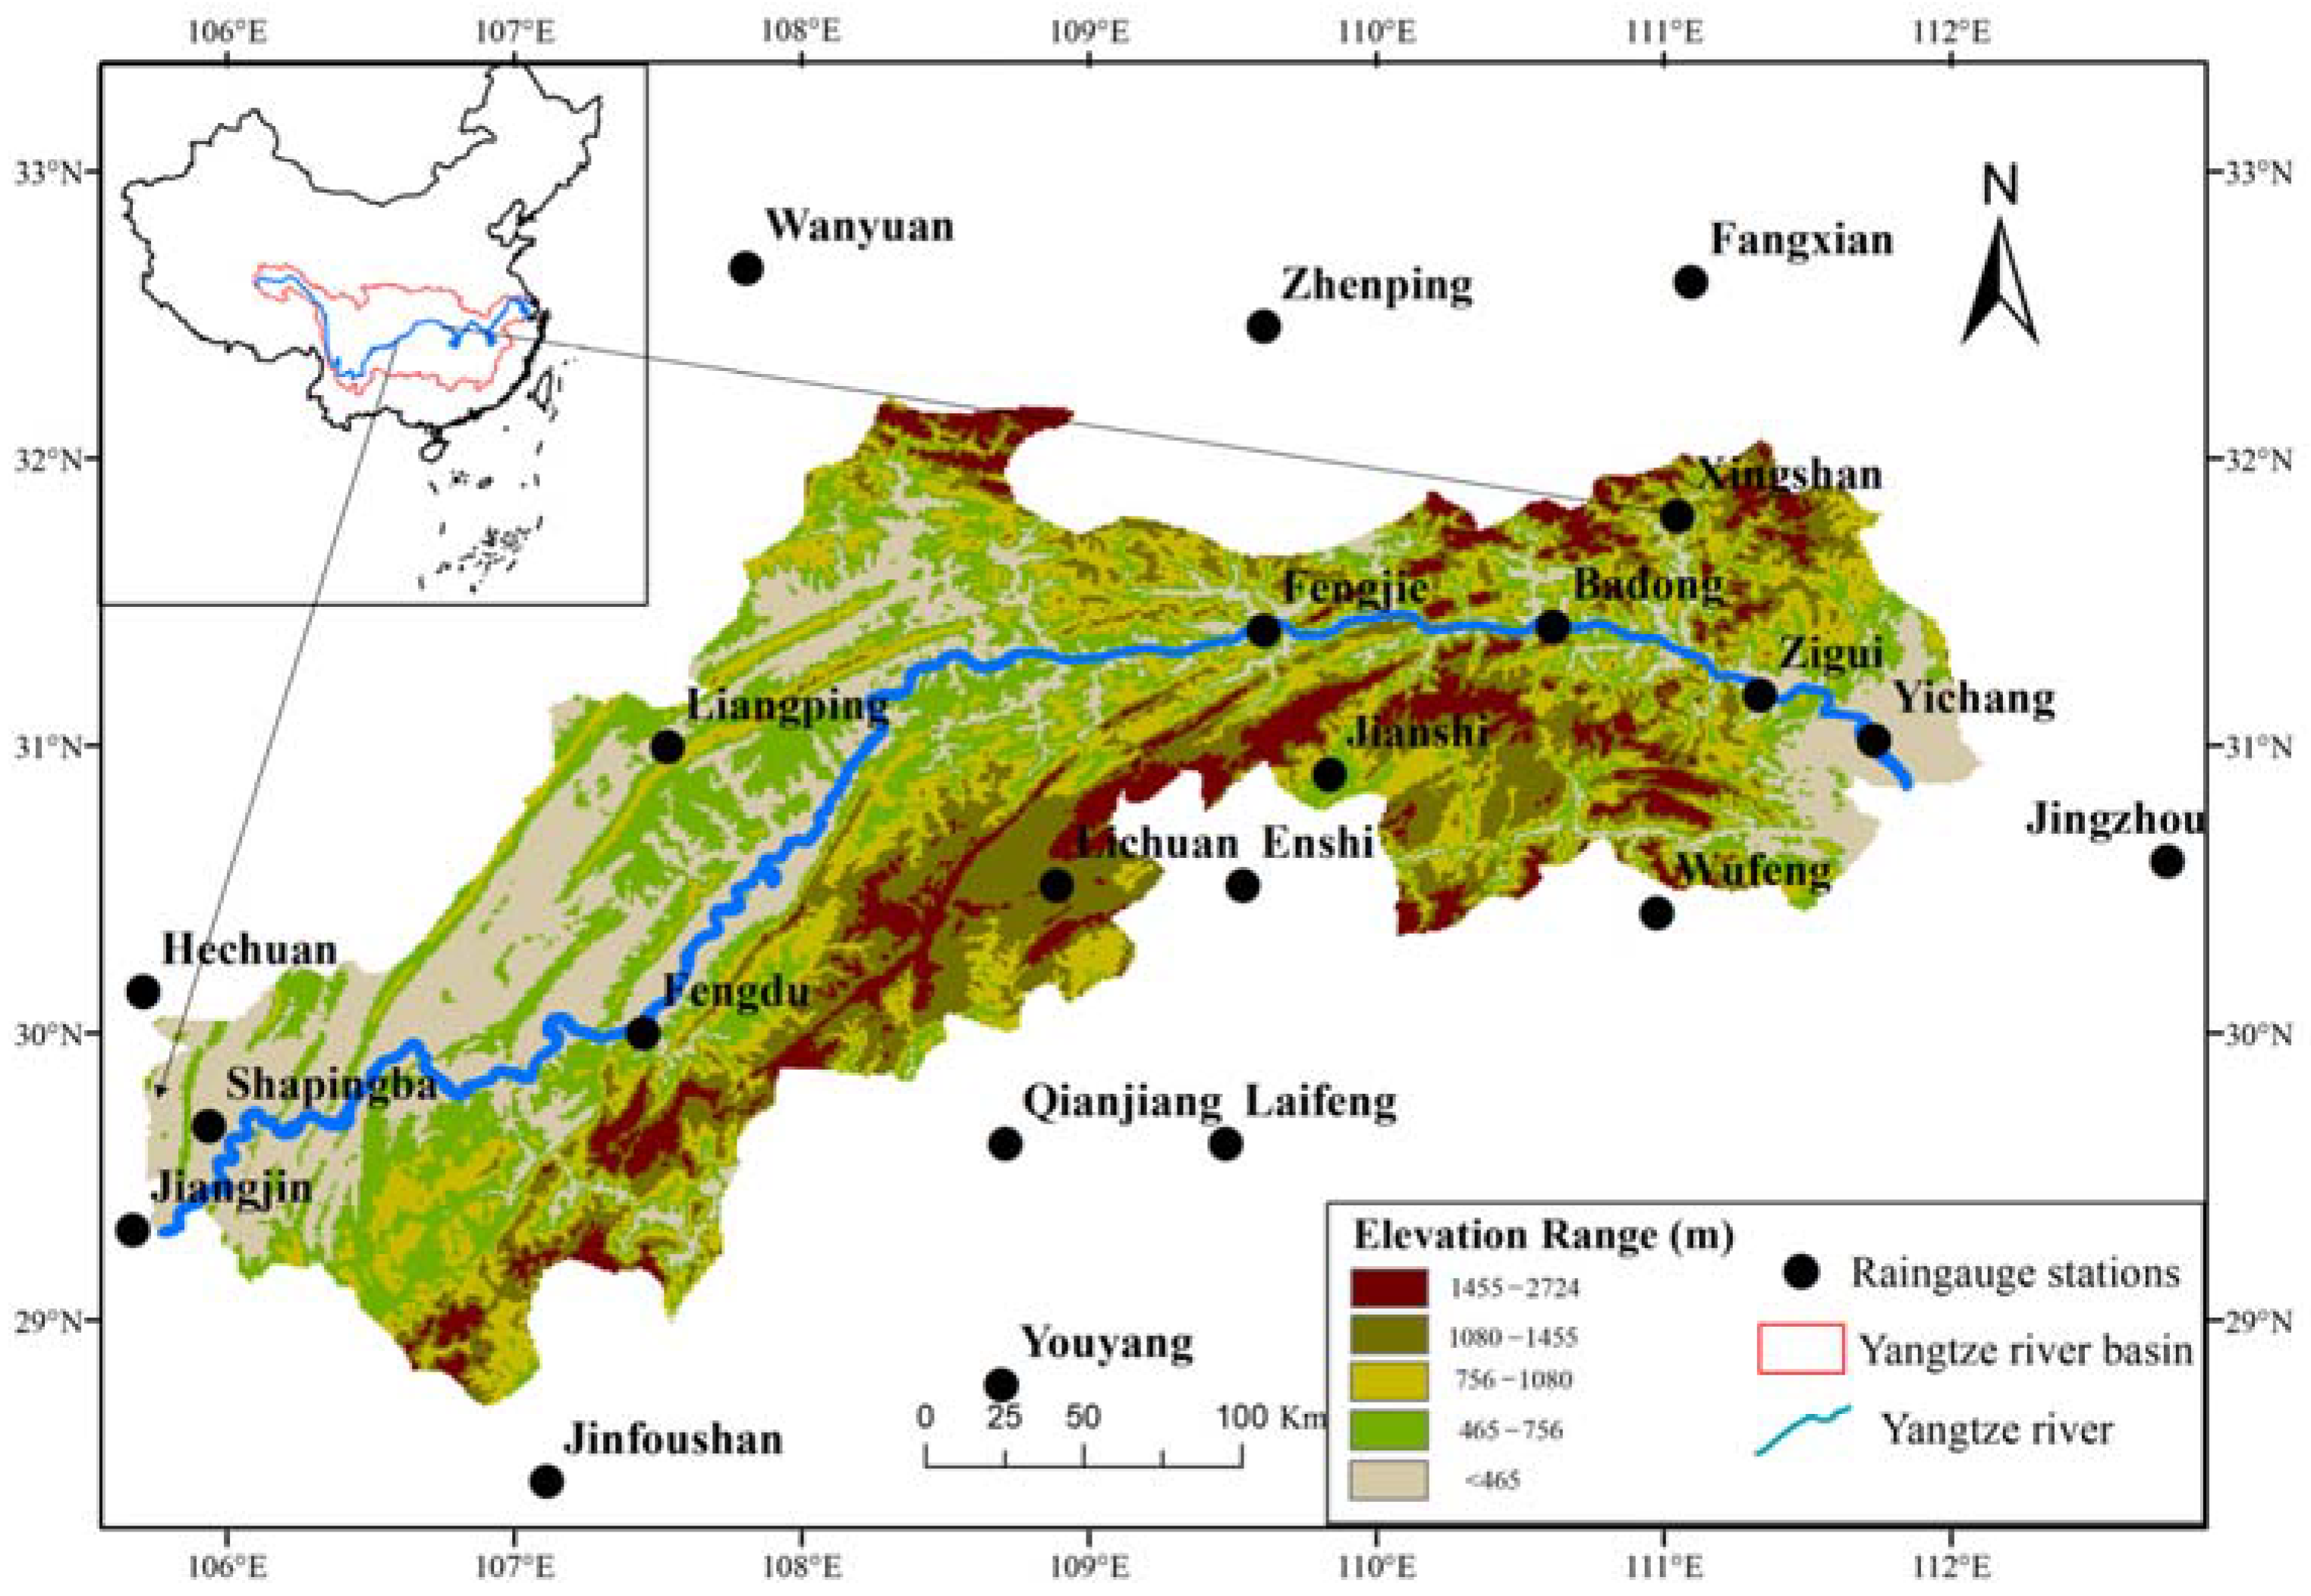
3.1. Study Area and Data Source
3.2. Rainfall Erosivity Estimation Method
3.3. Variations in Precipitation and Erosivity
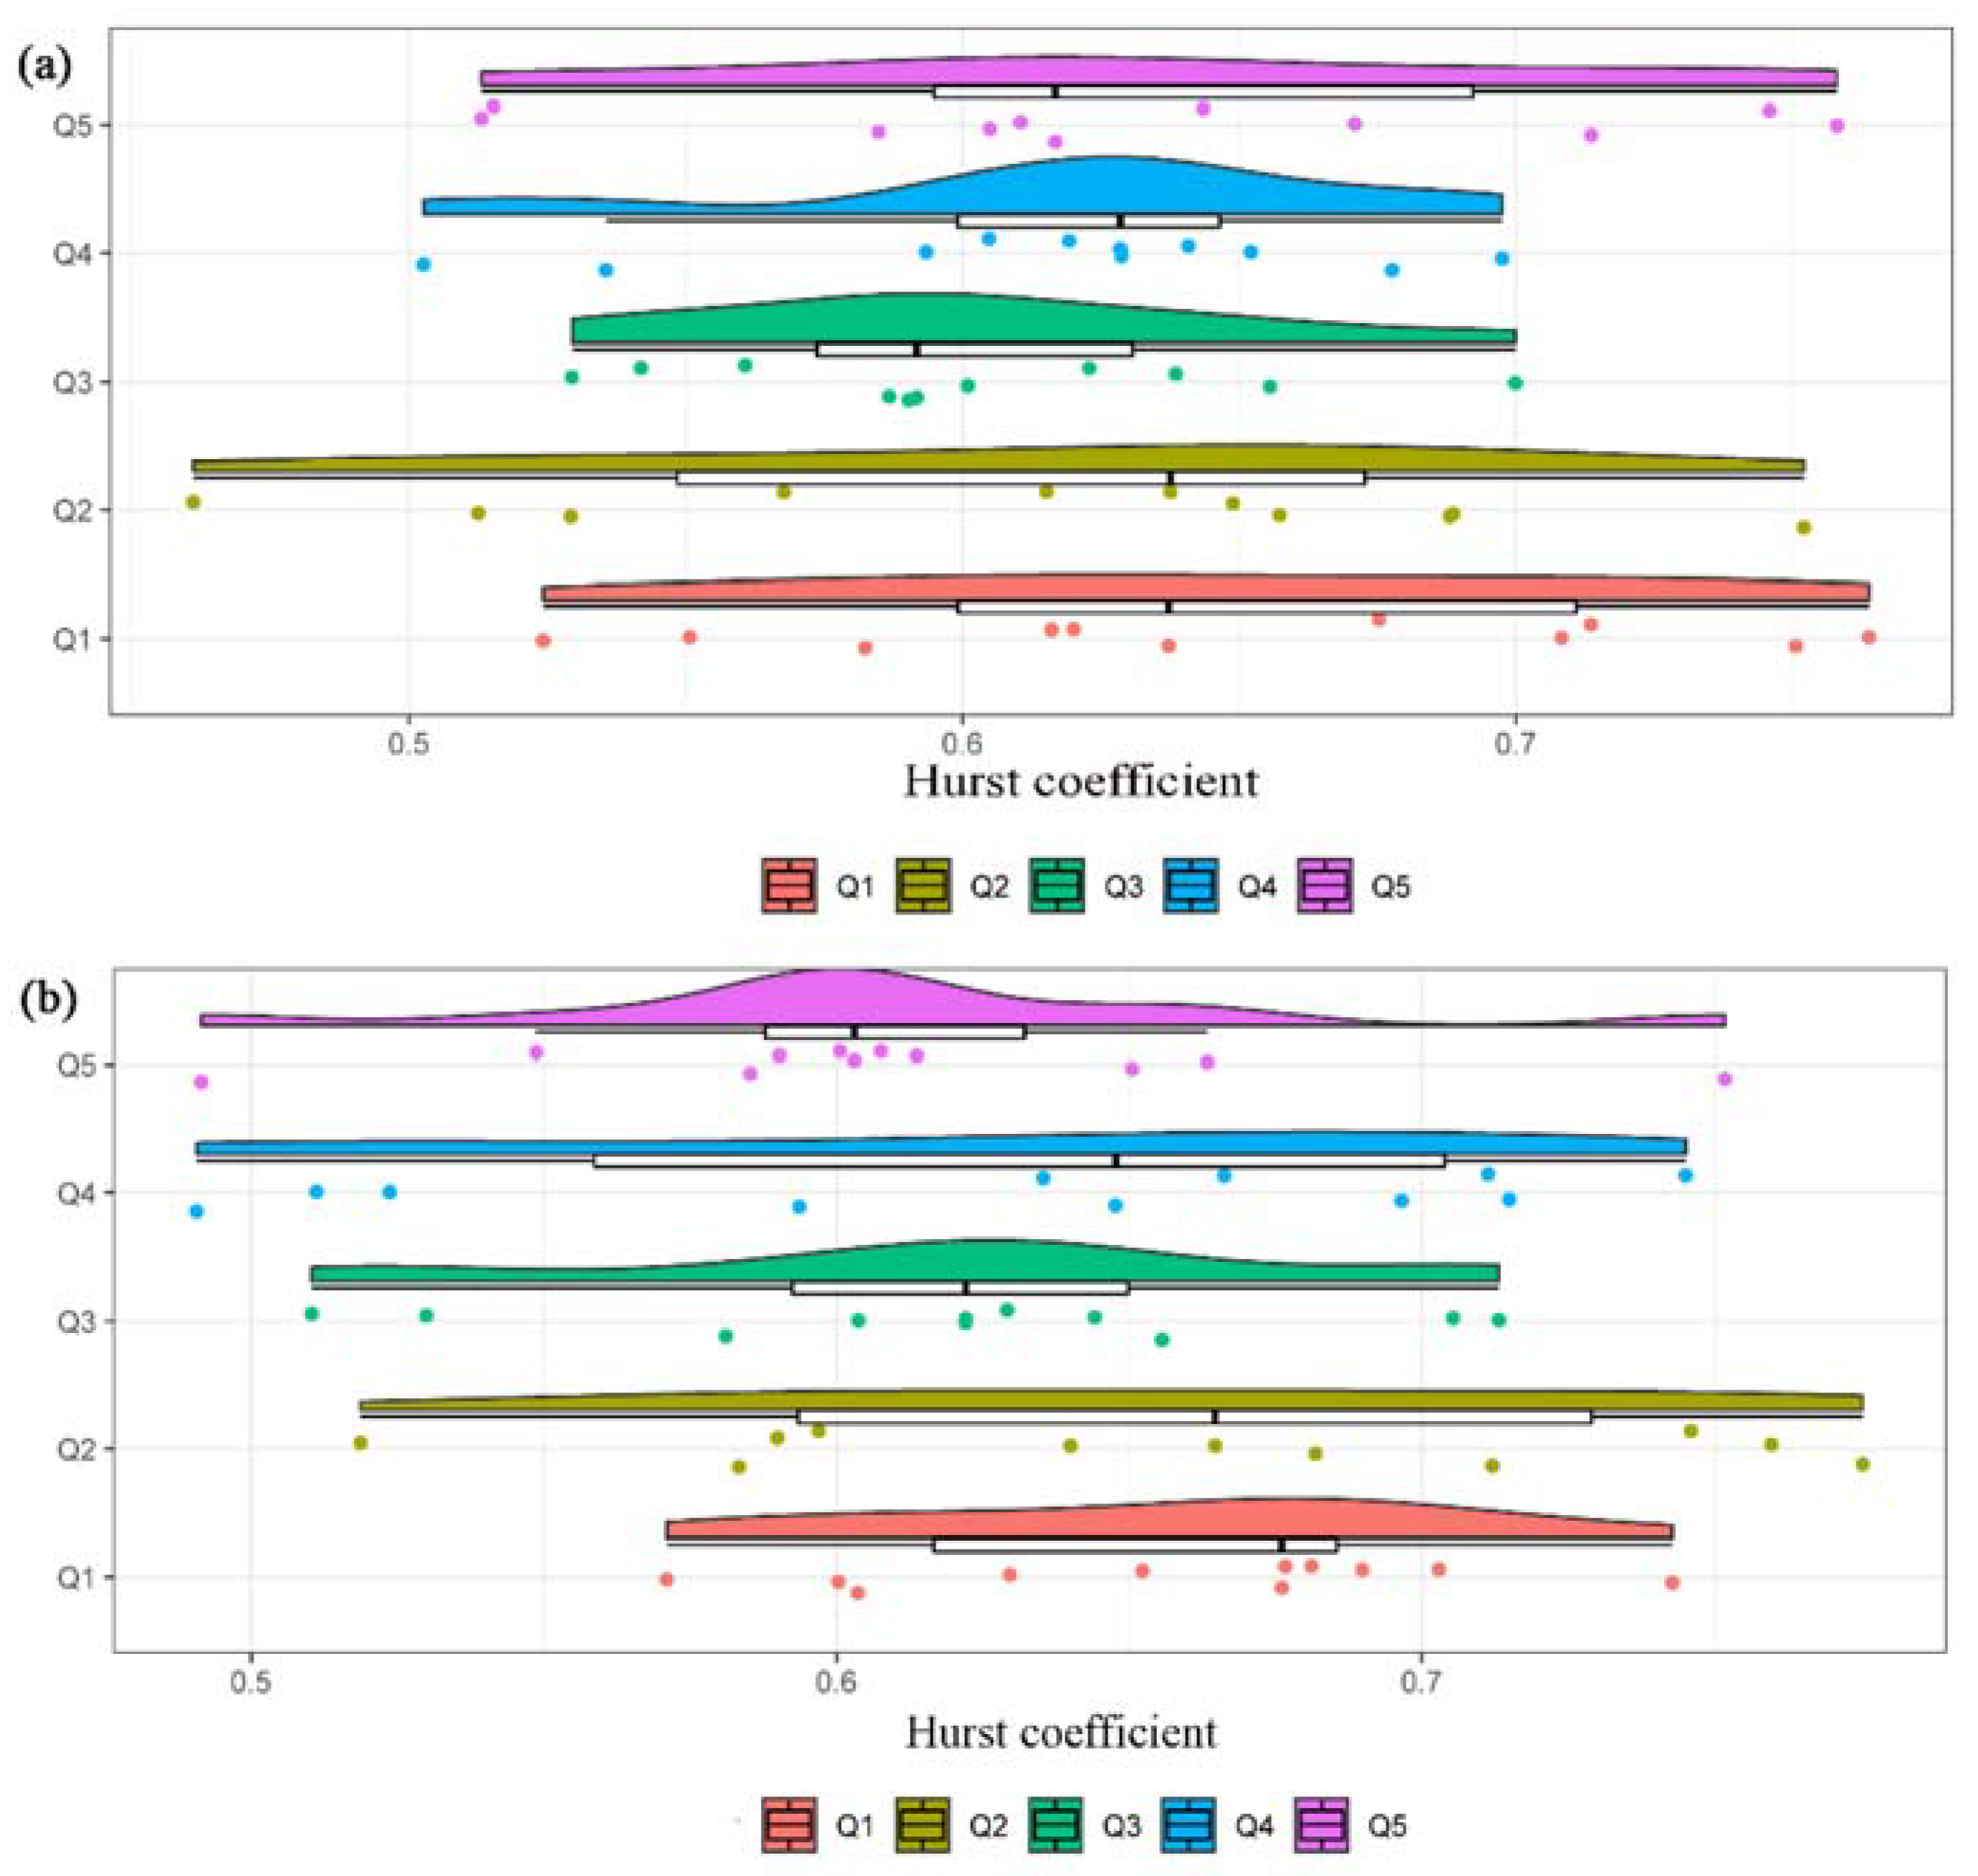
3.4. Five Quintiles in Erosive Rainfall
3.5. Trends and Abrupt Changes Analysis for Zigui Station
4. Discussion
4.1. Performance of the Detection Framework
4.2. Possible Causes for The Rainfall Erosivity Changes
5. Conclusions
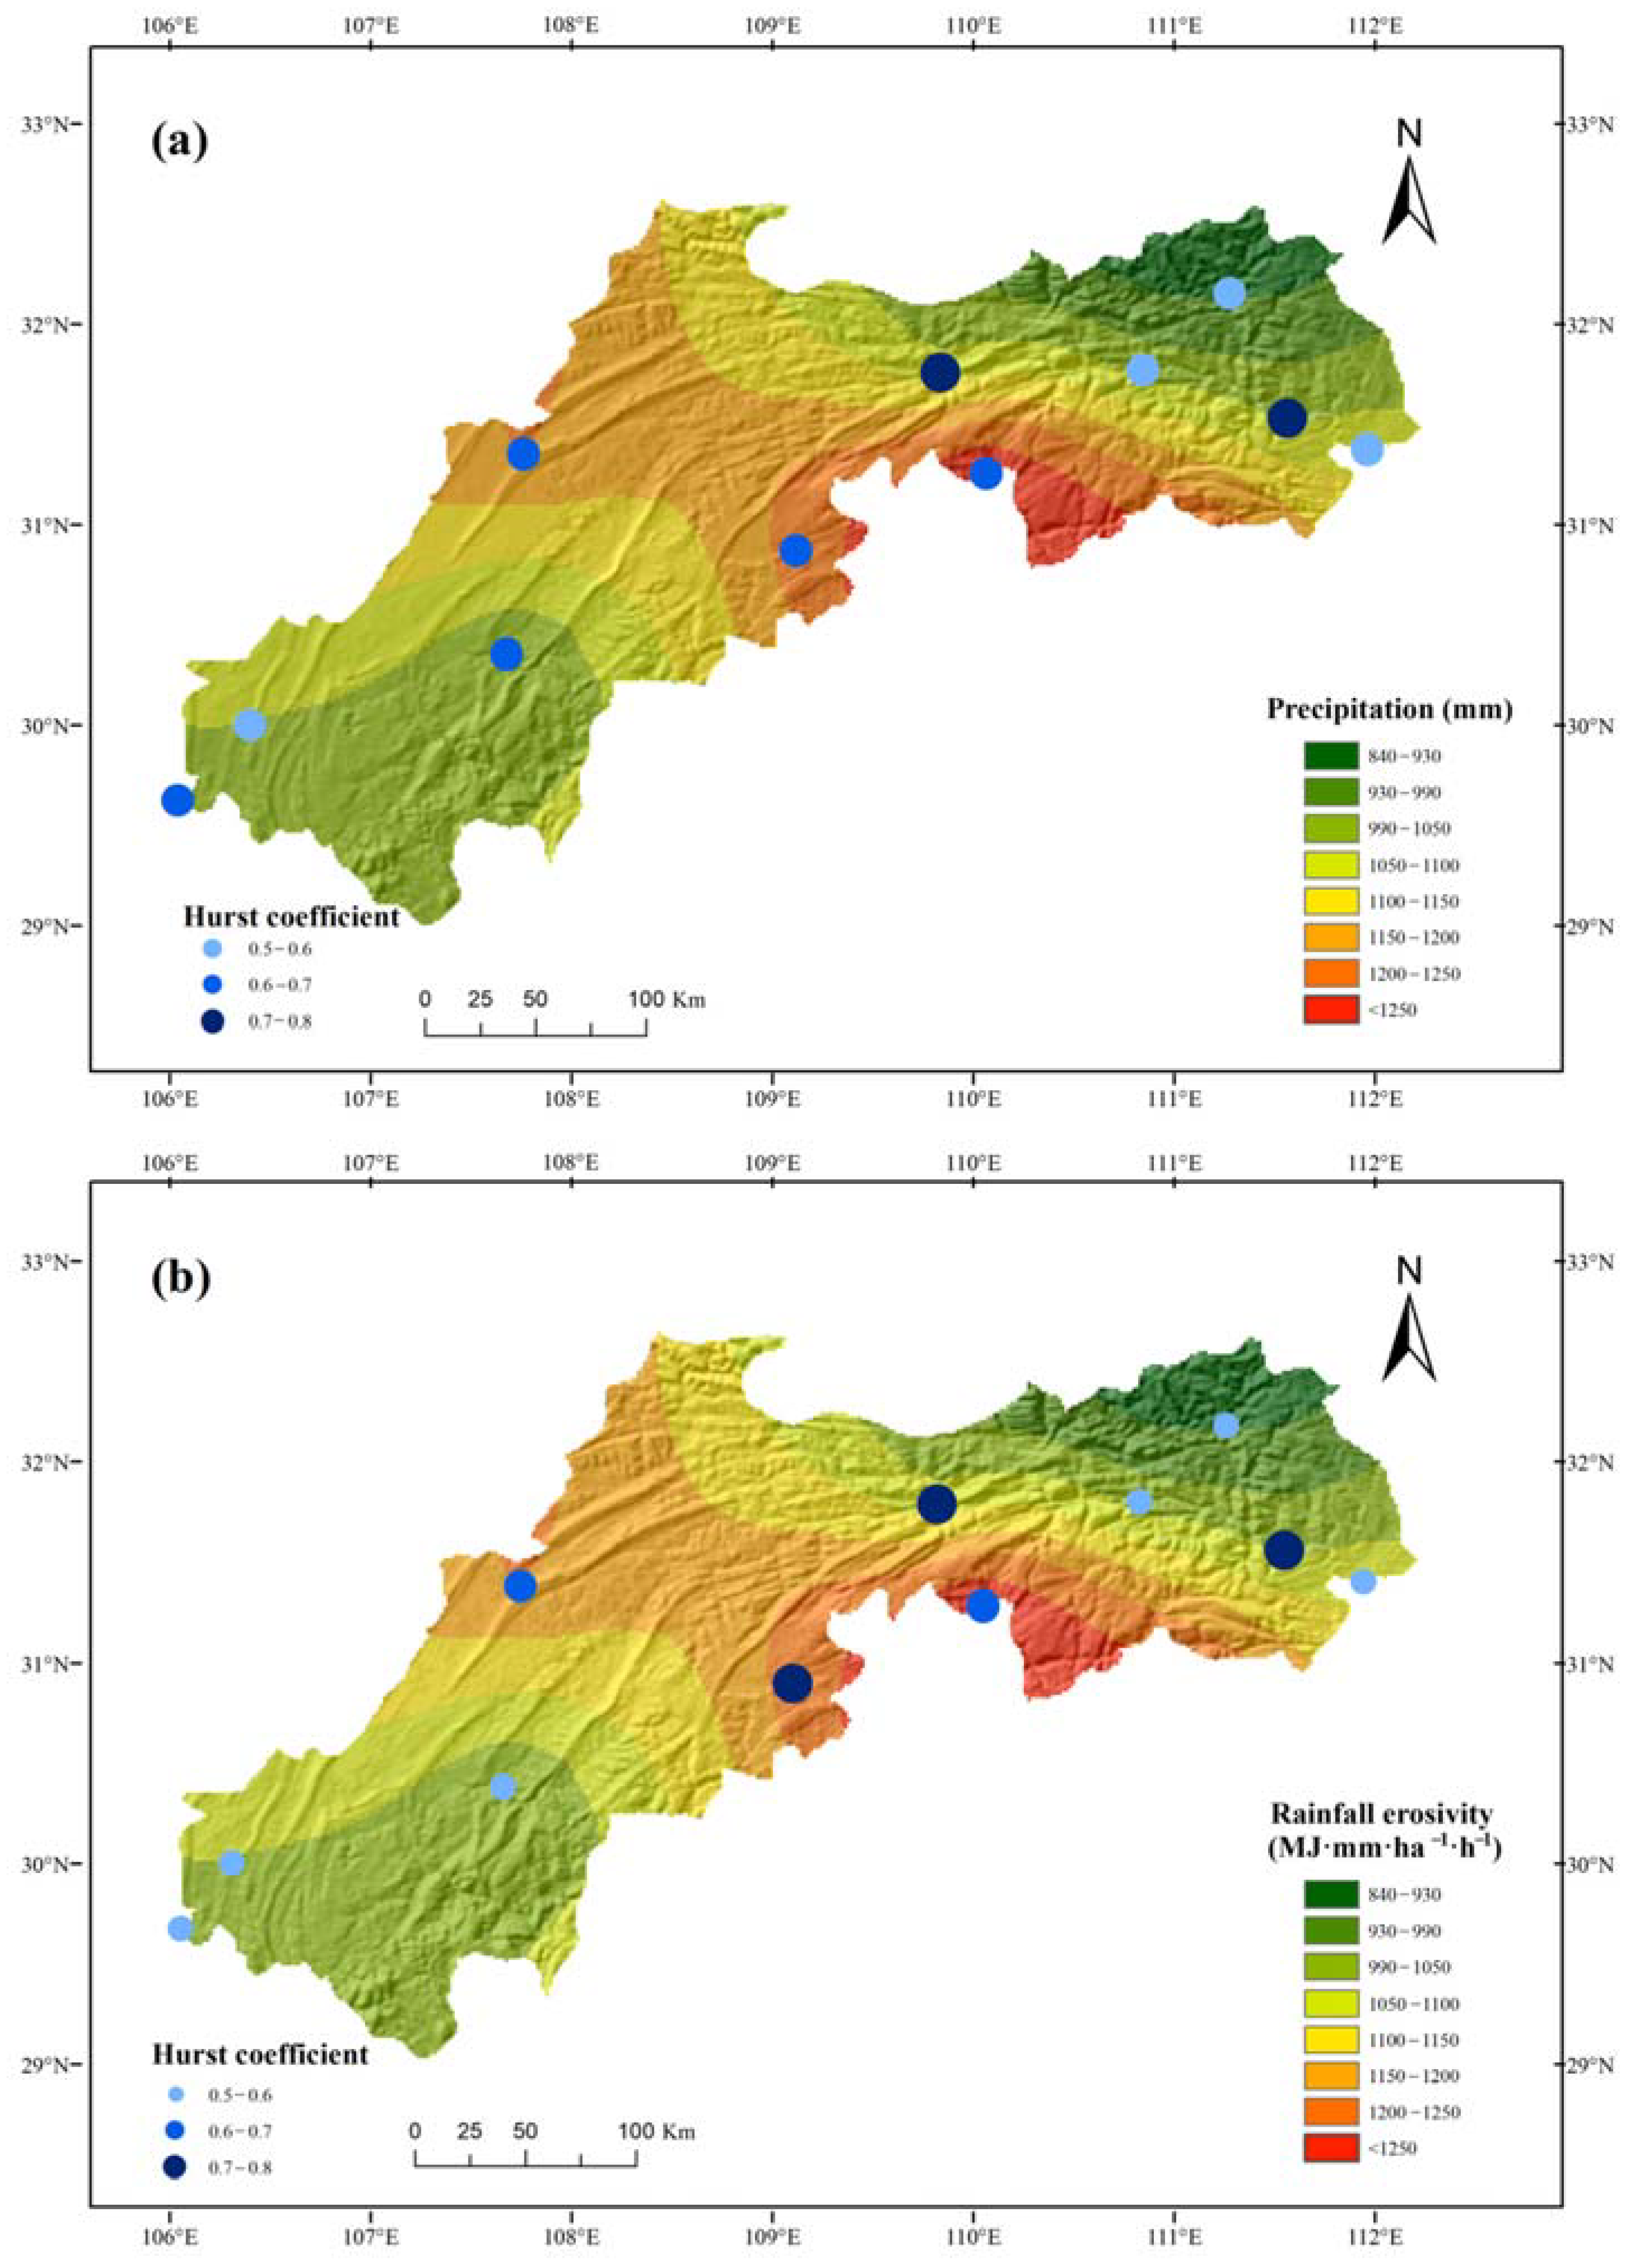
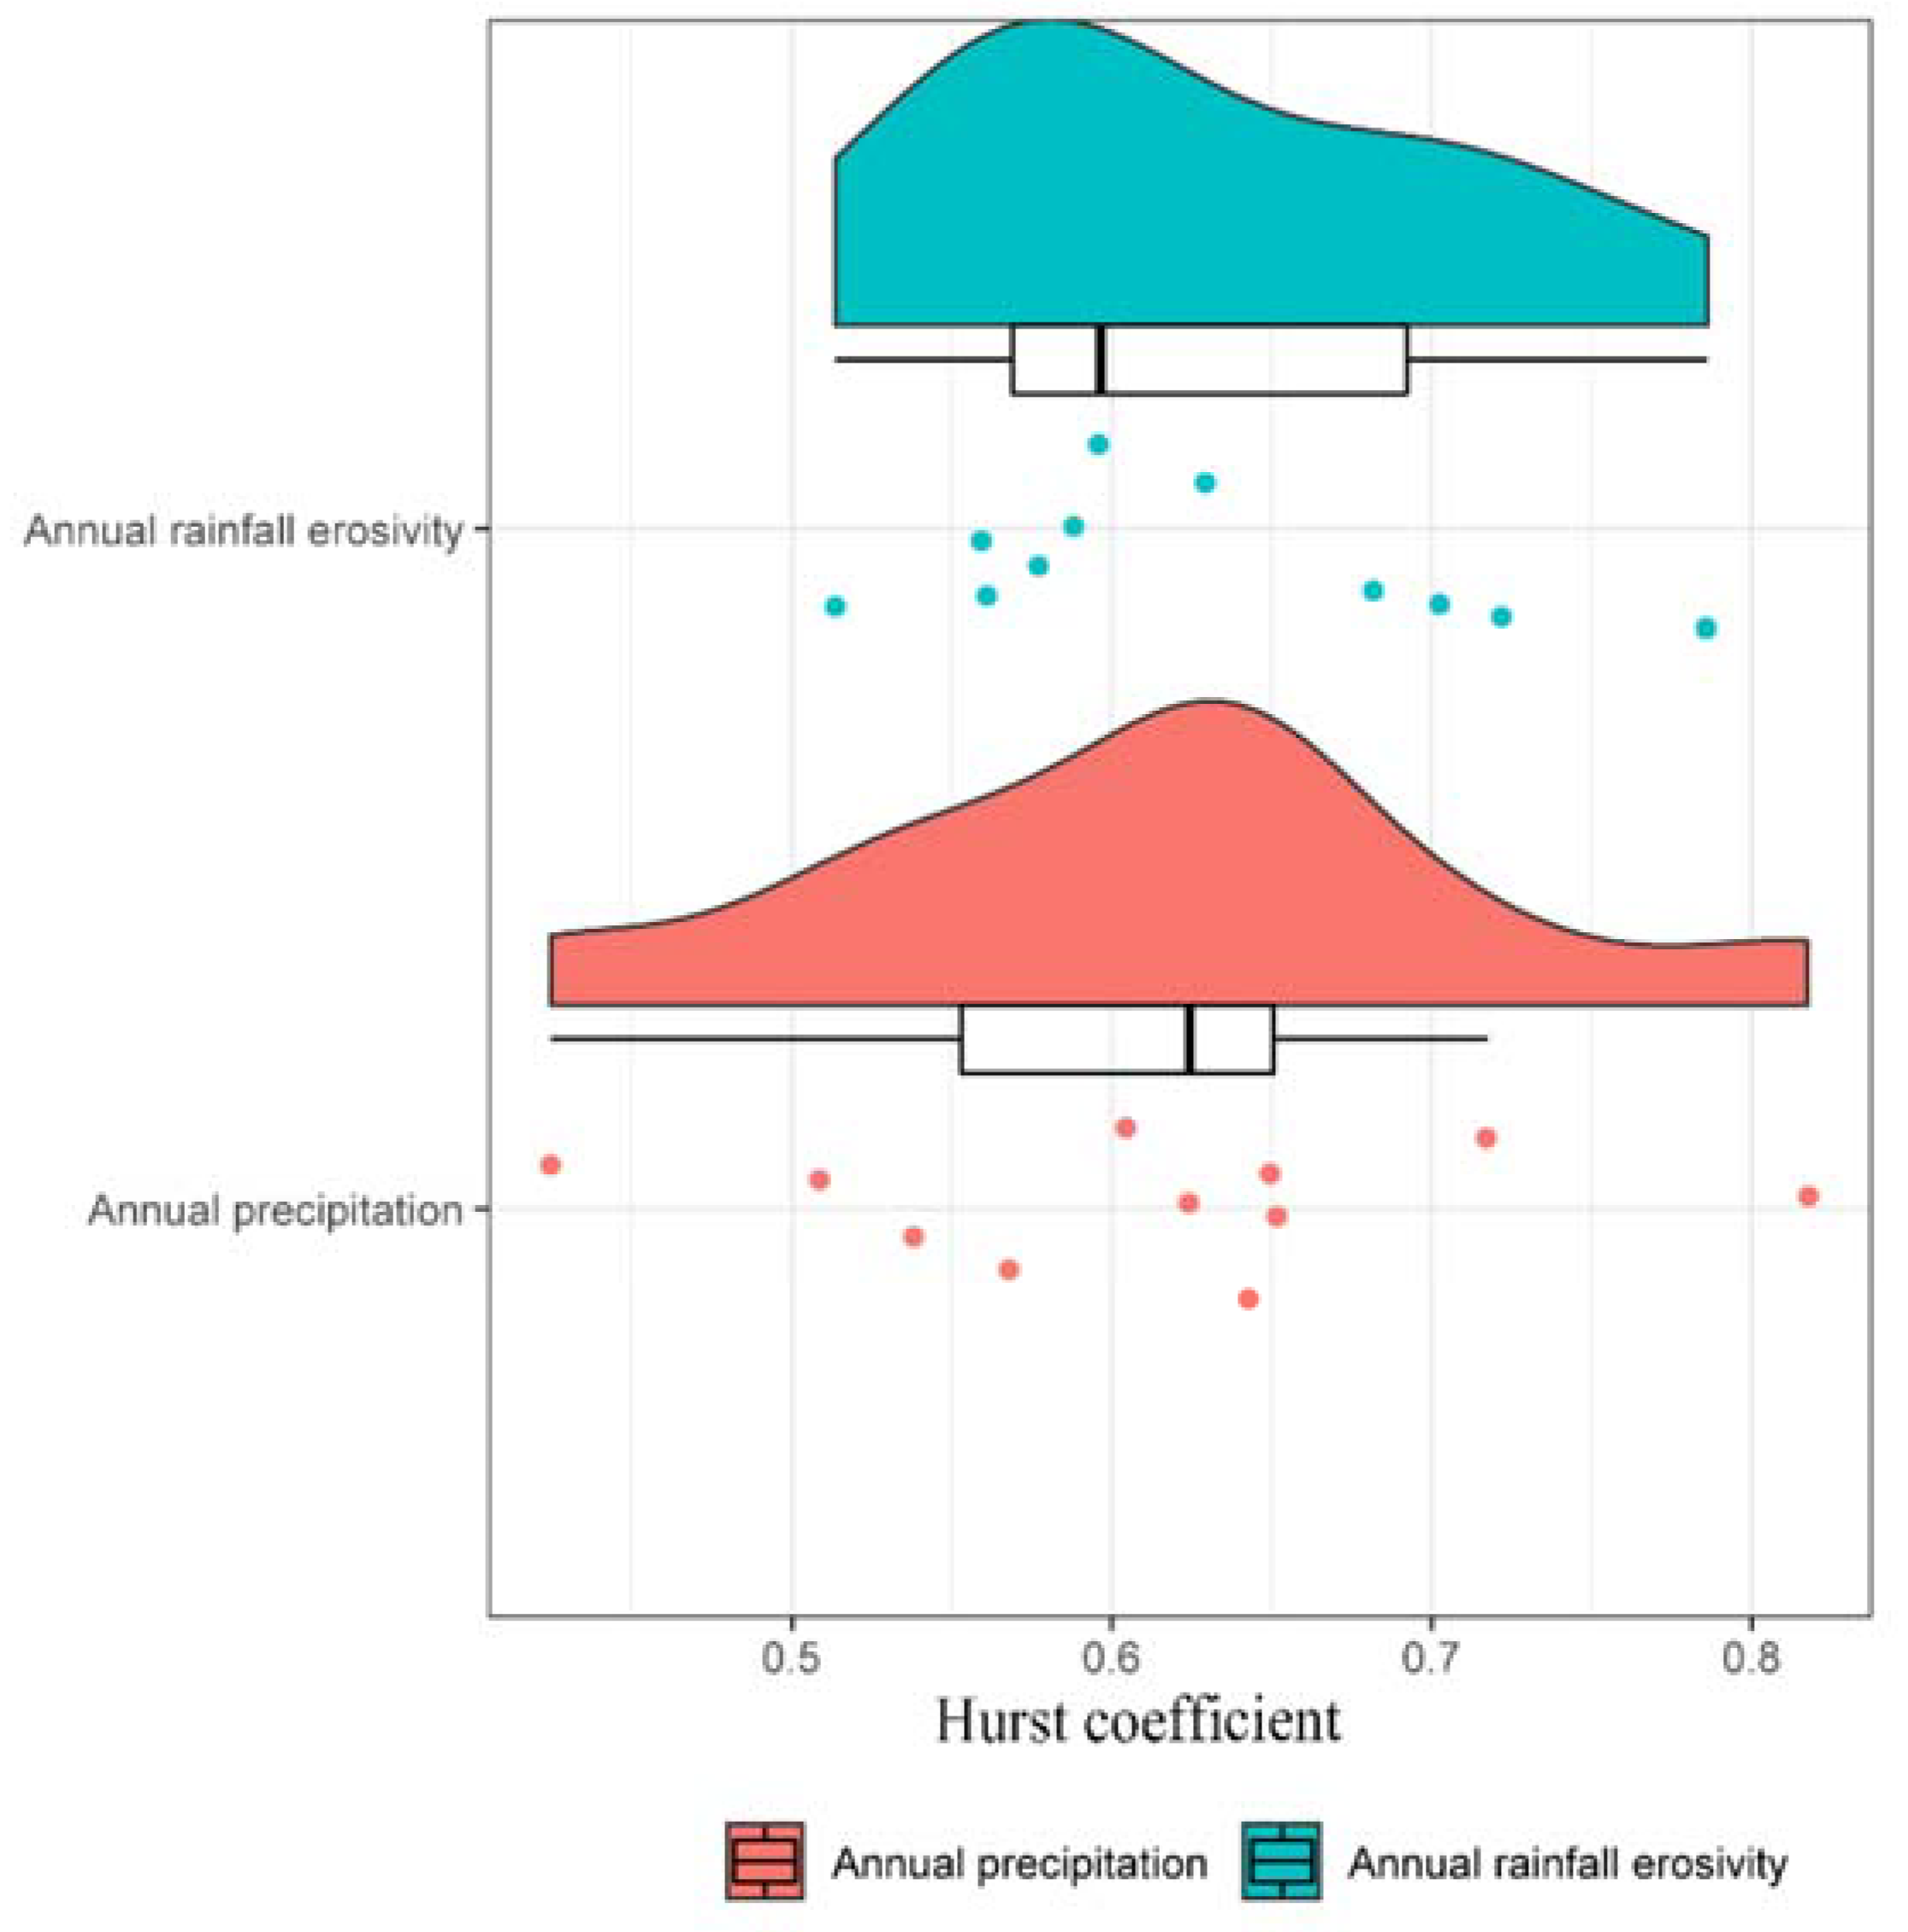
- The distribution of average annual rainfall erosivity showed a pattern of low ends and a high middle from the northeast to southwest TGR. The values of the Hurst coefficient showed no significant variation in annual rainfall erosivity time series for 7 stations, 63.6% of all 11 stations in the TGR, with 2 stations (Lichuan and Jianshi) having weak variation and 2 stations (Zigui and Fengjie) having strong variation.
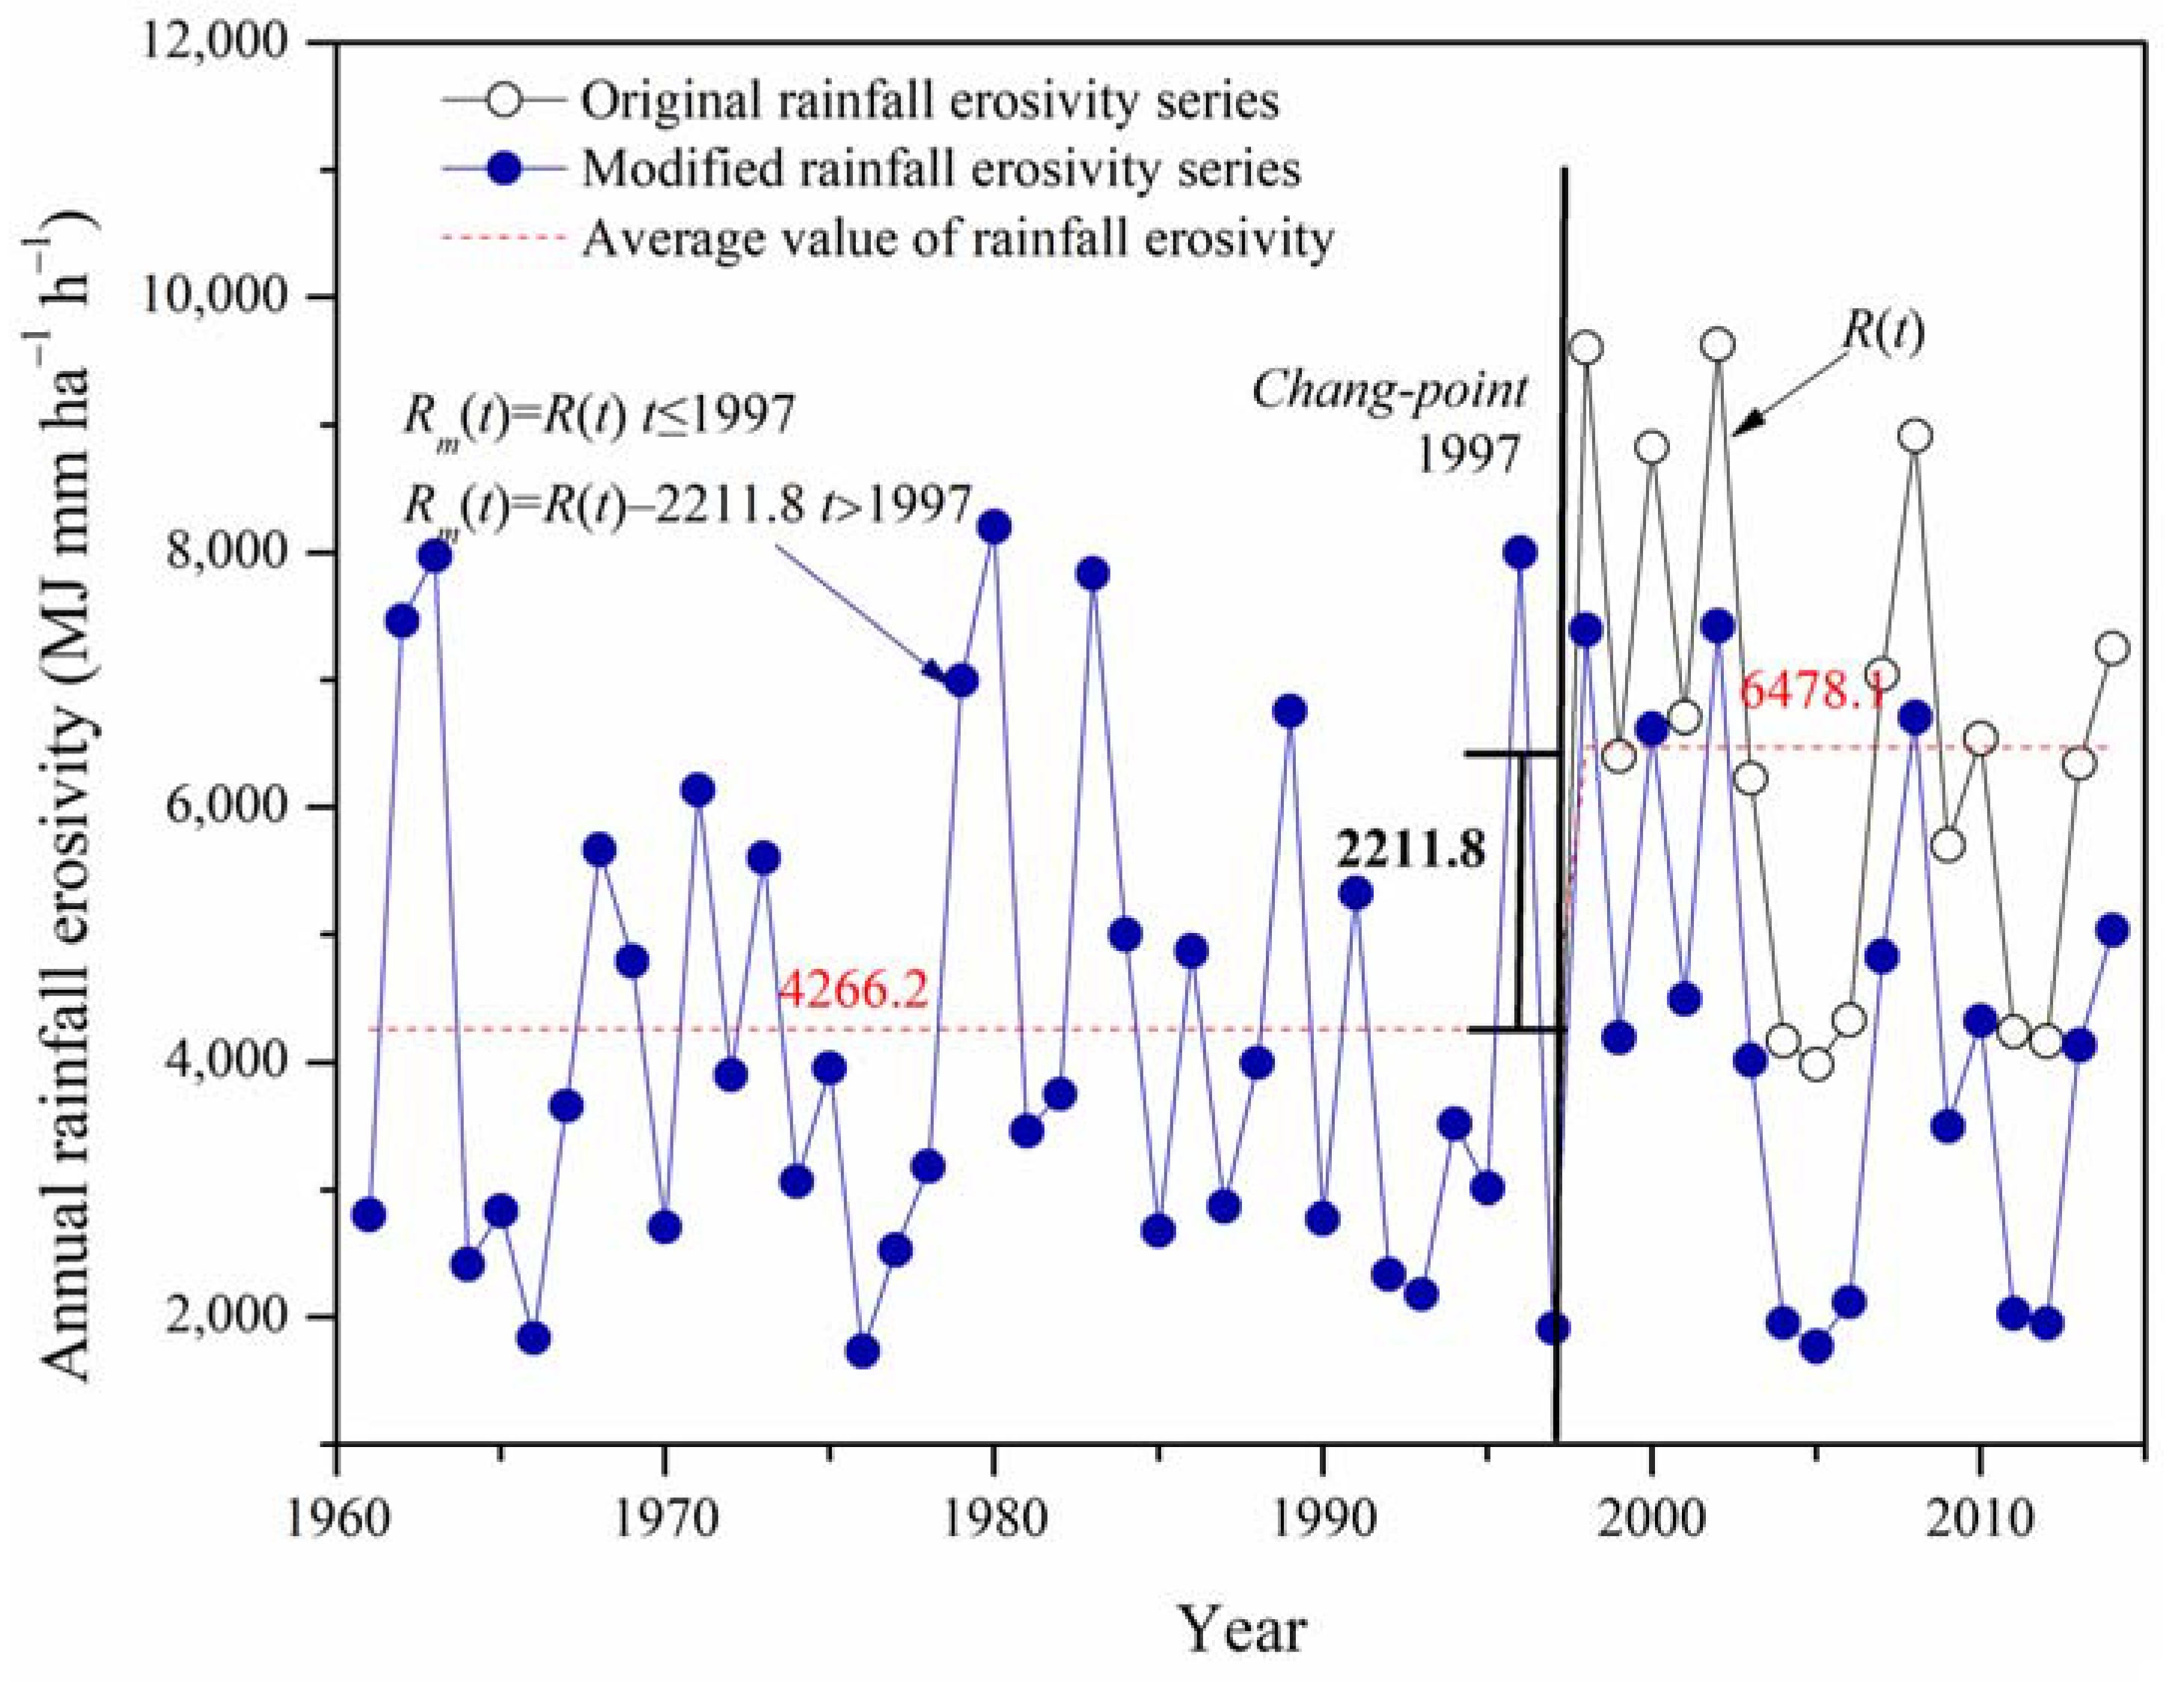
- An increasing trend and an upward change point in rainfall erosivity were observed in Zigui using traditional methods. However, after the upward change point was deducted from the annual rainfall erosivity series R(t), the resultant Rm(t) showed no statistically significant trend. This finding revealed that trend tests were performed separately from abrupt change tests to assess the long-term changes in rainfall erosivity series, which may lead to the wrong conclusion. In addition, the abrupt changes detected in the Rm(t) series varied with the methods.
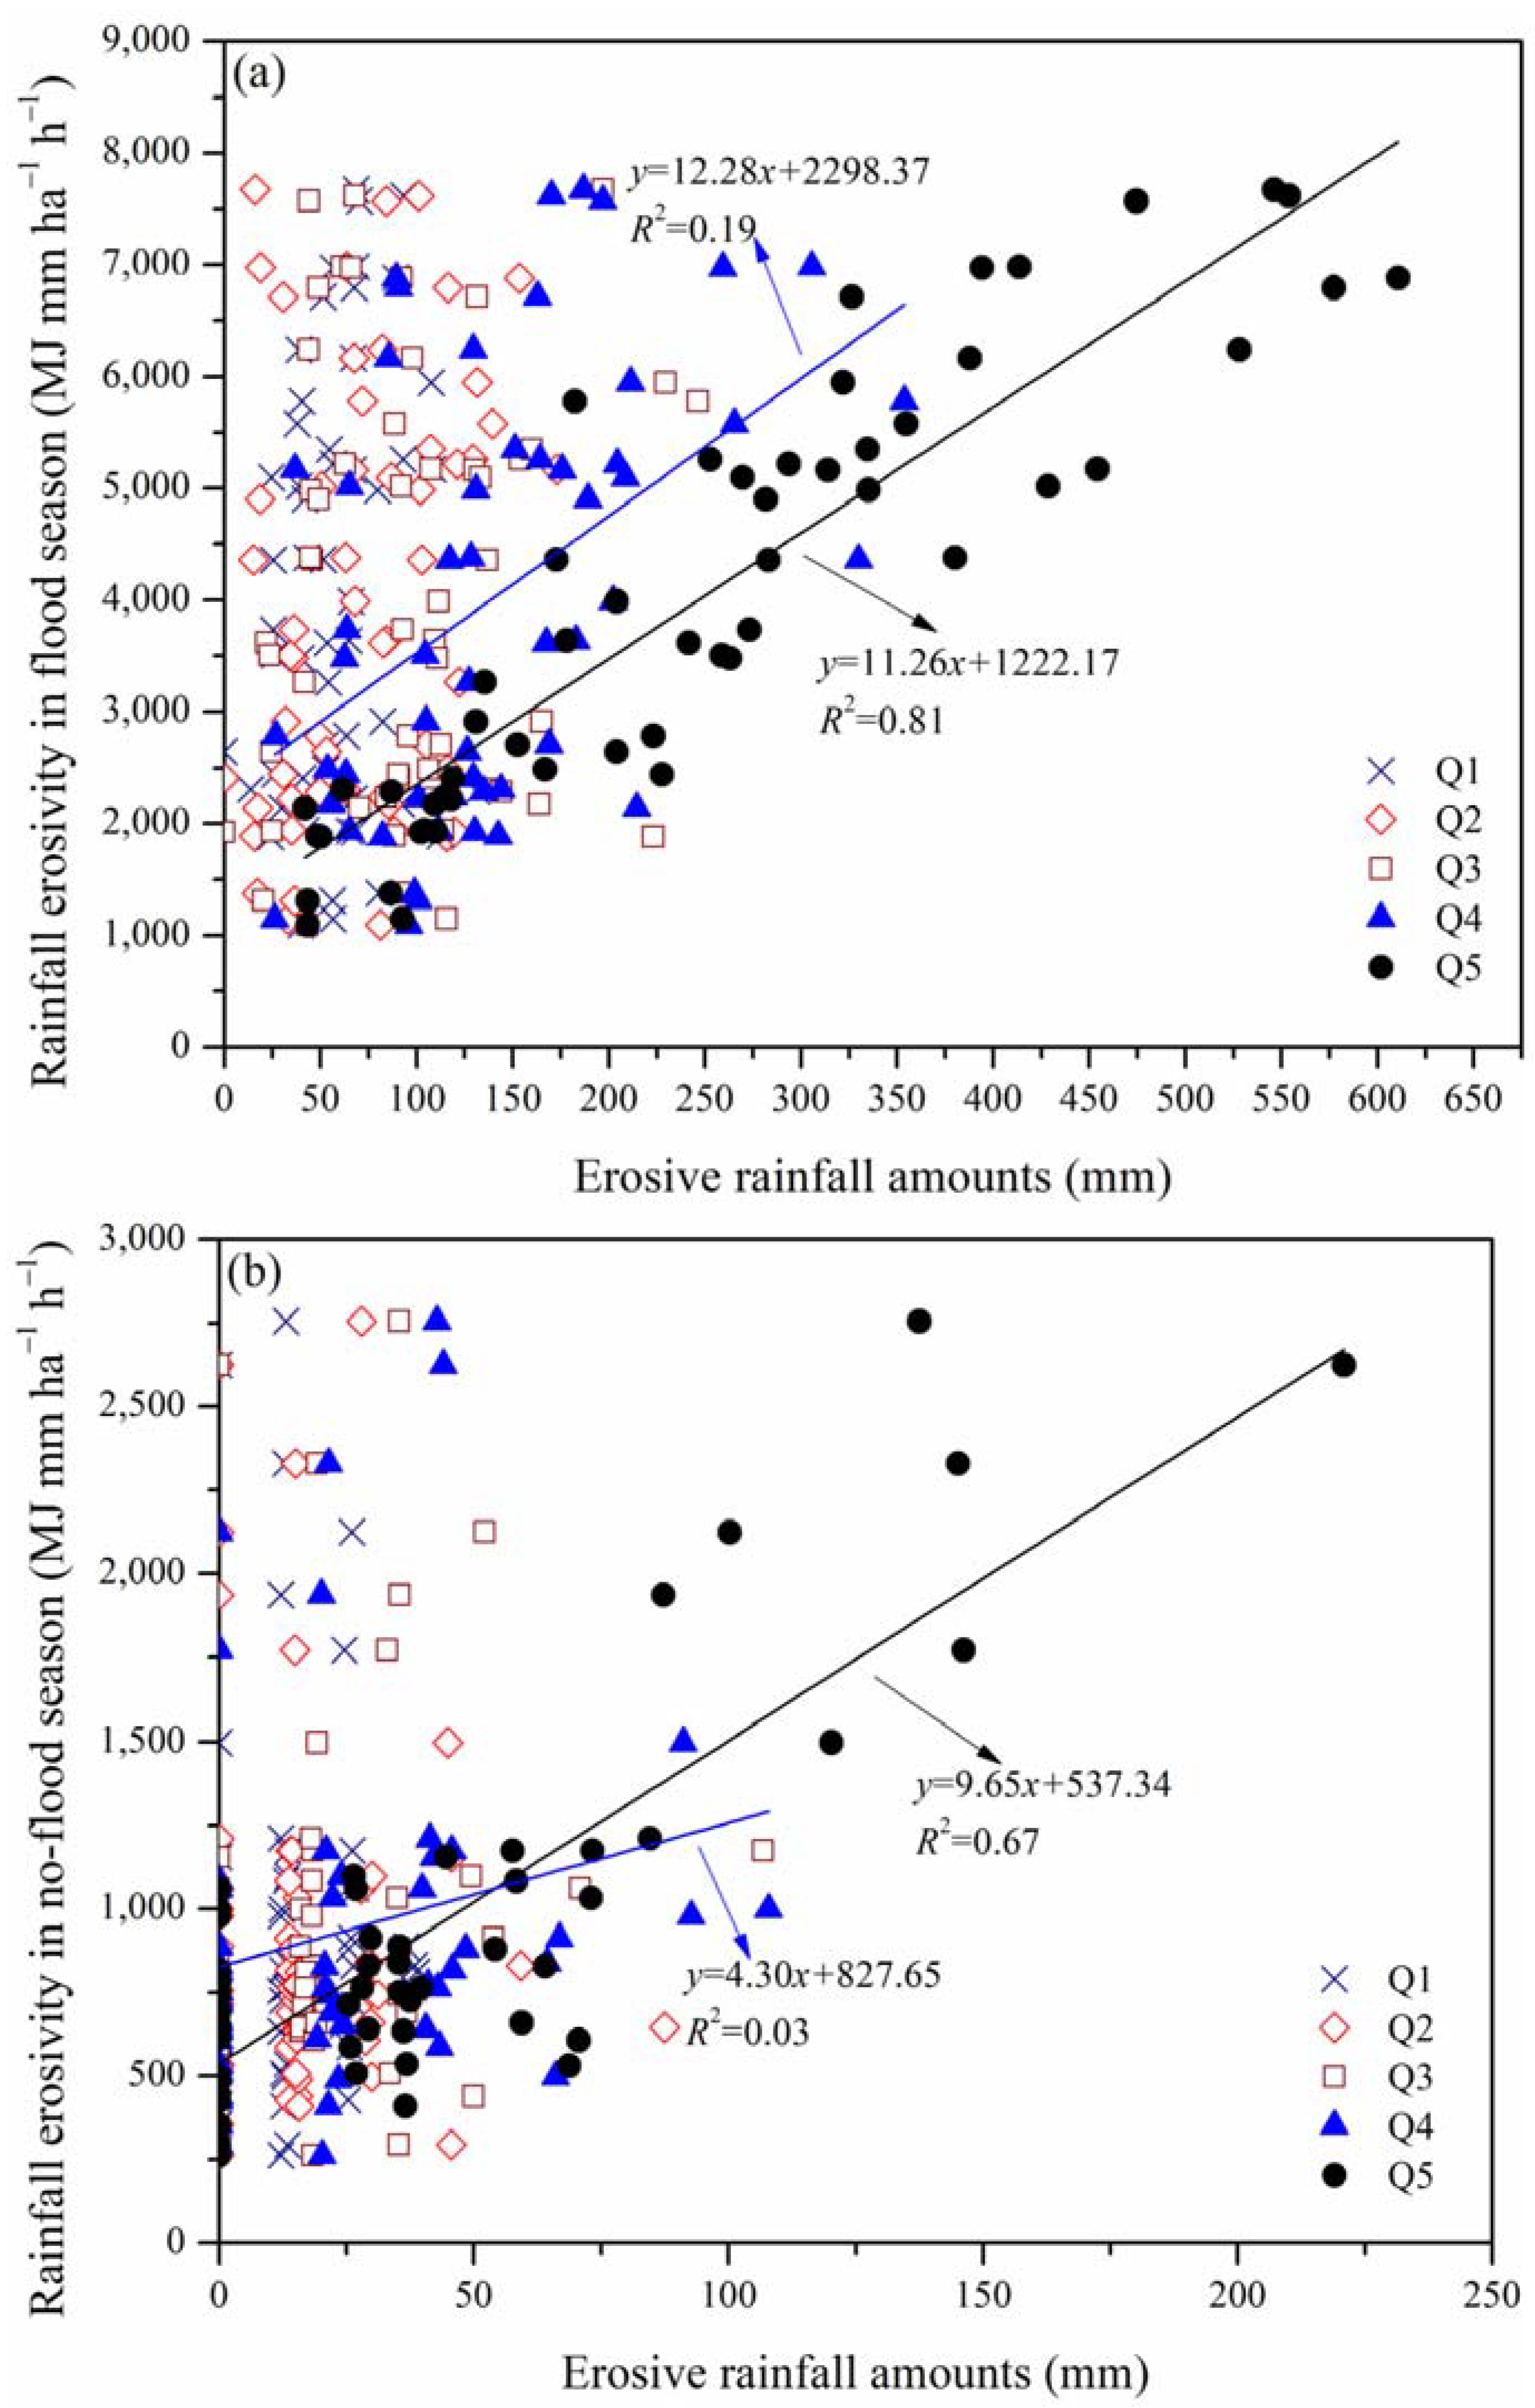
- At Zigui station, a significant linear relationship between rainfall erosivity and Q5 was found in both flood and no-flood seasons. The increase in heavy precipitation with a high intensity and long duration led to variations in rainfall erosivity.
Author Contributions
Funding
Institutional Review Board Statement
Informed Consent Statement
Data Availability Statement
Conflicts of Interest
References
- Donat, M.G.; Alexander, L.V.; Yang, H. Global land-based datasets for monitoring climatic extremes. Bull. Am. Meteorol. Soc. 2013, 94, 997–1006. [Google Scholar] [CrossRef]
- Cao, L.; Pan, S. Changes in precipitation extremes over the “Three-River Headwaters” region, hinterland of the Tibetan Plateau, during 1960–2012. Quat. Int. 2014, 321, 105–115. [Google Scholar] [CrossRef]
- Eekhout, J.; Vente, J.D. Global impact of climate change on soil erosion and potential for adaptation through soil conservation. Earth-Sci. Rev. 2022, 226, 103921. [Google Scholar] [CrossRef]
- Wischmeier, W.H.; Smith, D.D. Predicting Rainfall Erosion Losses: A Guide to Conservation Planning; U.S. Department of Agriculture: Washington, DC, USA, 1978. [Google Scholar]
- Renard, K.G.; Foster, G.R.; Weesies, G.A.; McCool, D.; Yoder, D. Predicting Soil Erosion by Water: A Guide to Conservation Planning With the Revised Universal Soil Loss Equation (RUSLE); U.S. Department of Agriculture: Washington, DC, USA, 1997. [Google Scholar]
- Nearing, M.A.; Yin, S.Q.; Borrelli, P.; Polyakov, V.O. Rainfall erosivity: An historical review. Catena 2017, 157, 357–362. [Google Scholar] [CrossRef]
- Fu, B.J.; Wu, B.F.; Lu, Y.H.; Xu, Z.H.; Cao, J.H.; Dong, N.; Yang, G.S.; Zhou, Y.M. Three Gores Project: Efforts and challenges for the environment. Prog. Phys. Geogr. 2010, 34, 741–754. [Google Scholar] [CrossRef]
- Liu, H.; Zhang, G.; Zhang, P.; Zhu, S. Spatial Distribution and Temporal Trends of Rainfall Erosivity in Three Gorges Reservoir Area of China. Math. Probl. Eng. 2020, 1–15. [Google Scholar] [CrossRef]
- Nunes, A.N.; Lourenço, L.; Vieira, A.; Bento-Gonçalves, A. Precipitation and Erosivity in Southern Portugal: Seasonal Variability and Trends (1950–2008). Land Degrad. Dev. 2013, 27, 211–222. [Google Scholar] [CrossRef]
- Fenta, A.A.; Yasuda, H.; Shimizu, K.; Haregeweyn, N.; Kawai, T.; Sultan, D.; Ebabu, K.; Belay, A.S. Spatial distribution and temporal trends of rainfall and erosivity in the Eastern Africa region. Hydrol. Process. 2017, 31, 4555–4567. [Google Scholar] [CrossRef]
- Wang, Y.; Cheng, C.; Xie, Y.; Liu, B.; Yin, S.; Liu, Y.; Hao, Y. Increasing trends in rainfall-runoff erosivity in the Source Region of the Three Rivers, 1961–2012. Sci. Total. Environ. 2017, 592, 639–648. [Google Scholar] [CrossRef]
- Qin, W.; Guo, Q.G.; Zuo, C.Q.; Shan, Z.J.; Ma, L.; Sun, G. Spatial distribution and temporal trends of rainfall erosivity in mainland China for 1951–2010. Catena 2016, 147, 177–186. [Google Scholar] [CrossRef]
- Gu, Z.J.; Duan, X.W.; Liu, B.; Hu, J.M.; He, J.N. The spatial distribution and temporal variation of rainfall erosivity in the Yunnan Plateau, Southwest China: 1960–2012. Catena 2016, 145, 291–300. [Google Scholar]
- Jackson, F.L.; Hannah, D.M.; Fryer, R.J.; Millar, C.P.; Malcolm, I.A. Development of spatial regression models for predicting summer river temperatures from landscape characteristics: Implications for land and fisheries management. Hydrol. Process. 2017, 31, 1225–1238. [Google Scholar] [CrossRef]
- Joshi, M.K.; Pandey, A.C. Trend and spectral analysis of rainfall over India during 1901–2000. J. Geophys. Res. Atmos. 2011, 116, D06104. [Google Scholar] [CrossRef]
- Huang, S.; Chang, J.; Huang, Q.; Wang, Y.; Chen, Y. Spatio-Temporal Changes in Potential Evaporation Based on Entropy Across the Wei River Basin. Water Resour. Manag. 2014, 28, 4599–4613. [Google Scholar] [CrossRef]
- Shang, X.; Wang, D.; Singh, V.P.; Wang, Y.; Wu, J.; Liu, J.; Zou, Y.; He, R. Effect of Uncertainty in Historical Data on Flood Frequency Analysis Using Bayesian Method. J. Hydrol. Eng. 2021, 26, 04021011. [Google Scholar] [CrossRef]
- Zuo, D.; Xu, Z.; Yang, H.; Liu, X. Spatiotemporal variations and abrupt changes of potential evapotranspiration and its sensitivity to key meteorological variables in the Wei River basin, China. Hydrol. Process. 2011, 26, 1149–1160. [Google Scholar] [CrossRef]
- Lü, M.Q.; Jiang, Y.; Chen, X.L.; Chen, J.L.; Wu, S.J.; Liu, J. Spatiotemporal Variations of Extreme Precipitation under a Changing Climate in the Three Gorges Reservoir Area (TGRA). Atmosphere 2018, 9, 24. [Google Scholar] [CrossRef]
- Lloyd, C.E.M.; Freer, J.E.; Collins, A.L.; Johnes, P.J.; Jones, J.I. Methods for detecting change in hydrochemical time series in response to targeted pollutant mitigation in river catchments. J. Hydrol. 2014, 514, 297–312. [Google Scholar] [CrossRef]
- Turner, J.; Lu, H.; White, I.; King, J.C.; Phillips, T.; Hosking, J.S.; Bracegirdle, T.; Marshall, G.J.; Mulvaney, R.; Deb, P. Absence of 21st century warming on Antarctic Peninsula consistent with natural variability. Nature 2016, 535, 411–415. [Google Scholar] [CrossRef]
- Xie, P.; Gu, H.T.; Sang, Y.F.; Wu, Z.Y.; Singh, V.P. Comparison of different methods for detecting change points in hydroclimatic time series. J. Hydrol. 2019, 577, 123973. [Google Scholar] [CrossRef]
- Jo, S.; Kim, G.; Jeon, J.-J. Bayesian analysis to detect abrupt changes in extreme hydrological processes. J. Hydrol. 2016, 538, 63–70. [Google Scholar] [CrossRef]
- Gocic, M.; Trajkovic, S. Analysis of changes in meteorological variables using Mann-Kendall and Sen’s slope estimator statistical tests in Serbia. Glob. Planet. Change 2013, 100, 172–182. [Google Scholar] [CrossRef]
- Shoemaker, L.H. Fixing the F test for equal variances. Am. Stat. 2003, 57, 105–114. [Google Scholar] [CrossRef]
- Geisser, S. Testing Hypotheses. In Modes of Parametric Statistical Inference; Shewhart, W.A., Wilks, S.S., Geisser, S., Eds.; John Wiley & Sons: Hoboken, NJ, USA, 2006. [Google Scholar]
- Kendall, M.; Stuart, A.; Ord, K.J.; Arnold, S. Kendall’s Advanced Theory of Statistics: Volume 2A-Classical Inference and the Linear Model (Kendall’s Library of Statistics), 6th ed.; Hodder Arnold Publication: London, UK, 1999. [Google Scholar]
- Lee, A.F.; Heghinian, S.M. A shift of the mean level in a sequence of independent normal random variables: A Bayesian approach. Technometrics 1977, 19, 503–506. [Google Scholar]
- Hurst, H.E. Long-Term Storage Capacity of Reservoirs. Trans. Am. Soc. Civ. Eng. 1951, 116, 770–808. [Google Scholar] [CrossRef]
- Xie, P.; Chen, G.C.; Lei, H.F. Hydrological alteration analysis method based on hurst coefficient. J. Basic Sci. Eng. 2009, 17, 3239, (In Chinese with English Abstract). [Google Scholar]
- Murphy, K.R.; Myors, B.; Wolach, A. Statistical Power Analysis: A Simple and General Model for Traditional and Modern Hypothesis Tests; Routledge: New York, NY, USA, 2014; 244p. [Google Scholar]
- Ye, C.; Chen, C.; Butler, O.M.; Rashti, M.R.; Esfandbod, M.; Du, M.; Zhang, Q. Spatial and temporal dynamics of nutrients in riparian soils after nine years of operation of the Three Gorges Reservoir, China. Sci. Total. Environ. 2019, 664, 841–850. [Google Scholar] [CrossRef] [PubMed]
- Wu, J.G.; Huang, J.H.; Han, X.G.; Gao, X.M.; He, F.L.; Jiang, M.X.; Jiang, Z.G.; Primack, R.B.; Shen, Z.H. The Three Gorges Dam: An ecological perspective. Front. Ecol. Environ. 2004, 2, 241–248. [Google Scholar] [CrossRef]
- Zhang, W.B.; Xie, Y.; Liu, B.Y. Rainfall erosivity estimation using daily rainfall amounts. Sci. Geogr. Sin. 2004, 22, 705–711, (In Chinese with English Abstract). [Google Scholar]
- Richardson, C.W.; Foster, G.R.; Wright, D.A. Estimation of Erosion Index from Daily Rainfall Amount. Trans. ASAE 1983, 26, 153–156. [Google Scholar] [CrossRef]
- Xie, Y.; Liu, B.Y.; Nearing, M.A. Practical Thresholds for Separating Erosive and Non-Erosive Storms. Trans. ASAE 2002, 45, 1843–1847. [Google Scholar] [CrossRef]
- Yevjevich, V.H. Stochastic Processes in Hydrology; Water Resources Publications: Littleton, CO, USA, 1972. [Google Scholar]
- Xiong, L.H.; Guo, S.L. Trend test and change-point detection for the annual discharge series of the Yangtze River at the Yichang hydrological station. Hydrol. Sci. J. 2004, 49, 99–112. [Google Scholar] [CrossRef]
- Zhang, Y.; Chao, Y.; Fan, R.; Ren, F.; Qi, B.; Ji, K.; Xu, B. Spatial-temporal trends of rainfall erosivity and its implication for sustainable agriculture in the Wei River Basin of China. Agric. Water Manag. 2020, 106557. [Google Scholar] [CrossRef]
- Panagos, P.; Ballabio, C.; Borrelli, P.; Meusburger, K.; Klik, A.; Rousseva, S.; Tadić, M.P.; Michaelides, S.; Hrabalíková, M.; Olsen, P.; et al. Rainfall erosivity in Europe. Sci. Total. Environ. 2015, 511, 801–814. [Google Scholar] [CrossRef] [PubMed]
- Shin, J.-Y.; Kim, T.; Heo, J.-H.; Lee, J.-H. Spatial and temporal variations in rainfall erosivity and erosivity density in South Korea. Catena 2019, 176, 125–144. [Google Scholar] [CrossRef]
- Yigzaw, W.; Hossain, F.; Kalyanapu, A. Impact of Artificial Reservoir Size and Land Use/Land Cover Patterns on Probable Maximum Precipitation and Flood: Case of Folsom Dam on the American River. J. Hydrol. Eng. 2013, 18, 1180–1190. [Google Scholar] [CrossRef]
- Wu, L.; Zhang, Q.; Jiang, Z. Three Gorges Dam affects regional precipitation. Geophys. Res. Lett. 2006, 331, 338–345. [Google Scholar] [CrossRef]
- Niyogi, D.; Kishtawal, C.; Tripathi, S.; Govindaraju, R. Observational evidence that agricultural intensification and land use change may be reducing the Indian summer monsoon rainfall. Water Resour. Res. 2010, 46, 91–103. [Google Scholar] [CrossRef]
- Hossain, F.; Jeyachandran, I.; Pielke, R. Have Large Dams Altered Extreme Precipitation Patterns? Eos 2009, 90, 453–454. [Google Scholar] [CrossRef]
- Ziadat, F.M.; Taimeh, A.Y. Effect of rainfall intensity, slope, land use and antecedent soil moisture on soil erosion in an arid environment. Land Degrad. Develop. 2013, 24, 582–590. [Google Scholar] [CrossRef]


| Correlation Coefficient r(t) | Hurst Coefficient H | Significance Level |
|---|---|---|
| 0 ≤ r(t) < r95% | 0.5 ≤ H <0.673 | None |
| r95% ≤ r(t) < r99% | 0.673 ≤ H <0.717 | Medium |
| r99% ≤ r(t) ≤ 1.0 | 0.717 ≤ H ≤ 1.0 | High |
| Correlation Coefficient r | Significance Level |
|---|---|
| 0≤ |r| <r95% | None trend |
| r95% ≤ |r| < r99% | Medium trend |
| r99% ≤ |r| ≤ 1.0 | High trend |
| Correlation Coefficient r | Significance Level |
|---|---|
| 0 ≤ |r| < r95% | No abrupt change |
| r95% ≤ |r| < r99% | Medium abrupt change |
| r99% ≤ |r| ≤ 1.0 | High abrupt change |
| Station | E | P | R | Station | E | P | R |
|---|---|---|---|---|---|---|---|
| Shapingba a | 259.6 | 1056.9 | 5146.0 | Hechuan b | 231.2 | 1089.9 | 5454.3 |
| Jiangjin a | 256.3 | 986.6 | 4266.1 | Jinfoushan b | 1905.9 | 1021.7 | 4256.5 |
| Fengdu a | 290.4 | 1001.3 | 4200.5 | Wanyuan b | 674.0 | 1215.1 | 8758.5 |
| Liangping a | 454.5 | 1237.1 | 5783.6 | Zhenping b | 995.8 | 972.4 | 4157.9 |
| Lichuan a | 1074.1 | 1237.1 | 5783.6 | Fangxian b | 426.9 | 785.1 | 2728.9 |
| Fengjie a | 299.8 | 1069.9 | 5517.7 | Jingzhou b | 31.8 | 1026.3 | 5534.8 |
| Jianshi a | 609.2 | 1359.4 | 8331.9 | Wufeng b | 619.9 | 1300.6 | 7220.7 |
| Badong a | 334.0 | 1030.9 | 5121.3 | Enshi b | 457.1 | 1383.2 | 8067.7 |
| Xingshan a | 336.8 | 932.6 | 4075.6 | Laifeng b | 502.8 | 1286.4 | 6892.8 |
| Zigui a | 295.5 | 1038.7 | 4962.5 | Qianjiang b | 786.9 | 1138.3 | 5323.7 |
| Yicang a | 256.5 | 1086.4 | 5749.8 | Youyang b | 826.5 | 1298.2 | 6876.9 |
| Mean a | 406.1 | 1094.2 | 5358.1 | ||||
| Standard deviation a | 234.1 | 123.1 | 1120.8 |
| Flood Season (mm) | No-Flood Season (mm) | |||||||||
|---|---|---|---|---|---|---|---|---|---|---|
| Statistics | 20% | 40% | 60% | 80% | Max | 20% | 40% | 60% | 80% | Max |
| Median of each criteria | 15.1 | 19.2 | 25.3 | 41.0 | 192.3 | 13.5 | 15.7 | 19.2 | 24.9 | 93.3 |
| Standard deviation of each criteria | 0.2 | 0.5 | 1.1 | 2.7 | 34.6 | 0.4 | 0.5 | 0.9 | 0.8 | 16.5 |
| Time Series | Detection of Temporal Variations | Methods | Results | Hurst/Correlation Coefficient | Comprehensive Results | Classification of Temporal Variations |
|---|---|---|---|---|---|---|
| R(t) | Preliminary test | Hurst coefficient | + | 0.785 | + | High |
| Trend change | Spearman | + | 0.317 | + | Weak trend change | |
| Kendall | + | |||||
| Abrupt change | Moving t test | 1997 (+) | 0.470 | 1997 (+) ↑ | High abrupt change | |
| Mann-kendall | 1997 (+) | |||||
| Bayesian | 1997 (+) |
| Time Series | Detection of Temporal Variations | Methods | Results | Hurst/Correlation Coefficient | Comprehensive Results | Classification of Temporal Variations |
|---|---|---|---|---|---|---|
| Rm(t) | Trend change | Spearman | - | - | - | Not significant |
| Kendall | - | |||||
| Abrupt change | Moving t test | 1963 (−) | 0.228 | Not significant | ||
| Mann-kendall | 1978 (−) | 0.091 | - | |||
| Bayesian | 1963 (−) | 0.228 |
Disclaimer/Publisher’s Note: The statements, opinions and data contained in all publications are solely those of the individual author(s) and contributor(s) and not of MDPI and/or the editor(s). MDPI and/or the editor(s) disclaim responsibility for any injury to people or property resulting from any ideas, methods, instructions or products referred to in the content. |
© 2023 by the authors. Licensee MDPI, Basel, Switzerland. This article is an open access article distributed under the terms and conditions of the Creative Commons Attribution (CC BY) license (https://creativecommons.org/licenses/by/4.0/).
Share and Cite
Feng, Q.; Dong, L.; Liu, J.; Liu, H. Detection Framework of Abrupt Changes and Trends in Rainfall Erosivity in Three Gorges Reservoir, China. Sustainability 2023, 15, 2062. https://doi.org/10.3390/su15032062
Feng Q, Dong L, Liu J, Liu H. Detection Framework of Abrupt Changes and Trends in Rainfall Erosivity in Three Gorges Reservoir, China. Sustainability. 2023; 15(3):2062. https://doi.org/10.3390/su15032062
Chicago/Turabian StyleFeng, Qian, Linyao Dong, Jingjun Liu, and Honghu Liu. 2023. "Detection Framework of Abrupt Changes and Trends in Rainfall Erosivity in Three Gorges Reservoir, China" Sustainability 15, no. 3: 2062. https://doi.org/10.3390/su15032062
APA StyleFeng, Q., Dong, L., Liu, J., & Liu, H. (2023). Detection Framework of Abrupt Changes and Trends in Rainfall Erosivity in Three Gorges Reservoir, China. Sustainability, 15(3), 2062. https://doi.org/10.3390/su15032062